Article

Research on Anti-Frequency Sweeping Jamming Method for Frequency Modulation Continuous Wave Radio Fuze Based on Wavelet Packet Transform Features

Science and Technology on Electromechanical Dynamic Control Laboratory, Beijing Institute of Technology, Beijing 100081, China
*
Author to whom correspondence should be addressed.
Appl. Sci. 2022, 12(17), 8713; https://doi.org/10.3390/app12178713
Submission received: 10 August 2022 / Revised: 28 August 2022 / Accepted: 29 August 2022 / Published: 30 August 2022

Abstract

:
Frequency modulation continuous wave (FMCW) radio fuze is widely used in military equipment, due to its excellent range and anti-jamming ability. However, the widespread use of radio fuze jammers on modern battlefields poses a serious threat to fuzes. In this study, a classification method of targeting and sweeping frequency jamming signals of FMCW radio fuze based on wavelet packet transform features is proposed, which improves the anti-jamming ability of fuze. The wavelet packet transform of the output signal of the radio fuze detector is used to form a feature vector, which is fed into a support vector machine for targeting and jamming signal classification. The experimental results of the measured data show that the proposed method can achieve a high accuracy rate of classification and identification of FMCW radio fuze targets and frequency sweeping jamming signals. The highest recognition accuracy reached is 98.81% ± 0.0037. The lowest false alarm probability is 0.57% ± 0.0043, which indicates its potential application values in the near future.

1. Introduction

Radio fuze is the information equipment at the end of the weapon action process and is the core of the munition damage control. Frequency modulation continuous wave (FMCW) fuze uses the frequency difference between the transmitted signal and the echo signal to determine the distance of the target. The distance measurement does not depend on the amplitude of the echo signal, and compared with the continuous wave Doppler, fuze has the advantages of small scattering of the bursting point, high accuracy of ranging, and high anti-jamming ability, etc. FMCW fuze is widely used in modern weapons due to its accurate ranging and anti-jamming ability [1,2,3,4]. However, with the development of electronic countermeasures technology, the electromagnetic battlefield environment is becoming more and more complex, and radio fuze is facing serious threats, especially frequency sweeping jamming [5,6]. Therefore, improving the FMCW fuze have the ability of anti-frequency sweeping jamming has a direct impact on its maximum effectiveness in the battlefield environment.
A great deal of research was carried out on the anti-jamming of radio fuze. In terms of the research object, anti-jamming research of radio fuze is divided into two main parts, one based on the transmit signal waveform design [7,8,9,10], and the other based on the fuze output beat signal processing [11,12,13,14].
In the areas of transmit signal waveform design, Yue et al. [7] proposed a novel fractional-Fourier-transform (FRFT)-based LFMCW to achieve distance measurement for a collision avoidance detector. The proposed detector information is acquired from the intermediate frequency signal (IFS), which is obtained by mixing the echo signal with the reference carrier signal. The new IFS-based structure transceiver reduces the computation complexity of FRFT by taking advantage of the knowledge of the frequency modulation slope. Chen et al. [8] proposed an anti-jamming method based on harmonic coefficient amplitude average, in order to improve the anti-sweeping frequency jamming performance of the chaotic codes phase modulation and linear frequency modulation (CCPM–LFM) hybrid modulation radio fuze. This method uses a fast Fourier transform algorithm to extract the harmonic envelope and averages the amplitude of the harmonic coefficients obtained from multiple FFT, making full use of the random and statistical properties of chaotic codes to suppress jamming. Qiao et al. [9] proposed an anti-DRFM-jamming method based on the averaging of the range side lobes, and the binary-phase-coded chirp waveform, which is aperiodic in design. The chaotic codes vary with the linear frequency modulation period to make the binary-phase-coded chirp waveforms aperiodic, and the range side lobes are used to suppress the influence of the DRFM. Akhtar [10] developed radar signaling to combat the impact of the repeat jammers on the radar system. Robustness against jammers is achieved by employing the concept of pulse diversity, where the radar, at each pulse repetition interval, emits either a modified version of the previous waveform or a new waveform following a specific orthogonal structure. These methods improve the immunity of the radio fuze to interference, however, improvements to the signal transmission module are required, making the fuze more complex.
In the areas of output beat signal processing, Dai et al. [11] proposed a method for adaptive identification of fuze targets and jamming signals based on the minimal risk Bayesian criterion, by analyzing the time and frequency domain characteristics of the output signal of the fuze filter, the time- and frequency-domain feature spaces of the target signal and the jamming signals are constructed; finally, a risk minimum Bayesian classifier model is built to classify the feature space. Huang et al. [12] proposed a method for classifying and identifying target and jamming signals based on entropy features for amplitude modulation sweeping frequency jamming, which is more difficult to suppress with frequency modulation fuze. The Shannon entropy and singular spectrum entropy of the fuze output signal are extracted, and the target and jamming signals are classified using a support vector machine classifier. Greco et al. [13] aimed at the problem of detecting and classifying radar target and the jamming signal produced by an electronic countermeasure system; the disturbance is modeled as a complex, correlated Gaussian process, and the jamming signal is modeled as a signal belonging to a cone whose axis is the true target signal. Two different approaches are analyzed, based on the adaptive coherent estimator and the generalized likelihood ratio test. Zhu et al. [14] considered the problem of anti-noise amplitude modulation jamming in triangle wave frequency modulation fuze and presented an anti-jamming method based on fractional Fourier transform (FrFt) to suppress the noise amplitude modulation jamming.
The above methods allow an accurate classification of targets and jamming signals within a certain range. However, a common limitation of these methods is that the signal is only processed in the time-or frequency-domain. There is little information available, and when used to classify and identify the most threatening types of jamming on FMCW fuze, the identification accuracy is low and the anti-jamming ability is weak [3,15,16]. Thus, there are still challenges to overcome to improve the ability of FMCW fuze in anti-frequency sweeping jamming.
In this paper, we present a wavelet-packet-based approach to classifying FMCW fuze targets and frequency sweeping jamming signals. Fuze anti-jamming is achieved by classifying and identifying targets and jamming signals. This approach is based on a combination of the output of the FMCW fuze output signal features extraction and machine-learning technologies. First, the output signals of the FMCW fuze under the action of a target and frequency sweeping jamming signals are collected. Second, the signals collected from the actual experiment were analyzed and wavelet packet features were extracted. Finally, based on the results of the feature extraction experiments, features that can significantly distinguish between the target and jamming signals form feature vectors that are fed into a support vector machine classifier for classification and recognition. To the best of our knowledge, this is the first time that wavelet packet features and support vector machines are used to classify targets and jamming signals for radio fuze. The method proposed in this paper is significantly more resistant to jamming than traditional radio fuze anti-sweep methods, and is highly robust, outperforming other methods in terms of recognition accuracy and stability. The experimental results show that the proposed method can achieve a high recognition accuracy.

2. Experimental Setup and Data Collection

2.1. Experimental Scene Setting and Parameter Setting

To verify the effectiveness of the method proposed in this paper, in particular, the accuracy of the classification and identification of the target and frequency sweeping jamming signals, the output signals from the FMCW fuze under target, and different jamming signals action were collected in a microwave darkroom environment. The experimental parameters in this research are set as shown in Table 1.
In addition, the output of the FMCW fuze is connected to the oscilloscope, allowing the output signal to be collected by the oscilloscope. The oscilloscope has a sampling frequency of 1   MHz . The experimental setup is shown in Figure 1.
Due to space constraints in the microwave darkroom, the target was replaced with a metal plate with an area of 1 m 2 in the actual experiment.

2.2. Experimental Data Collection

The output signal of the FMCW fuze detector in this experiment has two channels, one is the fuze beat output signal and the other is the fuze start signal. The FMCW fuze signal processing circuitry processes the beat signal and outputs a start signal if it is judged to be a target, which in turn allows the combat section to effectively destroy the target.
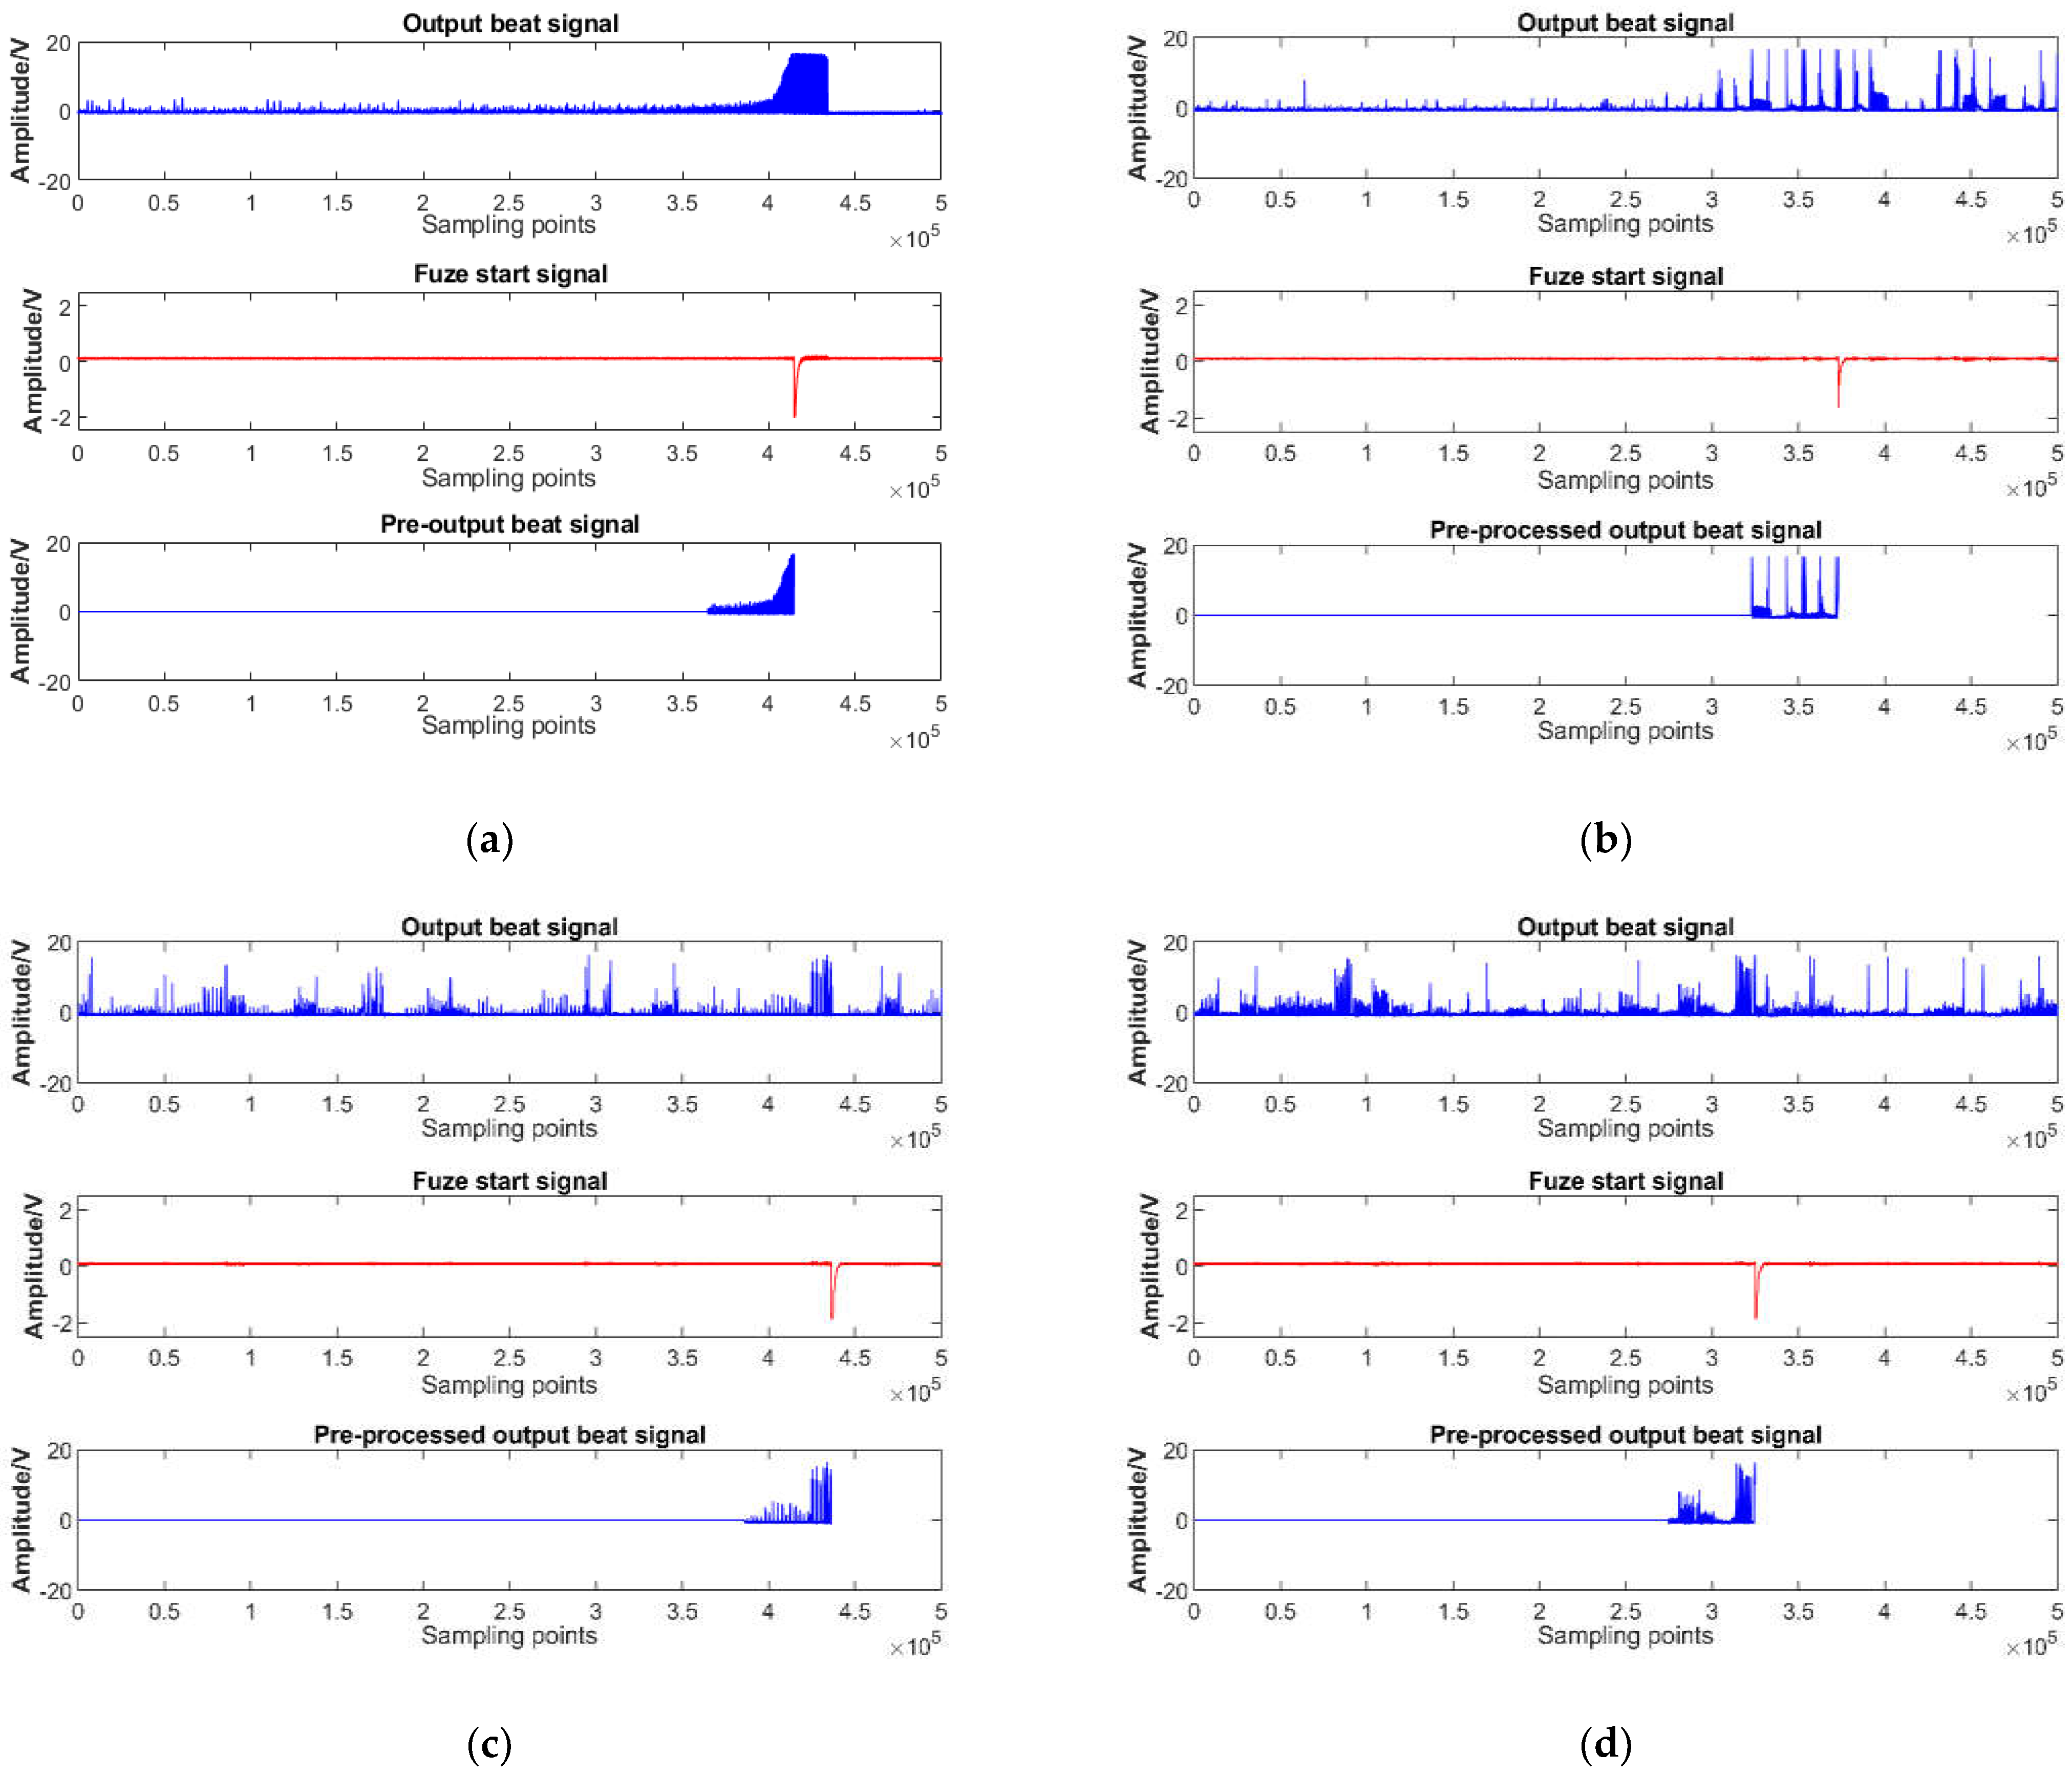
The collected signal data are shown in Figure 2 below. Each group of graphs is divided into 3 rows of data; the first row is the fuze output beat signal, and the second row in red is the fuze start signal, it can be seen that the fuze start signal is a downward negative pulse signal. The third-row data is the signal obtained by taking 50,000 points forward in the beat signal at the moment of the start signal output. Since the sampling frequency of the oscilloscope is 1 MHz, 50,000 points correspond to a time of 50 ms.
In this experiment, 180 sets of fuze output signals under target action, 60 sets of fuze output signals under noise amplitude frequency sweeping, sine amplitude frequency sweeping, and square amplitude frequency sweeping jamming signals were collected separately. Overall, 360 groups of data were collected. The data collected were used to validate the method proposed in this paper and are explained in detail in the subsequent sections.

3. Wavelet Packet Transform-Based Feature Extraction

As a classical signal processing algorithm, the wavelet packet transform is widely used in many areas of pattern recognition, such as disease diagnosis [17,18,19], industrial equipment fault diagnosis [20,21,22], voice recognition [23,24,25], and ECG signal classification [26,27], etc.

3.1. Basic Theory of Wavelet Packet Transform

A wavelet is a function that forms a fluctuation over a distance. The wavelet basis function can be obtained by varying the size and position of the mother wavelet and scale function to allow a multi-resolution analysis of the signal. The wavelet packet transform can localize the signal in both the time- and frequency-domains. It is sensitive to the details of the signal and is beneficial in achieving the extraction of local subtle features of the signal transients. The wavelet packet transform based on multi-resolution analysis uses an orthogonal wavelet basis to decompose the signal into individual components at different scales. The process of implementation is equivalent to reusing a set of high-pass and low-pass filters to progressively decompose the time series signal, with the high-pass filter producing the high-frequency detail component of the signal, and the low-pass filter producing the low-frequency approximation component. Repeat the above operation for the filtered low-frequency signal to obtain the next layer of high- and low-frequency band signals [28]. The basic principle of wavelet packet transform is briefly introduced here.
For the original signal f ( t ) , the coefficients of each layer after wavelet packet decomposition can be expressed by the following equation,
c 0 0 ( t ) = f ( t ) c j + 1 2 n ( t ) = k h ( k 2 t ) c j n c j + 1 2 n + 1 ( t ) = k g ( k 2 t ) c j n
In the above equation, n = 0 ,   1 ,   2 ,   ,   2 j , j = 1 ,   2 ,   ,   J , f ( t ) is the original signal should be decomposed, j denotes the number of layers of wavelet packet decomposition, J denotes the maximum number of layers of decomposition, c j n ( · ) denotes the coefficient of the n-th node of the jth level of the decomposition, h ( · ) denotes the high-pass filter, g ( · ) denotes the low-pass filter, c j + 1 2 n ( · ) denotes the low-frequency part of c j n ( · ) , and c j + 1 2 n + 1 ( · ) denotes the high-frequency part of c j n ( · ) .
The wavelet packet is simultaneously decomposed for both subspaces and can be expressed according to the following equation:
V 0 = U ( 1 , 0 ) U ( 1 , 1 )         = [ U ( 2 , 0 ) U ( 2 , 1 ) ] [ U ( 2 , 2 ) U ( 2 , 3 ) ]         =         = b = 1 B U ( J , B )
where B = 2 J 1 denotes the number of decompositions, and J denotes a maximum number of layers of decompositions. A three-layer wavelet packet decomposition schematic is shown below.
After the above decomposition, the frequency band range of the decomposition coefficients at each level can be expressed as follows,
c j 2 n + 1 : [ 2 ( j + 1 ) f s , 2 j f s ] c j 2 n : [ 0 , 2 ( j + 1 ) f s ] , j = 1 , 2 , , J
where f s denotes sampling frequency, c j 2 n + 1 denotes the high-frequency band signal decomposition coefficient at the j-th level, and c j 2 n denotes the low-frequency band signal decomposition coefficient at the j-th level.
From the above analysis, it can be seen that a wavelet packet not only decomposes both low and high frequencies of the signal, but also can adaptively select the corresponding frequency band to match the signal spectrum, according to the characteristics of the signal being analyzed, thus, improving the time–frequency resolution.

3.2. Signal Pre-Processing

To avoid the influence of the amplitude of the radio fuze detector on the classification and recognition results, the signal is pro-processed with normalization before feature extraction. In this paper, signal processing is performed by first subtracting the DC component of the radio fuze output signal, resulting in a zero-mean signal [29]. This can eliminate the DC bias in the output signal of the radio fuze. Then, the signal is normalized to unit variance by dividing the signal by its standard deviation. The normalization to unit variance is carried out to make the outcome of the algorithm independent of the signal amplitude, and, hence, the classification and recognition results are solely dependent on the texture of the radio fuze output signals. The specific expression for signal pre-processing is shown below:
N o r m _ S i g n a l = O r i g i n a l _ S i g n a l m e a n ( O r i g i n a l _ S i g n a l ) s t d ( O r i g i n a l _ S i g n a l )
where N o r m _ S i g n a l denotes the signal after pre-processing, O r i g i n a l _ S i g n a l denotes the unprocessed signal, m e a n ( · ) denotes the mean value of the signal, and s t d ( · ) denotes the standard deviation of the signal.

3.3. Signal Features Extraction

Feature extraction is an important aspect of the systems involving machine-learning algorithms [30]. In the proposed technique, the wavelet packet entropy features were computed using the wavelet packet transform coefficients. The extracted features were used to classify and recognize the target signal or frequency sweeping jamming signals. The coefficients of each node at each layer of the three-layer wavelet packet transform are preferred as the object of feature extraction. As shown in Figure 3, the three-layer wavelet packet decomposition has a total of 15 nodes, which are nodes (0,0), (1,0), (1,1), (2,0), (2,1), (2,2), (2,3), (3,0), (3,1), (3,2), (3,3), (3,4), (3,5), (3,6), and (3,7). The description of the features is as follows.
In the three-layer wavelet packet transform, the wavelet packet coefficients matrix of the n-th node in the i-th layer is c i m . The length of the wavelet packet coefficient matrix of the n-th node in the i-th layer is expressed as follows:
l e n _ c i n = l e n g t h ( c i n )
The Shannon entropy feature of the n-th node in the i-th layer is defined as E n i n .
E n i n = k = 1 l e n _ c i n p i n ( k ) 2 log 2 ( p i n ( k ) ) 2
where
E n i n = k = 1 l e n _ c i n p i n ( k ) 2 log 2 ( p i n ( k ) ) 2
In this paper, the number of the wavelet decomposition layers is three, so i = 0,1,2,3. n = 1, 2,…, 15. k denotes the index of the wavelet packet coefficient. Therefore, for each signal, 15 wavelet packet node Shannon entropy features can be extracted, i.e., E n 0 0 , E n 1 0 , E n 1 1 , E n 2 0 , E n 2 1 , E n 2 2 , E n 2 3 , E n 3 0 , E n 3 1 , E n 3 2 , E n 3 3 , E n 3 4 , E n 3 5 , E n 3 6 , E n 3 7 .
Daubechies series wavelet is orthogonal and sensitive to irregular signals, so the ‘db1’ wavelet is selected for wavelet transformation in this paper. For the target signal and amplitude modulation frequency sweeping jamming signals, the wavelet packet node Shannon entropy features E n 0 0 ~ E n 3 7 are extracted, respectively, and their probability density distribution functions are shown below. The probability density distribution of the wavelet packet node entropy features in the figure below shows that the target signal and the frequency sweeping jamming signals have different differential significance in the features of different wavelet packet nodes. Due to the real-time performance requirement of radio fuze, it is necessary to select the wavelet packet node features with the greatest significance of differences, which not only reduces the dimensionality of the features to improve the computational speed, but also reduces redundant features and improves the classification accuracy.
In order to quantify the significance of the differences in the entropy characteristics of the wavelet packet node coefficients for the different signals shown in Figure 4, the Kruskal–Wallis test method was selected for the significance of the differences in the characteristics of the different nodes. The Kruskal–Wallis test returns a value of p to indicate the size of the difference in the data distribution. A smaller p-value indicates a greater difference in the features and the more favorable the features are for classification and identification. Table 2 shows the p-values of the significant differences between the different signal characteristics of the different nodes.

3.4. Signal Features Dimensionality Reduction

Due to the high real-time requirements of radio fuze signal processing, it is necessary to reduce the dimensionality of the extracted signal features. In addition, it can be seen from Table 2 that the p-values of different wavelet packet nodes feature differently. For example, wavelet packet node (3,1) corresponds to a p-value of 0.3883, with minimal difference significance, and wavelet packet node (3,7) has a p-value of 1.4187 × 10 9 , which is also less significant compared to node (3,6) with a p-value of 1.6436 × 10 22 . Therefore, the feature selection of the wavelet packet nodes needs to be optimized. In this manuscript, the signal features dimensionality is reduced for two purposes. First, signal feature dimensionality reduction enables the computational complexity of signal classification recognition to be computed and improves the computational real-time performance of the algorithm. Secondly, signal feature dimensionality reduction can maximize the feature differences between different signals and improve the classification recognition accuracy of the classification algorithm.
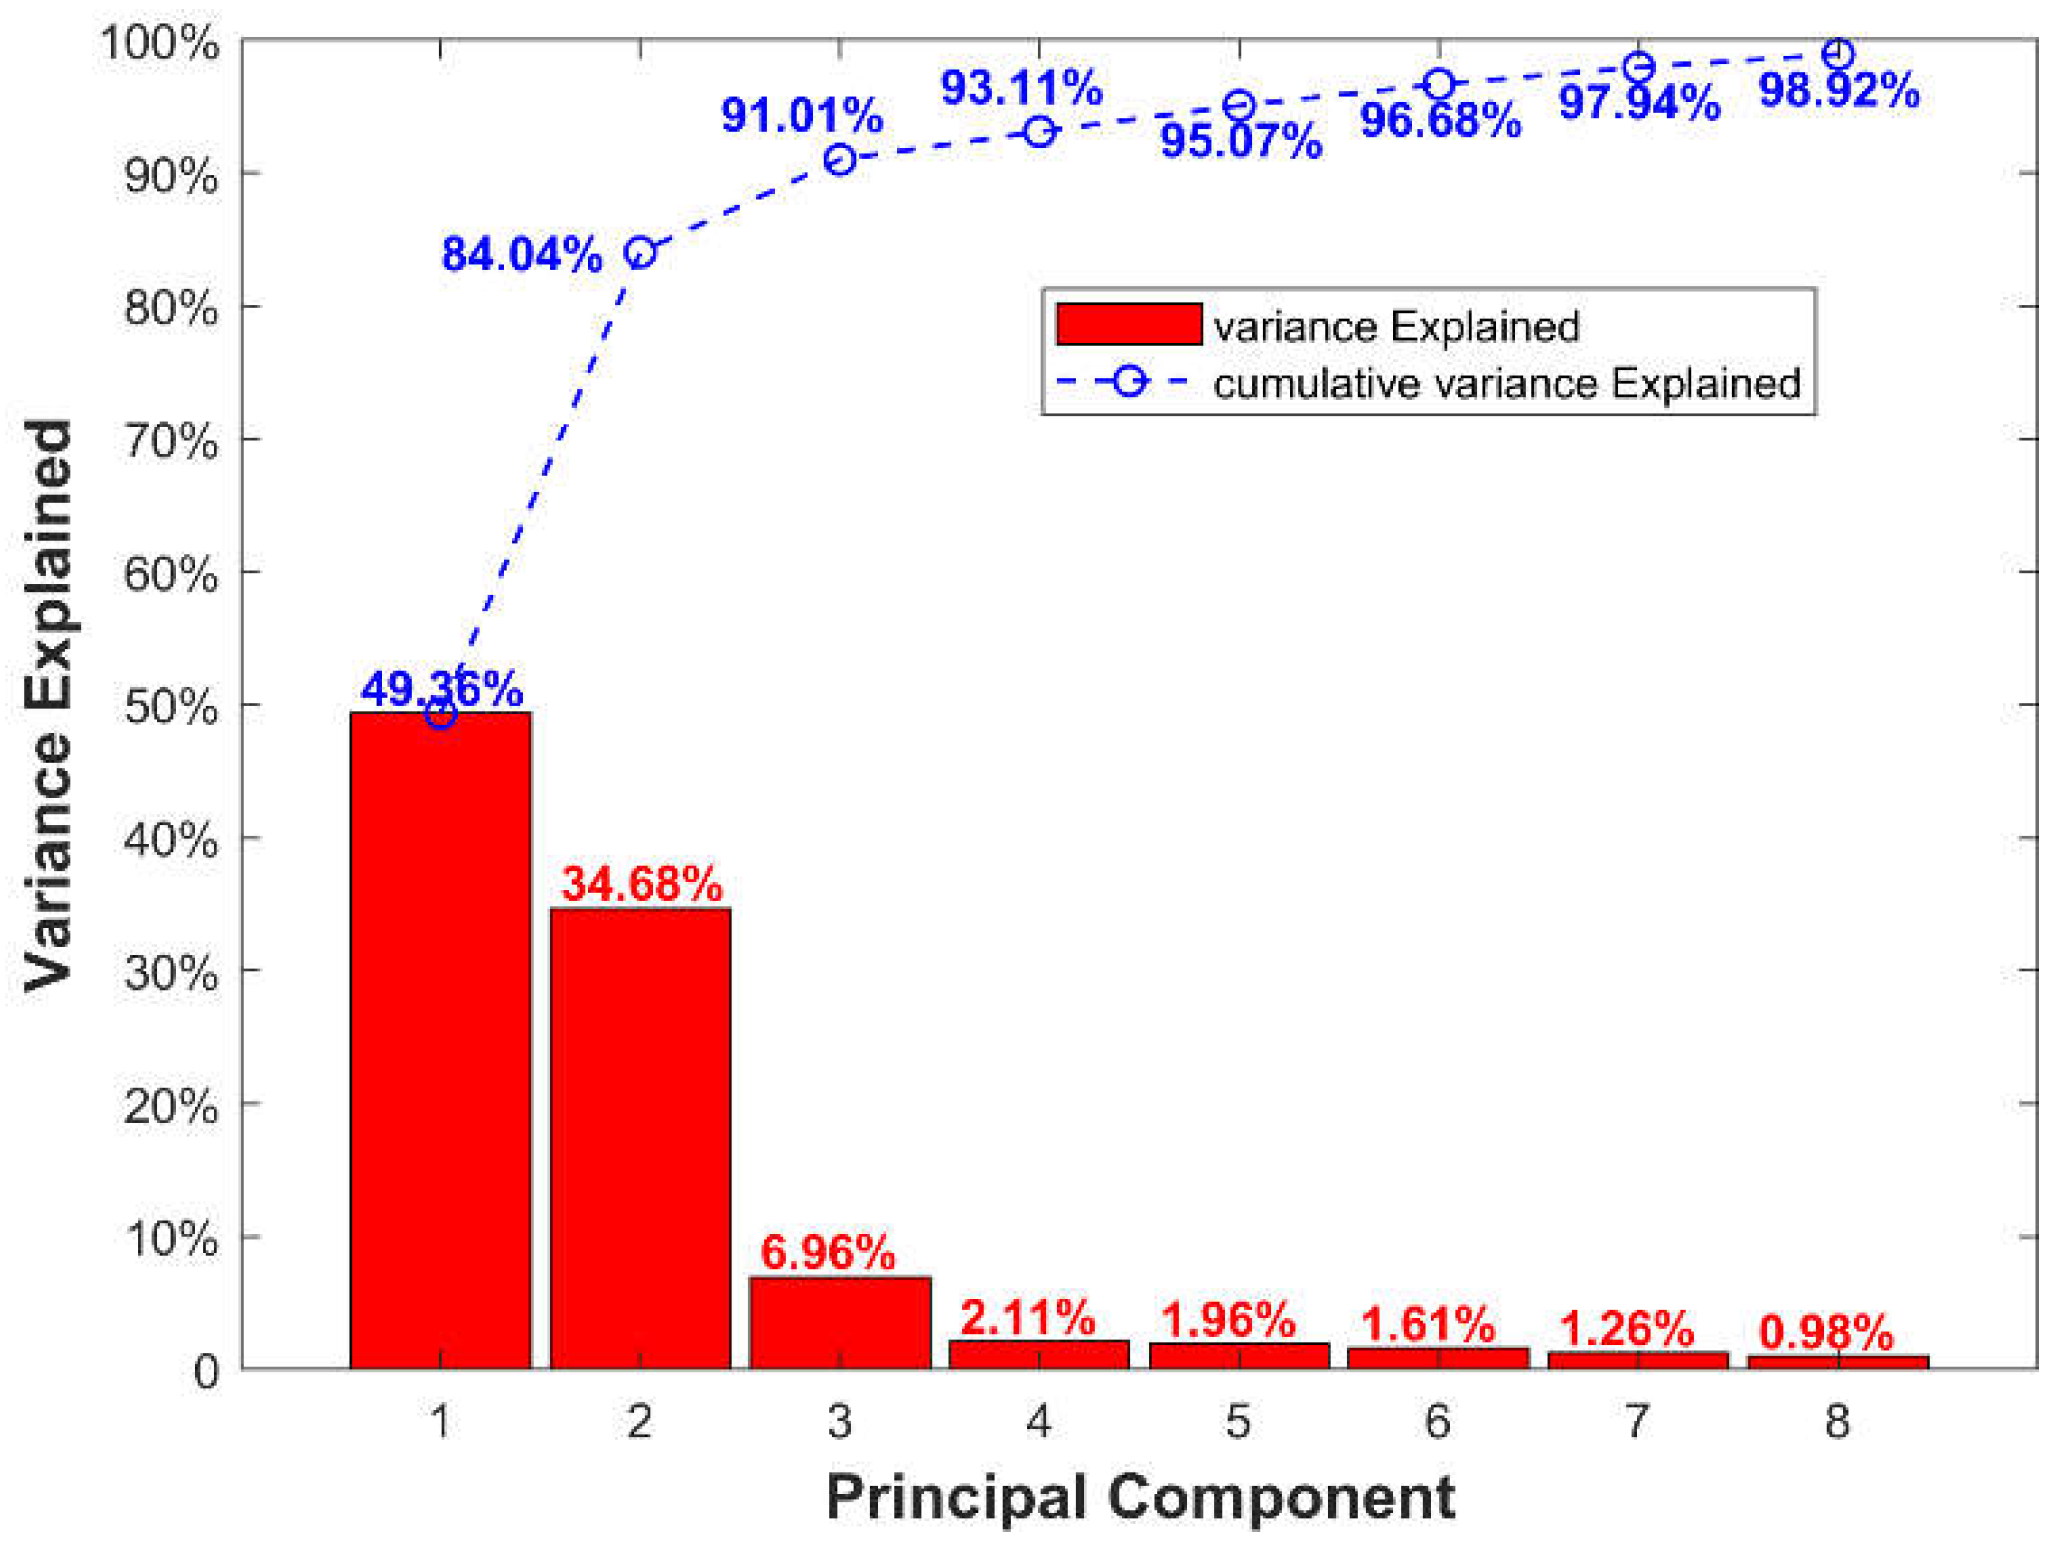
In this manuscript, we use the principal component analysis (PCA) method for dimensionality reduction to reduce the features of a total of 15 nodes from wavelet packets (0,0) to (3,7) to 8 principal components. The schematic of variance explained by the principal components and the cumulative variance after PCA are shown in Figure 5. In the figure, the red bars indicate the degree of variance explained by the different principal components, and the blue curves indicate the degree of variance explained by the cumulative variables.
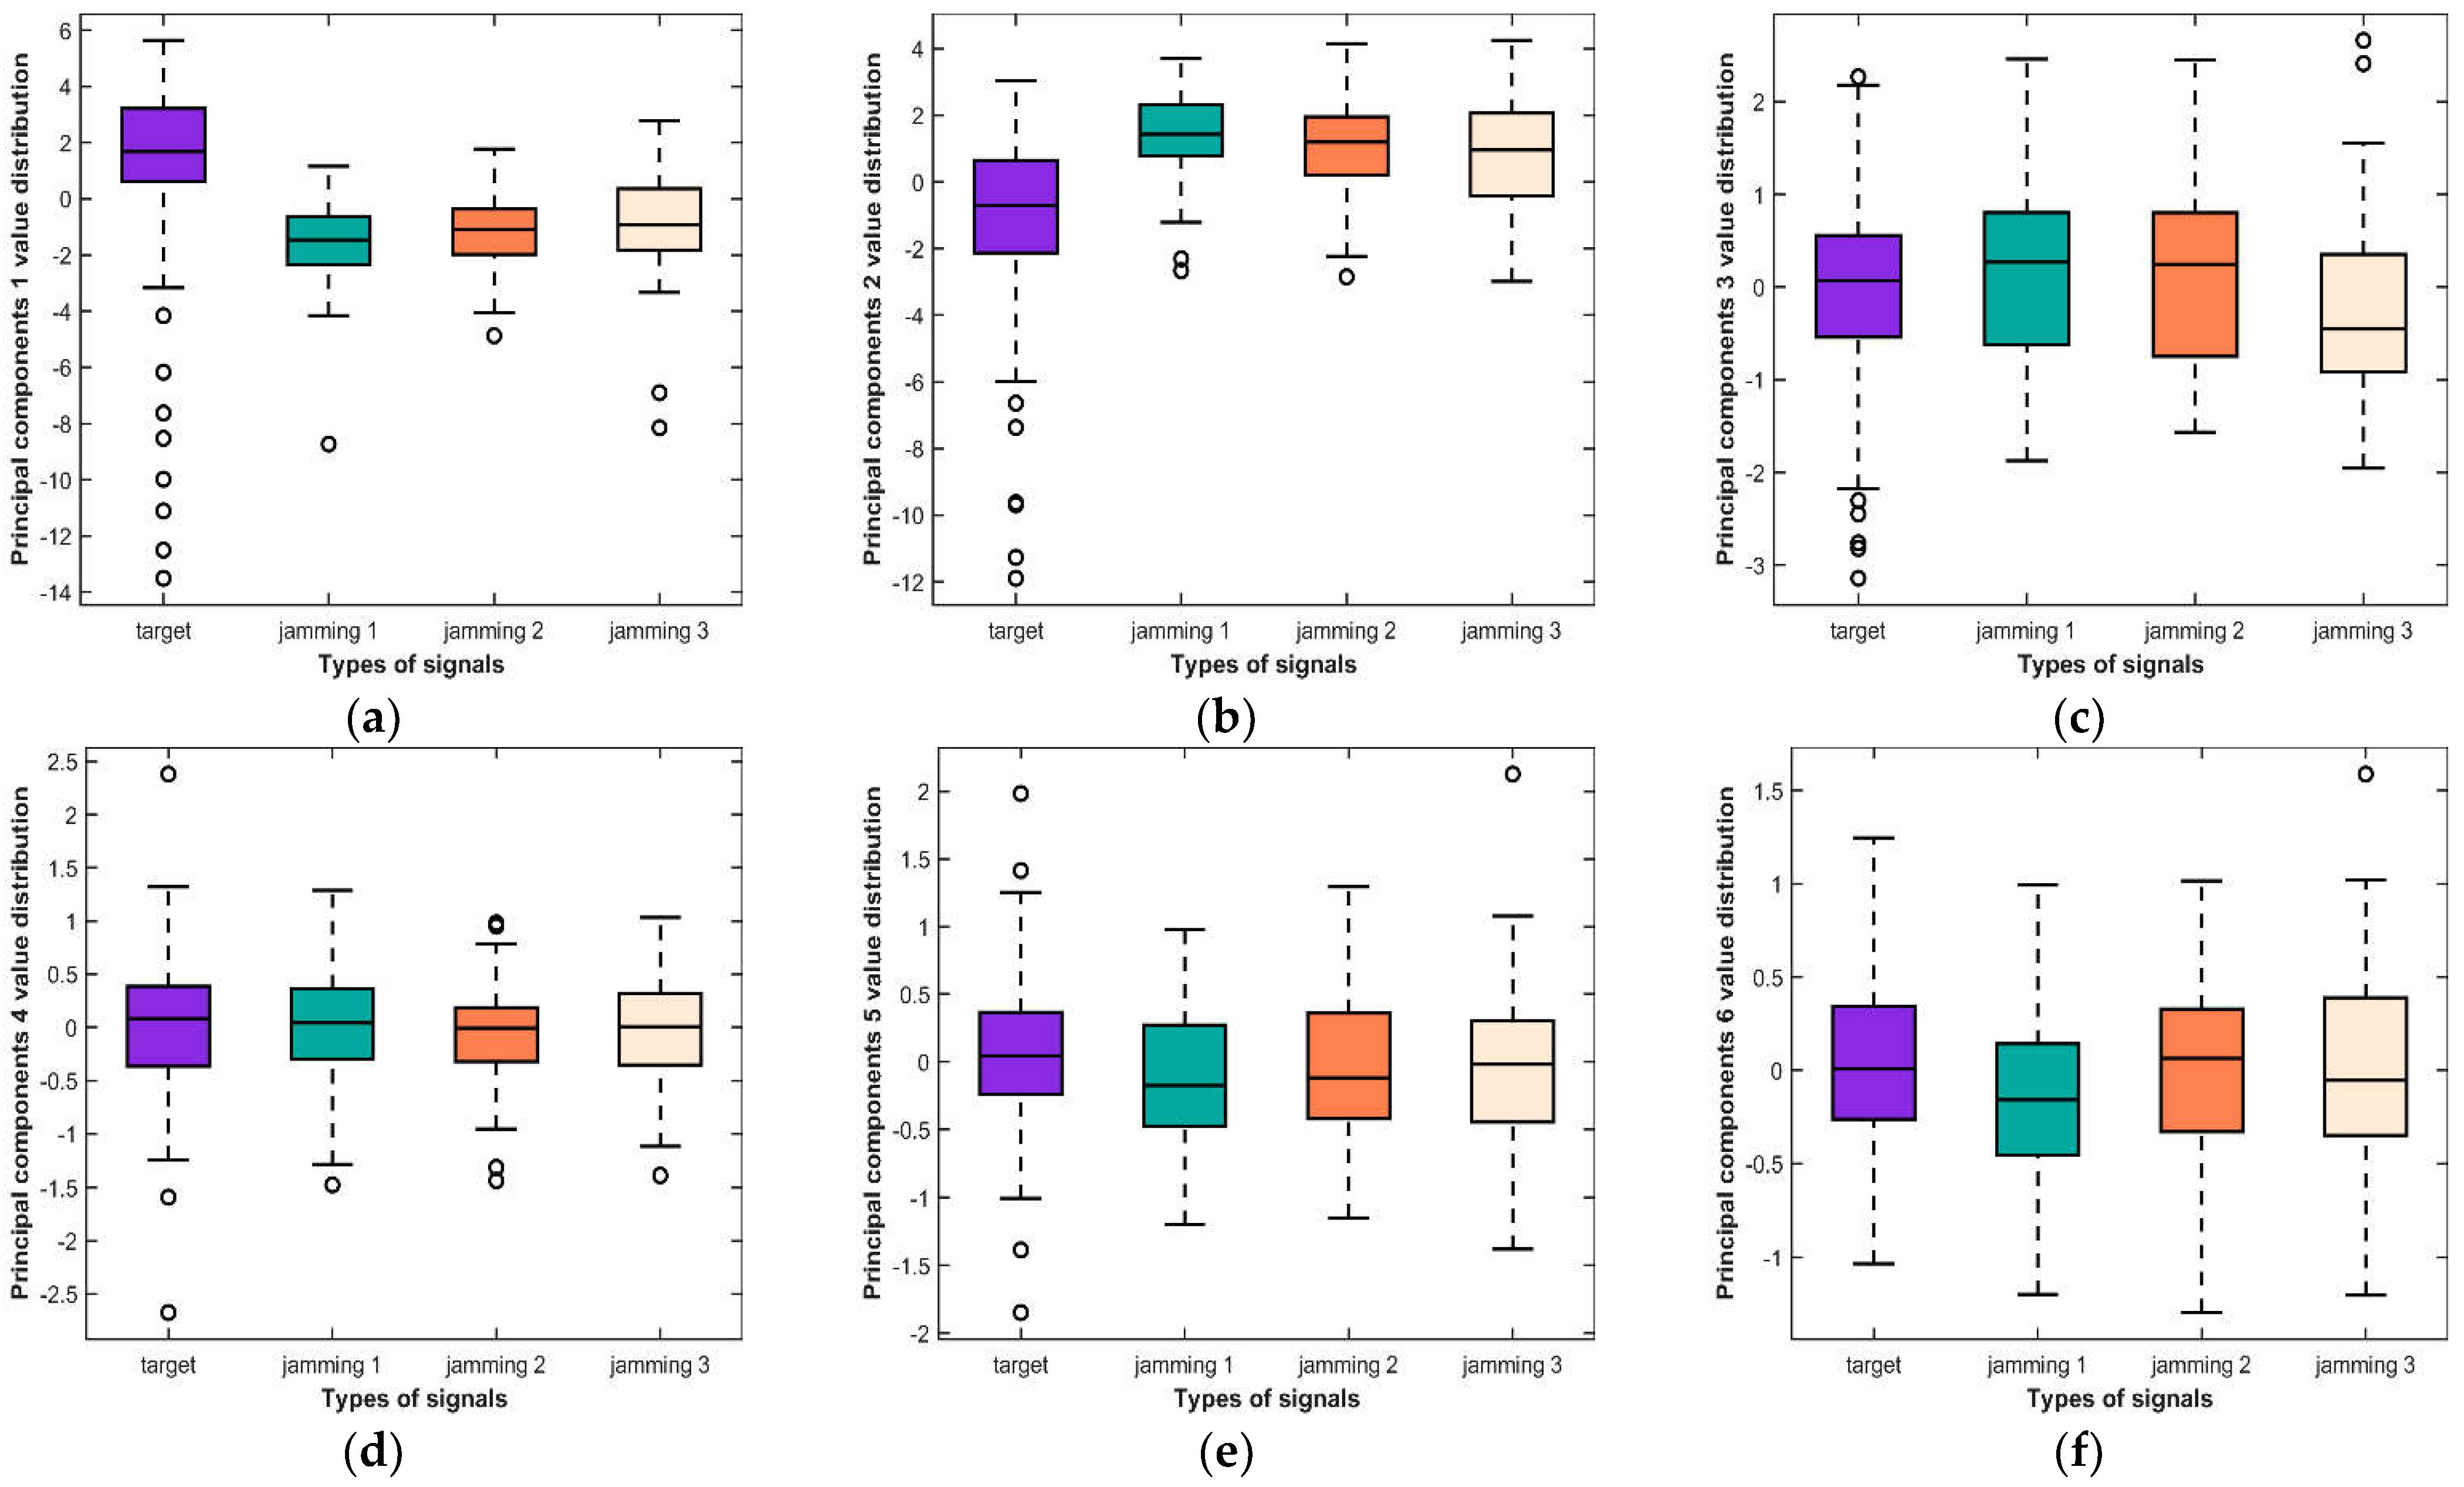
To visualize the distribution of the principal component values of the target and jamming signals more easily, statistical boxplots of the different principal components are drawn, as shown in Figure 6. Where ‘target’ in the horizontal coordinate represents the distribution of values of the corresponding principal components of the target signal, ‘jamming 1’, ‘jamming 2’, and ‘jamming 3’, represent the noise AM frequency sweeping jamming signals, sine AM frequency sweeping jamming signals, and square AM frequency sweeping jamming signals, respectively.

4. Target and Frequency Sweeping Jamming Classification Experiment

In order to verify the performance of the presented approach for target and jamming signals classification, a support vector machine (SVM) classifier is used. SVM as a classifier has been previously demonstrated for radar target classification [31,32]. The schematic of the proposed method is shown in Figure 7. The proposed method consists of several parts, i.e., signals data acquisition, signal pre-processing, wavelet packet transform, feature extraction, feature dimensionality reduction, classifier training, and classification recognition.

4.1. Pre-Experimental Data Preparation

To avoid the influence of the number of samples on the classification and recognition results, 180 sets of target signal samples and 60 sets each of noise AM frequency sweeping signals, sine AM frequency sweeping signals, and square AM frequency sweeping signals (a total of 360 sets of samples) were selected for the experiment. Using principal component analysis to reduce the dimensionality of a total of eight principal components, we selected the features with a cumulative distribution of the top 95% to form a feature vector for classification and identification, i.e., principal components 1, 2, 3, 4, 5.
The features are divided into two types: training and testing, in which the training samples are used to calculate a fitness function so that the classifier can be effectively trained, while the testing samples are used to verify the performance of the proposed method.

4.2. Experimental Evaluation Indicators

In the application scenario of radio fuzes, only the echo signal needs to be dichotomized as targets or jamming signals. In this experimental section, the confusion matrix for classification recognition can be represented as shown in Table 3.
TP (true positives) represents the sample that is actually a target and is classified as a target; FP (false positives) represents the that sample is actually a jamming signal and is classified as a target; FN (false negatives) represents the sample that is actually a target and is classified as a jamming signal; TN (true negatives) represents the sample that is actually a jamming signal and is classified as jamming signal.
Based on the above confusion matrix for target and jamming signals classification, the experimental evaluation indicators are set to include ‘Accuracy’, ‘Precision’, ‘Recall’ and ‘FalseAlarm’. The calculation is shown below.
Accuracy = TP + TN TP + TN + FP + FN
Precision = TP TP + FP
Recall = TP TP + FN
FalseAlarm = FP TP + FP
where Accuracy measures the rate of correct classification; Precision measures the percentage of results classified as positive samples that are correctly classified; Recall measures the rate of true targets detected correctly as a rate of all true targets; FalseAlarm measures the probability of a fuze being cheated by jamming signals. In the course of the following experiments, we selected the above indicators to evaluate the effectiveness of the method in this manuscript.

4.3. Experimental Results

In the experimental section, the concept of five-fold cross-validation was performed to evaluate the performance of the proposed technique. A total of 100 iterations of the SVM classifier were performed using a five-fold cross-validation approach. The mean and standard deviation of the performance evaluation indicators are computed. The experimental results with different SVM kernel function are shown in Table 4.
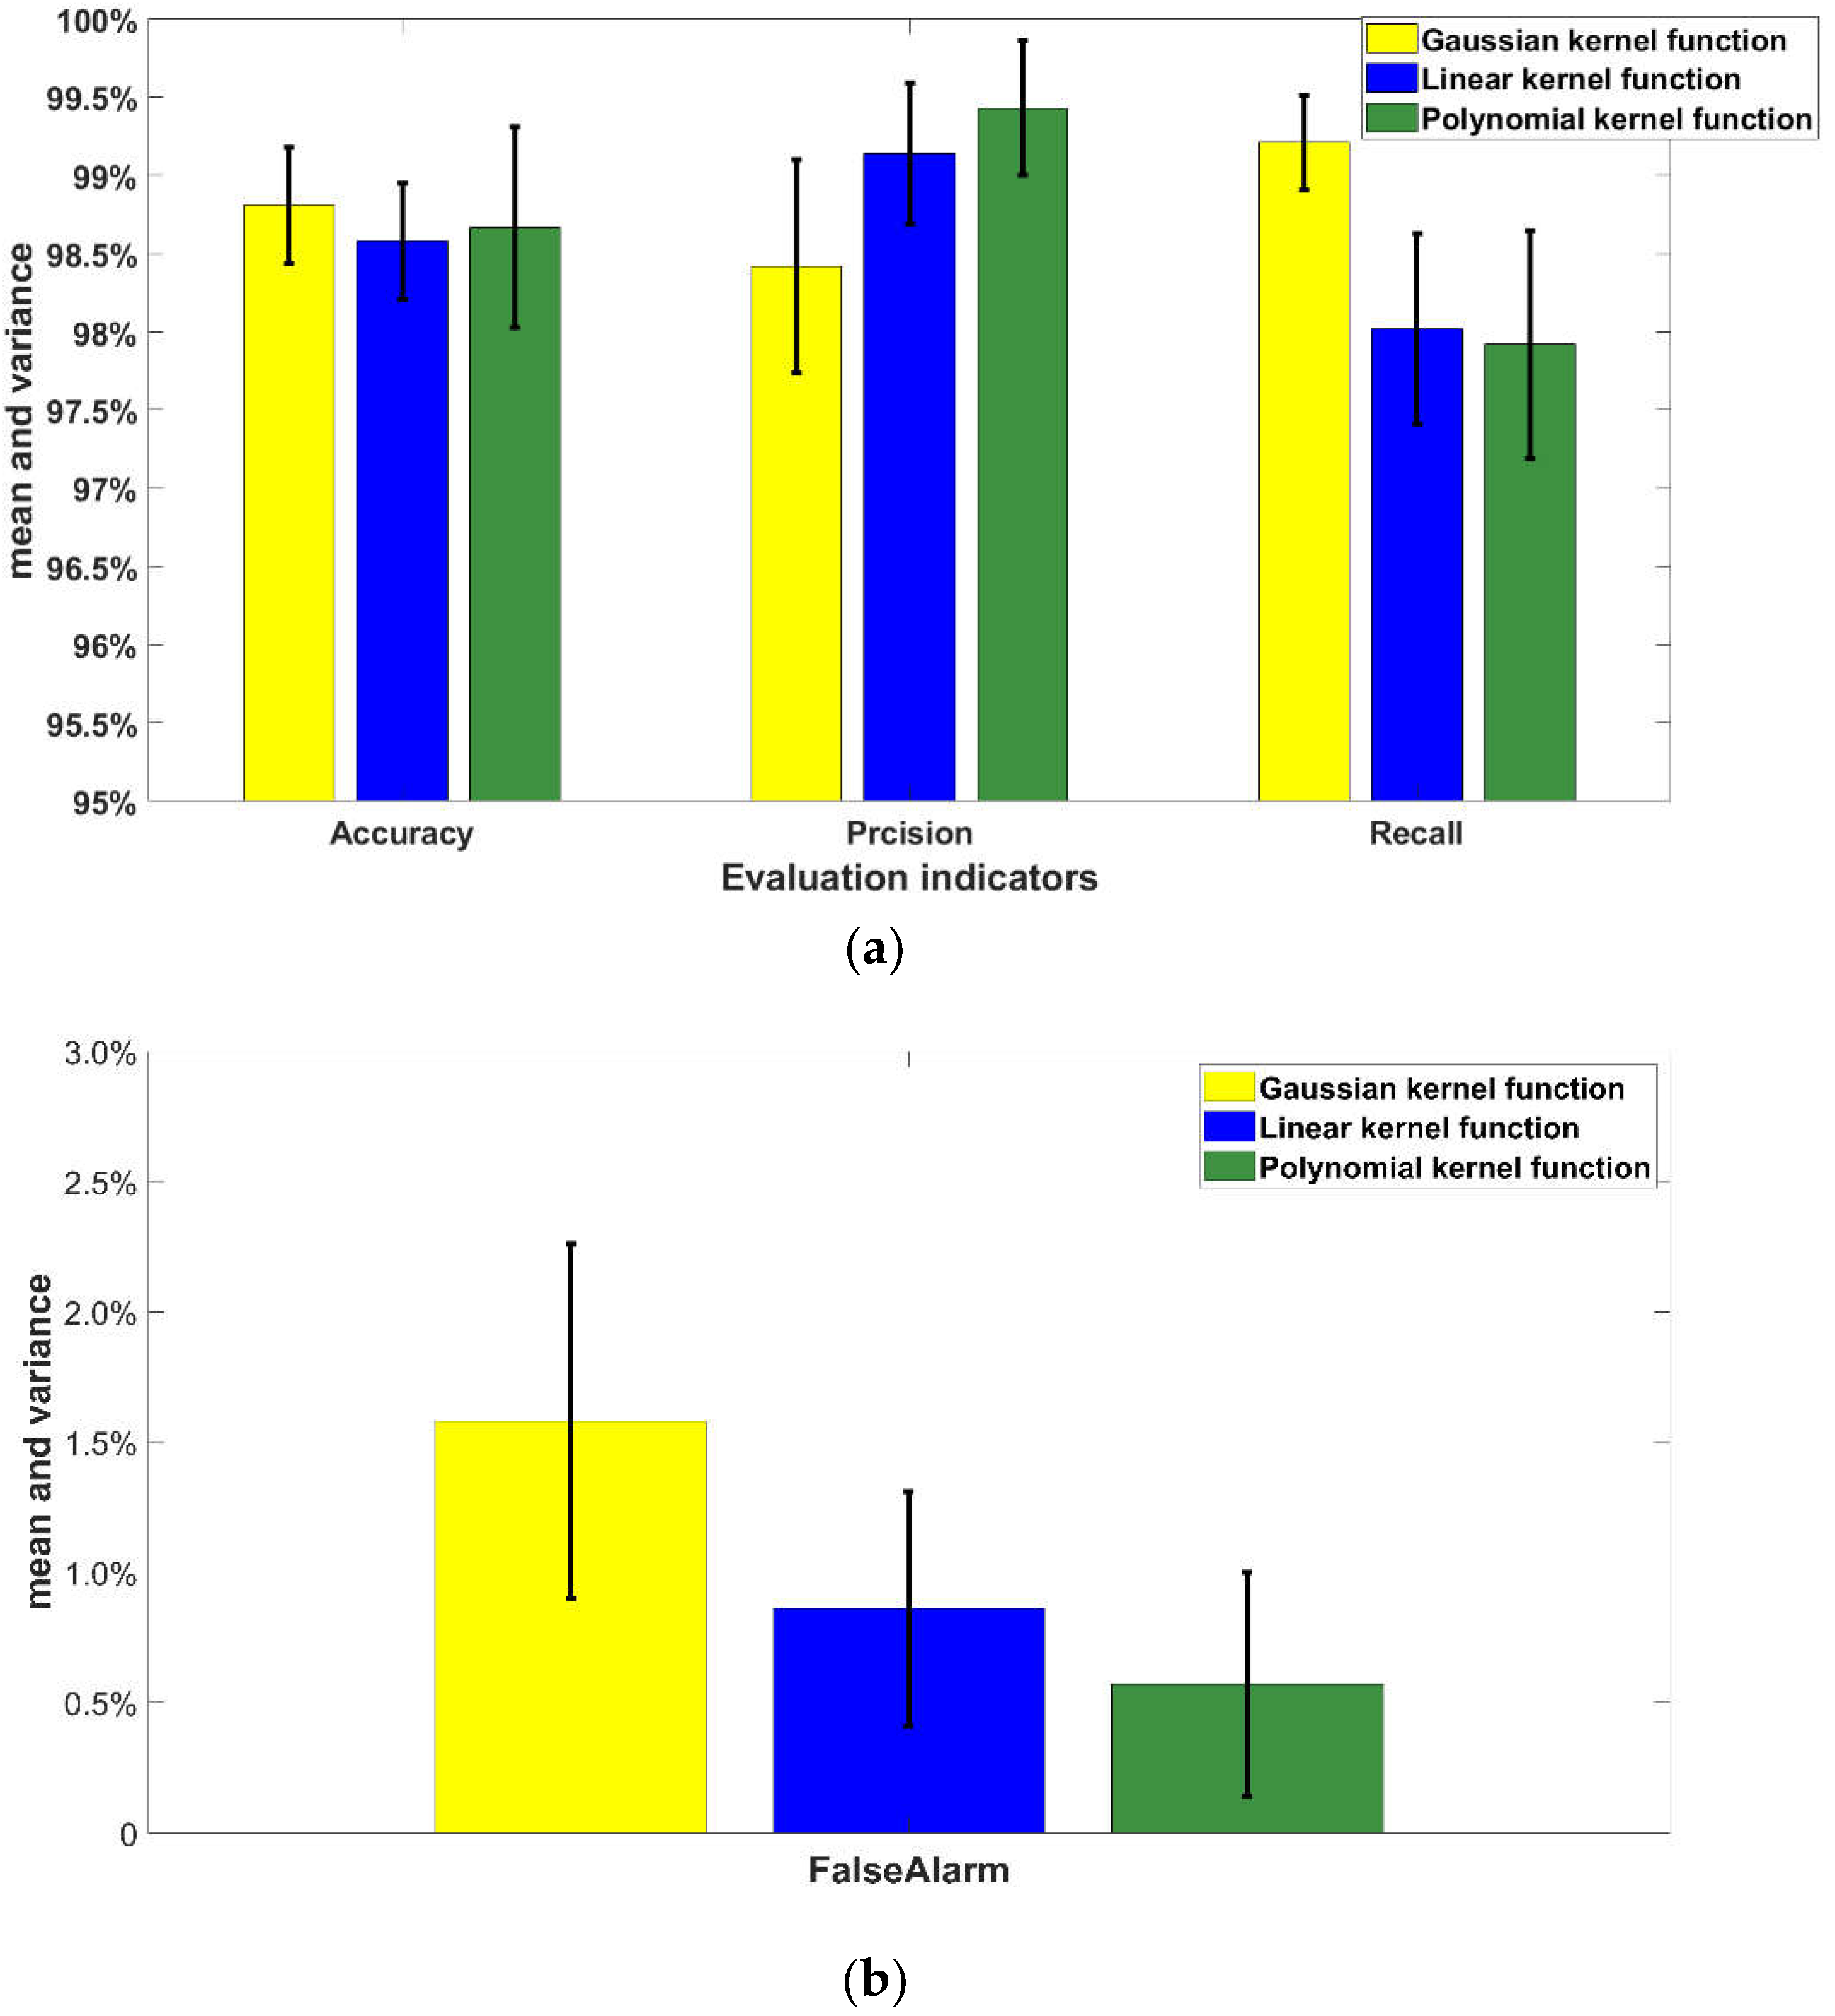
To visualize the experimental results more easily, Table 4 is plotted as a histogram, as shown in Figure 8. As can be seen from Table 4 and Figure 8, support vector machines with all three types of kernel functions meet an accuracy rate of 98% or more, with support vector machines using Gaussian kernel functions enabling a maximum recognition accuracy of 98.81%. The recognition precision all indicators reach 98% or more, with a maximum of 99.43% when using polynomial kernel functions. The recall indicator is fully satisfied reaching over 97%, with a maximum of 99.21% with a Gaussian the kernel function. The false alarm rate measures the chance of survival of a radio fuse in a complex electromagnetic battlefield environment, with a lower false alarm rate indicating better battlefield survivability. The false alarm rates of the proposed methods in this paper all remain below 2%, with the lowest rate being 0.57% when using a polynomial kernel function, and the highest rate being 1.58% when using a Gaussian kernel function.

5. Conclusions

In this paper, the performance of using the presented wavelet packet features and support vector machine algorithm for radio fuze anti-frequency sweeping jamming signals is investigated. The conceptual framework of this approach is based on a combination of wavelet packet transform entropy features and machine-learning technologies. To extensively verify the performance of the presented approach, a variety of samples were collected under the microwave darkroom laboratory environment, including target signals, noise AM frequency sweeping jamming signals, sine AM frequency sweeping jamming signals, and square AM frequency sweeping jamming signals. The significance of differences in targets and jamming signals for classification is analyzed using PDFs and the Kruskal–Wallis test. In addition, PCA is used for reducing the dimensionality of wavelet packet entropy features, so that the computational cost can be minimized without compromising the accuracy. In order to fully evaluate the methodology proposed in this paper, the four indicators of ‘Accuracy’, ‘Precision’, ‘Recall’, and ‘FalseAlarm’ were used to evaluate the experiment. The experimental results show that the highest ‘Accuracy’ is 98.81% ± 0.0037 when the kernel function is Gaussian function, the highest ‘Precision’ is 99.43% ± 0.0043 when the kernel function is polynomial function, the highest ‘Recall’ is 99.21% ± 0.0030 when the kernel function is Gaussian function, and the lowest ‘FalseAlarm’ is 0.57% ± 0.0043 when the kernel function is polynomial function. In summary, the classification and recognition accuracy of the proposed method is higher than 98% and the false alarm rate is lower than 2%, which can provide guidance for the design of radio fuze anti-jamming.

Author Contributions

Conceptualization, B.L. and X.H.; methodology, B.L.; software, B.L.; validation, B.L. and X.H.; formal analysis, B.L.; investigation, B.L.; resources, B.L.; data curation, B.L.; writing—original draft preparation, B.L.; writing—review and editing, B.L.; visualization, B.L.; supervision, X.H.; project administration, X.H.; funding acquisition, X.H. All authors have read and agreed to the published version of the manuscript.

Funding

This research was funded by the National Natural Science Foundation of China, grant number 61871414 and partly by the Basic Strengthening Project of Military Science and Technology Commission 2019-JCJQ-ZD-324.

Informed Consent Statement

Not applicable.

Conflicts of Interest

The authors declare no conflict of interest.

References

  1. Choi, J.H.; Lee, J.M.; Jung, M.S.; An, J.Y.; Kim, K.L. FMCW transceiver of short-range proximity sensor in sea clutter. Microw. Opt. Technol. Lett. 2017, 59, 334–337. [Google Scholar] [CrossRef]
  2. Dai, J.; Hao, X.H.; Liu, Q.; Yan, X.P.; Li, P. Repeater jamming suppression method for pulse Doppler fuze based on identity recognition and chaotic encryption. Def. Technol. 2021, 17, 1002–1012. [Google Scholar] [CrossRef]
  3. Fericean, S.; Dorneich, A.; Droxler, R.; Krater, D. Development of a microwave proximity sensor for industrial applications. IEEE Sens. J. 2009, 9, 870–876. [Google Scholar] [CrossRef]
  4. Li, Z.; Yan, X.P.; Li, P.; Hao, X.H.; Wang, J.T. Jamming mechanism of frequency sweep jamming to FM Doppler fuze. Acta Armament. 2017, 38, 1716–1722. [Google Scholar]
  5. Caddemi, A.; Cardillo, E. A low-cost smart microwave radar for short-range measurements. In Proceedings of the International Conference on Applications in Electronics Pervading Industry, Environment and Society, Rome, Italy, 21–22 September 2017. [Google Scholar]
  6. Choi, J.H.; Jung, M.S.; Yeom, K.W. A design and assessment of a direction finding proximity fuze sensor. IEEE Sens. J. 2013, 13, 3079–3089. [Google Scholar] [CrossRef]
  7. Yue, K.; Hao, X.H.; Li, P. An LFMCW detector with new structure and FRFT based differential distance estimation method. SpringerPlus 2016, 5, 922. [Google Scholar] [CrossRef]
  8. Chen, Q.L.; Hao, X.H.; Yan, X.P.; Qiao, C.X.; Wang, X.W. Anti sweep jamming method of hybrid modulation fuze based on harmonic coefficient amplitude averaging. Beijing Univ. Aeronaut. Astronaut. 2020, 46, 1317–1324. [Google Scholar]
  9. Qiao, C.X.; Hao, X.H.; Chen, Q.L.; Kong, Z.J.; Wang, X.W. Anti-DRFM-jamming method based on averaging of rangeside lobes for hybrid modulation radio fuze. Acta Armament. 2020, 41, 641–648. [Google Scholar]
  10. Akhtar, J. Orthogonal block coded ECCM schemes against repeat radar jammers. IEEE Trans. Aerosp. Electron. Syst. 2009, 45, 1218–1226. [Google Scholar] [CrossRef]
  11. Dai, J.; Hao, X.H.; Li, Z.; Li, P.; Yan, X.P. Adaptive target and jamming recognition for the pulse doppler radar fuze based on a time-frequency joint feature and an online-updated naïve bayesian classifier with minimal risk. Def. Technol. 2022, 18, 457–466. [Google Scholar] [CrossRef]
  12. Huang, Y.; Hao, X.H.; Kong, Z.J.; Zhang, B. Recognition of target and jamming signal for FM fuze based on entropy features. Acta Armament. 2017, 38, 254–260. [Google Scholar]
  13. Greco, M.; Gini, F.; Farina, A. Radar detection and classification of jamming signals belonging to a cone class. IEEE Trans. Signal Process. 2008, 56, 1984–1993. [Google Scholar] [CrossRef]
  14. Zhu, Y.Y.; Zhang, S.N.; Zhao, H.C.; Chen, S. Suppression of noise amplitude modulation interference in triangle frequency modulation detector based on FrFt. IEEE Sens. J. 2021, 21, 16107–16117. [Google Scholar] [CrossRef]
  15. Cardillo, E.; Caddemi, A. A novel approach for crosstalk minimisation in frequency modulated continuous wave radars. Electron. Lett. 2017, 53, 1379–1381. [Google Scholar] [CrossRef]
  16. Stove, A.; Baker, C. Radio-frequency interference to automotive radar sensors. IET Radar Sonar Nav. 2018, 12, 1154–1164. [Google Scholar] [CrossRef]
  17. Liu, W.Q.; Zhang, R.; Ling, Y.; Tang, H.P.; She, R.B.; Wei, G.L.; Gong, X.J.; Lu, Y.F. Automatic recognition of breast invasive ductal carcinoma based on terahertz spectroscopy with wavelet packet transform and machine learning. Biomed. Opt. Express. 2020, 11, 971–981. [Google Scholar] [CrossRef]
  18. Li, T.Y.; Zhou, M. ECG classification using wavelet packet entropy and random forests. Entropy 2016, 18, 285. [Google Scholar] [CrossRef]
  19. Rosso, O.A.; Blanco, S.; Yordanova, J.; Kolev, V.; Figliola, A.; Schurmann, M.; Basar, E. Wavelet entropy: A new tool for analysis of short duration brain electrical signals. J. Neurosci. Methods 2001, 105, 65–75. [Google Scholar] [CrossRef]
  20. Jin, Y.; Shan, C.Z.; Wu, Y.; Xia, Y.M.; Zhang, Y.T.; Zeng, L. Fault diagnosis of hydraulic seal wear and internal leakage using Wavelets and wavelet neural network. IEEE Trans. Instrum. Meas. 2019, 68, 1026–1034. [Google Scholar] [CrossRef]
  21. Liu, C.C.; Zhuo, F.; Wang, F. Fault diagnosis of communication failure using wavelet transform and wavelet neural network in HVDC transmission system. IEEE Trans. Instrum. Meas. 2021, 70, 1–8. [Google Scholar]
  22. Guo, M.F.; Zeng, X.D.; Chen, D.Y.; Yang, N.C. Deep-learning-based earth fault detection using continuous wavelet transform and convolutional neural network in resonant grounding distribution system. IEEE Sens. J. 2018, 18, 1291–1300. [Google Scholar] [CrossRef]
  23. Lei, L.; She, K. Identity vector extraction by perceptual wavelet packet entropy and convolutional neural network for voice authentication. Entropy 2018, 20, 600. [Google Scholar] [CrossRef] [PubMed]
  24. Daqrouq, K.; Azzawi, K.A. Acerage framing linear prediction coding with wavelet transform for text-independent speaker identification system. Comput. Electr. Eng. 2012, 38, 1467–1479. [Google Scholar] [CrossRef]
  25. Hidayat, S.; Tajuddin, M.; Yusuf, S.A.A.; Qudsi, J.; Jaya, N.N. Wavelet detail coefficient as a novel wavelet-mfcc features in text-dependent speaker recognition system. IIUM Eng. J. 2022, 23, 68–81. [Google Scholar] [CrossRef]
  26. Daamouche, A.; Hamami, L.; Alajlan, N.; Melgani, F. A wavelet optimization approach for ECG signal classification. Biomed. Signal. Proces. 2012, 7, 342–349. [Google Scholar] [CrossRef]
  27. Gubbi, J.; Khandoker, A.; Palaniswami, M. Classification of sleep apnea types using wavelet packet analysis of short-term ECG signals. J. Clin. Monit. Comput. 2012, 26, 1–11. [Google Scholar] [CrossRef]
  28. Mallat, S.G. A theory for multiresolution signal decomposition: The wavelet representation. IEEE Tran. Pattern. Anal. 1989, 11, 674–693. [Google Scholar] [CrossRef]
  29. Manish, K.; Satish, K.; Bhargab, D. Moving ground target detection with seismic signal using smooth pseudo wigner-ville distribution. IEEE Trans. Instrum. Meas. 2020, 69, 3896–3906. [Google Scholar]
  30. Manish, K.; Satish, K.; Bhargab, D. Seismic signal analysis using empirical wavelet transform for moving ground target detection and classification. IEEE Sens. J. 2020, 20, 7886–7895. [Google Scholar]
  31. Zhong, Y.; Eryk, D.; Yang, Y.; Zhu, X.; Zhou, Z.; Jiang, T. Internet of Mission-Critical Things: Human and Animal Classification—A Device-Free Sensing Approach. IEEE Internet Things 2018, 5, 3369–3377. [Google Scholar] [CrossRef]
  32. Xin, J.; Soumalya, S.; Asok, R.; Shalabh, G.; Thyagaraju, D. Target detection and classification using seismic and PIR sensors. IEEE Sens. J. 2012, 12, 1709–1718. [Google Scholar]
Figure 1. Experimental layout diagram.
Applsci 12 08713 g001
Figure 2. FMCW fuze beat output signals and start signals under target and jamming signals action. (a) Output signals under target action; (b) output signals under noise amplitude frequency swee-ing jamming signals; (c) output signals under sine amplitude frequency sweeping jamming signals; (d) output signals under square amplitude frequency sweeping jamming signals.
Applsci 12 08713 g002
Figure 3. Schematic diagram of 3-layer wavelet packet decomposition.
Applsci 12 08713 g003
Figure 4. Different signals wavelet packet nodes entropy probability density function. (a) Node (0,0). (b) Node (1,0). (c) Node (1,1). (d) Node (2,0). (e) Node (2,1). (f) Node (2,2). (g) Node (2,3). (h) Node (3,0). (i) Node (3,1). (j) Node (3,2). (k) Node (3,3). (l) Node (3,4). (m) Node (3,5). (n) Node (3,6). (o) Node (3,7).
Applsci 12 08713 g004
Figure 5. Schematic representation of the variance explained of principal component analysis.
Applsci 12 08713 g005
Figure 6. Boxplot of the distribution of the values of each principal component. (a) Principal component 1. (b) Principal component 2. (c) Principal component 3. (d) Principal component 4. (e) Principal compnent 5. (f) Principal component 6. (g) Principal component 7. (h) Principal component 8.
Applsci 12 08713 g006aApplsci 12 08713 g006b
Figure 7. Flow chart of the target and jamming signals classification and identification method.
Applsci 12 08713 g007
Figure 8. Histogram of experimental results. (a) Accuracy, precision, and recall experiment results. (b) FalseAlarm experiment results.
Applsci 12 08713 g008
Table 1. Experimental parameter settings.
Type of ParameterParameter Values
FMCW fuze centre frequency ( f c ) 3   GHz
FMCW fuze modulation bandwidth ( Δ F ) 15   MHz
Jammer distance ( L j ) 1.75   m
Target distance ( L t ) 10   m
Jamming signal frequency sweeping bandwidth ( B j ) 30   MHz   ( 2 Δ F ) *
* To cover the bandwidth of the FMCW fuze, the frequency sweeping range is set to 2 times the modulation bandwidth of the fuze.
Table 2. Different signals wavelet packet nodes entropy Kruskal–Wallis test p-values.
Wavelet Packet Nodep-Value
(0,0) 1.4068 × 10 47
(1,0) 9.8566 × 10 48
(1,1) 3.4015 × 10 70
(2,0) 8.3547 × 10 48
(2,1) 1.3497 × 10 61
(2,2) 3.2688 × 10 70
(2,3) 5.8410 × 10 7
(3,0) 6.7412 × 10 48
(3,1) 0.3883
(3,2) 1.5278 × 10 35
(3,3) 1.0568 × 10 47
(3,4) 9.0763 × 10 70
(3,5) 2.2518 × 10 54
(3,6) 1.6436 × 10 22
(3,7) 1.4187 × 10 9
Table 3. Confusion matrix for target and interference signal classification and identification.
Classified Type of SamplesTargetsJamming Signals
Actual Type of Samples
TargetsTPFP
Jamming signalsFNTN
Table 4. Summary of evaluation indicators using different SVM kernel functions.
SVM Kernel FunctionEvaluation Indicators
Accuracy Precision Recall FalseAlarm
Gaussian98.81% ± 0.003798.42% ± 0.006899.21% ± 0.00301.58% ± 0.0068
Linear98.58 ± 0.003799.14% ± 0.004598.02% ± 0.00610.86% ± 0.0045
Polynomial98.67% ± 0.006499.43% ± 0.004397.92% ± 0.00730.57% ± 0.0043
Publisher’s Note: MDPI stays neutral with regard to jurisdictional claims in published maps and institutional affiliations.