Article

A Research on Image Semantic Refinement Recognition of Product Surface Defects Based on Causal Knowledge

1
School of Mechanical and Electrical Engineering, Guizhou Normal University, Guiyang 550025, China
2
Technical Engineering Center of Manufacturing Service and Knowledge Engineering, Guizhou Normal University, Guiyang 550025, China
*
Author to whom correspondence should be addressed.
Appl. Sci. 2022, 12(17), 8828; https://doi.org/10.3390/app12178828
Submission received: 9 August 2022 / Revised: 28 August 2022 / Accepted: 30 August 2022 / Published: 2 September 2022
(This article belongs to the Special Issue Recent Advances in Smart Design and Manufacturing)

Abstract

:
The images of surface defects of industrial products contain not only the defect type but also the causal logic related to defective design and manufacturing. This information is recessive and unstructured and difficult to find and use, which cannot provide an apriori basis for solving the problem of product defects in design and manufacturing. Therefore, in this paper, we propose an image semantic refinement recognition method based on causal knowledge for product surface defects. Firstly, an improved ResNet was designed to improve the image classification effect. Then, the causal knowledge graph of surface defects was constructed and stored in Neo4j. Finally, a visualization platform for causal knowledge analysis was developed to realize the causal visualization of the defects in the causal knowledge graph driven by the output data of the network model. In addition, the method is validated by the surface defects dataset. The experimental results show that the average accuracy, recall, and precision of the improved ResNet are improved by 11%, 8.15%, and 8.3%, respectively. Through the application of the visualization platform, the cause results obtained are correct by related analysis and comparison, which can effectively represent the cause of aluminum profile surface defects, verifying the effectiveness of the method proposed in this paper.

Graphical Abstract

1. Introduction

In the manufacturing industry, large-scale industrial production requires the production of homogeneous products. However, product design and manufacturing processes are influenced by manufacturing resources, processing methods, processing sequences, and process design principles in the actual production process, resulting in the production of undesirable products [1]. Among them, surface defects are the most intuitive manifestation of product quality that is affected. There is causal logic between the surface defects of products and the defect design and manufacture of products [2]. This information is recessive, unstructured, scattered, difficult to find and use, and cannot fully express complex relationships between surface defects and product design and manufacturing. Suppose this causal logical information is knowledge processed and organized by specific rules. In that case, the formation of an explicit, structured, and networked body of causal knowledge for product surface defects can provide an apriori basis for solving the problem of product defects from the aspects of design and manufacture. Therefore, in order to ensure the qualified rate and reliability of product quality, it is necessary to construct the causal knowledge system of surface defects while detecting them, which realizes the point-to-point relationship mapping of “surface defect type-defect causal knowledge”. At this point, surface defect detection not only obtains a series of relevant information, such as defect category, position, and contour from the macro perspective, but also realizes the representation of causal knowledge behind defects from the micro perspective, which enriches the semantic information of defect image.
In the aspect of defect detection, with the increasing level of the manufacturing industry, computer vision is widely used instead of human eyes to detect the surface quality of products, which has become a hot spot in modern manufacturing. Coupled with the rapid development of deep learning, detection methods based on DCNN (deep convolutional neural network) are increasingly widely used in the field of defect detection. This network model realizes image defect detection through complete end-to-end training. According to their functions in defect detection, they can be divided into defect classification networks, defect detection networks, and defect segmentation networks, which solve the problems of what the defect is, where the defect is, and how the defect is shaped, respectively. In addition, the network performance can be improved by setting the hyperparameters of the network model and improving the network structure. For example, VGG, as a common convolutional neural network, has the characteristics of simple structure and strong practicability. Gao et al. [3] fine-tuned the structure of VGG-11 when detecting gear surface defects, showing the network’s high reliability and robustness in classification. Akram et al. [4] proposed an improved VGG-11 structure, which made the classification accuracy of solar cell surface defects reach 93.02%, increased by 6.5%. Aplipour et al. [5] used VGG16 as the backbone network to establish an FCN network to achieve the segmentation of concrete surface cracks. Therefore, the product surface defect detection based on DCNN can quickly realize defect classification and detection.
In the construction of a surface defect causal knowledge system, KGs (knowledge graphs) have been increasingly widely used in the organization, management, and understanding of manufacturing information due to their structured representation form, rich semantic information, and appropriate description of complex relationships. Hedberg et al. [6] used a KG to connect the design data of different stages in product design, manufacturing, quality, and so on to form the digital main line, which provided the information traceability of product life cycles and the generation and reuse of related knowledge. Dombrowski et al. [7] integrated data from different information systems into a KG to solve the problem of data islands in the plant planning process, providing data quickly according to the needs of planners. Therefore, KG technology can realize the storage, management, and visualization of causal knowledge of product surface defects.
At present, the storage of information about product surface defect problems is mainly based on images and texts. Intuitively, the images store the feature information of defects, and text stores the description of defect features, causality, and other aspects. From the above analysis, it can be seen that the classification of defect images can rely on computer vision technology, while the storage and visualization of defect causal knowledge can rely on KG technology. Considering the point-to-point relationship mapping of “surface defect-defect causal knowledge”, it can be found that the surface defect detection of industrial products based on the deep convolutional neural network has obvious shortcomings, namely:
(1)
The DCNN only obtains the data output of the category and location information of product surface defects but cannot express the implicit causal knowledge behind the image defects, which ignores the rich semantic information of the surface defect image itself and the huge potential connection among information.
(2)
The knowledge graph can visualize knowledge, making finding the relationship between knowledge easier. Therefore, to enrich the semantic information of surface defect images through knowledge graph technology, it is necessary to fuse the content of image classification technology and knowledge graph technology. Still, they have a vast semantic gap, and the joint task is challenging to solve.
Therefore, some researchers have begun to integrate computer vision technology and KG technology for multimodal information processing. Zhou et al. [8] proposed an image captioning system, CNET-NIC, to produce better image captions by detecting objects in images. The background knowledge of the image is stored in the form of a knowledge graph. Firstly, the objects in the image are detected by a convolutional neural network, and then the detected objects are used to identify related terms and concepts. Then, these terms or concepts are connected to the corresponding nodes in the knowledge graph. Finally, the subtitle or image description produced by the machine is improved by the relationship between nodes. Zhang et al. [9] proposed an image classification technology based on KG technology, which improves the performance of image classification by constructing an image knowledge graph (IKG). However, there are still few studies on multimodal information processing in the cause analysis of product surface defects. In addition, the text datasets of defect cause in the engineering field are limited, which cannot represent the potential knowledge of poor design and manufacturing related to defect images. Based on the technology of multimodal information processing and inspired by the success of the semantic refinement method [10], we propose an image semantic refinement recognition method based on causal knowledge for product surface defects. It aims to visualize the output of image defects and the complete causal knowledge behind them through KG technology, which transforms them into a visually understandable structured form, enriching the image semantic information of product surface defects.
The rest of this article is organized as follows. Section 2 introduces the related work about computer vision technology and knowledge graph technology. In Section 3, we propose the framework of a semantic refinement recognition structure for product surface defect images based on causal knowledge. The Section 4 carries on the relevant experiment through the application case. Section 5 presents a framework for developing a visual system. Section 6 discusses the conclusions and future work.

2. Related Works

2.1. Computer Vision Technology

Since the middle of the 20th century, image classification technology in the field of computer vision has made constant progress. With the rise of deep learning in recent years, image classification based on deep convolutional neural network (DCNN) has achieved positive results in intelligent data acquisition and efficient processing. At present, image classification technology has many applications in aerial remote sensing [11], ocean remote sensing [12], face recognition [13], and so on. Convolution operation is a multi-layer feedforward neural network model. Its network structure is characterized by the use of a separate set of convolution kernels in each layer, which helps to extract useful features from locally relevant data points. In the training process, CNN learns by BP (back propagation) algorithm and updates the weights of network nodes. The continued success of BP algorithms and CNN has led to network models such as LeNet [14], AlexNet [15], VGG [16], GoogLeNet [17], ResNet [18], and MobileNet [19]. At the same time, because CNN adopts the network structure with core weight sharing, it can gain a better learning effect by increasing network depth when dealing with complex problems.
The basic architecture of CNN is mainly composed of a convolution layer, activation layer, normalization layer, pooling layer, and full connection layer.
The function of the convolution layer is to extract the features of input data. Convolution is usually calculated with the size of 3 × 3, 5 × 5, or 7 × 7 convolution kernels to obtain a multidimensional feature map. The common convolution operations are standard convolutions, transpose convolution [20], dilated convolution [21], depth separable convolution [22], deformable convolution [23], and so on. Standard convolution is a process in which the convolution kernel slides onto the image and calculates the gray values of all image pixels through a series of matrix operations. This process is also known as the down-sampling process. Transposed convolution realizes the reverse operation of convolution, also known as up-sampling, and is widely used in semantic segmentation. Compared with the conventional convolution, dilated convolution increases the distance between the values of the convolution kernel, so as to extract better features. Deep separable convolution realizes the separation of channels and regions in normal convolution, which can greatly reduce the parameters of a network model. It is applied to the lightweight network model MobileNet. Deformable convolution adds an additional direction vector to each element of the convolution kernel, which can automatically adjust its shape according to the different scale or deformation of the object to better extract the input features.
The function of the activation layer is to increase the nonlinearity of the neural network model through an activation function. Common activation functions are the rectified linear unit (ReLU) [24], sigmoid function [25], and tan hyperbolic (tanh) functions. ReLU is the most significant unsaturated activation function, which is more efficient than sigmoid and tanh. Their expressions are shown in Equations (1)–(3).
R e l u ( x ) = max ( 0 , x )
σ ( x ) = sigmoid ( x ) = 1 / ( 1 + e x )
Tan ( x ) = ( e x e x ) / ( e x + e x )
The function of batch normalization (BN) [26] enables researchers to select larger learning rates. While the training speed of the model grows rapidly, the model has fast convergence, and the problems of gradient dispersion and gradient explosion are avoided. Its expression is shown in Equation (4).
b x , y i = α x , y i / ( k + a j = max ( 0 , i n 2 ) min ( N 1 , i + n 2 ) α x , y j 2 ) β
where i represents the output of the ith neuron after using the activation function, n represents the number of adjacent kernel maps at the same location, and N represents the total number of kernels. K , n , α , and β are all hyperparameters, generally set as 2, 5, e 4 , and 0.75, respectively.
The function of the pooling layer is to reduce the dimension of the data and represent the image with higher level features. The common pooling methods are max pooling, average pooling [27], and spatial pyramid pooling [28]. These pooling methods can better achieve feature compression and feature extraction.
The full connection layer is usually connected at the end of the neural network, reducing the dimension of the output feature and aligning the feature map with the final classification.
The above statement gives a basic structure of a network model from the perspective of the depth and modularity of the CNN structure.
Based on the above network model and basic composition structure, many excellent target detection algorithms have been borne in the field of visual detection technology, such as YOLO [29], Faster RCNN [30], MASK RCNN [31], etc. With the development of technology, these network models are combined with some other new algorithms, such as channel attention mechanism [32], PANET [33], GhostNet [34], and so on, which further optimize the network model and improve the detection rate of product surface defects. Yang et al. [35] reduced the missing rate of casting defects effectively through the fusion of the improved Faster RCNN, Cascade RCNN, and YOLOv3. Xie et al. [36] carried on the rule characterization processing to the welding joint defect, further improving the defect detection rate. Zhang et al. [37] improved the detection rate of casting defects by using the Adversarial Generating Network and the Supervised Learning Model of MASK RCNN. Li et al. [38] improved the detection rate of surface defects by improving the Focalloss in the YOLOV4. These network models, which integrate new algorithms, have achieved positive results in the surface defect detection of industrial products. However, these detection technologies only show the types and positions of the distribution of those defects on a macroscopic level, which makes them unable to explain causal knowledge, such as the formation mechanism of surface defects. At present, the research of computer vision technology mainly focuses on the classification and detection of product quality problems but not the information entropy of product quality.

2.2. Knowledge Graph Technology

According to the above, computer vision classification techniques cannot represent the information entropy of product quality problems, while the causal knowledge of surface defects is an essential resource. The formation mechanism of defects is a common causal knowledge, which contains the manufacturing information in the manufacturing process. The storage, organization, and management of knowledge through effective means can realize the accumulation, inheritance, and reuse of knowledge. It can help people to analyze data and improve work efficiency and manufacturing quality. A knowledge graph (KG) is an efficient tool for knowledge management. It can reuse, retrieve, and visualize knowledge in a structured way. In addition, it can discover and reason hidden knowledge from multiple perspectives. KGs provide new technical support for the construction of knowledge bases. KG technology has received a lot of attention and research since Google first proposed the concept in 2012. It is widely used in semantic retrieval, semantic question and answer, personalized recommendation, and information analysis.
A KG is essentially a semantic knowledge base with a directed graph structure based on a semantic network. It is an organic combination of a knowledge base and ontology, which describes the concepts and their relationships in the physical world in symbolic form. In a KG, the knowledge is stored in triples, such as < subject, property, object >. Subject and object are nodes of the KG that represent subject entity knowledge and object entity knowledge, respectively, and property is the edge of the KG that represents the relational knowledge (predicate) from subject to object. The basic architecture of a KG is composed of a schema layer and data layer, and its construction methods are usually divided into three modes: top-down, bottom-up, and mixed. The schema layer is the generalization knowledge, which is used to standardize and constrain the data layer. The data layer is information about the individual. The data and schema layers are mainly composed of the knowledge base with entity, relationship, and attribute. Ontology is a concept template that defines concept content, concept attributes, and concept relations. The knowledge in the schema layer is generally defined by ontology, which is a kind of knowledge base with low redundancy and hierarchical structure. When semantic relations are integrated into ontology, a KG is formed. Traditional methods of knowledge graph construction include the skeleton method, the Toronto Virtual Enterprise Ontology Project (TOVE) method, the Methontology method, and the seven-step method [39]. Among them, the seven-step method proposed by Stanford University School of Medicine is more mature and detailed and has been widely used in professional fields. It is based on the tool Protégé (https://protege.stanford.edu, accessed on 25 May 2022), which is used to build ontologies.
At present, KG technology can be divided into general knowledge graphs and vertical knowledge graphs from the perspective of application target knowledge. The general knowledge graph emphasizes the breadth of knowledge and involves common-sense knowledge. The representative large-scale common knowledge graphs include YAGO, Freebase, DBpedia, KBpedia, NELL, PROSPERA, and Wikidata. The Chinese common-sense graph includes Zhishi.me and CN-Dbpedia. The vertical knowledge graph is different from a general knowledge graph in that it is an explicit conceptualization of high-level subject domain and its specific subdomains [40]. In the process of conceptualization, expert knowledge is needed to help construct vertical domain ontology. The representative vertical domain knowledge graphs include medical knowledge graphs [41], education knowledge graphs [42], maritime product knowledge graphs [43], geoscientific knowledge graphs [44], and a COVID-19 (coronavirus disease 2019) knowledge graph [45], etc. In [45], the author mentioned that to better aid the exploration and usage of the generated COVID-19 Knowledge Graph, a web application was developed by using Biological Knowledge Miner (BiKMi), which enables users to explore and query the network visually. Because the vertical knowledge graph has a strong specialization and cohesion in its domain knowledge, it covers few domains and integrates few entities. There is no unified and mature construction process, but it develops rapidly in the application-driven. In addition, against the vast majority of KG literature, vertical domain knowledge maps are usually constructed in a top-down approach to ensure high quality in the knowledge graphs.
The above-mentioned vertical knowledge graph mainly focuses on entities and attribute relations defined in the specific domain to solve where, what, and other problems. In the causal relationship of product surface defects, there is a large number of causal event descriptions and a large amount of causal event logic knowledge related to design and manufacturing. The knowledge graph of entity and attribute relation type is not ideal for the expression of this part of knowledge, not fully expressing the causal knowledge that relates design, manufacture, and other aspects, such as the corresponding knowledge about countermeasures. The causal event knowledge graph takes events as the core concept and focuses on the events triggered by predicates and their logical relationships. It not only reflects the essence of events, but also shows the development law of events, and pays attention to how to solve the problem while tracing the causal knowledge. As a new type of knowledge graph, it has attracted researchers’ attention. Hoang Long et al. [46] proposed a knowledge graph of social events, which took the description of social events as the core. Then, these events were decomposed into four types, such as person, time, place, and event, and corresponding attributes were constructed, which increased the understanding and causal traceability of social events. Hellweg F et al. [47] established the manufacturing cost estimation domain ontology, which increased the traceability of the manufacturing cost, and the knowledge graph was instantiated with the manufacturing information on electric wheel shaft gears. Zeng et al. [48] established the knowledge graph of the causal relationships of train equipment failure, which increased the understanding of failure law and failure cause in railway train equipment.
In summary, event knowledge has been used in manufacturing, social events, and other fields. It mainly takes events as nodes and edges as relations between events, reflecting the logic relation between events, but it has not been applied to the causality tracing of the surface defects of industrial products. The above research provides reference for constructing a causal knowledge graph of product surface defects. Through analyzing the formation mechanism of the surface defects of industrial products, and from the analysis of the causes of the surface defects of industrial products, the causal knowledge of surface defects can be fully excavated and displayed by the way of “defect type-cause analysis-solution countermeasures”. It provides a reference for the decision maker to analyze the follow-up problems and make the overall optimization scheme. It is also enough to illustrate the feasibility of constructing causal knowledge of product surface defects through knowledge graph technology.

2.3. Research on Image Semantic Refinement Recognition of Product Surface Defects Based on Causal Knowledge

From the above analysis, it can be seen that, in a macroscopic aspect, the research on the neural network structure for the classification and detection of product surface defects is more in-depth. In a microscopic aspect, KG technology is deeply studied in product knowledge representation. However, it is relatively weak that the application research that fuse these two aspects together realize the output data of the network model to drive the defect cause visualization of causal knowledge graph. Either from the angle of technical management or cost control, it is very important to classify the types of surface defects and analyze the causal knowledge. The integration of these two aspects can make corresponding solutions, such as adjusting product process drawing or process equipment design. Therefore, it is necessary to explore an integrated knowledge representation method combining computer vision technology and knowledge graph technology to assist the optimization of product quality. At present, knowledge representation combining computer vision and knowledge graphs belongs to a multi-modal information processing process. This kind of multi-modal information processing is still limited in the field of intelligent manufacturing and there is some research in other fields. Thanasis Mavropoulos et al. [49] combined computer vision, speech recognition, data representation, sensor data analysis, and other advanced technologies to analyze and collect information about patients by observing the behavior of patients, which dramatically improved the efficiency of medical staff to collect information. In visual Q & A, S. Toor [50] proposed a multimodal biometrics technology through the fusion of computer vision technology and natural language processing technology, which achieved the classification of biological features and related to the detailed description of the feature. Hong et al. [51] constructed a hierarchical feature network (HFnet), based on encoding visual semantics, by using low-level and higher-order features of CNN, which realized answer reasoning by learning high-level features of images. Pan et al. [52] proposed a video2entities framework that combines the perceptual ability of computer vision with the cognitive ability of the KG to extract invisible entities from videos and update them to the KG through ZSL (zero-shot learning) technology, which solved the problem of invisible entities recognition and enriched the semantic information of images.
Through the analysis of computer vision technology and knowledge graph technology, we can see that it is completely feasible to integrate computer vision technology and KG technology to extract features and represent feature knowledge. The classification of product surface defects is realized by computer vision classification technology and the causal knowledge of surface defects is expressed by KG technology, thus enriching the image semantic knowledge of product surface defects. Based on this, the current research on image semantic refinement recognition of product surface defects based on causal knowledge aims at realizing the causal visualization of the defects in the causal knowledge graph driven by the output data of the network model. Firstly, a convolutional neural network model was constructed. Then, the defect causal knowledge graph was constructed. Then, the output data of the defect type of the convolutional neural network model was connected with the corresponding nodes in the knowledge graph to drive the visualization of the defect cause in the causal knowledge graph. Finally, web applications were developed to better help explore and visualize the causal knowledge graph. In the whole experiment, we use the surface defect images of Tianchi industrial aluminum profiles (https://tianchi.aliyun.com/competition/entrance/231682/information, accessed on 30 May 2022) as the image dataset.

3. The Framework of the Proposed Method and the Data Required for the Experiment

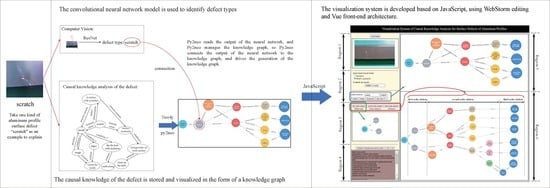
3.1. Overall Framework

The research on image semantic refinement recognition of product surface defects based on causal knowledge is a combination of computer vision recognition technology and KG technology. The convolutional neural network realizes the recognition and classification of surface defects, and then the output data of the network drives the causal visualization of the defects in the causal knowledge graph. It is a way of associating external knowledge. Therefore, this work involves computer vision classification technology and knowledge mapping technology. Its overall architecture is shown in Figure 1.

3.1.1. Image Classification in Computer Vision

(1)
Selection of convolutional neural network model
Image classification, object detection, and image segmentation are the three major tasks in the field of computer vision. Feature extraction is carried out by a feature extractor (convolution kernel). The channels in the shallow layer learn the simple basic features, such as colors and points, at the beginning. With the increase of layers, these channels start to learn the features of line segments and edges. The deeper the layer, the more specific and abstract the features learned. Deep neural network (DNN) is widely used in image classification, detection, and semantic segmentation due to its powerful feature extraction and feature representation in convolutional layers. Feature extraction is the most critical step in DNN. The quality of feature extraction directly affects the accuracy and relevant evaluation standards in image classification, detection, and semantic segmentation.
The ResNet network model is a kind of deep convolutional neural network model. In the application of image classification, the image data are convolved and pooled by multiple filters in the network to extract the edge features, such as cracks, sizes, surface defects, and so on. ResNet generally includes a convolution layer, pooling layer, local normalization layer, activation function layer, and full connection layer.
At the same time, the essential difference between ResNet and other convolutional neural networks (such as VGG) is residual structure. The residual structure is introduced into ResNet, proposed by He et al. [18], which successfully solves the problems of gradient disappearance, gradient explosion, and model degradation. Residual blocks are the powerful part of ResNet network, which uses the shortcut to transfer the high-quality weight x from the previous layer to the next layer. In this way, even if the middle layer F ( x ) is poorly trained and the training error is large, the training result of the upper layer is not affected. The residual output is H ( x ) , as shown in Equation (5).
H ( x ) = F ( x ) + x  
According to the different positions of residual structure, there are two main structures: identity mapping and projection mapping. The first structure is shown in Figure 2a, which is adopted when the input dimension and the output dimension are the same, including a convolution layer (Conv) with a 3 × 3 convolutional kernel, a batch normalization layer (BN), and an activation function layer (ReLu). The second structure, shown in Figure 2b, is used when the input dimension and the output dimension are different. In this structure, a 1 × 1 convolution kernel is added to the shortcut line for channel dimension raising to ensure that the output dimension of the shortcut line is consistent with that of the main line. On the premise of improving model precision, the deepest ResNet network structure reaches more than 1000 layers, and the commonly used ones are ResNet18, ResNet34, ResNet50, Resnet101 and ResNet152. Considering the equipment environment and the difficulty of image training, ResNet101 was used as the classification model in this work.
(2)
Introduction of deformable convolution modules
Conventional convolutional kernels are usually fixed in size and shape and have poor adaptability to unknown changes, which limits the modeling ability of the geometric transformation of network models. As shown in Figure 3a, the size and shape of the 3 × 3 convolution kernel are fixed, and the capability of geometric modeling in the convolution process is inadequate. According to the actual shape of the feature map, the deformable convolution kernel can learn the offset ability from the parallel convolution layer and focus on the region of interest so as to better extract the input features. As shown in Figure 3b–d, each element of the convolution kernel is shifted according to certain rules and the sampling position is also shifted, which improves the recognition and detection ability of irregular objects, non-rigid objects, and objects in complex environments [53]. Figure 4 shows the calculation process of the convolution kernel. The offset is calculated for the input feature graph using the convolution layer and the offset has the same resolution as the output feature map.
For an input feature map x and an output feature map y in a conventional two-dimensional convolution, the mathematical model of the convolution can be expressed as Equation (6).
y ( P n ) = P n R W ( P n ) × x ( P 0 + P n )
In the formula, R defines a 3 × 3 convolution kernel with an expansion rate of 1, which enumerates all positions in the output eigenmap. Where R = {(1, 1), (1, 0), (1, 1), …, (1, −1), (1, 0), (1, 1)}, W ( · ) is the weight corresponding to the sampling point.
In deformable convolution, the regular grid is extended by adding an offset ( { Δ p n | n = 1 , 2 , , n , N = | R | } ) and the filter deforms. The mathematical model of the deformed convolution can be expressed as Equation (7).
y ( p 0 ) = p n R w ( p n ) × x ( p 0 + p n + Δ p n )
where n is the number of sampling locations and p _ 0 + p _ n is the offset of the sampling position. The process of deformable convolution is shown in Figure 3.
Since the offset is a decimal, it needs to be converted to an integer by a bilinear interpolation algorithm, as shown in Equation (8).
x ( p ) = q G ( q , p ) × x ( q )
where p represents any position after offset ( p = p 0 + p n + Δ p n ) and enumerates the spatial position of all feature maps x . G ( · ) is the kernel of bilinear interpolation.
G is a two-dimensional vector, which can be expressed as the product of two one-dimensional vectors, as shown in Equation (9).
G ( q , p ) = g ( q x , p x ) × g ( q y , p y )
where g ( q x , p x ) and g ( q y , p y ) can be calculated by the following Equations (10) and (11).
g ( q x , p x ) = max ( 0 , 1 | q x p x | )
g ( q y , p y ) = max ( 0 , 1 | q y p y | )
The offset can be learned by a backpropagation algorithm. In contrast to conventional standard convolutions, deformable convolutions contain the definition of standard convolution and can change and adjust their own shapes according to the demand of feature extraction, which provides more choices for the convolutional neural network in feature extraction, and has high adaptability to sample feature extraction [54].
Figure 5 shows the comparison between the feature point receptive fields of conventional convolution and deformable convolution. Take the defect (such as scratch) on the surface of an aluminum profile as an example. By comparison, it can be seen that the feature points of conventional convolution have a fixed size receptive field, while the deformable convolution can adaptively learn the sampling location of receptive field. Because the receptive field is more consistent with the shape and size of the object, it is more advantageous to feature extraction.
(3)
Improved ResNet network model
Res-DBR (ResNet101 + Deformable conv + BN + ReLu) is a residual network module with deformable convolution. The module consists of a transformable convolutional layer, a BN layer, and an activation layer. ‘Res’ stands for ResNet101. ‘DBR’ stands for Deformable conv, BN, and ReLu. The image input size is 224 × 224 × 3. Experimental results show that the accuracy of the model is higher when deformable convolution is added to the residual branch, as shown in Figure 6.

3.1.2. Construction Process of Knowledge Graph

The construction process of a knowledge graph is essentially a process in which the required knowledge is obtained and organized into a whole in an appropriate form and method. The main content of this paper is how to enrich the semantic information of surface defect images through knowledge graph technology and realize the causal visualization of the defects in a causal knowledge graph driven by the output data of the network model. Therefore, the text content of the surface defect needs to correspond to the information contained in the surface defect image. However, in practical engineering, it is difficult to obtain the text dataset of surface defect causes and the image dataset of surface defects at the same time, so to make our research succeed, we finally chose to obtain the text dataset of surface defect causes from the Internet to form the text dataset of the experiment. First, it was necessary to collect data about the subjects through the Internet and to extract entities, attributes, and relationships from it. Second, the scheme layer of a knowledge graph, namely the construction of surface defect knowledge ontology, was designed and completed. Then, the data layer of a knowledge graph was stored in the Neo4j graph database. After that, query and visualization of knowledge were performed based on the existing data in the KG.
The research framework for this section is shown in Figure 7.

3.2. Data Collection and Preprocessing

The data introduced in this paper mainly consist of two parts. One is the surface defect image dataset, and the other is surface defect text description data.

3.2.1. Selection and Preprocessing of Surface Defect Dataset for Industrial Products

After considering several datasets of the surface defects of industrial products, Tianchi aluminum profile surface defect picture dataset was finally selected. Four kinds of defects, such as scratch, bump, al-powder, and dirty spot were selected. The total number of images is 465, and the image pixel size is 2560 × 1920. In order to extract the relevant information of the sample data more easily, it was necessary to preprocess the data before the network model training, which includes data enhancement, image sample labeling, and dataset partitioning.
In the marking processing, natural numbers are used to express the category: 1 represents scratch, 2 represents bump, 3 represents al-powder, 4 represents dirty spot. The label of the picture sample is bound with the picture corresponding to the sample data. The category sample of the experimental dataset is shown in Figure 8. At the same time, in order to ensure the generalization ability of the model, the dataset is enhanced by increasing brightness, color enhancement, contrast enhancement, affine transformation, rotation, perspective deformation, elastic distortion, etc. The number of images before and after the expansion is shown in Figure 9 below, with a total of 4336 images.
The dataset contains four types of surface defect images. The sample numbers of scratch, bump, al-powder, and dirty spot in the training set are 1015, 905, 888, and 987, respectively. In addition, that in the validation set are 145, 129, 127, and 140, respectively. The division of the entire dataset is shown in Table 1.

3.2.2. Text Data Acquisition and Preprocessing

The method of data collection was manual collection and processing. The surface defect type and their formation mechanism of aluminum profiles are the contents of the aluminum profile manufacturing field. Therefore, the description of the surface defects of aluminum profiles is distributed in the official website of the major aluminum manufacturers. In order to ensure the accuracy of data collection, we needed to collect data on the websites of major manufacturers and the related literature, and eventually form four categories: defect type, feature, cause, and solution. Taking into account the manufacturing process of aluminum profiles, the “cause” and “solution” are divided into four sub-categories respectively: “surface treatment”, “extrusion”, “casting”, and “mould”, as shown in the Figure 10 below.

4. Experiments on Convolutional Neural Network and Construction of Surface Defect Ontology

4.1. Convolutional Neural Network Experiment

After the surface defect datasets are completed, the network model needs to be trained. In this work, the ResNet101 neural network was constructed by Pytorch, trained by GPU, and accelerated by cudnn. The GPU is RTX3060 and the CPU is core i7. In the experiment, the network model was pretrained first. The training and test datasets selected the divided datasets. The learning rate was set to 0.001. The training mode was set to multistep and the batch size in the training was set to 128. The maximum training times was set to 100, and the test was taken after each training session. In order to evaluate the performance of ResNet101 fused with deformable convolutions, we needed to compare the experimental results on datasets before and after the introduction of deformable convolutions under the same experimental environment.
To determine the appropriate place to add deformable convolutions in ResNet101, experiments were carried out by adding deformable convolution modules to the beginning (first layer) and middle (containing trunk and shortcut branches) of the network model input. The deformable convolution modules consists of a deformable convolve layer, a BN layer, and a ReLu layer, namely the deformable convolution module = DeformConv + BN + ReLu. The construction of the model is shown in Table 2. Line 1 represents the direct training of the partitioned dataset in the ResNet101 model. Line 2 represents that the deformable convolution module is added only at the beginning of the input of ResNet101, which can be understood as adding the deformable convolution module to the head of the network. Line 3 represents the addition of deformable convolution modules to the trunk part and the shortcut branch part of ResNet101, which can be understood as adding deformable convolution modules to the middle of the network. Line 4 represents the addition of deformable convolution modules in the head and middle of ResNet101. The evaluation index of the training effect of the network model is the accuracy and cross-entropy loss. By comparing the training set’s and validation set’s accuracy with the cross-entropy loss value, we can determine that the network model with the deformable convolution module in the middle of the network is better. Therefore, we chose the ResNet101 network model with deformable convolution in the middle.
Confusion matrix, accuracy, recall, and precision are common evaluation indices of classification problems. The ResNet101 network model was tested on a dataset of 560 surface defect samples. The resulting four-classification confusion matrix is shown in Table 3.
The four-classification confusion matrix in Table 3 is normalized to preserve three significant digits after the decimal point, as shown in Figure 11.
The ResNet101 network model with deformable convolution is validated on a dataset of 560 surface defect samples, obtaining a four-classification confusion matrix, as shown in Table 4.
After the normalization of the four-classification confusion matrix of the introduced deformable convolution ResNet101 network model, three significant digits after the decimal point are retained, as shown in Figure 12.
The accuracy of the two models is calculated from the experimental data in the confusion matrices in Table 5 and Table 6. The accuracy of the ResNet101 model is 86.6% on the validation set, and the model with deformable convolution is 96.6%, which is improved by 11%. Similarly, the accuracy and recall are calculate as shown in Table 5 and Table 6.
According to Table 5 and Table 6 above, the average precision rate and recall rate of the ResNet101 network model are 88.5% and 88.45%, respectively. The average precision rate and recall rate of Deform_ResNet101 are 96.8% and 96.6%, respectively. The ResNet101 network model with deformable convolution improves the precision and recall rate by 8.3% and 8.15%, respectively, on the whole. The results in Table 5 and Table 6 verify that the introduction of deformable convolution can obtain more information related to task objectives for the characteristic parameters extracted from network model ResNet101 and abandon other useless or minor information.

4.2. Ontology Construction of Aluminum Profile Surface Defect

4.2.1. Methods of Constructing Ontology

A top-down approach is used to construct a causal knowledge graph of surface defects. Firstly, the schema layer of the knowledge graph is defined by constructing domain ontology. Secondly, entities, attributes, and relationships between entities are extracted from various types of data sources. Finally, the graph database Neo4j is used to store the data of the KG.
The construction of a causal knowledge graph for surface defects is oriented to the analysis of a specific defect formation mechanism. Moreover, the standardization of field terms and the wide applicability of concept categories, as well as the hierarchical structure of the concepts in the abstract field, are considered. The related attributes of each concept and the relationship between concepts are defined [55]. We used the seven-step method published by Stanford University to manually construct the domain ontology, the domain ontology with the four elements of “Type—Feature—Cause—Solution” for the defect as the core, and elements related to defect subjects, manufacturing tools, technological process, and other entities, as shown in Figure 13.
Entities, relationships, and attributes are extracted from each category and their information is shown in the following table.
(1)
Entity extraction: Four types of surface defects of aluminum profiles are selected and the entity types of defects are shown in Table 7.
(2)
Relational extraction: The extraction of the surface defect relationship needs to integrate relevant manufacturing tools, manufacturing processes, and other information so that complex defect causes can be expressed as the relationship between various processes and redundant information can be effectively removed, as shown in Table 8.
(3)
Attribute extraction: Information is extracted from the formation mechanism and solution of each defect type as the relevant explanations of entity or relationship. The results of the partial attribute extraction are shown in Table 9.
The extraction of relations and attributes is based on the formation mechanism of surface defects, especially the manufacturing process information of aluminum profiles. Take the “scratch” defect as an example to supplement the relevant process information. The description of the defect information is gradually structured by adding entities, such as “mould”, “surface treatment”, and “cause site”, as well as relationships and attributes, such as “condition”, “solution countermeasure”, etc., as shown in Figure 14.

4.2.2. Storage of Knowledge

Considering the ease of use and stability, “Python + Neo4j” technology is adopted to create and store the KG of surface defects. Neo4j is a high-performance NoSQL graphics database that stores structured data on the network rather than in tables. Neo4j is also a high-performance graphics engine with graph computing capabilities. This work uses the Python language to operate the Neo4j graph database with Cypher statements through the py2neo library. Py2neo (https://github.com/py2neo-org/py2neo, accessed on 25 May 2022) is a community third-party library that makes it easier to use Python to operate Neo4j. In the Neo4j graph database, the four-component ontology model is described by labels, nodes, relations, and attributes. The detailed description is shown in Table 10. The specific method of creating atlas elements is as follows: Use create () statement to create nodes, node labels, and node attributes. Use match (), then create () statements to create the relationships and relationship attributes between two nodes. The loading, searching, matching, and sorting of the graph elements, such as entity, relation, and attribute, can be realized by using return (), where (), and match (). After the graph elements are created, all nodes are connected by relations to form a knowledge network that can express the logical chain implied by the data relations. It is stored in the Neo4j graph database in the form of a graph structure.
According to the knowledge structure diagram in Figure 14, the structured information is visualized through the Neo4j platform, and the refined defect knowledge graph is shown in Figure 15 below. The description of visible defect information is fully displayed through the relationships and attributes among entities, and more connections are generated among entities.

5. Development of Web Visualization System

In order to better help to explore and generate a causal knowledge graph, and also to better drive the generation of the causal knowledge graph through the output data of the convolutional neural network so as to better visualize the causal knowledge of surface defects, we need to develop a visualization system. The system is developed based on JavaScript, using WebStorm editing and Vue front-end architecture. It mainly includes a classification module of aluminum profile surface defects and a database module of corresponding causal knowledge. The Browser/Server (B/S) mode application system based on web development has three layers of architecture, which are the image classification layer, data layer, and user layer. The overall architecture is shown in Figure 16 below.

5.1. Image Classification Layer

The convolutional neural network model is the main part of the image classification layer, which realizes the classification of image defects. The network model is a trained defect recognition and classification network based on the Pytorch framework. The main framework of the network can be the Res-DBR network model proposed in this paper, or other network models (such as MobileNet). The network model automatically classifies the defect pictures, which need to be classified as long as the user inputs them into the network models.

5.2. Data Layer

The data layer is a graphical database that stores the causal knowledge of all defects. The knowledge is stored in Neo4j according to the storage structure of “defect type-cause-solution”. Query, storage, and management of data are realized by the py2neo module. At the same time, the output data of the network model is connected with the corresponding data node of Neo4j by py2neo.

5.3. User Layer

The user layer is a user-friendly, interoperable, and fully functional visual interface. After entering the system interface, the formation mechanism analysis visualization system is divided into six regions, which realizes the loading of pictures, the classification of pictures, and the visualization of the causal knowledge implied by the picture.
Shown in Figure 17 below, the whole visualization system interface contains the defect picture loading region (Region 1), convolutional neural network selection region (Region 2), defect knowledge graph display level region (Region 3), causal knowledge textualization region (Region 4), and knowledge graph display region (Region 5). Region 1 is used to load the pictures to be classified. Region 2 is where the appropriate network is selected to identify and classify the loaded defect images, and the corresponding causal knowledge is displayed in Region 5 according to the output classification results. Region 3 is for the selection of the display levels for all defect knowledge graphs, with the first-order showing the “defect type”, the second-order showing the “cause analysis”, and the third-order indicating the “solution”. In Region 4, the causal knowledge in the knowledge graph is converted into text, which is convenient for the subsequent text processing work of technical personnel. Region 5 and Region 6 are “parent-child” level display relationships that facilitate the overall and partial control of the defect knowledge graph.

6. Conclusions

In order to solve the problem that information about defective design and manufacturing related to product surface defects is difficult to find and use, in this paper, we discuss how to enhance the representation of the causal knowledge behind the defect image through the knowledge graph, so as to enhance the image semantics of product surface defects. We took the dataset of surface defects in Tianchi Industrial Aluminum Profiles as an example to carry out the experiment. Our contributions can be summarized as follows:
(1)
Given the irregular defects on the surface of industrial products, an improved ResNet deep convolutional neural network model is proposed and verified on the dataset of surface defects. The results show that the improved network model’s average accuracy, recall, and precision are increased by 11%, 8.15%, and 8.3%, respectively, effectively improving its classification effect.
(2)
Based on the four elements of “defect type, characteristic, cause, and solution”, we constructed the knowledge graph of aluminum profile surface defects, which realizes the storage and visual representation of causal knowledge about aluminum profile surface defects.
(3)
By establishing a web visualization platform, the deep convolutional neural network model was integrated with the causal knowledge graph to realize the causal visualization of the defects in the causal knowledge graph driven by the output data of the network model.
In the future, we will explore in the following directions:
(1)
We will increase the types of defects in future work and conduct a more detailed analysis of the causes of surface defects.
(2)
We will design the corresponding application according to the framework structure. For example, KBQA (knowledge graph question answering) has a broad application prospect in solving the causes of product surface defects. Fast response to the causes of defects can be achieved through KBQA.

Author Contributions

All authors contributed to the writing and revisions; data pre-processing, writing—original draft preparation, W.Z.; conceptualization, T.Z.; writing—review and editing, L.Y. and Y.L.; investigation, P.Y. All authors have read and agreed to the published version of the manuscript.

Funding

National Natural Science Foundation (Grant No. 72061006, 71761007); Academic New Seedling Foundation Project of Guizhou Normal University (Grant No. Qianshixinmiao- [2021] A30); Growth Project for Young Scientific and Technological Talents in General Colleges and Universities of Guizhou Province (Grant No. Qianjiaohe KY [2022] 167); Guizhou Provincial Science and Technology Projects (Grant No. Qiankehejichu-ZK [2022] General 320).

Institutional Review Board Statement

Not applicable.

Informed Consent Statement

Not applicable.

Data Availability Statement

Data is not available due to restrictions of privacy or ethical.

Conflicts of Interest

The authors declare no conflict of interest.

References

  1. Chen, Y.; Ding, Y.; Zhao, F.; Zhang, E.; Wu, Z.; Shao, L. Surface Defect Detection Methods for Industrial Products: A Review. Appl. Sci. 2021, 11, 7657. [Google Scholar] [CrossRef]
  2. Vuković, M.; Thalmann, S. Causal Discovery in Manufacturing: A Structured Literature Review. J. Manuf. Mater. Process. 2022, 6, 10. [Google Scholar] [CrossRef]
  3. Gao, H.; Zhang, Y.; Lv, W.; Yin, J.; Qasim, T.; Wang, D. A Deep Convolutional Generative Adversarial Networks-Based Method for Defect Detection in Small Sample Industrial Parts Images. Appl. Sci. 2022, 12, 6569. [Google Scholar] [CrossRef]
  4. Akram, M.W.; Li, G.; Jin, Y.; Chen, X.; Zhu, C.; Zhao, X.; Khaliq, A.; Faheem, M.; Ahmad, A. CNN based automatic detection of photovoltaic cell defects in electroluminescence images. Energy 2019, 189, 116319. [Google Scholar] [CrossRef]
  5. Alipour, M.; Harris, D.K.; Miller, G.R. Robust Pixel-Level Crack Detection Using Deep Fully Convolutional Neural Networks. J. Comput. Civ. Eng. 2019, 33, 854. [Google Scholar] [CrossRef]
  6. Hedberg, T.D.; Bajaj, M.; Camelio, J.A. Using Graphs to Link Data Across the Product Lifecycle for Enabling Smart Manufacturing Digital Threads. J. Comput. Inf. Sci. Eng. 2019, 20, 011011. [Google Scholar] [CrossRef]
  7. Dombrowski, U.; Reiswich, A.; Imdahl, C. Knowledge Graphs for an Automated Information Provision in the Factory Planning. In Proceedings of the 2019 IEEE International Conference on Industrial Engineering and Engineering Management (IEEM), Singapore, 15–19 December 2019; pp. 1074–1078. [Google Scholar] [CrossRef]
  8. Zhou, Y.; Sun, Y.; Honavar, V. Improving Image Captioning by Leveraging Knowledge Graphs. In Proceedings of the IEEE Winter Conference on Applications of Computer Vision (WACV), Waikoloa, HI, USA, 4–8 January 2019; pp. 283–293. [Google Scholar] [CrossRef]
  9. Zhang, D.; Cui, M.; Yang, Y.; Yang, P.; Xie, C.; Liu, D.; Yu, B.; Chen, Z. Knowledge Graph-Based Image Classification Refinement. IEEE Access 2019, 7, 57678–57690. [Google Scholar] [CrossRef]
  10. Menglong, C.; Detao, J.; Ting, Z.; Dehai, Z.; Cheng, X.; Zhibo, C.; Xiaoqiang, X. Image Classification Based on Image Knowledge Graph and Semantics. In Proceedings of the IEEE 23rd International Conference on Computer Supported Cooperative Work in Design (CSCWD), Porto, Portugal, 6–8 May 2019. [Google Scholar] [CrossRef]
  11. Huang, B.; He, B.; Wu, L.; Lin, Y. A Deep Learning Approach to Detecting Ships from High-Resolution Aerial Remote Sensing Images. J. Coast. Res. 2020, 111, 16–20. [Google Scholar] [CrossRef]
  12. Li, X.; Liu, B.; Zheng, G.; Ren, Y.; Zhang, S.; Liu, Y.; Gao, L.; Liu, Y.; Zhang, B.; Wang, F. Deep-learning-based information mining from ocean remote-sensing imagery. Natl. Sci. Rev. 2020, 7, 1584–1605. [Google Scholar] [CrossRef]
  13. Zhao, F.; Li, J.; Zhang, L.; Li, Z.; Na, S.-G. Multi-view face recognition using deep neural networks. Futur. Gener. Comput. Syst. 2020, 111, 375–380. [Google Scholar] [CrossRef]
  14. Li, X.; Li, Y.; Cao, Y.; Duan, S.; Wang, X.; Zhao, Z. Fault Diagnosis Method for Aircraft EHA Based on FCNN and MSPSO Hyperparameter Optimization. Appl. Sci. 2022, 12, 8562. [Google Scholar] [CrossRef]
  15. Islam, M.; Hossain, B.; Akhtar, N.; Moni, M.A.; Hasan, K.F. CNN Based on Transfer Learning Models Using Data Augmentation and Transformation for Detection of Concrete Crack. Algorithms 2022, 15, 287. [Google Scholar] [CrossRef]
  16. Ryselis, K.; Blažauskas, T.; Damaševičius, R.; Maskeliūnas, R. Agrast-6: Abridged VGG-Based Reflected Lightweight Architecture for Binary Segmentation of Depth Images Captured by Kinect. Sensors 2022, 22, 6354. [Google Scholar] [CrossRef]
  17. Bang, J.; Di Marco, P.; Shin, H.; Park, P. Deep Transfer Learning-Based Fault Diagnosis Using Wavelet Transform for Limited Data. Appl. Sci. 2022, 12, 7450. [Google Scholar] [CrossRef]
  18. He, K.; Zhang, X.; Ren, S.; Sun, Q. Deep residual learning for image recognition. In Proceedings of the IEEE Conference on Computer Vision and Pattern Recognition, Las Vegas, NV, USA, 27–30 June 2016; pp. 770–778. [Google Scholar]
  19. Wang, J.; Deng, F.; Wei, B. Defect Detection Scheme for Key Equipment of Transmission Line for Complex Environment. Electronics 2022, 11, 2332. [Google Scholar] [CrossRef]
  20. Zhou, Y.; Chang, H.; Lu, Y.; Lu, X. CDTNet: Improved Image Classification Method Using Standard, Dilated and Transposed Convolutions. Appl. Sci. 2022, 12, 5984. [Google Scholar] [CrossRef]
  21. Zhao, D.; Tian, X. A Multiscale Fusion Lightweight Image-Splicing Tamper-Detection Model. Electronics 2022, 11, 2621. [Google Scholar] [CrossRef]
  22. Wang, T.; Xu, X.; Pan, H.; Chang, X.; Yuan, T.; Zhang, X.; Xu, H. Rolling Bearing Fault Diagnosis Based on Depth-Wise Separable Convolutions with Multi-Sensor Data Weighted Fusion. Appl. Sci. 2022, 12, 7640. [Google Scholar] [CrossRef]
  23. Dai, J.; Qi, H.; Xiong, Y. Deformable convolutional networks. In Proceedings of the IEEE International Conference on Computer Vision, Venice, Italy, 22–29 October 2017; pp. 764–773. [Google Scholar]
  24. Nanni, L.; Brahnam, S.; Paci, M.; Ghidoni, S. Comparison of Different Convolutional Neural Network Activation Functions and Methods for Building Ensembles for Small to Midsize Medical Data Sets. Sensors 2022, 22, 6129. [Google Scholar] [CrossRef]
  25. Shong, Y.; Gao, X.; Zhang, D. The piecewise non-linear approximation of the sigmoid function and its implementation in FPGA. Appl. Electron. Tech. 2017, 43, 49–51. [Google Scholar]
  26. Yan, Z.; Liu, H. SMoCo: A Powerful and Efficient Method Based on Self-Supervised Learning for Fault Diagnosis of Aero-Engine Bearing under Limited Data. Mathematics 2022, 10, 2796. [Google Scholar] [CrossRef]
  27. Zhai, S.; Wu, H.; Kumar, A. S3pool: Pooling with stochastic spatial sampling. In Proceedings of the IEEE Conference on Computer Vision and Pattern Recognition, Honolulu, HI, USA, 21–26 July 2017; pp. 4970–4978. [Google Scholar]
  28. Zhang, Y.; Liu, X.; Guo, J.; Zhou, P. Surface Defect Detection of Strip-Steel Based on an Improved PP-YOLOE-m Detection Network. Electronics 2022, 11, 2603. [Google Scholar] [CrossRef]
  29. Lu, Y.; Qiu, Z.; Liao, C.; Zhou, Z.; Li, T.; Wu, Z. A GIS Partial Discharge Defect Identification Method Based on YOLOv5. Appl. Sci. 2022, 12, 8360. [Google Scholar] [CrossRef]
  30. Shi, L.; Long, Y.; Wang, Y.; Chen, X.; Zhao, Q. Evaluation of Internal Cracks in Turbine Blade Thermal Barrier Coating Using Enhanced Multi-Scale Faster R-CNN Model. Appl. Sci. 2022, 12, 6446. [Google Scholar] [CrossRef]
  31. Fu, R.; He, J.; Liu, G.; Li, W.; Mao, J.; He, M.; Lin, Y. Fast Seismic Landslide Detection Based on Improved Mask R-CNN. Remote Sens. 2022, 14, 3928. [Google Scholar] [CrossRef]
  32. Hu, J.; Shen, L.; Sun, G. Squeeze-and-excitation networks. In Proceedings of the IEEE Conference on Computer Vision and Pattern Recognition, Salt Lake City, UT, USA, 18–23 June 2018; pp. 7132–7141. [Google Scholar]
  33. Wang, K.; Liew, J.H.; Zou, Y. Panet: Few-shot image semantic segmentation with prototype alignment. In Proceedings of the IEEE/CVF International Conference on Computer Vision, Seoul, Korea, 27–28 October 2019; pp. 9197–9206. [Google Scholar]
  34. Han, K.; Wang, Y.; Tian, Q. Ghostnet: More features from cheap operations. In Proceedings of the IEEE/CVF Conference on Computer Vision and Pattern Recognition, Seattle, WA, USA, 14–19 June 2020; pp. 1580–1589. [Google Scholar]
  35. Yang, K.; Fang, C.; Duan, L. Automatic detection of casting defects based on deep learning model fusion. Chin. J. Sci. Inst. 2021, 12, 100. [Google Scholar]
  36. Xie, Q.; Wang, N.; Yang, Y.J. Detection and Evaluation of Welded Joints of Steel Structures with Defects. J. Mech. Eng. 2021, 134, 28–37. [Google Scholar]
  37. Zhang, S.J.; Jin, Z.L. Casting Defect Detection Method Based on Multi Model Cascade and Binocular Vision. J. Mech. Eng. 2021, 58, 34–43. [Google Scholar]
  38. Li, B.; Wang, C.; Ding, X.Y. Surface defect detection algorithm based on improved YOLOv4. J. Beijing Univ. Aeron. Astron. 2021, 1631, 012081. [Google Scholar]
  39. Yan, J.; Lv, T.; Yu, Y. Construction and Recommendation of a Water Affair Knowledge Graph. Sustainability 2018, 10, 3429. [Google Scholar] [CrossRef]
  40. Deng, J.; Wang, T.; Wang, Z.; Zhou, J.; Cheng, L. Research on event logic knowledge graph construction method of robot transmission system fault diagnosis. IEEE Access 2022, 10, 17656–17673. [Google Scholar] [CrossRef]
  41. Gong, F.; Wang, M.; Wang, H.; Wang, S.; Liu, M. SMR: Medical Knowledge Graph Embedding for Safe Medicine Recommendation. Big Data Res. 2020, 23, 100174. [Google Scholar] [CrossRef]
  42. Shi, D.; Wang, T.; Xing, H.; Xu, H. A learning path recommendation model based on a multidimensional knowledge graph framework for e-learning. Knowl.-Based Syst. 2020, 195, 105618. [Google Scholar] [CrossRef]
  43. Zhang, Q.; Wen, Y.; Zhou, C.; Long, H.; Han, D.; Zhang, F.; Xiao, C. Construction of Knowledge Graphs for Maritime Dangerous Goods. Sustainability 2019, 11, 2849. [Google Scholar] [CrossRef]
  44. Wei, Z.; Wan, G.; Mu, Y.; Liu, L.; Hu, X. Design and Construction of Geographic Knowledge Graph. In Proceedings of the IEEE, 9th Joint International Information Technology and Artificial Intelligence Conference (ITAIC), Chongqing, China, 11–13 December 2020; pp. 2252–2256. [Google Scholar] [CrossRef]
  45. Domingo-Fernández, D.; Baksi, S.; Schultz, B. COVID-19 Knowledge Graph: A computable, multi-modal, cause-and-effect knowledge model of COVID-19 pathophysiology. Bioinformatics 2021, 37, 1332–1334. [Google Scholar] [CrossRef]
  46. Nguyen, H.L.; Jung, J.J. Social event decomposition for constructing knowledge graph. Futur. Gener. Comput. Syst. 2019, 100, 10–18. [Google Scholar] [CrossRef]
  47. Hellweg, F.; Brückmann, H.; Beul, T.; Mandel, C.; Albers, A. Knowledge graph for manufacturing cost estimation of gear shafts-a case study on the availability of product and manufacturing information in practice. Procedia CIRP 2022, 109, 245–250. [Google Scholar] [CrossRef]
  48. Zeng, Y.; Qin, Y.; Liu, D.; Fu, Y.; Gong, M.; Zhang, X. Railway Train Device Fault Causality Model Based on Knowledge Graph. In Proceedings of the International Conference on Sensing, Diagnostics, Prognostics, and Control (SDPC), Beijing, China, 5–7 August 2020; pp. 385–390. [Google Scholar] [CrossRef]
  49. Mavropoulos, T.; Symeonidis, S.; Tsanousa, A.; Giannakeris, P.; Rousi, M.; Kamateri, E.; Meditskos, G.; Ioannidis, K.; Vrochidis, S.; Kompatsiaris, I. Smart integration of sensors, computer vision and knowledge representation for intelligent monitoring and verbal human-computer interaction. J. Intell. Inf. Syst. 2021, 57, 321–345. [Google Scholar] [CrossRef]
  50. Toor, A.S.; Wechsler, H.; Nappi, M. Biometric surveillance using visual question answering. Pattern Recognit. Lett. 2019, 126, 111–118. [Google Scholar] [CrossRef]
  51. Hong, J.; Fu, J.; Uh, Y.; Mei, T.; Byun, H. Exploiting hierarchical visual features for visual question answering. Neurocomputing 2019, 351, 187–195. [Google Scholar] [CrossRef]
  52. Pan, Z.; Su, C.; Deng, Y.; Cheng, J. Video2Entities: A computer vision-based entity extraction framework for updating the architecture, engineering and construction industry knowledge graphs. Autom. Constr. 2021, 125, 103617. [Google Scholar] [CrossRef]
  53. Qiang, W.; He, Y.; Guo, Y.; Li, B.; He, L. Exploring Underwater Target Detection Algorithm Based on Improved SSD. Xibei Gongye Daxue Xuebao/J. Northwest. Polytech. Univ. 2020, 38, 747–754. [Google Scholar] [CrossRef]
  54. Guan, S.Y.; Zhang, W.Y.; Jiang, Y.F. A surface defect detection method of the magnesium alloy sheet based on deformable convolution neural network. Metalurgija 2020, 59, 325–328. [Google Scholar]
  55. Jia, M.; Zhang, Y.; Pan, T.; Wu, W.; Su, F. Ontology Modeling of Marine Environmental Disaster Chain for Internet Information Extraction: A Case Study on Typhoon Disaster. J. Geo-Inform. Sci. 2020, 22, 2289–2303. [Google Scholar] [CrossRef]
Figure 1. Fusion knowledge representation architecture based on computer vision and natural language technology.
Applsci 12 08828 g001
Figure 2. Residual network structure. (a) Identity residual. (b) Projection residual.
Applsci 12 08828 g002
Figure 3. Comparison of deformable convolution sampling points of conventional 3 × 3 convolution kernel. (a) Conventional convolutional sampling position. (b) Random sampling of deformable convolutions. (c) Sampling position after deformable convolutional amplification. (d) Sampling position after deformable convolutional rotation.
Applsci 12 08828 g003
Figure 4. Calculation process of deformable convolution.
Applsci 12 08828 g004
Figure 5. Comparison of feature point receptive fields of conventional convolution and deformable convolution.
Applsci 12 08828 g005
Figure 6. Deformable convolution is added to the residual branch.
Applsci 12 08828 g006
Figure 7. Research framework for the construction of knowledge graphs in the field of product surface defect.
Applsci 12 08828 g007
Figure 8. Examples of surface defects of aluminum profiles.
Applsci 12 08828 g008
Figure 9. Comparison of surface defect data of aluminum profiles.
Applsci 12 08828 g009
Figure 10. Tracing analysis on formation mechanism of surface defects.
Applsci 12 08828 g010
Figure 11. Normalized confusion matrix of four categories.
Applsci 12 08828 g011
Figure 12. Normalized confusion matrix of deep residual network incorporating deformable convolution.
Applsci 12 08828 g012
Figure 13. Mapping relationship between surface defect formation mechanism analysis and corresponding ontology.
Applsci 12 08828 g013
Figure 14. Network knowledge structure diagram of “scratch“ defect.
Applsci 12 08828 g014
Figure 15. Neo4j visualization of the “scratch” defect.
Applsci 12 08828 g015
Figure 16. Three-tier architecture of visual system based on B/S mode.
Applsci 12 08828 g016
Figure 17. Diagnosis system for classification and formation mechanism analysis of product surface defects.
Applsci 12 08828 g017
Table 1. Division of dataset of surface defects of aluminum profiles.
CategoryTraining SetValidation SetLabel
scratch10151451
bump9051292
ai-powder8881273
dirty spot9871404
Table 2. Four ResNet models with deformable convolution at different locations.
ModelThe Change Curve of Accuracy and CrossEntropy Loss on the Training Set and the Validation SetComparison of Four Models in Accuracy and Cross Entropy Loss
1 Applsci 12 08828 i001 Applsci 12 08828 i002 Applsci 12 08828 i003
2 Applsci 12 08828 i004 Applsci 12 08828 i005 Applsci 12 08828 i006
3 Applsci 12 08828 i007 Applsci 12 08828 i008 Applsci 12 08828 i009
4 Applsci 12 08828 i010 Applsci 12 08828 i011 Applsci 12 08828 i012
Table 3. Four-classification confusion matrix of ResNet101 network model.
Confusion MatrixPrediction
ScratchBumpAl-PowderDirty Spot
truescratch120338
bump313845
al-powder661283
dirty spot1058110
Table 4. Fusion of deformable convolution and deep residual network surface defect image classification verification set confusion matrix.
Confusion MatrixPrediction
ScratchBumpAl-PowderDirty Spot
truescratch128510
bump014802
al-powder211401
dirty spot160125
Table 5. Precision rate of model on validation set (%).
ModelScratchBumpAl-PowderDirty Spot
ResNet10186.390.895.887.3
Deform_ResNet10197.792.599.397.7
Table 6. Recall rate of model on validation set (%).
ModelScratchBumpAl-PowderDirty Spot
ResNet10189.69289.582.7
Deform_ResNet10195.698.797.294.7
Table 7. Description of entity comparison.
Entity NameDescription
scratchSlight rubbing of other objects after surface treatment (painting), resulting in marks.
bumpWhen the aluminum is lifted by the crane, it is accidentally touched, or the forklift is not careful to lift the material, resulting in the concave surface of the aluminum.
al-powderSurface treatment powder spraying failed to evenly spray powder, resulting in a pile of a pile of protrusion.
dirty spotSurface treatment, dust or some dirty things failed to erase, resulting in coating particles more prominent.
Table 8. Entity relationship extraction.
Head of the EntityRelationshipTail Entity
scratchdefect phenomenonscratches on the surface
scratches on the surfaceprocess surface treatment
surface treatmentconditionslide wiped
slide wipedmeasuremove carefully after surface treatment to avoid collision
scratchinternal causemould
scratchexternal causesurface treatment
roughpositionmould
Table 9. Entity attributes.
ObjectProperty
mouldrough, ribbed, die hole blocked with foreign body
surface treatmentforeign body on work surface
Table 10. Neo4j diagram database element description.
Neo4j Diagram
Database Elements
FunctionExpression Object
labeldescription of ontology conceptsontology concepts such as defect type, formation mechanism and solution
nodedescription of entityscratch, surface treatment, grinding wall and other specific objects
relationshipdescription of relationships between entitiesprocess flow, cause position, condition, internal cause, external cause and so on
propertydescription of attributes of entities and relationshipsdefect type description, process number and other entity attributes and relationship attributes
Publisher’s Note: MDPI stays neutral with regard to jurisdictional claims in published maps and institutional affiliations.

