Article

A Framework for Assessing the Performance Capabilities of Rock Fall Protections for Hazard Analysis and Zoning

by
Erika Prina Howald
* and
Jacopo Maria Abbruzzese
School of Management and Engineering Vaud (HEIG-VD), Institute of Territorial Engineering (Insit), University of Applied Sciences and Arts Western Switzerland (HES-SO), 1400 Yverdon-les-Bains, Vaud, Switzerland
*
Author to whom correspondence should be addressed.
Appl. Sci. 2022, 12(17), 8834; https://doi.org/10.3390/app12178834
Submission received: 26 May 2022 / Revised: 15 August 2022 / Accepted: 16 August 2022 / Published: 2 September 2022
(This article belongs to the Section Earth Sciences)

Abstract

:
Assets in mountain regions all over the world are at risk of being affected by rock falls; strategies for ensuring the safety of these areas are needed. Protection measures are a most useful and diffused solution to mitigate rock fall hazards, provided their design features and effectiveness are maintained throughout their life span. As performance capabilities might deteriorate in time, it is necessary to assess the current conditions of protections for establishing whether they can actually operate according to design. This paper introduces a methodological framework for a preliminary evaluation of the performance capacity of existing rock fall protections, based on their current state, and the way this aspect influences hazard assessment and zoning. The methodology features a heuristic approach based on coefficients, called “penalty coefficients”, degrading the parameters which control the behaviour of a given protection, depending on the severity of the conditions the protection measure is in. Details on the structure and concepts of the methodological framework are given at first, along with two schematic examples provided in the second part of the paper, which are aimed at highlighting the necessary elements and steps to be performed to apply the approach in practice.

1. Introduction

Rock falls threaten many communities in mountainous regions all over the world. In many countries, national authorities are making constant efforts to develop or improve hazard and risk management policies for effectively coping with this type of landslide, in order to prevent consequences which may possibly be severe [1,2,3]. The main principle behind the different strategies adopted can differ from one country to another: some hazard and/or risk management plans focus directly on the use of protection measures to reduce potential consequences [4], while others aim firstly at reducing exposure to rock falls hazards [5,6,7]. In spite of these differences, the use of protection measures (such as barrier fences, wire mesh/cable nets, anchors, embankments, walls, ditches, etc.) constitutes a common point to all approaches. On the one hand, these measures clearly represent the main solution to the problem of rock fall hazard and risk mitigation in those countries where the main goal is to act directly towards a reduction of potential consequences. On the other hand, even in those approaches oriented mainly to reducing the exposure of new assets, protections measures are still necessary to ensure the safety of those assets, which are already existing. Some of them (urban areas and/or infrastructures) might indeed be located in highly endangered areas, where land use planning alone would be not fully suitable/sufficient for managing the existing threat. Whichever the situation, therefore, it becomes crucial to ensure that the rock fall protections installed can perform in conditions as close to optimal as possible throughout their whole life span, in order for the protections to actually be capable of mitigating hazards.
If this issue seems to be confidently manageable at the moment of designing new protection measures, thanks to current standards and guidelines available [8,9,10,11,12,13,14], it surely is more complex when protections already exist at a given site. Indeed, when the protections have been installed for some years or more (e.g. one or few decades), several conditions may be likely to have changed within this time frame – from environmental factors affecting the interaction with the protections, to lack of maintenance and changes in designing norms and guidelines to comply with [15]. All the factors and conditions which might negatively influence the operation of a protection measure can actually contribute to a degradation of its performance, down to the point that the protection might be not able to play its role any longer. This aspect raises the question of how to consider the presence of existing rock fall protections in hazard analysis and zoning. When the effects of rock fall protections are taken into account, this should be based on an assessment ensuring the performance of the protections as per design. If no assessment is made, professionals and decision makers working in this field might reconsider the hazard levels and the extent of the hazard zones defined and, depending on the degree of uncertainty affecting the problem, they might even be forced not to rely anymore on the behaviour of the protections. In turn, this could imply that hazard should be determined rather as if the protections were not present at all and, clearly, such an eventuality would strongly condition land use planning solutions at the areas concerned, as they are based on the severity of rock fall hazards.
The problem of what the influence of protection measures is on hazard analyses, based on their actual conditions, needs therefore to be addressed specifically. However, despite some work having already been conducted in context [15,16,17], a structured methodology for taking all the relevant factors affecting the behaviour of protection measures into account and evaluating their effects on the protections’ performances is still lacking. Further developments are necessary to cover these aspects, in order to help in providing some solutions to an issue which still remains, essentially, an open question.
This paper contributes to the field of applied research introduced, by presenting a methodological framework for the preliminary evaluation of the performance of rock fall protection measures, in order to assess how effective they are and, consequently, how their effectiveness influences hazard zoning at the areas impacted by rock falls. The work, carried out at the Institute of Territorial Engineering (Insit) of the School of Engineering and Management Vaud (HEIG-VD), Yverdon-les-Bains, Switzerland, follows up the methodology initially proposed by initially proposed by Prina Howald et al. (2017) [15], restructures its theoretical approach and, more specifically, focuses on existing rock fall protections, both at the rock fall source area and along the propagation zone.
In the following sections, the whole structure of the methodology is first described in detail. Then, two schematic examples provide an overview on how to apply the concepts and criteria presented, for assessing the current state of rock fall protections, evaluating their performance and possibly requalifying rock fall hazards.

2. Rock Fall Hazard Zoning and Protection Measures

According to definitions widely accepted at the level [2,18], landslide hazard can be defined as a combination of the intensity and frequency of occurrence of an event. In the specific case of rock falls, the intensity of the phenomenon can be expressed by the kinetic energy E of a rock block along its path, while the frequency of occurrence f of a block crossing a given location on the slope by the return period T, defined as T = 1/f. The frequency of occurrence f, in turn, is given by the product of the temporal frequency of detachment Pf of a block from an unstable rocky cliff and the frequency Pr of that block reaching a given point of the slope (frequency of reach), so that it results:
f = Pf · Pr
T = 1/f = 1/(Pf · Pr)
Each location of a slope affected by a rock fall can therefore be characterised by a value of energy and a value of return period, all over the potential rock fall runout area, and these energy-return period “couples” (E, T) can be used to define the corresponding rock fall hazard H(E, T).
A rock fall hazard zoning map is meant to provide this type of information all over the endangered area, usually grouping hazard values into several classes or levels, as a function of the combination of energy and return period.
If a given location of the slope is found to be characterised by a hazard H(E, T) which is considered too high compared to criteria defining the safety of the assets at that location, the hazard has to be mitigated. To this effect, the choice of appropriate protection measures can effectively reduce the energy and increase the return period (i.e., decrease the frequency of occurrence) of the event, lowering the “initial” hazard H(E, T) down to a new mitigated level H(Em, Tm)—either negligible or, at least, such that the subsequent modification of the type and extent of each hazard zone beyond the location(s) of the rock fall protection(s) results in a much milder threat and, consequently, less restricting the land use.
However, as briefly stated in the introduction to this paper, during the life span of a protection measure, many factors can, in principle, generate flaws and causes of malfunctioning over the years [19,20] and it is only under the condition of an optimal performance of the measure that its effect can be properly accounted for in hazard zoning (so that land use planning can be adjusted accordingly). Therefore, maintenance of the engineering solutions adopted is as crucial a point to be tackled as their correct design, to ensure the hazard mitigation desired.

3. Methodology for Evaluating the Effectiveness of Rock Fall Protections

The methodology presented in this paper aims at providing a framework for the preliminary evaluation of the current performance capabilities of existing rock fall protection measures at a given site, in order to establish whether the protections are still functional, that is, whether the hazard at any location beyond the protections can actually be considered as low it would be expected in the presence of protections working in their optimal conditions.
The methodology includes the possibility to analyse the performance of 7 main types of rock fall protections: wire mesh/cable nets, nails, anchors, barrier fences, embankments, retaining walls and ditches. This selection of measures was originally derived from a database built for rock fall protection measures present in some areas of the Swiss territory [15,21], and one of the main objectives behind the creation of this database was to collect information on the most recurring type of issues affecting the behaviour of the protections considered. Nevertheless, this initial selection can in principle be expanded to new types and sub-types.
Essentially, the approach for assessing the current effectiveness of rock fall protections consists of three main stages of analysis:
(a)
An initial phase of field survey and data collection, which includes information on the current hazard scenario threatening a site and the actual conditions of existing protection measures;
(b)
A central phase of evaluation of the actual effectiveness of the protections against the current hazard;
(c)
A final phase, in which the hazard zoning at the study site is possibly re-evaluated, based on the results of the previous phase (i.e., according to the influence that the protections in their actual state have on the hazard affecting the site), and suggestions are given for possible further actions to be taken.
Figure 1 illustrates the workflow of the methodology, whose main stages and sub-steps are detailed in the following sections.

3.1. Hazard Scenario and Existing Protection Measures

At first, information on what hazard affects the site of interest, regardless of any existing protection measure installed, has to be retrieved and expressed in terms of the hazard descriptors mentioned in Section 2, i.e., rock fall energy and return period—or frequency of occurrence.
Then, the presence of protection measures has to be considered and their current conditions must be evaluated. This task is accomplished by carrying out site surveys to inspect the protections. For the purpose of filing relevant information in a systematic manner for any type of protection and environmental setting, a MS Excel spreadsheet tool was elaborated. The data collection tool features a preliminary section for the identification of the rock fall protection to be inspected (in terms of type, location, main characteristics and year of construction) followed by two main sections for recording information about the presence of potential factors, whose effects may negatively affect the performance of the protection.
The first main section allows us to consider a category of factors, identified as Group 0, and is subdivided into:
  • Environmental factors—they are related to the site where the protection is installed and account for issues in connection with the interaction between the environment and the measure, such as: the presence of spring or torrents, which could generate erosion around the foundations of certain protections and make them unstable and/or expose them to other physical/chemical agents; possible frequent snow, which could fill up the nets of a barrier fence or reduce the effective height of an embankment; freezing and thawing cycles, which could affect the behaviour of some materials used for the protections, etc. A list of all factors of this type included so far in the methodology is shown in Table 1;
  • Factors related to the concept of the protection (general design and installation)—they represent potential issues generally common to most (or all) types of protections included in the methodology and consider effects such as: the possibility for structural measures of undergoing plastic deformations (e.g., barrier fences), possible redundancy of main structural elements which might help redistributing the efforts after an impact, consistency in the structure of the protection (e.g., such as in an embankment) as opposed to the presence of potential weak points (i.e., posts of a barrier fence rather than the steel wire mesh), respect of current norms, etc. These factors are also listed in Table 1.
The second main section is dedicated to another category of factors, identified as Group N, more closely affecting the performance of each single type of protection (barrier fences rather than embankments, or anchors, or wire mesh nets, etc.), due to specific flaws and causes of malfunctioning. Factors belonging this group were classified into four categories, according to the type of problem for which they account:
  • Category 1: flaws/faults due to lack of maintenance, e.g., posts of barrier fences damaged by impacts of blocks, barrier fences or embankments, or ditches partially filled up by blocks from previous events, nets of barrier fences or wire meshes loosened and/or damaged, corrosion on metal elements of the protections, etc.
  • Category 2: issues related to the original design of a given type of protection, including potential stability problems of embankments or barrier fences, inadequate protection against corrosion of the metallic elements of the protection, differences in the original positioning of the protection measure compared to the position required at present, as a consequence of the possible evolution of the events to be mitigated, etc.;
  • Category 3: causes of malfunctioning of the measures due to installation problems, such as sealing injections for anchors/nails, control of the applied stress in the anchors, etc.
  • Category 4: causes of malfunctioning originated by the fact that the measure has attained (or passed) its life span.
Table 2 presents all factors modelling these issues, for every specific type of protection currently included in the methodology (at the current stage of development, all the factors defining Groups 0 and N were established according to the rock fall protections database mentioned).
The results of the site inspection are (i) to determine how many of the factors listed in Table 1 and Table 2 have to be considered in the evaluation to be carried out in the next phase and, in view of this evaluation, (ii) to give a qualitative appreciation of the severity of each factor considered. Concerning the former point, it can be noticed that some factors in Table 2 can in principle belong to more than one category at the same time, due to different possible originating causes. However, as in each case study the particular origin of a factor has to be specified, none of them is considered multiple times. Regarding the qualitative appreciation of the severity of each factor, on the other hand, this is performed by defining five classes of severity: very low, low, moderate, high or very high; “low” severity means the factor is present but has little influence on the performance of the protection, while “high” means the factor strongly conditions the performance, up to making the protection unserviceable.
After the potential causes of loss of performance of the protections have been structured and qualified as specified above, the analysis can proceed to the next stage.

3.2. Analysis of the Effectiveness of the Protection Measures

The evaluation of the effectiveness of rock fall protections is conducted based on a heuristic approach, which translates the qualitative information collected from the inspection on site into quantitative terms, by means of coefficients expressing a quantitative “loss” in the performance of the protection, called penalty coefficients.
The possible values for the penalty coefficients vary in the interval (0,1), where:
  • 0 means the corresponding factor has such a high influence on the behaviour of the protection that it makes it totally unserviceable (associated to highest severity);
  • 1 corresponds to null or negligible influence of the factor on the performance of the protection measure (associated to lowest severity), i.e., the protection can work as per design.
If, in general, n factors (among those listed in Table 1 and Table 2) can negatively affect the performance of a protection, penalty coefficients are defined for each of them, for modelling:
  • A reduction in the capacity of the protection in terms of energy and return period retention all over the threatened areas (coefficients rn), the energy and return period retention capacity being hereby defined as the capacity of a protection measure of preventing a given location on the slope from being affected by values of energy E > Em and return period T < Tm, which is not compatible with the desired mitigation effect H(Em, Tm);
  • A reduction of the nominal energy absorption capacity Eopt established at the time of the design (coefficients en);
  • A reduction of the nominal effective height Dopt established at the time of the design, preventing a given location on the slope—and, possibly, beyond—from being affected by a value of frequency of reach Pr higher than a desired value (coefficients tn).
The appropriate coefficients are used as a function of the type of protection measure analysed, that is, protection systems conceived to act against the detachment of blocks from the cliff, at the source area, or structural measures and topographic modifications acting directly against the rock fall trajectories, in the propagation zone.

3.2.1. Types of Protections, Performance Capacity and Penalty Coefficients

Protection Measures at the Rock Fall Source Area

Protection measures at the rock fall source area, such as wire mesh/cable nets, anchors and nails, aim at completely preventing the blocks from leaving the cliff (e.g., anchors, nails) or drastically reducing their paths (e.g., blocks possibly falling behind wire mesh nets). As their objective is essentially that no propagation of the blocks develops far away from the cliff, these works can be considered to act on the frequency of reach Pr of the blocks (as they do not actually influence the failure mechanisms developing within the rock mass, responsible for the potential release of blocks). The main parameters defining their action against potential hazards are the resistance of the materials constituting the protection system and the rock cliff, i.e., the strength parameters of the elements involved in the safety proofs to be conducted when designing the system itself (e.g.,: proof of bearing resistance of the nets, proof of bearing resistance of the anchors, proof against sliding-off of blocks beneath the nets, proof of the mesh against puncturing, etc., as a function of the specific type of system). When the measure is in optimal working order, the hazard is mitigated if:
A(i) < Ropt,(i)   with i = 1…n
where A(i) is the destabilising action of the block on the protection system, specific to proof i (among the n proofs of safety required by the specific system), and Ropt,(i) the resistance of the protection system in optimal working order to action A(i). The performance capacity for these measures can therefore be expressed in terms of these values of resistance Ropt,(i); the penalty coefficients defining the current performance of the system in its actual conditions are in this case the coefficients rn, applied to Ropt,(i). As they reduce the values of materials’ strength parameters (or associated resisting forces) in order to define corresponding design values to be used in the proofs of safety, it can be noticed that, in this case, the penalty coefficients act basically the same way as partial safety factors in current civil and mechanical engineering practices.

Protection Measures in the Propagation Zone

Structural measures installed in the propagation zone, such as barrier fences, embankments and retaining walls, aim, on the other hand, at controlling rock fall energy E and rebound height d in order to intercept the blocks along their path and prevent them from travelling further downslope—ensuring hazard mitigation beyond their location. The main design features of these structures are the energy absorption capacity and effective height: if Eopt and Dopt, respectively, denote their nominal values when the measures are in optimal working order, hazard mitigation takes place when both the conditions:
{ E < E opt d < D opt
are satisfied. Regarding, more specifically, the effective height of the structure Dopt, this is the parameter that, at a given location, allows us to define, in the first place, the likelihood of intercepting block trajectories (determined, e.g., as the percentage of trajectories that are “caught” by the structure over the total number of possible trajectories reaching the protection, according to rock fall simulation results). It is therefore a parameter directly linked to the frequency of reach Pr as, in principle, the higher the height of the structure, the lower the chance a block will fly over it after a rebound, and travel further. The energy absorption capacity of the structure then completes the intercepting function, by making sure the blocks caught by the protection actually stop their path, losing all their energy at its location. The performance capacity of structural rock fall protections in the propagation zone can be therefore expressed as a function of its parameters (Eopt, Dopt); accordingly, the penalty coefficients to be used when analysing the actual performance capacity of these measures are: en, to be applied to Eopt, and tn, to be applied to Dopt.
Diches and berms, on the other hand, do not directly act against rock fall energy but, strictly speaking, only on the frequency of reach Pr. These solutions are usually located at areas characterised by low rock fall energy and aim at reducing Pr thanks to the “trap” effect produced by their depth/height, which does not allow rock blocks to jump beyond. The fundamental design parameter for ditches and berms can be therefore also defined as a characteristic dimension D, which for a ditch represents its depth, whereas for a berm its height. Based on considerations similar to those developed on the height of structural measures, the hazard mitigation takes place if:
d < Dopt
where d is again the rebound height of the blocks and Dopt is the optimal depth (height) of the ditch (berm) for ensuring safety. The performance capacity of these types of protections can thus be defined in terms of Dopt and the penalty coefficients to be used for evaluating their current performance are the coefficients of type tn, to be applied to Dopt.

3.2.2. Evaluation of the Actual Performance Capacity

In order to help in defining quantitative values for rn, en, and tn according to the qualitative degree of severity assigned to the corresponding factor n, a class of values constituting a sub-range of the interval (0,1) can be assigned to each degree of severity, e.g.,:
  • Very low  1.00–0.95
  • Low       0.95–0.90
  • Moderate    0.90–0.80
  • High      0.80–0.70
  • Very high    <0.70
Specific quantitative values representing the severity appreciated on site for the factor considered can then be appropriately picked within the corresponding sub-range, as a function of the particular situation studied, to establish, at best, the corresponding penalty coefficient. The most relevant and as exhaustive criteria as possible for the definition and validation of the values of each penalty coefficient (as well as the boundaries of each sub-range for their preliminary evaluation) are currently in the course of development.
Next, once determined for all factors involved, the relevant penalty coefficients values (rn or en and/or tn) are applied to the corresponding parameters Ropt,(i), Eopt and Dopt, as briefly mentioned in the previous section. This step allows us to compute the possible total loss of effectiveness of the inspected protection and define what will hereafter be referred to as the “reduced” (actual) performance capacity of the protection: Rred,(i), for protections at the source area, or (Ered, Dred) for protections in the propagation zone.
In particular, two sub-steps of analysis are planned to accomplish this evaluation, as follows.

Effective Performance Capacity: Condition 0

In this first sub-step of evaluation, only the effects of factors belonging to Group 0 are studied. The idea is to assess whether the conditions of operation of a protection changed only due to potential issues in the original design of the measure (either regarding the interaction with the surrounding environment or some technical/structural features). The penalty coefficients describing the j factors affecting the behaviour of the protection are applied to the parameters representing its performance capacity in “optimal” conditions (nominal capacity), so that this capacity will be lowered down to “effective”. This step of evaluation is defined as a “Condition 0” analysis:
Reff,(i) = Ropt,(i) · ∏j r0j,(i)
Eeff = Eopt · ∏j e0j
Deff = Dopt · ∏j t0j
Equation (6) is used for measures at the source areas; Equations (7) and (8) for measures in the propagation zone (Equation (8) only for ditches and berms).
In these equations, Reff,(i), Eeff and Deff express the effective performance capacity the protection measures have, in terms of resistance to the release of blocks R, energy E and height D at their locations, while Ropt,(i), Eopt and Dopt describe the optimal performance capacity of the protections in terms of the same parameters. The coefficients r0j,(i), e0j and t0j represent the effects of factor j of Group 0 on R, E and D, respectively, and 0 refers to the “Condition 0” analysis.

Reduced Performance Capacity: Conditions 1 to 4

The second sub-step of evaluation is focused, on the other hand, only on the effects of factors in Group N, which are often responsible for the most significant losses in the performance of a protection measure.
Each category of factors introduced in Section 3.2 (1 to 4) defines a corresponding additional “condition” of analysis, identified as Condition 1, Condition 2, Condition 3 and Condition 4, respectively. The analysis is conducted the same way as at the previous sub-step, but this time starting from the effective performance capacity just computed. A new and final updated state of performance can be therefore determined, by multiplying Reff,i, Eeff and Deff by the penalty coefficients rhk,(i), ehk and thk, respectively, representing the effects of factor k of Condition h on the performance of the protection. It results:
Rred,(i) = Reff,(i) · ∏hk rhk,(i)
Ered = Eeff · ∏hk ehk
Dred = Deff · ∏hk thk
In these equations, Rred,(i), Ered and Dred express the final state of effectiveness of the protection measure, identified as “reduced” performance capacity. Regarding the penalty coefficients, the index h for the Condition is always equal to 1, 2, 3 or 4, whereas the index k for the factor can vary according to which Category it belongs to and the number of factors belonging to that category—depending on the type of protection measure considered (Table 2).

3.3. Re-Evaluation of Hazard at the Study Site

In order to establish whether the reduced performance capacity still allows for taking into account the mitigation effects of the rock fall protections on hazard zoning, the following criteria are defined for protection measures at the source area and in the propagation zone, respectively.

3.3.1. Protection Measures at the Rock Fall Source Area

Based on Equation (3), for protection systems at the source areas in optimal conditions, it can be written:
A(i) < Ropt,(i)   with i = 1…n ⇒ H = H(Em, Tm) < H(E, T)
where, as a reminder, Em and Tm define the desired level of hazard H(Em, Tm) after mitigation, compatible with the safety of the exposed assets.
Similarly, for existing protection systems that might have lost some of their performance capabilities over time, it must result:
A(i)) < Rred,(i)   with i = 1…n
The criterion for establishing whether the effects of the existing protection system can still allow the required reduction of rock fall hazard can then be formulated as:
H = { H ( E m , T m ) if       A ( i ) < R red , ( i ) ,         i = 1 n H ( E , T ) if         A ( i ) R red , ( i )     for   any   i = 1 n

3.3.2. Protection Measures in the Propagation Zone

As far as rock fall protections in the propagation zone are concerned, starting from Equation (4), it can be written:
{ E < E opt d < D opt H = H ( E m , T m ) <   H ( E , T )
However, it must be pointed out that, despite location, energy absorption capacity and height being selected in an optimal way, it can still occur in some instances that rock fall modelling tools (such as trajectory simulation software) might prove that the measures would intercept the vast majority, but not all of the possible paths followed by the blocks. On the other hand, since the optimal design of the measure is expected to reduce this phenomenon considerably, even in those cases in which a certain percentage Pr* of trajectories could develop above the measure (d > Dopt  Pr* > 0), this percentage would be most likely very small and, thus, related to a very high value of return period, according to Equation (2):
T = 1/(Pf · Pr) T* = 1/(Pf · Pr*) > T = 1/(Pf · Pr)  with Pr* < Pr
In this relation, T* is the return period associated to the frequency of reach Pr*, computed after the effects of the protection are considered and accounting for a few potential trajectories travelling beyond the measures; Pr and T are the frequency of reach and return period without the effects of the protection measures.
A very high value of return period could imply such a rare occurrence that the resulting hazard level could still be compatible with the safety criteria established for the exposed areas, i.e., T* ≥ Tm (even regardless of the energy along the trajectories), which means it can be written T* = Topt.
If the condition d < Dopt cannot strictly be satisfied, therefore, a control to verify whether T* ≥ Tm must still be performed, to check whether the design of the protection can still be considered as optimal, despite not all trajectories being intercepted by the protection.
Based on these considerations, the condition for hazard mitigation expressed by Equation (4) can be restructured as:
{ E < E opt d < D opt { E < E opt   T = T opt with   T opt     T m
where Topt = 1/(Pf · Pr,opt) and Pr,opt is the frequency of reach at the location of the protection in perfect working order.
In line with the structure of Equation (17), for hazard mitigation in the presence of existing protection measures, it must result:
{ E < E red d < D red { E < E red T = T red with   T red     T m
where Tred =1/(Pf · Pr,aug) and Pr,aug is the frequency of reach at the location of the protection, augmented by the reduction of the effective height of the measure.
The criteria for establishing the effects of existing protections in the propagation zone on hazard assessment and zoning are, therefore, for barriers, embankments and walls:
H = {   H ( E m , T m )                                     if       E < E red   and   ( d < D red   or   d   |   T red T m )   H ( E , T )                                               if       E E red   or   ( d D red   and   d   |   T red < T m )
whereas for ditches and berms:
{     H ( E m , T m )                                                     if       d < D red   or   d   |   T red T m H ( E , T )                                               if         d D red   and   d   |   T red < T m

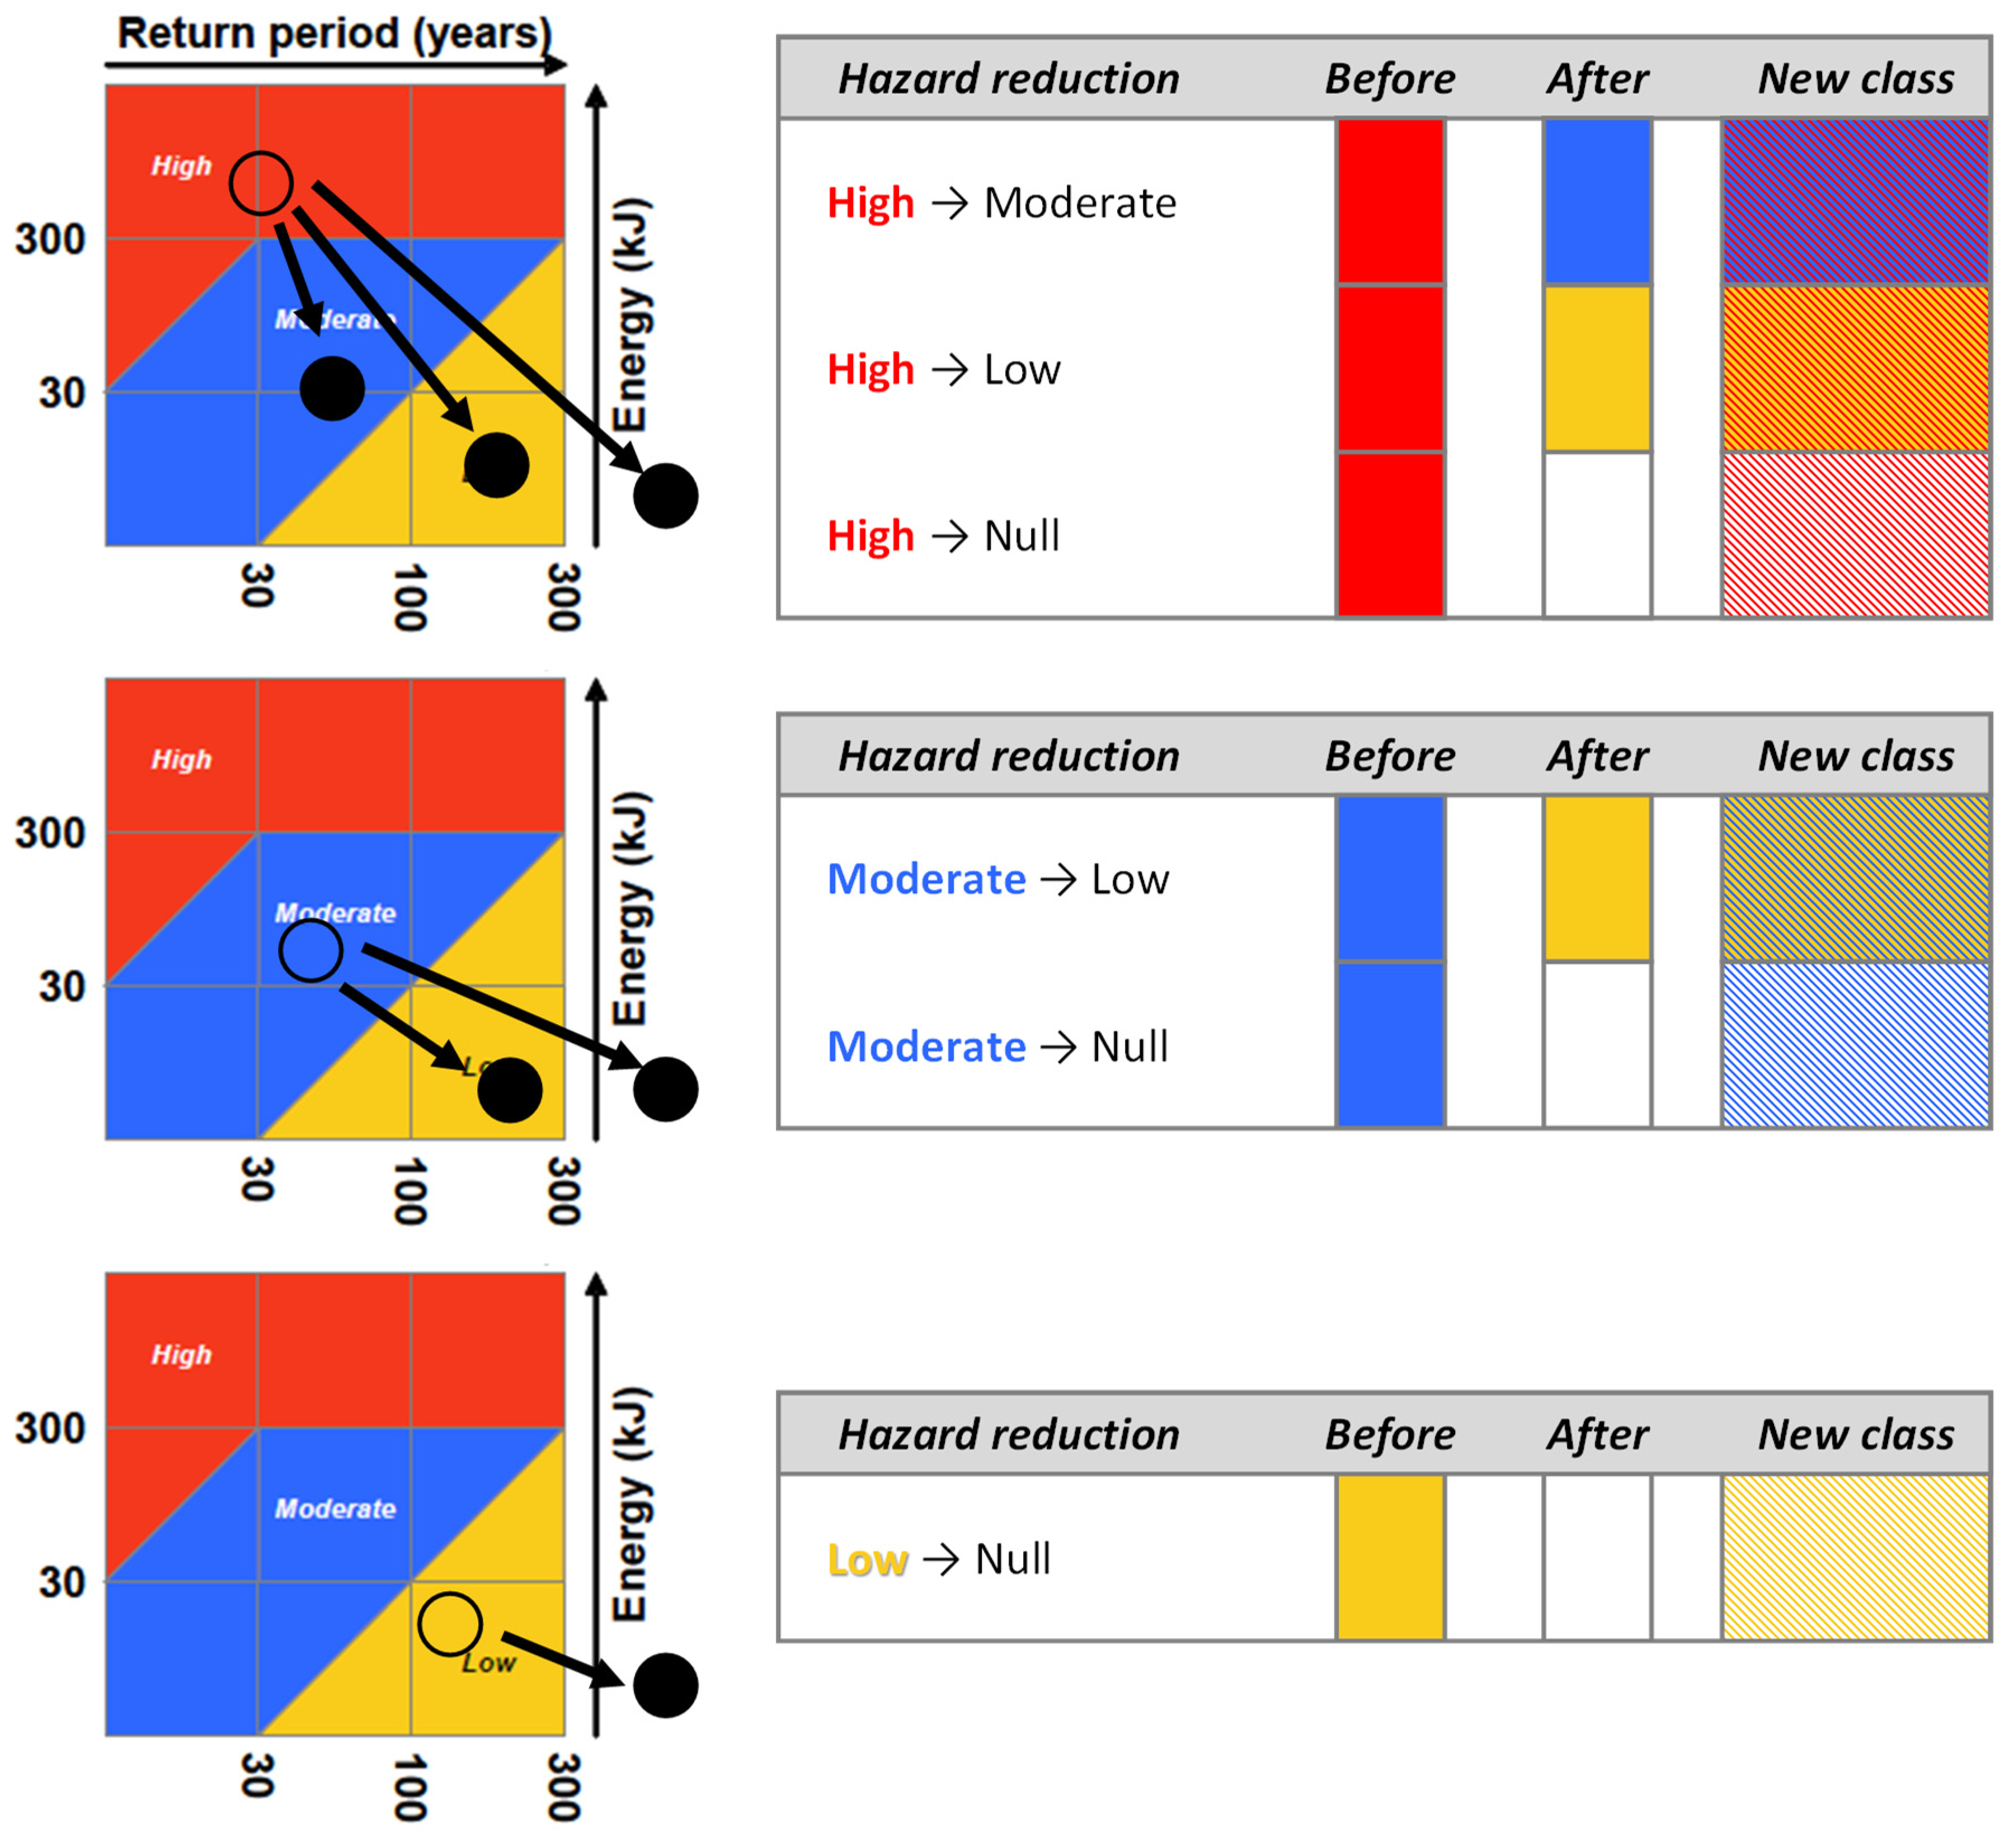
3.3.3. Account for the Effect of Protection Measures in Hazard Zoning

If the application of Equations (14), (19) or (20) shows that the reduced capacity is lower than required to handle the hazard, the protection measure concerned must be considered as totally unserviceable. Its presence on site should therefore not be accounted for in hazard analysis and the measure should be repaired (if possible) or replaced with a new one, in order to lower the hazard at the level required.
On the other hand, if the reduced performance capacity is still sufficient to decrease the hazard, the mitigation effects of the protection can be included in the hazard assessment, provided some cost-effective maintenance works (to be established case by case) would still be taken, to restore at best its capacity towards optimal. In this case, starting from the location of the protection xP and proceeding down along the slope to the limit of the runout area, the corresponding hazard zoning maps can display the same effects as if the protection were in optimal performance conditions.
In particular, to clearly distinguish the situation in which a lower degree of hazard derives from the rock fall scenario itself, without any account for any measure, from the situation in which that hazard degree is obtained thanks to the performance of protection measures, all areas reclassified based on the effects of rock fall protections will be represented on the zoning maps as hatched zones. The hatched pattern will show the specific colour codes and/or textures corresponding to the hazard levels computed both with and without account for the protection. Such a representation underlines that the hazard level at the areas concerned must be intended indeed, as the one expressed by the colour corresponding to the lower level in the hatched texture but, at the same time, that it was possible to achieve this level only by means of protection measures.
As an example, Figure 2 shows these concepts applied with the help of a rock fall intensity–frequency diagram. In particular, the diagram used in Switzerland for rock fall hazard zoning is considered [6,7], in which the combination of rock fall energy and return period originates three levels of hazard (low, moderate and high), each corresponding to a given colour code—plus a fourth level designated as “residual hazard”, for all events characterised by T > 300 years, independently from their energy (not considered for the sake of simplicity). Starting from any of the three main levels of hazard, the figure shows all possible reductions to a lower (down to null) level and the related use of hatched-colour codes, as a function of what mitigation can possibly achieve compatibly with cost-effectiveness, risk perception and acceptance criteria. In the figure, the hollow circles on the diagrams represent the initial hazard, with no account for any protection measure possibly present, while the filled circles the final hazard, after the mitigation effect of the protections is considered (where the mitigation can be due either to an optimal or, at least, to a reduced performance capacity of the measures, but still such that the measures can operate properly).

4. Applications

Two simple theoretical examples are proposed in this Section, to illustrate some applications of the methodology presented. The first is focused on the hazard mitigation effects provided by an existing protection system installed at the source area; the second deals with hazard mitigation in presence of a structural measure in the propagation zone. For what concerns the assessment of rock fall hazards, with and without account for the protection measures, both examples will be presented with the help of the intensity–frequency matrix diagram in the Swiss Codes, which is already introduced (Figure 2).
As an appropriate calibration of the penalty coefficients is currently under development, it is worth pointing out here that the objective of these applications, in line with the scope of the paper, is mostly to help present a detailed and informative view on how to perform the evaluations featured in the procedure, rather than underlining the quality of the results. Data and information about the protections, the penalty coefficients established for the factors included in the examples and the values for the parameters determining the rock fall hazards are therefore based on assumptions, serving the purpose of clarity in illustrating the principles of the computations and the interpretation of the results obtained.

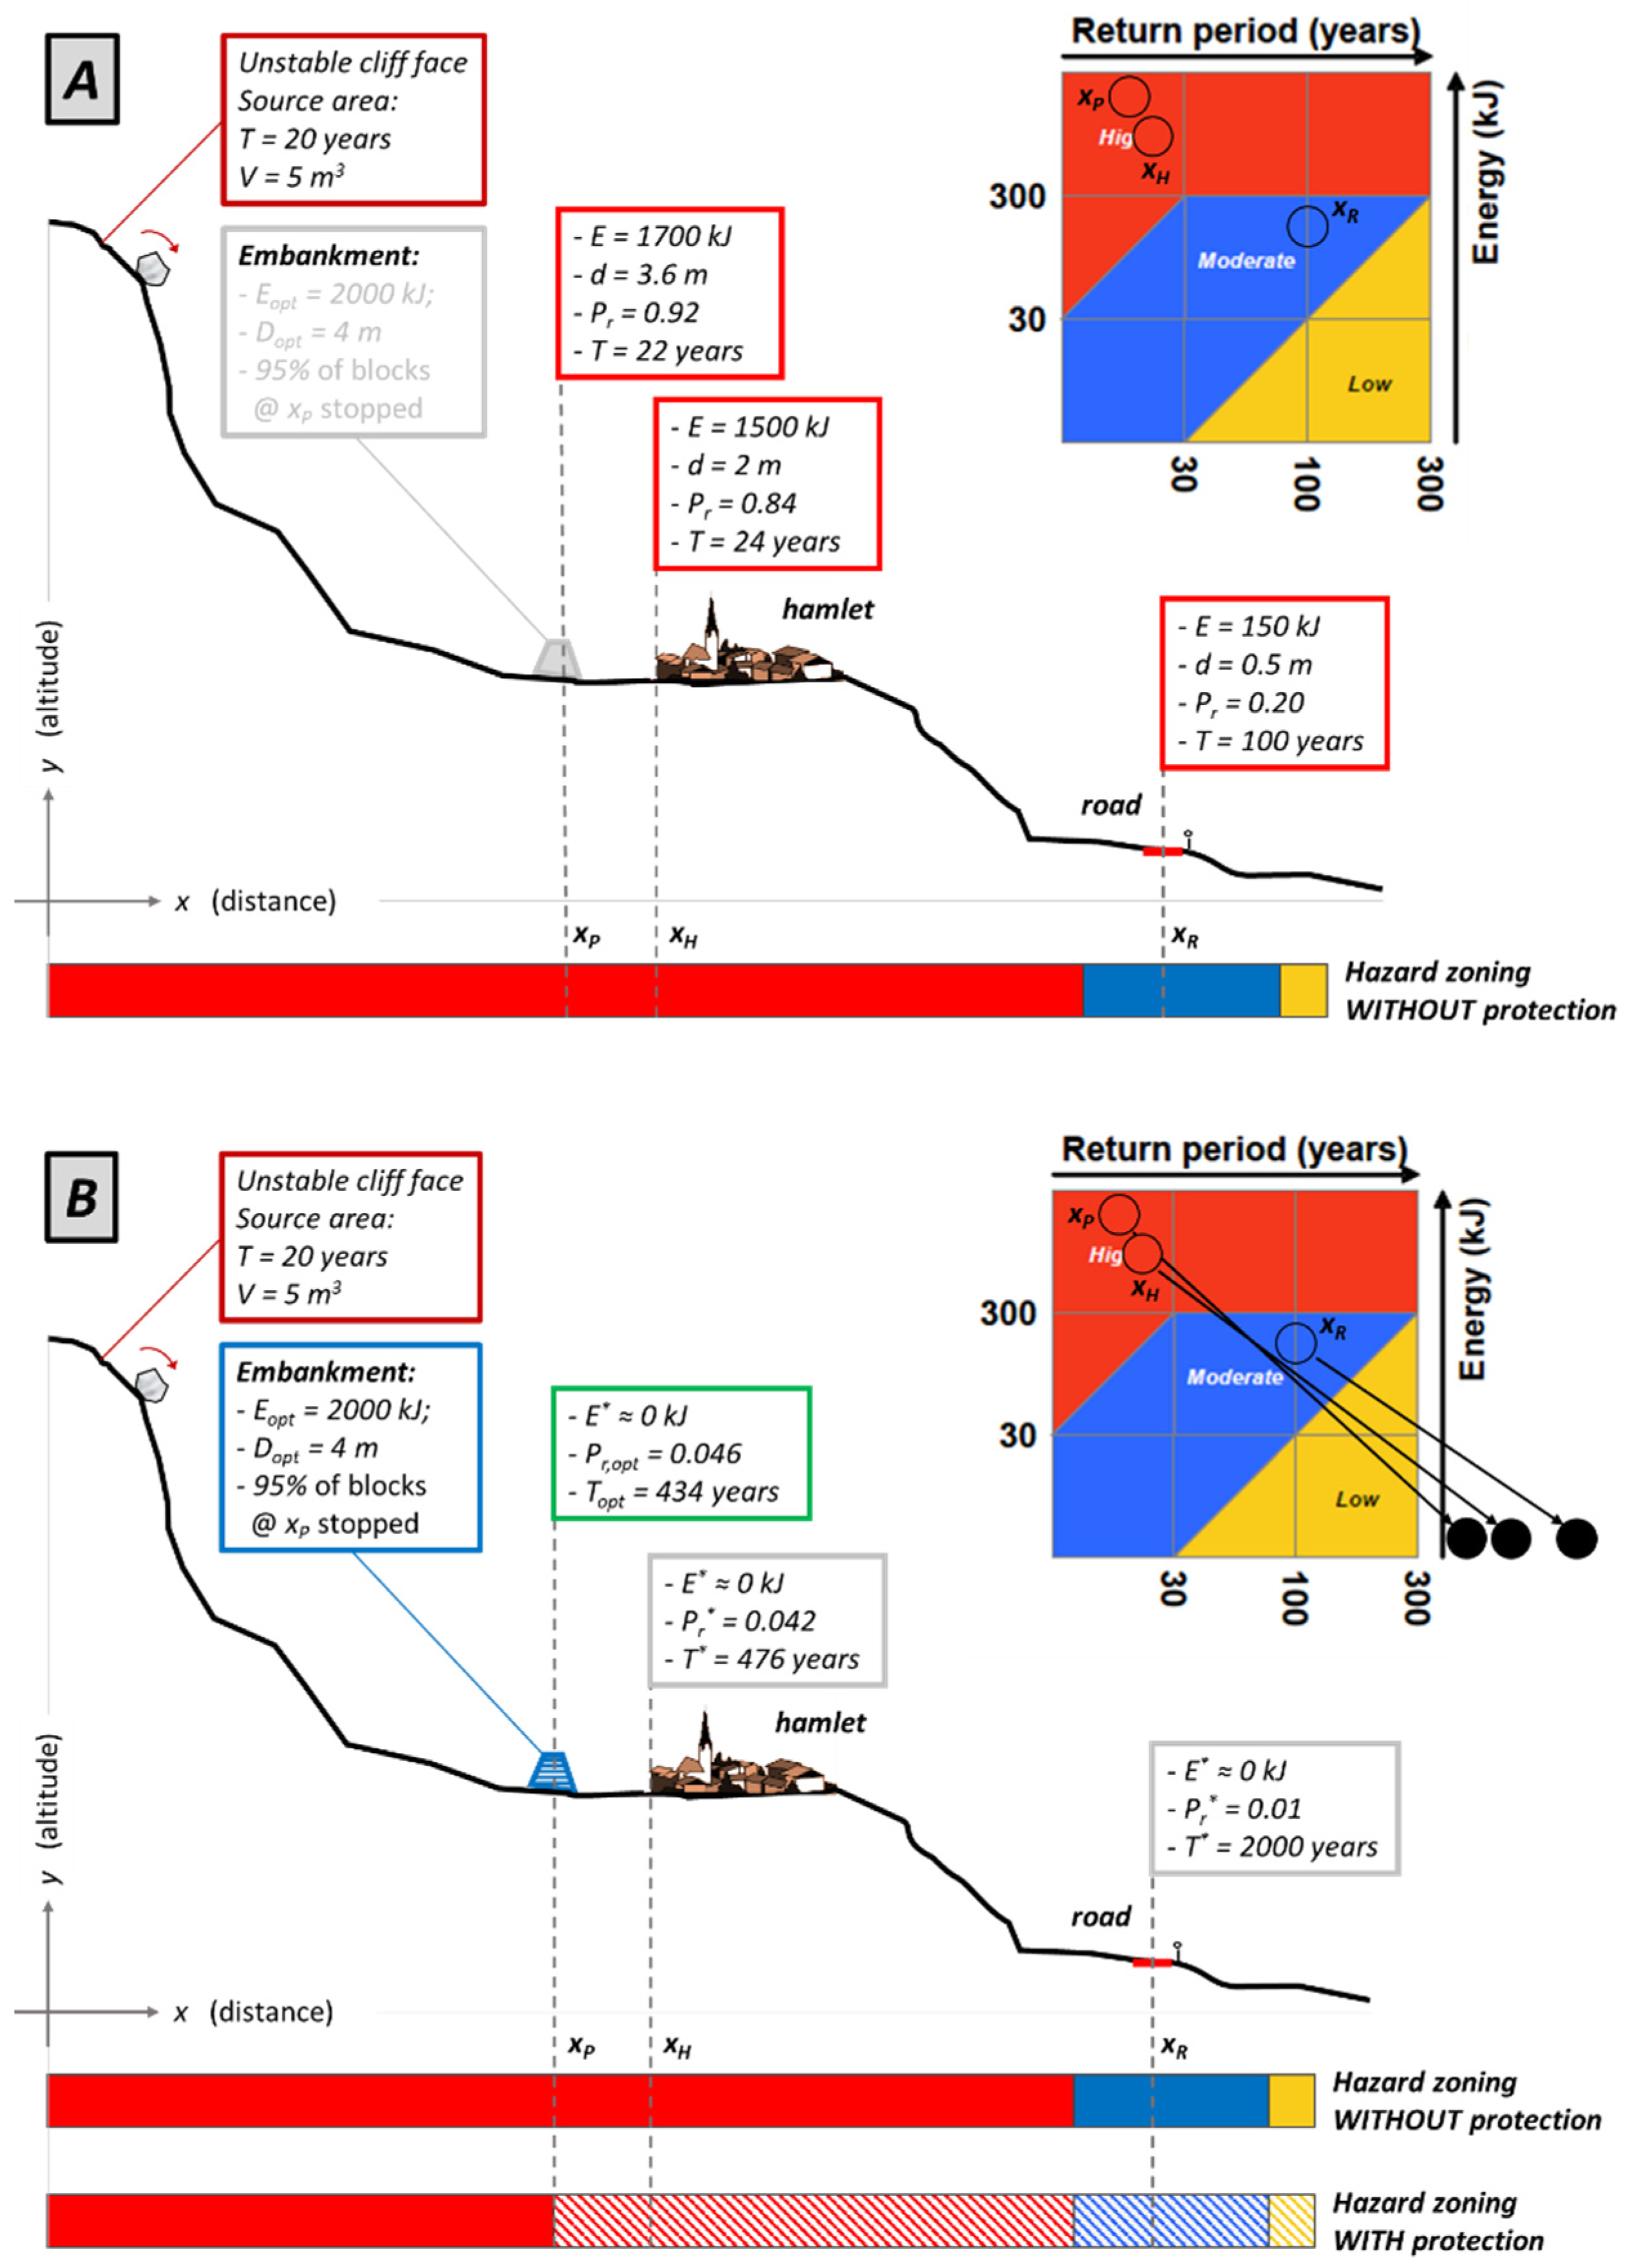
4.1. Example 1: Effectiveness of Rock Fall Protection at the Source Area

The slope represented in Figure 3 is affected by a rock fall scenario characterised by a maximum block size of around 4 m3, falling on average every 100 years, according to data and information collected about the unstable cliffs at its top. Rock fall simulations of this particular event provide values for energy, height of rebound and runout distances which, combined with the mean temporal frequency of detachment estimated, provide the hazard zoning illustrated (Figure 3). This hazard threatens a mountain road at the toe of the rocky cliff (xR), located in the high hazard zone, and a village, more downslope (xV), situated in the low hazard zone. A protection measure constituted by a system of mesh wire and nails has been installed for a few decades at the source area to prevent blocks from detaching and reaching these elements. The characteristics of the system in terms of geometry are also shown in Figure 3. Under the condition of optimal performance, this measure is expected to provide the mitigation shown in the same figure (hatched zones).
The assessment of the performance capacity of the system can be conducted according to the procedure described in Section 3 for protection measures at the source area, by recalling the safety proofs necessary for this type of system to operate correctly and by evaluating the current conditions of the protection (to define the corresponding penalty coefficients).
The proofs of safety i for the protection can be presented assuming a mode of operation similar to rock fall mesh wire and nails-based systems currently available e.g., Geobrugg 2020 [22]. With reference to Figure 4, under the hypothesis of a Mohr–Coulomb failure criterion, the proofs for the protection system installed are, in optimal working conditions:
(1) Proof of the nail against the sliding-off of superficial rock blocks/compartments within the unstable rock layer:
A ( 1 ) < R opt , ( 1 ) with : A ( 1 ) = 85.5   kN ; R opt , ( 1 ) = ( f y / 3 ) A γ 1 = ( 500 / 3 ) 616 1.5   N = 118.7   kN
In the relationships above, A(1) is the design shear force the nail has to bear and transmit to the stable part of the cliff, generated by the action of the block potentially sliding along the failure surface. This force is determined by the geometry of the problem. Ropt,(1) is, on the other hand, the resistance of the nail to shear stress, function of the shear stress at failure τy = fy/√3 and the cross section A of the nail.
(2) Proof of the mesh wire against puncturing of the nails, due to their action
A ( 2 ) < R opt , ( 2 ) with : A ( 2 ) = 30   kN ; R opt , ( 2 ) = R 2 γ 1 = 80 1.5   kN = 53.3   kN
and where A(2) is the design value of the pretension force F applied to the nails and Ropt,(2) the resistance of the mesh against pressure in the nail direction (R2 is determined from tests on real samples).
(3) Proof of the nail against combined stresses of tension (due to the way nails operate) and shear (due to the rock blocks, which could slide off):
A ( 3 ) < R opt , ( 3 )   ( A ( 2 ) / T r ) 2 + ( A ( 1 ) / S r ) 2 1.0     0.73 < 1.0 with : T r = f y · A γ 3 = 500 · 616 1.5   N = 205.3   kN ;
In this case, Tr is the tensile resisting force of the nail and Sr is the shear resisting force, computed as in proof 1. A(1) and A(2) are the same actions computed in proofs 1 and 2, respectively.
(4) Proof of the mesh against shearing off in the nail direction, when a local rock block/compartment between two nails detaches and tends to slide down towards the lower nail, exerting an outward-directed force (Figure 4) on the mesh at its connection with that nail:
A ( 4 ) < R opt , ( 4 ) with : A ( 4 ) = 8.8   kN ; R opt , ( 4 ) = R 4 γ 4 = 40 1.5   kN = 26.7   kN
For this proof, A(4) is the design value of the maximum shear force on the net, due to the outward push of the rock block. This shear force is taken as equal and opposite to the stabilising force P of the mesh pressed against the slope, computed depending on the geometry of the equilibrium problem. Ropt,(4) is the resistance of the mesh against shearing in the nail direction (again, determined from tests designed for this purpose).
(5) Proof of the mesh against tensile stresses parallel to the direction of the slope, as a reaction to the sliding off of local blocks (between two nails) behind the mesh:
A ( 5 ) < R opt , ( 5 ) with : A ( 5 ) = 5   kN ; R opt , ( 4 ) = R 5 γ 5 = 10 1.5   kN = 6.7   kN
Here, A(5) is the design force on the net parallel to the direction of the slope, again computed depending on the geometry of the equilibrium problem, and Ropt,(5) the resistance of the mesh against forces in the same direction (R5 is also to be determined by means of specifically designed tests).
Let it now be assumed that, after inspection, the current state of the protection is influenced by no particular factor of Group 0 (referring to Condition 0 analysis) and, on the other hand, by the factors: (i) corrosion of mesh, (ii) corrosion of the nails and (iii) damages to the mesh, belonging to Group N (Table 2), for which corresponding degrees of severity were defined as (i) moderate to high, (ii) moderate and (iii) low to very low, respectively. Let the corrosion issues in this problem be related to a not fully optimal engineering design of the measure (Condition 2), while the damages to the mesh attest to a lack of maintenance (Condition 1). In these conditions, and under the hypothesis of an appropriate calibration, the penalty coefficient rn for evaluating the reduced performance capacity of the system could be defined and assigned as:
-
Corrosion of mesh: low         r21 = 0.93;
-
Corrosion of nails: moderate     r28 = 0.85;
-
Damages to the mesh: low to very low r12 = 0.95.
Since the main effect of corrosion is to reduce the section of the resisting elements, coefficients r21 and r28 influence basically all the proofs of safety for the protection system. In particular, r21 affects proofs 2, 4 and 5, while r28 affects proofs 1 and 3. Coefficient r12, on the other hand, also affects the proofs concerning the mesh, i.e., 2, 4 and 5.
Since no factors of Group 0 needs to be accounted for, Reff,(i) = Ropt,(i) for every proof. Consequently, the evaluation of the reduced performance capacity can be conducted, based on Equation (9):
(1) Proof 1: A(1) = 85.5 kN; r28 applied to A (cross section of the nail):
R red , ( 1 ) = R eff , ( 1 ) · r 28 = f y · A · r 28 3 · γ 1 = 118.7 · 0.85 = 100.1   kN     A ( 1 ) < R red , ( 1 )
(2) Proof 2: A(2) = 30 kN; r21, r41 applied to R2:
R red , ( 2 ) = R eff , ( 2 ) · r 21 · r 12 = R 2 · r 21 · r 12 γ 1 = 80 · 0.93 · 0.95 1.5 = 47   kN     A ( 2 ) < R red , ( 2 )
(3) Proof 3: A(1) = 85.5 kN, A(2) = 30 kN; r21, r28 applied to (Tr, Sr) = f(A):
( A ( 2 ) / ( f y · A · r 28 γ 3 ) ) 2 + ( A ( 1 ) / ( f y · A · r 28 3 · γ 1 ) ) 2 = 0.87     A ( 3 ) < R red , ( 3 )
(4) Proof 4: A(4) = 8.8 kN; r21, r41 applied to R4:
R red , ( 4 ) = R eff , ( 4 ) · r 21 · r 12 = R 4 · r 21 · r 12 γ 4 = 40 · 0.93 · 0.95 1.5 = 23.6   kN     A ( 4 ) < R red , ( 4 )
(5) Proof 5: A(5) = 5 kN; r21, r41 applied to R5:
R red , ( 5 ) = R eff , ( 5 ) · r 21 · r 12 = R 5 · r 21 · r 12 γ 5 = 10 · 0.93 · 0.95 1.5 = 5.9   kN     A ( 5 ) < R red , ( 5 )
As all the proofs of safety are fulfilled, Equation (14) is satisfied and therefore the existing protection measure at the source area can mitigate the hazard, despite its reduced performance capacity. No block in principle leaves the rock wall, which means the frequency of reach tends to zero (i.e., extremely high values of return period) and so does the energy that can be determined at all the endangered locations, i.e., the null hazard. The effects of the measure do provide the hazard zoning in Figure 3 (hatched zones), as also visualised by means of the intensity–frequency diagram, where all the initial hazardous conditions (with reference to the source area, xV and xR) tend to null.
Due to the existence of factors affecting the performance capacity, however, solutions should still be taken, in order to keep the effects of these factors under observation in time, e.g., perform future inspections to check the evolution of corrosion on the mesh, monitor (if possible) the behaviour of the nails, as well as possibly repair the damages on the mesh.

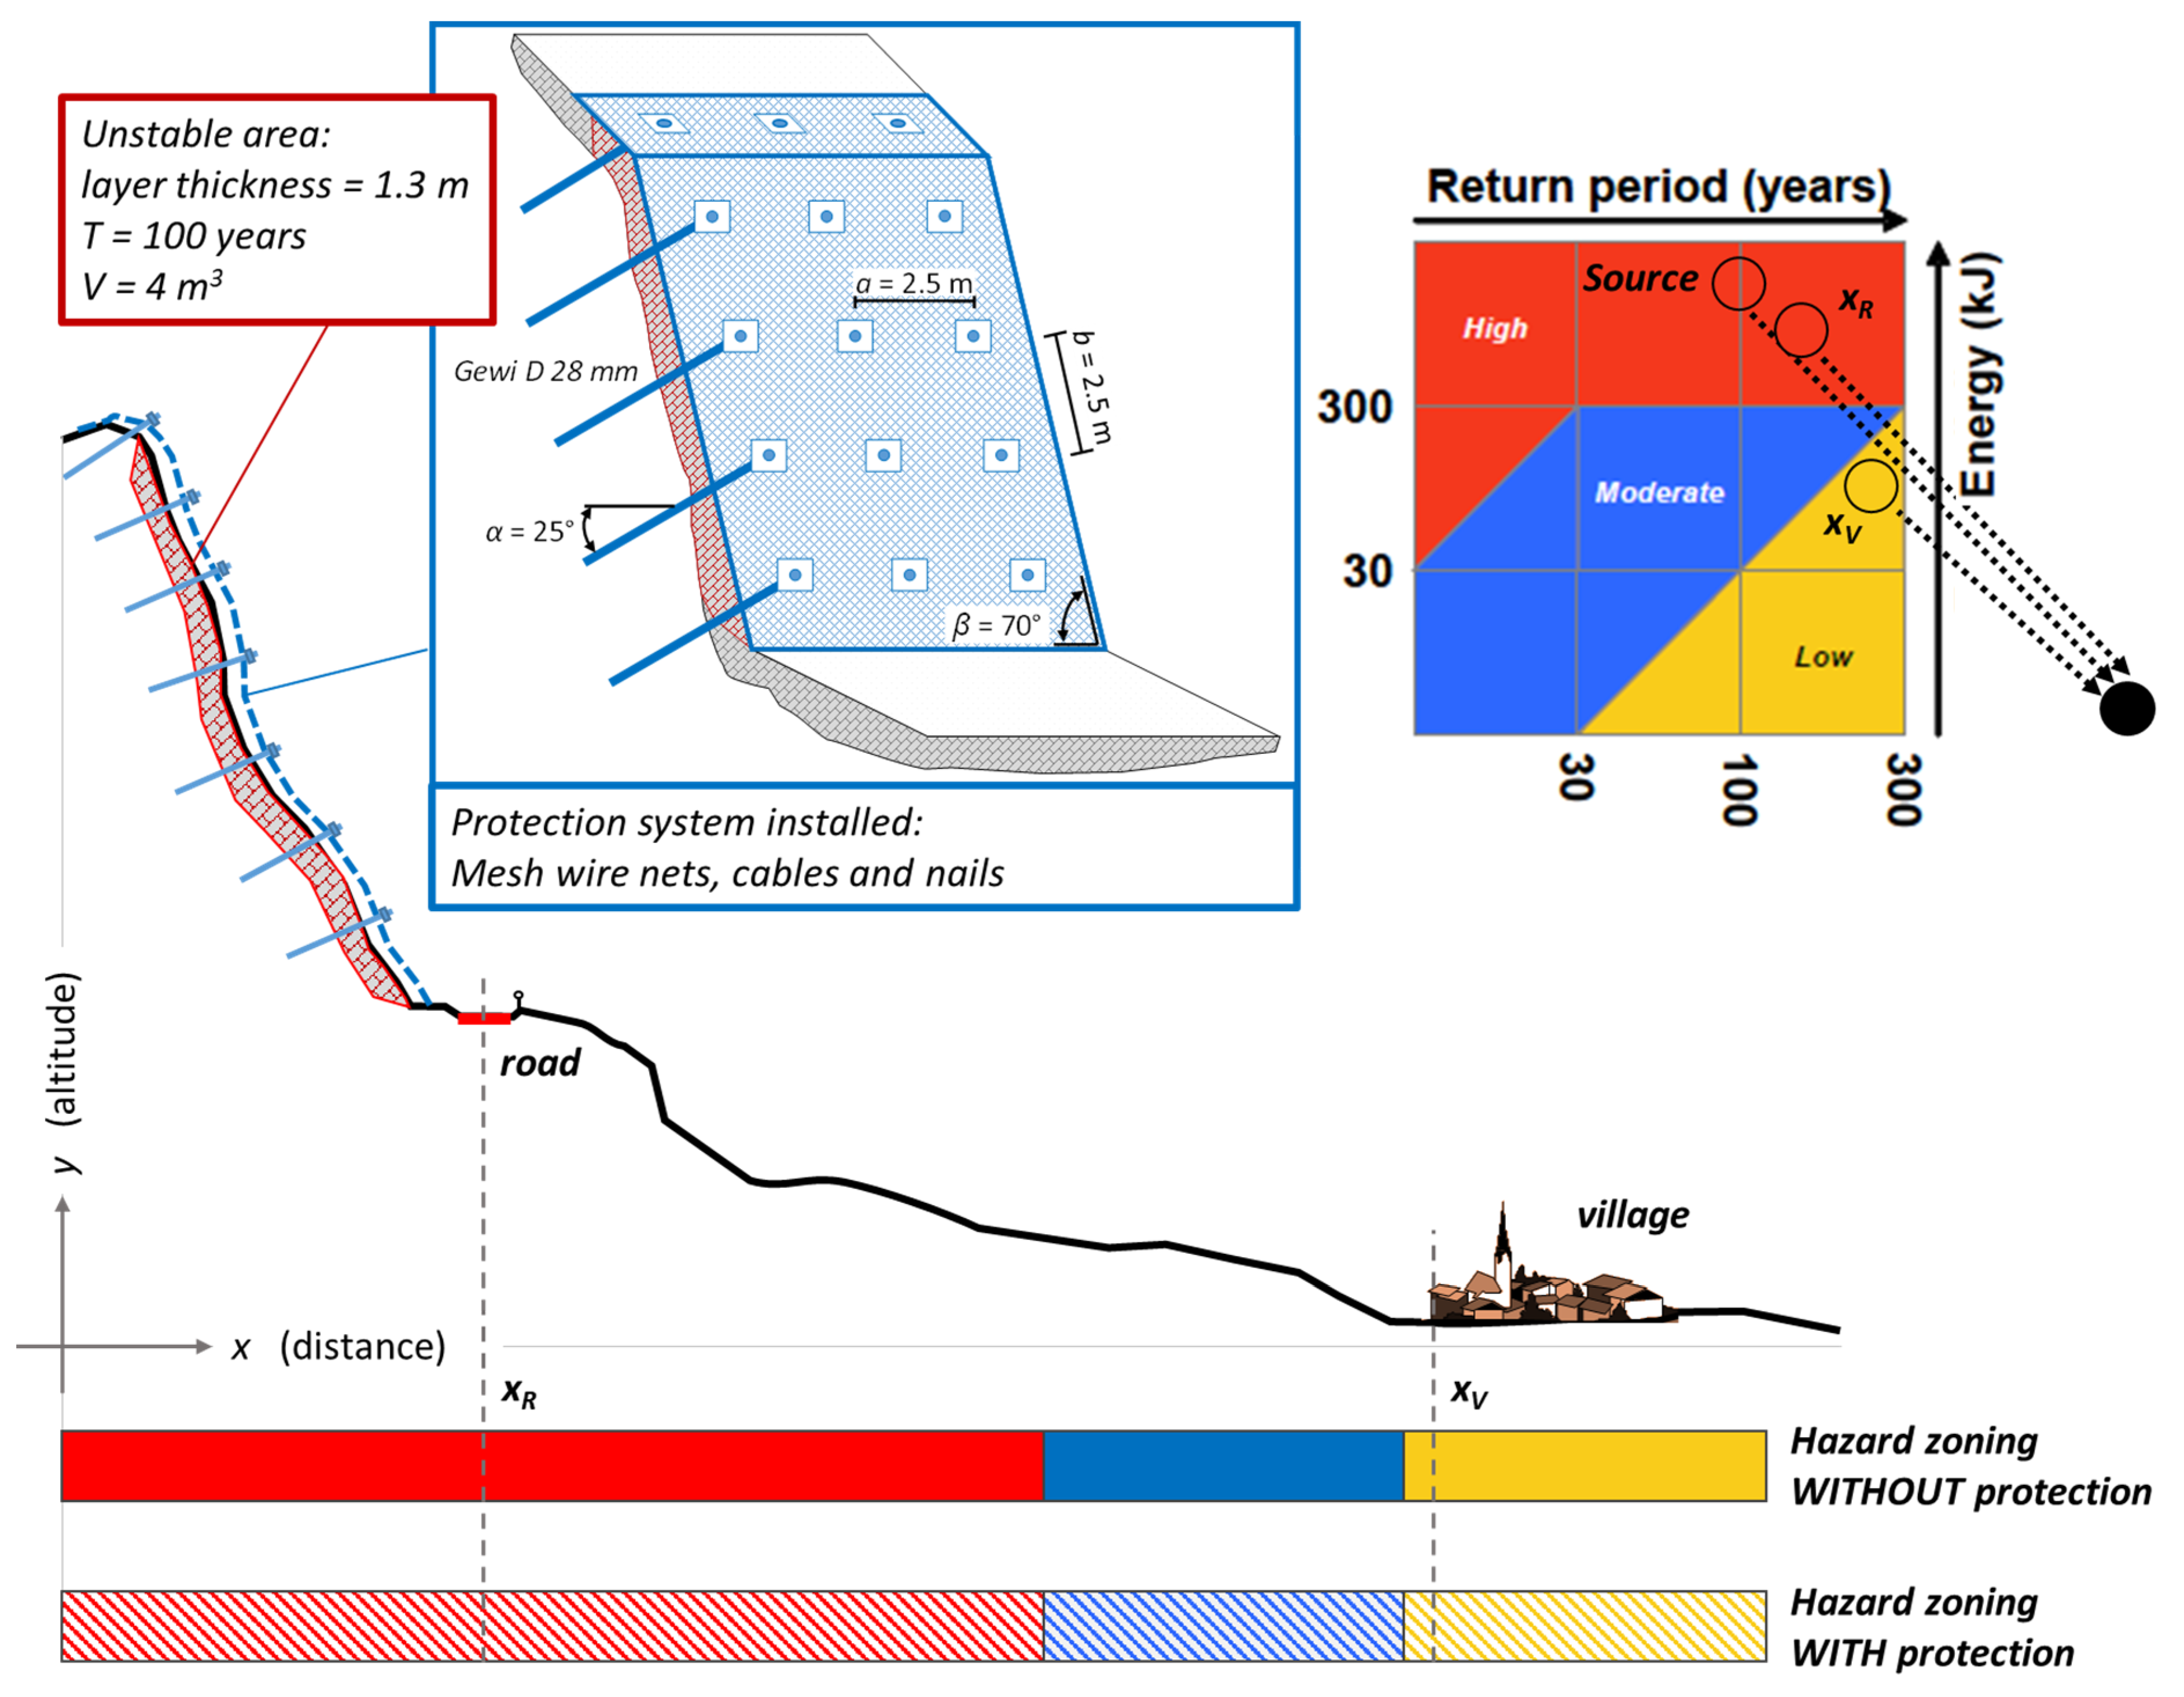
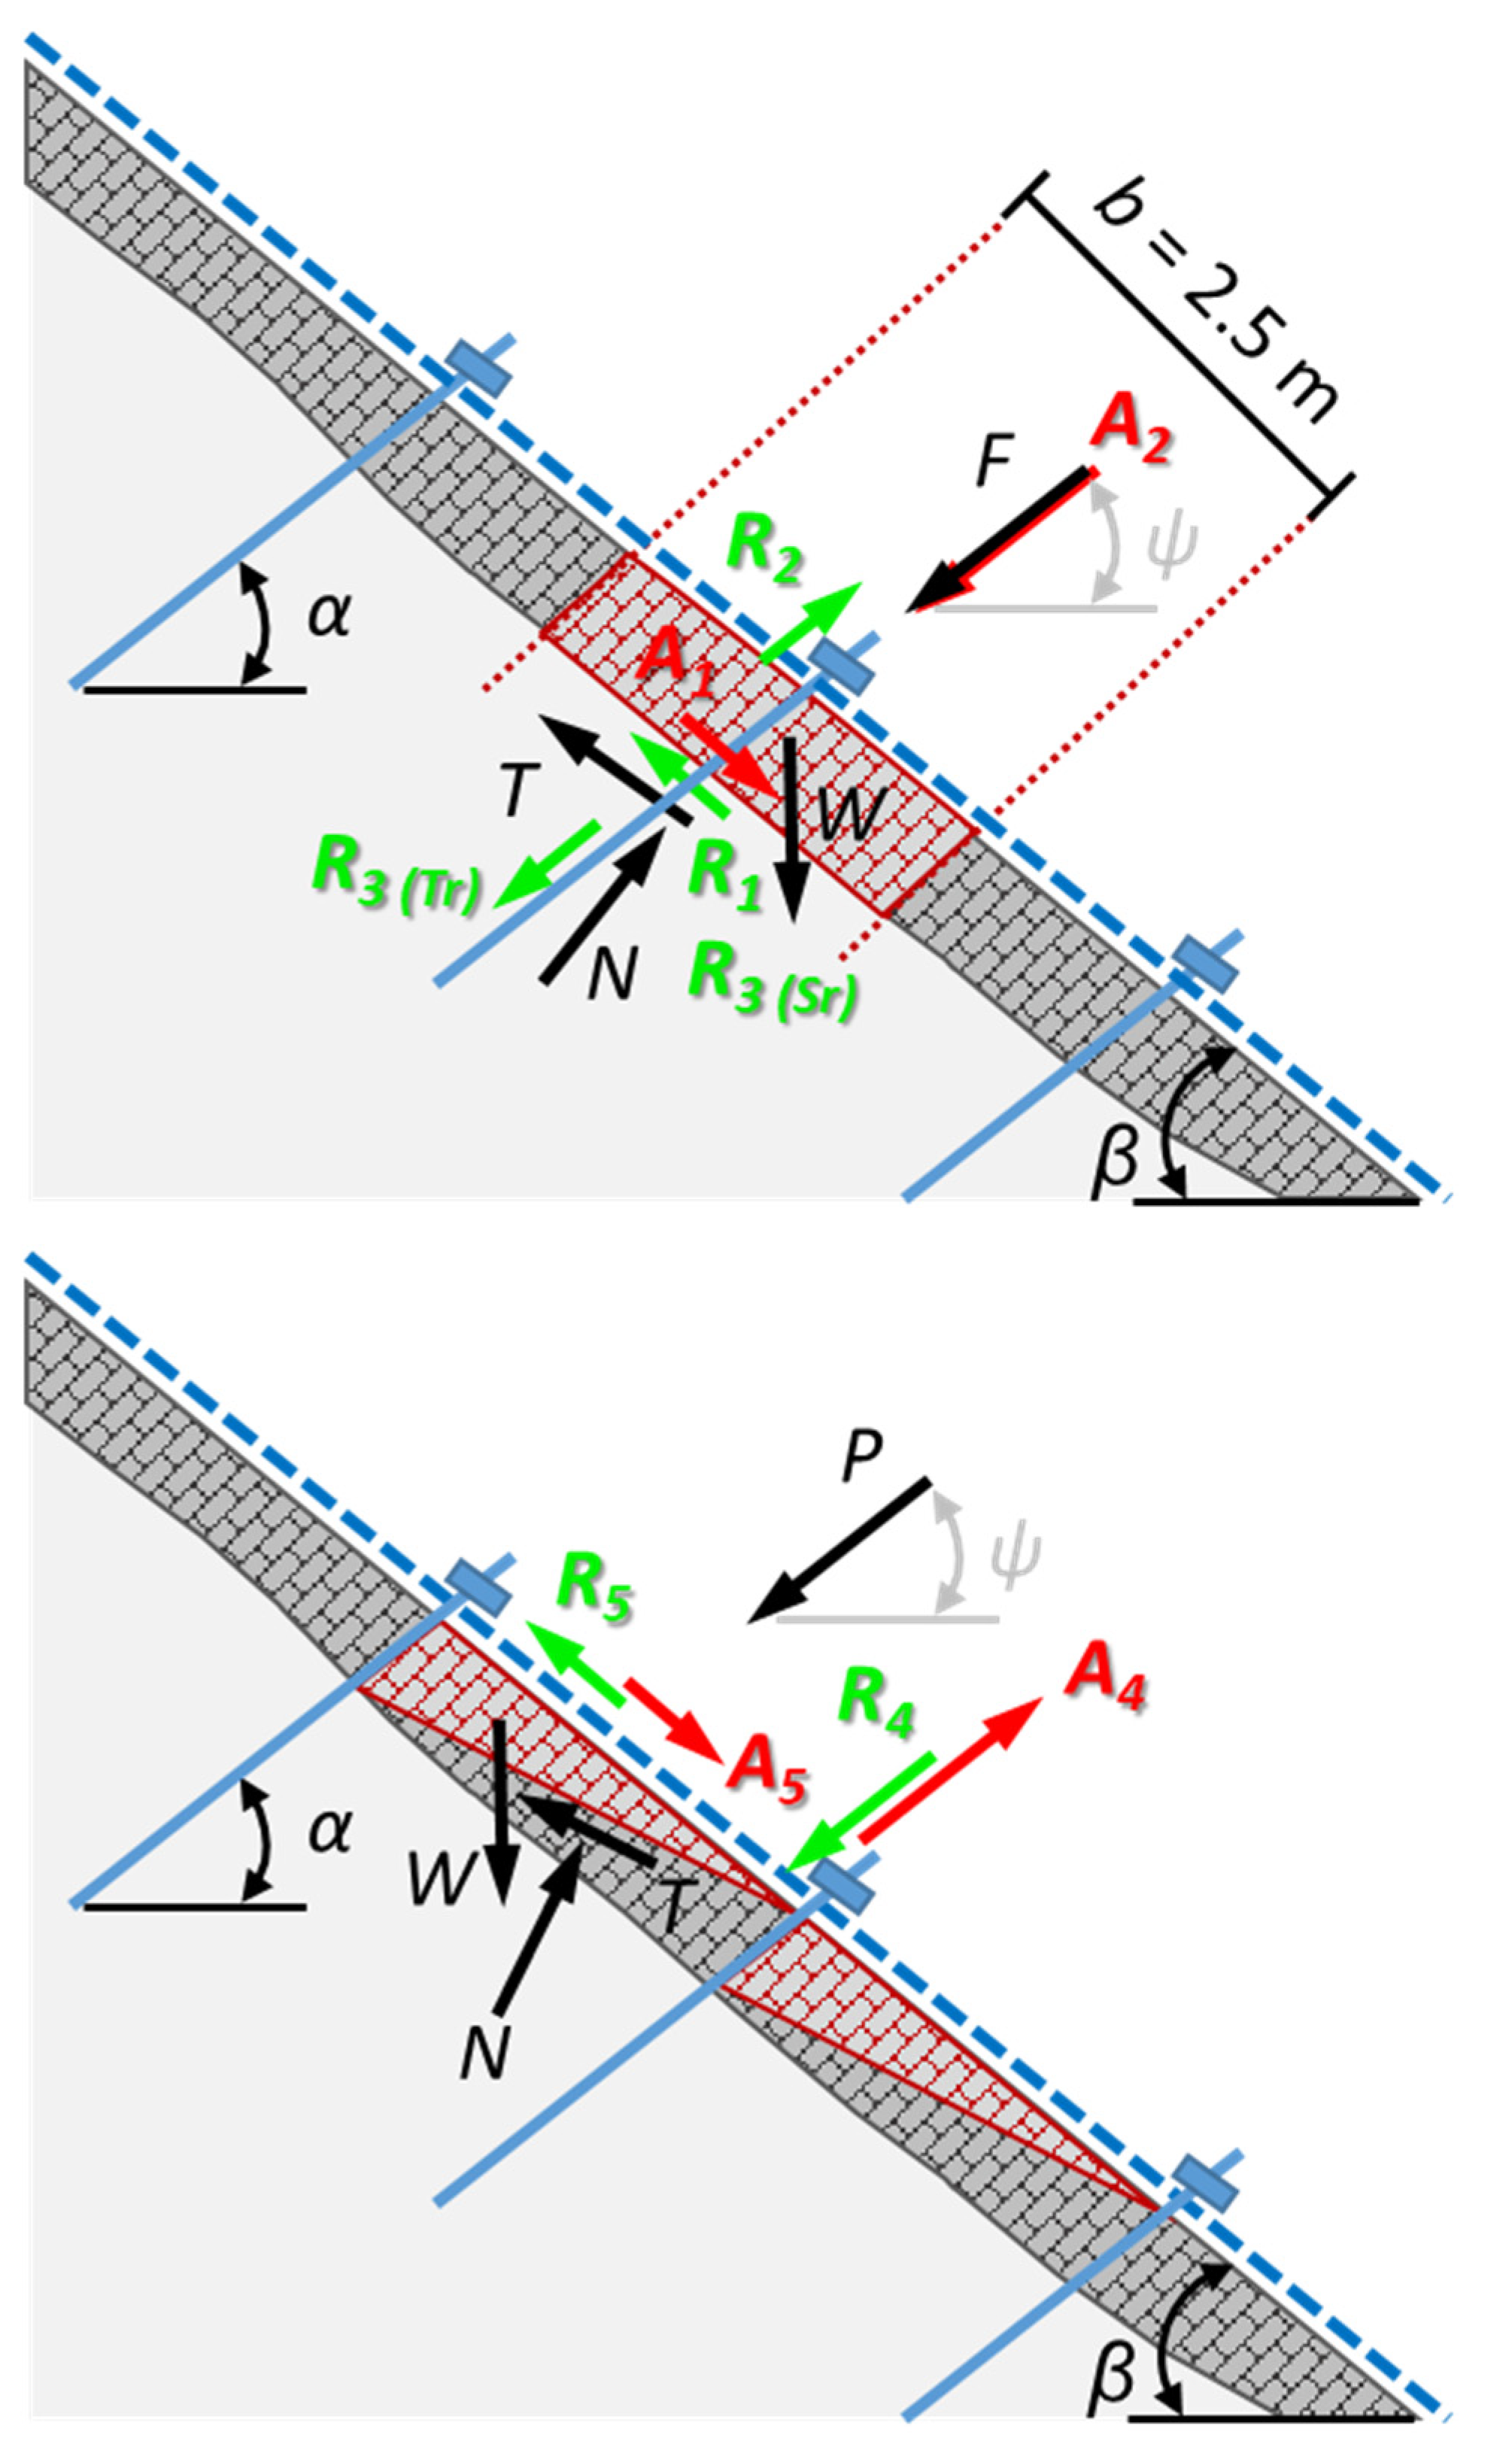
4.2. Example 2: Effectiveness of Rock Fall Protection in the Propagation Zone

In this example, the slope in Figure 5 is characterised by a potential hazard due to the release of blocks of about 5 m3 from highly active cliffs, for which a mean failure frequency of 1 event (1 block) every 20 years was determined. Assets at risk are the buildings of a hamlet and, farther downslope, a road. The hazard zoning along the slope profile, obtained by combining the rock fall mean frequency of failure and rock fall trajectory simulations results (energy and frequency of reach), is shown in Figure 5A. The percentage Pr of trajectories reaching the location of the hamlet xH is assumed to be equal to 84%, the associated energy E to be around 1500 kJ and the height of rebound d of the blocks to be 2.0 m. Farther downslope, at the location of the road, these parameters change to Pr = 20%, E = 150 kJ, d = 0.5 m.
In order to protect the hamlet and the road, an earth embankment was built at location xP, where the frequency of reach is 92%, the rock fall energy is around 1700 kJ and the height of rebound is about 3.6 m. This embankment was designed with an energy absorption capacity of Eopt = 2000 kJ and a height Dopt = 4 m, so that for all trajectories E < Eopt and for 95% of them d < Dopt, i.e., the embankment can intercept 95% of the trajectories crossing its location. For the safety of the assets in danger, it is considered that no hazard should affect the locations of the hamlet and the road, xH and xR, respectively. With reference to the rock fall intensity–frequency diagram used, this means that a mitigation in this example can occur only if, immediately beyond xP and until the road, Em ≈ 0 and Tm > 300 years (condition corresponding to the point at the low right corner of the diagram).
Based the procedure in Section 3 for protection measures in the propagation zone, the performance capacity of the protection can be determined as follows, by analysing at first (a) the hazard without the embankment, then (b) the situation with embankment in perfect working order and, finally, (c) the one in which the structure is affected by certain factors degrading its operation.
(a) From the information about the event introduced above, the hazard at each location xP, xH and xR is given by:
(a.1) location xP:
E = 1700 kJ  Pr = 0.92  T = 1/(Pf · Pr) =1/(1/20 · 0.92) = 22 years
(a.2) location xH:
E = 1500 kJ  Pr = 0.84  T = 1/(Pf · Pr) =1/(1/20 · 0.84) = 24 years
(a.3) location xR:
E = 150 kJ  Pr = 0.20  T = 1/(Pf · Pr) =1/(1/20 · 0.20) = 100 years
(b) With an embankment in perfect working order, the likelihood of a block travelling beyond its location and the corresponding return period can be computed starting from the values of the frequency of reach (Pr = 92%) in absence of measure and the percentage of trajectories intercepted by the measure (95%), thanks to its height Dopt:
Pr,opt = 0.92 (1−0.95) = 0.046   Topt = 1/(Pf · Pr,opt) =1/(1/20 · 0.046) = 434 years
In this case, therefore, even though 4.6% of the trajectories might still develop downslope beyond xP, they constitute no actual hazard regardless of the energy characterising them, as Topt > 300 years.
By computing Pr and T in a similar way at the locations of the hamlet and the road, the hazard at all location of interest is given by, respectively:
(b.1) location xP:
E* ≈ 0 kJ  Pr,opt = 0.046   Topt = 434 years
(b.2) location xH:
E* ≈ 0 kJ  Pr* = 0.84 (1−0.95) = 0.042   T* = 1/(1/20 · 0.042) = 476 years
(b.3) location xR:
E* ≈ 0 kJ  Pr* = 0.20 (1−0.95) = 0.010   T* = 1/(1/20 · 0.010) = 2000 years
In these computations, the energy E*, Pr* and T* at xH and xR are the values of energy, frequency of reach and return period obtained as a consequence of the effect of the embankment. The energy E* of the blocks travelling beyond the protection was considered negligible at each location, based on the considerations just made above. Figure 5B shows the new hazard zoning after mitigation at all locations beyond xP and, in particular, the effects of the embankment in optimal working order at xP, xH and xR, also in terms of hazard evolution on the intensity–frequency diagram.
(c) Let it be assumed that the actual state of the embankment is affected by: (i) the presence of frequent snow, which can cumulate behind its upslope face (Group 0), (ii) a certain lack of the purge of blocks from previous events, (iii) some deformations from previous impacts and (iv) some slight sign of potential stability issues of its upslope face (all these three last factors belonging to Group N). Lack of purge and the presence of impact traces can be considered to be due to, e.g., maintenance problems (Condition 1), while the slight signs of instability to some issues in the original design (Condition 2). Let the qualitative evaluation of the influence of each factor and the values for the corresponding penalty coefficients, en and tn, be the following:
-
Frequent snow: moderate (Condition 0)             t03 = 0.85;
-
Lack of purge: moderate to low (Condition 1)         t15 = 0.90;
-
Deformations due to previous impacts: moderate (Condition 1)  e11 = 0.88;
-
Stability issues of upslope face: very low (Condition 2)      e23 = 0.98  t23 = 0.98.
The effects of snow cumulating behind the embankment and the presence of blocks at the same place are similar in that they mostly modify the effective height of the structure: thus, only a coefficient t was defined to model them. Previous impacts of blocks, on the other hand, can degrade the energy absorption capacity of the embankment; consequently, only a coefficient e was specified. Stability issues were instead considered to affect both parameters. Based on Equations (7), (8), (10) and (11), the reduced performance capacity of the embankment can then be evaluated as:
Eeff = Eopt · ∏j e0j = Eopt = 2000 kJ
Deff = Dopt · ∏j t0j = Dopt · t03 = 4 · 0.85 = 3.4 m
Ered = Eeff · ∏hk ehk = Eeff · e11 · e23 = 2000 ∙ 0.88 ∙ 0.98 = 1725 kJ    E < Ered
Dred = Deff · ∏hk thk = Deff · t15 · t23 = 3.6 ∙ 0.90 ∙ 0.98 = 3.2 m
In spite of quite an important reduction of energy absorption capacity, the current conditions of the embankment still allow it to withstand the potential impacts of the event considered. On the other hand, after the reduction of the effective height, it results: d > Dred. It must be checked therefore, according to Equation (19), what increase in frequency of reach this decrease in effective height produces. Under the hypothesis that Dred = 3.2 implies an increase in frequency of 33%, based, e.g., on the analysis of trajectory simulation results at xP, the reduced value of the return period Tred is given by:
Tred = 1/(Pf · Pr,aug) = 1/(1/20 · 0.046 · 1.33) = 327 years    Tred > Tm
By applying the same reduction at the locations xH and xR, the hazard is equal to:
(c.1) location xP:
E* ≈ 0 kJ  Pr,aug = 0.061    Tred = 327 years
(c.2) location xH:
E* ≈ 0 kJ  Pr* = 0.042 ∙ 1.33 = 0.056    T* = 1/(1/20 · 0.056) = 358 years
(c.3) location xR:
E* ≈ 0 kJ  Pr* = 0.010 ∙ 1.33 = 0.013    T* = 1/(1/20 · 0.013) = 1503 years
where E*, Pr* and T* are, like in case b), the values of frequency of reach and return period associated to the effect of the embankment. Again, it was put E* ≈ 0 at all locations, including xH and xR. Despite the reduction in height and, consequently, in the return period value, Equation (19) is still satisfied, as E < Ered and Tred > Tm = 300 years (at xP and beyond); therefore, the embankment would still be able to mitigate the existing threat (Figure 5C), as the obtained return period values demonstrate no relevance for hazard assessment and zoning (i.e., high return period value compared to the scale of life time of all elements potentially endangered: persons, buildings, roads/other engineering works and, up to some extent, environment). The intensity–frequency diagram in Figure 5C allows us to visualise how the hazard is reduced at the locations of interest in comparison to the absence of embankment; at the same time, it also shows how the hazard slightly increases (to still negligible levels, though) due to the reduced performance capacity of the measure, when compared to the situation of the embankment in optimal working order (gray arrows and hollow circles).
Even though in presence of an embankment with reduced performance capacity it still results: E < Ered and Tred > Tm = 300 years, the situation should be carefully dealt with, due to a considerable reduction of the optimal performance capacity (−14% in terms of energy absorption capacity of the embankment and 25% reduction in the return period values). Measures to restore as much as possible the performance capacity of the embankment towards optimal should therefore be planned, such as, e.g., purge of the snow and blocks behind the structure, reinforcement of the damaged parts, etc.

5. Discussion

The approach presented constitutes a promising framework for the evaluation of the performance capacity of rock fall protections, and its application is quite simple and quick. However, as the evaluation method is based on a heuristic approach built on a system of coefficients for modelling the reduction of performance, it is of the utmost importance that these coefficients are appropriately calibrated. This procedure is very complex, first of all due to the diversity of the existing protection measures and, therefore, the number and type of coefficients to be considered. The calibration of some penalty coefficients, for instance those representing the effect of damaged posts in barrier fences, or damaged zones in embankments due to previous impacts, could be performed with the help of finite element modelling, by studying the response of the “damaged” structure to the impact of a block characterised by the mass, height of rebound and velocity obtained from appropriate simulations of the rock fall event at the study site. On the other hand, if FE modelling could be suitable in some cases (as those mentioned and/or others, such as the capacity to bear cyclic loading or to undergo plastic deformations), other concepts and methods are needed for determining coefficients accounting for totally different problems.
In this respect, engineering judgement can play a beneficial role in assigning fairly reliable estimations for certain coefficients, including those describing less easily predictable/quantifiable effects (e.g., corrosion of specific elements of a given protection or erosion due to water running in proximity of the foundations of structural measures). However, such kinds of evaluations carry a certain degree of uncertainty due to subjectivities inherent to engineering judgement, which should be kept in mind when interpreting the results obtained and taking decision based on them.
Another point worth underlining is that the specificity of each case study might present constraints for which the calibration of some penalty coefficients could need to be performed in each different situation encountered. This is the case for coefficients very much depending on the trajectories of the blocks: for instance, the coefficients accounting for a reduction of the effective height of a structural measure in the propagation zone, due to the accumulation of material behind it (such as snow, vegetation, debris, blocks from previous events). For a given site, rock fall simulations could allow one to determine how the frequency of reach is increased, once the reduced height of the measure has been accounted for, and allow the calculation of Tred as shown in Example 2 (Section 4.2). Typically, these values for the coefficients tn would most likely not be applicable to another case study, as the trajectories of the blocks depend, site-wise, on the topographic features and materials covering the surface of the slope (in addition to block-related parameters, e.g., mass, size, shape, initial velocity, rotation and height of free fall, as a function of the mechanisms of failure, etc.).
Defining, therefore, appropriate values for the penalty coefficients, in order to ensure a good scientific basis of the results obtained in each application, is quite a challenging task and needs to be addressed carefully. It is important therefore to stress that, even after the completion of the calibration procedure, the penalty coefficients obtained (together with the corresponding sub-sets used to translate the qualitative appreciation of the degrading factors made on site into quantitative values), should mostly be viewed as a general guide for assigning proper values. These should be used critically, appropriately adapted/adjusted to the situation studied and, in line with this principle, updated whenever possible by new knowledge and the growing experience in the respective topics.
In relation with the number and types of penalty coefficients established in the methodology, the definition of the factors these coefficients represent was based, as mentioned in Section 3, on a rock fall protection database built for some areas of the Swiss territory. This was used as a reference for including an initial set of factors to account for in the methodology, and have therefore a starting point in this sense, based on most common potential flaws and malfunctioning observed directly on site. Nevertheless, the lists of factors considered, especially concerning those specific to each protection (Group N), should not be considered as exhaustive and definitive. On the contrary, the methodology features a flexible character allowing new factors and related penalty coefficients to be in principle added any time, to expand the current list for each protection and keep the methodology up to date with the progresses in technology and design of new rock fall protections. In addition, if required, it is even possible to entirely implement other existing types of protections and associated factors (e.g., canopy of rock fall fences, protection galleries). Further advantages of the methodology linked to its flexibility are also the possibilities to apply it to any rock fall scenario/case study, as well as any rock fall hazard guidelines, if existing [5,6,23,24], or, more simply, rock fall intensity–frequency diagram [25,26,27]. In particular, regarding the former point, applications of the methodology are not restricted to natural slopes such as in the examples provided, but can include, in a relatively straightforward manner, contexts involving engineered slopes for which rock fall protections might be needed, such as road cuts or open-pit mining and quarrying [28,29,30]. As an example, for open-pit mining, benches could be added among the topographic modifications as a new type of protections (segments of slope connecting an upper and a lower flat “catch-bench” area, designed to collect falling blocks); their main design parameter could be defined as their width and, among the most relevant factors to take into account for potential reduction of their performance capacity, the phenomenon of backbreak could be considered—reduction of the width (i.e., capacity to collect blocks) due to rupture at the crest of the slope segment constituting the bench [28].

6. Conclusions

This work presents a methodological framework for the preliminary evaluation of the performance of existing rock fall protection measures, based on their current conditions, and the effects of their actual performance on hazard zoning. Three main steps characterise the approach proposed. At first, a field survey is carried out, for inspecting protection measures at the site of interest and assessing qualitatively the degree of severity of factors potentially degrading their performance. These factors can be related to the interaction with the environment and/or the design and operation of each specific protection. Then, the second step consists of an evaluation of the reduced performance capacity of the rock fall protections, expressed in terms of their main design parameters. This evaluation is based on so-called penalty coefficients, which quantitatively reflect the level of severity of the factors estimated on site and reduce the performance capacity of the protections, starting from their optimal value, corresponding to the original design specifications. Finally, based on the reduced performance capacity, the last phase of the methodology allows one to assess whether the protections are still able to perform their hazard mitigation action at the slope locations concerned. If so, the hazard zoning map can include the mitigation effects, representing the new zones obtained as hatched zones; if not, the protections must be declared unserviceable and, until reparations or replacements take place, the hazard zoning map should be rather represented as if no protection were present at the site.
The approach proposed is simple and relatively quick to use, yet effective. It constitutes a promising framework for determining the role of existing rock fall protections in hazard assessment procedures and is characterised by a good flexibility of application. Such flexibility allows to (i) carry out the evaluation of the performance capacity for several types of protection measures, already included in the methodology (either at the source area or in the propagation zone), (ii) update the current set of penalty coefficients and potentially implement new ones (and even new protections) in a straightforward manner, (iii) use the approach based on any rock fall hazard national guidelines and/or rock fall intensity–frequency diagrams and, in principle, (iv) easily extend the possibilities of application from natural to engineered slopes.

Author Contributions

Conceptualization, E.P.H. and J.M.A.; methodology, E.P.H.; software, J.M.A.; validation, E.P.H., J.M.A.; formal analysis, E.P.H.; investigation, J.M.A.; resources, J.M.A.; data curation, J.M.A.; writing—original draft preparation, J.M.A.; writing—review and editing, E.P.H.; visualization, E.P.H.; supervision, E.P.H.; project administration, E.P.H.; funding acquisition, E.P.H. All authors have read and agreed to the published version of the manuscript.

Funding

This research was funded by Natural Hazards Unit, Canton of Vaud and The APC was funded by the School of Management and Engineering Vaud (HEIG-VD).

Institutional Review Board Statement

Not applicable.

Informed Consent Statement

Not applicable.

Conflicts of Interest

The authors declare no conflict of interest.

References

  1. Cascini, L.; Bonnard, C.; Corominas, J.; Jibson, R.; Montero-Olarte, J. Landslide hazard and risk zoning for urban planning and development. In Proceedings of the International Conference on Landslide Risk Management, Vancouver, BC, Canada, 31 May–3 June 2005; Balkema: Rotterdam, The Netherlands, 2005; pp. 199–235. [Google Scholar]
  2. Fell, R.; Corominas, J.; Bonnard, C.; Cascini, L.; Leroi, E.; Savage, W.Z.; on behalf of the JTC-1 Joint Technical Committee on Landslides and Engineered Slopes. Guidelines for landslide susceptibility, hazard and risk zoning for land use planning. Eng. Geol. 2008, 102, 85–98. [Google Scholar] [CrossRef]
  3. Labiouse, V.; Abbruzzese, J.M. Rockfall hazard zoning for land use planning. In Rockfall Engineering; Lambert, S., Nicot, F., Eds.; John Wiley & Sons: New York, NY, USA, 2011; pp. 211–253. [Google Scholar]
  4. Corominas, J.; Copons, R.; Vilaplana, J.M.; Altimir, J.; Amigó, J. Integrated landslide susceptibility analysis and hazard assessment in the Principality of Andorra. Nat. Hazards 2003, 30, 421–435. [Google Scholar] [CrossRef]
  5. Ministere De L’amenagement Du Territoire Et De L’environnement; Ministere De L’equipement, Des Transports Et Du Logement. Plans de Prévention des Risques Naturels (PPR), Risques de Mouvements de Terrain, Guide Méthodologique; La documentation Française: Paris, France, 1999. [Google Scholar]
  6. Raetzo, H.; Lateltin, O.; Bollinger, D.; Tripet, J.P. Hazard assessment in Switzerland—Codes of Practice for mass movements. Bull. Eng. Geol. Environ. 2002, 61, 263–268. [Google Scholar]
  7. Lateltin, O.; Haemmig, C.; Raetzo, H.; Bonnard, C. Landslide risk management in Switzerland. Landslides 2005, 2, 313–320. [Google Scholar] [CrossRef]
  8. Volkwein, A.; Melis, L.; Haller, B.; Pfeifer, R. Protection from Landslides and High Speed Rockfall Events–Reconstruction of Chapman’s Peak Drive. In Proceedings of the IABSE Symposium “Structures and Extreme Events”, Lisbon, Portugal, 14–17 September 2005; IABSE Reports. pp. 47–54. [Google Scholar]
  9. Muhunthan, B.; Shu, S.; Sasiharan, N.; Hattamleh, O.A.; Badger, T.C.; Lowell, S.M.; Duffy, J.D. Design Guidelines for Wire Mesh/Cable Net Slope Protection; Report N. WA-RD 612.2; Washington State Transportation Center (TRAC); University of Washington: Washington, DC, USA, 2005. [Google Scholar]
  10. Peila, D.; Oggeri, C.; Castiglia, C. Ground reinforced embankments for rockfall protection: Design and evaluation of full scale tests. Landslides 2007, 4, 255–265. [Google Scholar] [CrossRef]
  11. Peila, D.; Ronco, C. Technical Note: Design of rockfall net fences and the new ETAG 027 European guideline. Nat. Hazards Earth Syst. Sci. 2009, 9, 1291–1298. [Google Scholar] [CrossRef]
  12. Volkwein, A.; Schellenberg, K.; Labiouse, V.; Agliardi, F.; Berger, F.; Bourrier, F.; Dorren, L.K.A.; Gerber, W.; Jaboyedoff, M. Rockfall characterisation and structural protection—A review. Nat. Hazards Earth Syst. Sci. 2011, 11, 2617–2651. [Google Scholar] [CrossRef]
  13. CCC (Christchurch City Council). Technical Guideline for Rockfall Protection Structures; Australian Geomechanics: Perth, Australia, 2013; p. 42. [Google Scholar]
  14. Lambert, S.; Kister, B. Analysis of Existing Rockfall Embankments of Switzerland (AERES), Part A: State of Knowledge; Federal Office for the Environment: Bern, Switzerland, 2017. [Google Scholar]
  15. Prina Howald, E.; Abbruzzese, J.M.; Grisanti, C. An approach for evaluating the role of protection measures in rockfall hazard zoning based on the Swiss experience. Nat. Hazards Earth Syst. Sci. 2017, 17, 1127–1144. [Google Scholar] [CrossRef]
  16. Ronco, C.; Oggeri, C.; Peila, D. Design of reinforced ground embankments used for rockfall protection. Nat. Hazards Earth Syst. Sci. 2009, 9, 1189–1199. [Google Scholar] [CrossRef]
  17. Marchelli, M.; De Biagi, V.; Peila, D. A quick-assessment procedure to evaluate the degree of conservation of rockfall drapery meshes. Frattura ed Integrità Strutturale 2019, 47, 437–450. [Google Scholar] [CrossRef]
  18. Fell, R.; Ho, K.K.S.; Lacasse, S.; Leroi, E. A framework for landslide risk assessment and management. In Landslide Risk Management; Hungr, O., Fell, R., Couture, R., Eberhardt, E., Eds.; Taylor & Francis Group: London, UK, 2005; pp. 3–25. [Google Scholar]
  19. Keusen, H.; Gerber, W.; Rovina, H. Partie C: Processus de Chute—Évaluation de L’effet des Mesures de Protection Contre les Dangers Naturels pour Fonder leur Prise en Compte dans L’amenagement du Territoire; PLANAT: Bern, Switzerland, 2008. [Google Scholar]
  20. Scavia, C.; Barbero, M.; Castelli, M.; Marchelli, M.; Peila, D.; Torsello, G.; Vallero, G. Evaluating Rockfall Risk: Some Critical Aspects. Geosciences 2020, 10, 98. [Google Scholar] [CrossRef] [Green Version]
  21. Grisanti, C.; Prina Howald, E. Methodology for analyzing the effects of protective measures for falling blocks in the Canton of Vaud, Switzerland. In Proceedings of the 13th ISRM International Congress of Rock Mechanics, Montreal, QC, Canada, 10–13 May 2015; ISRM: Salzburg, Austria, 2015. [Google Scholar]
  22. Geobrugg. Tecco System—Publications 1998–2019. Technical Documentation (03/19). 2020. Available online: http://www.geobrugg.com (accessed on 22 June 2020).
  23. Interreg Iic. Prévention des Mouvements de Versants et des Instabilités de Falaises: Confrontation des Méthodes D’étude D’éboulements Rocheux dans l’arc Alpin; Interreg Communauté Européenne, 2001. [Google Scholar]
  24. AGS (Australian Geomechanics Society). Landslide Risk Management Concepts and Guidelines; Australian Geomechanics Society Sub-Committee on Landslide Risk Management, 2007; pp. 51–70. Available online: http://www.australiangeomechanics.org/resources/downloads (accessed on 24 June 2020).
  25. Crosta, G.B.; Agliardi, F. A methodology for physically based rockfall hazard assessment. Nat. Hazards Earth Syst. Sci. 2003, 3, 407–422. [Google Scholar] [CrossRef]
  26. Corominas, J.; van Westen, C.; Frattini, P.; Cascini, L.; Malet, J.-P.; Fotopoulou, S.; Catani, F.; Van Den Eeckhaut, M.; Mavrouli, O.; Agliardi, F.; et al. Recommendations for the quantitative analysis of landslide risk. Bull. Eng. Geol. Environ. 2014, 73, 209–263. [Google Scholar] [CrossRef]
  27. Abbruzzese, J.M.; Labiouse, V. New Cadanav methodology for quantitative rock fall hazard assessment and zoning at the local scale. Landslides 2013, 11, 551–564. [Google Scholar] [CrossRef]
  28. Alejano, L.R.; Pons, B.; Bastante, F.G.; Alonso, E.; Stockhausen, H.W. Slope geometry design as a means of rockfall control in quarries. Int. J. Rock Mech. Min. Sci. 2007, 44, 903–921. [Google Scholar] [CrossRef]
  29. Alejano, L.R.; Stockhausen, H.; Bastante, F.G.; Alonso, E.; Ramírez-Oyanguren, P. ROFRAQ: A statistics-based empirical method for assessing accident risk from rockfalls in quarries. Int. J. Rock Mech. Min. Sci. 2008, 45, 1252–1272. [Google Scholar] [CrossRef]
  30. Thoeni, K.; Giacomini, A.; Sloan, S.W.; Lambert, C.; Casagrande, D. Numerical analysis of rockfall hazard in open pit coal mines. In Proceedings of the 13th International Conference of the International Association for Computer methods and Advances in Geomechanics (IACMAG 13), Melbourne, Australia, 9–11 May 2011; pp. 1151–1156. [Google Scholar]
Figure 1. Scheme of the methodological framework for evaluating the effectiveness of rock fall protections.
Applsci 12 08834 g001
Figure 2. Requalification of hazard zones and corresponding representation in hazard zoning maps, with reference to the rock fall intensity–frequency diagram used in the Swiss Codes.
Applsci 12 08834 g002
Figure 3. Example 1: hazard zoning obtained along the slope without and with the effects of a protection system installed at the rock fall source area. The mitigation effects all over the slope are illustrated with reference to the Swiss rock fall intensity–frequency diagram.
Applsci 12 08834 g003
Figure 4. Scheme of the equilibrium problem for the proofs of safety of the protection system assumed. Top: equilibrium problem for proofs of safety 1, 2 and 3; Bottom: equilibrium problem for proofs of safety 4 and 5. Destabilising and stabilising actions in the general equilibrium problem, as well as the forces in the nails, are marked in black; specific resulting actions A(i) and corresponding resistances R(i) to be considered for the proofs of safety are marked in red and green, respectively.
Applsci 12 08834 g004
Figure 5. Example 2: hazard zoning obtained along the slope based on the presence of an earth embankment in the rock fall propagation zone. (A) Hazard zoning without embankment. (B) Hazard zoning with embankment in optimal working order. (C) Hazard zoning with embankment with reduced performance capacity. The mitigation effects at each location of interest are illustrated with reference to the Swiss rock fall intensity–frequency diagram.
Applsci 12 08834 g005aApplsci 12 08834 g005b
Table 1. List of factors potentially degrading the performance of rock fall protection measures—Group 0 (most/all types of protections).
n.FactorType
1Proximity of a stream and/or action of rainwaterEnvironment
2Freezing/thawingEnvironment
3Frequent snowEnvironment
4Presence of outcropping rock before the measureEnvironment
5Damages due to animalsEnvironment
6Manufacturing faultsProtection measure
7Possibility of plastic deformationsProtection measure
8Redundancy of load-bearing elementsProtection measure
9Consistency of the structure/points of weaknessProtection measure
10Respect of current normsProtection measure
11Resistance to cyclic loadingProtection measure
Table 2. List of factors potentially degrading the performance of rock fall protection measures—Group N (factors specific to each type of protection measure)—cont.
(1) Mesh Wire/Cable Nets
n.FactorsTypeCategory
General
1Corrosion of the meshMaintenance, design, life span1, 2, 4
2Damages to mesh Maintenance, life span1, 4
3Excessive deformation of the meshMaintenance, design, life span1, 2, 4
4 Lack of connectors between mesh drapes (clips, knots)Maintenance, installation1, 3
5Damages to cables Maintenance, design, life span1, 2, 4
6Loosening or loss of connection of cablesMaintenance, installation1, 3
7Lack of connectors cable/mesh (clips, knots)Maintenance, installation1, 3
Mesh wire nets with shotcrete/mesh wire with shotcrete and nails—Sub-type specific
6Corrosion of the meshMaintenance, design, life span1, 2, 4
7Faults of injection (sealing)Installation3
Mesh wire nets, plated, with nails—Sub-type specific
8Corrosion of nails (uniform or localised)Maintenance, design, life span1, 2, 4
9Faults of injection (sealing of nails)Installation3
(2) Nails
n.FactorsTypeCategory
1Corrosion (uniform or localised)Maintenance, design, life span1, 2, 4
2Faults of injection (sealing)Installation3
(3) Anchors
n.FactorsFactorsCategory
1CorrosionMaintenance, design, life span1, 2, 4
2Rupture of the anchorMaintenance, design, installation, life span1, 2, 3, 4
3Rupture of the head plateDesign, installation2, 3
4Faults of injection (sealing)Installation3
5Flaws in controlling applied stressMaintenance, design, installation1, 2, 3
(4) Barrier Fences
n.FactorsTypeCategory
General (low and high energy vertical barrier fences)
1Points of weakness along rock fall preferential pathsDesign2
2Homologation of the structural measureDesign2
3Corrosion of supporting elementsMaintenance, design, life span1, 2, 4
4Corrosion of the netMaintenance, design, life span1, 2, 4
5Loss of effective height due to partially filled netMaintenance1
6Damages to supports after impactsMaintenance, life span 1, 4
High energy vertical barrier fences—Sub-type specific
7Loss of galvanisation of the netMaintenance, design, life span1, 2, 4
8Loss of the torque wrench locking of cables Installation3
9Fissures on the tubes of the energy dissipating devicesMaintenance, design, life span1, 2, 4
10Deformed or loosened cablesMaintenance, life span1, 4
(5) Embankments
n.FactorsTypeCategory
General (earth and masonry embankments)
1Significant deformations due to previous impactsMaintenance, design, installation, life span1, 2, 3, 4
2Instability after impactDesign, life span2, 4
3Instability of any of the faces of the embankmentMaintenance, design, installation1, 2, 3
4Penetration by blocksMaintenance, life span1, 4
5Loss of effective height due to blocks cumulated behindMaintenance1
6Possibility of fragments thrown over the structureMaintenance, life span1, 4
7Possibility of blocks rolling over the upslope faceLife span4
(6) Retaining Walls
n.FactorsTypeCategory
General (concrete, masonry, gabion, anchored and wooden walls)
1Loss of effective height due to blocks cumulated behindMaintenance1
Concrete wall—Sub-type specific
2Corrosion of reinforcement rebarsMaintenance, design, life span1, 2, 4
Gabion wall—Sub-type specific
3CorrosionMaintenance, design, life span1, 2, 4
Anchored wall—Sub-type specific
4CorrosionMaintenance, design, life span1, 2, 4
5Rupture of the anchorMaintenance, design, installation, life span1, 2, 3, 4
6Rupture of the head plateDesign, installation2, 3
7Faults of injection (sealing)Installation3
8Flaws in controlling applied stressMaintenance, design, installation1, 2, 3
Wooden wall—Sub-type specific
9Corrosion of metal elementsMaintenance, design, life span1, 2, 4
10Fire Maintenance, design1, 4
11Penetration by blocksMaintenance, life span1, 4
12Rupture of componentsMaintenance, life span1, 4
(7) Ditches and berms
n.FactorsTypeCategory
Ditches
1“Springboard” effect due to fillingMaintenance, design1, 2
2Instability of any of the faces of the ditchMaintenance, design, installation1, 2, 3
3Loss of effective depth due to blocks cumulated insideMaintenance1
Berms
4Loss of effective height due to blocks cumulated behindMaintenance1
5Possibility of blocks rolling over the downslope faceLife span4
6Instability of any of the faces of the bermMaintenance, design, installation1, 2, 3
Publisher’s Note: MDPI stays neutral with regard to jurisdictional claims in published maps and institutional affiliations.

