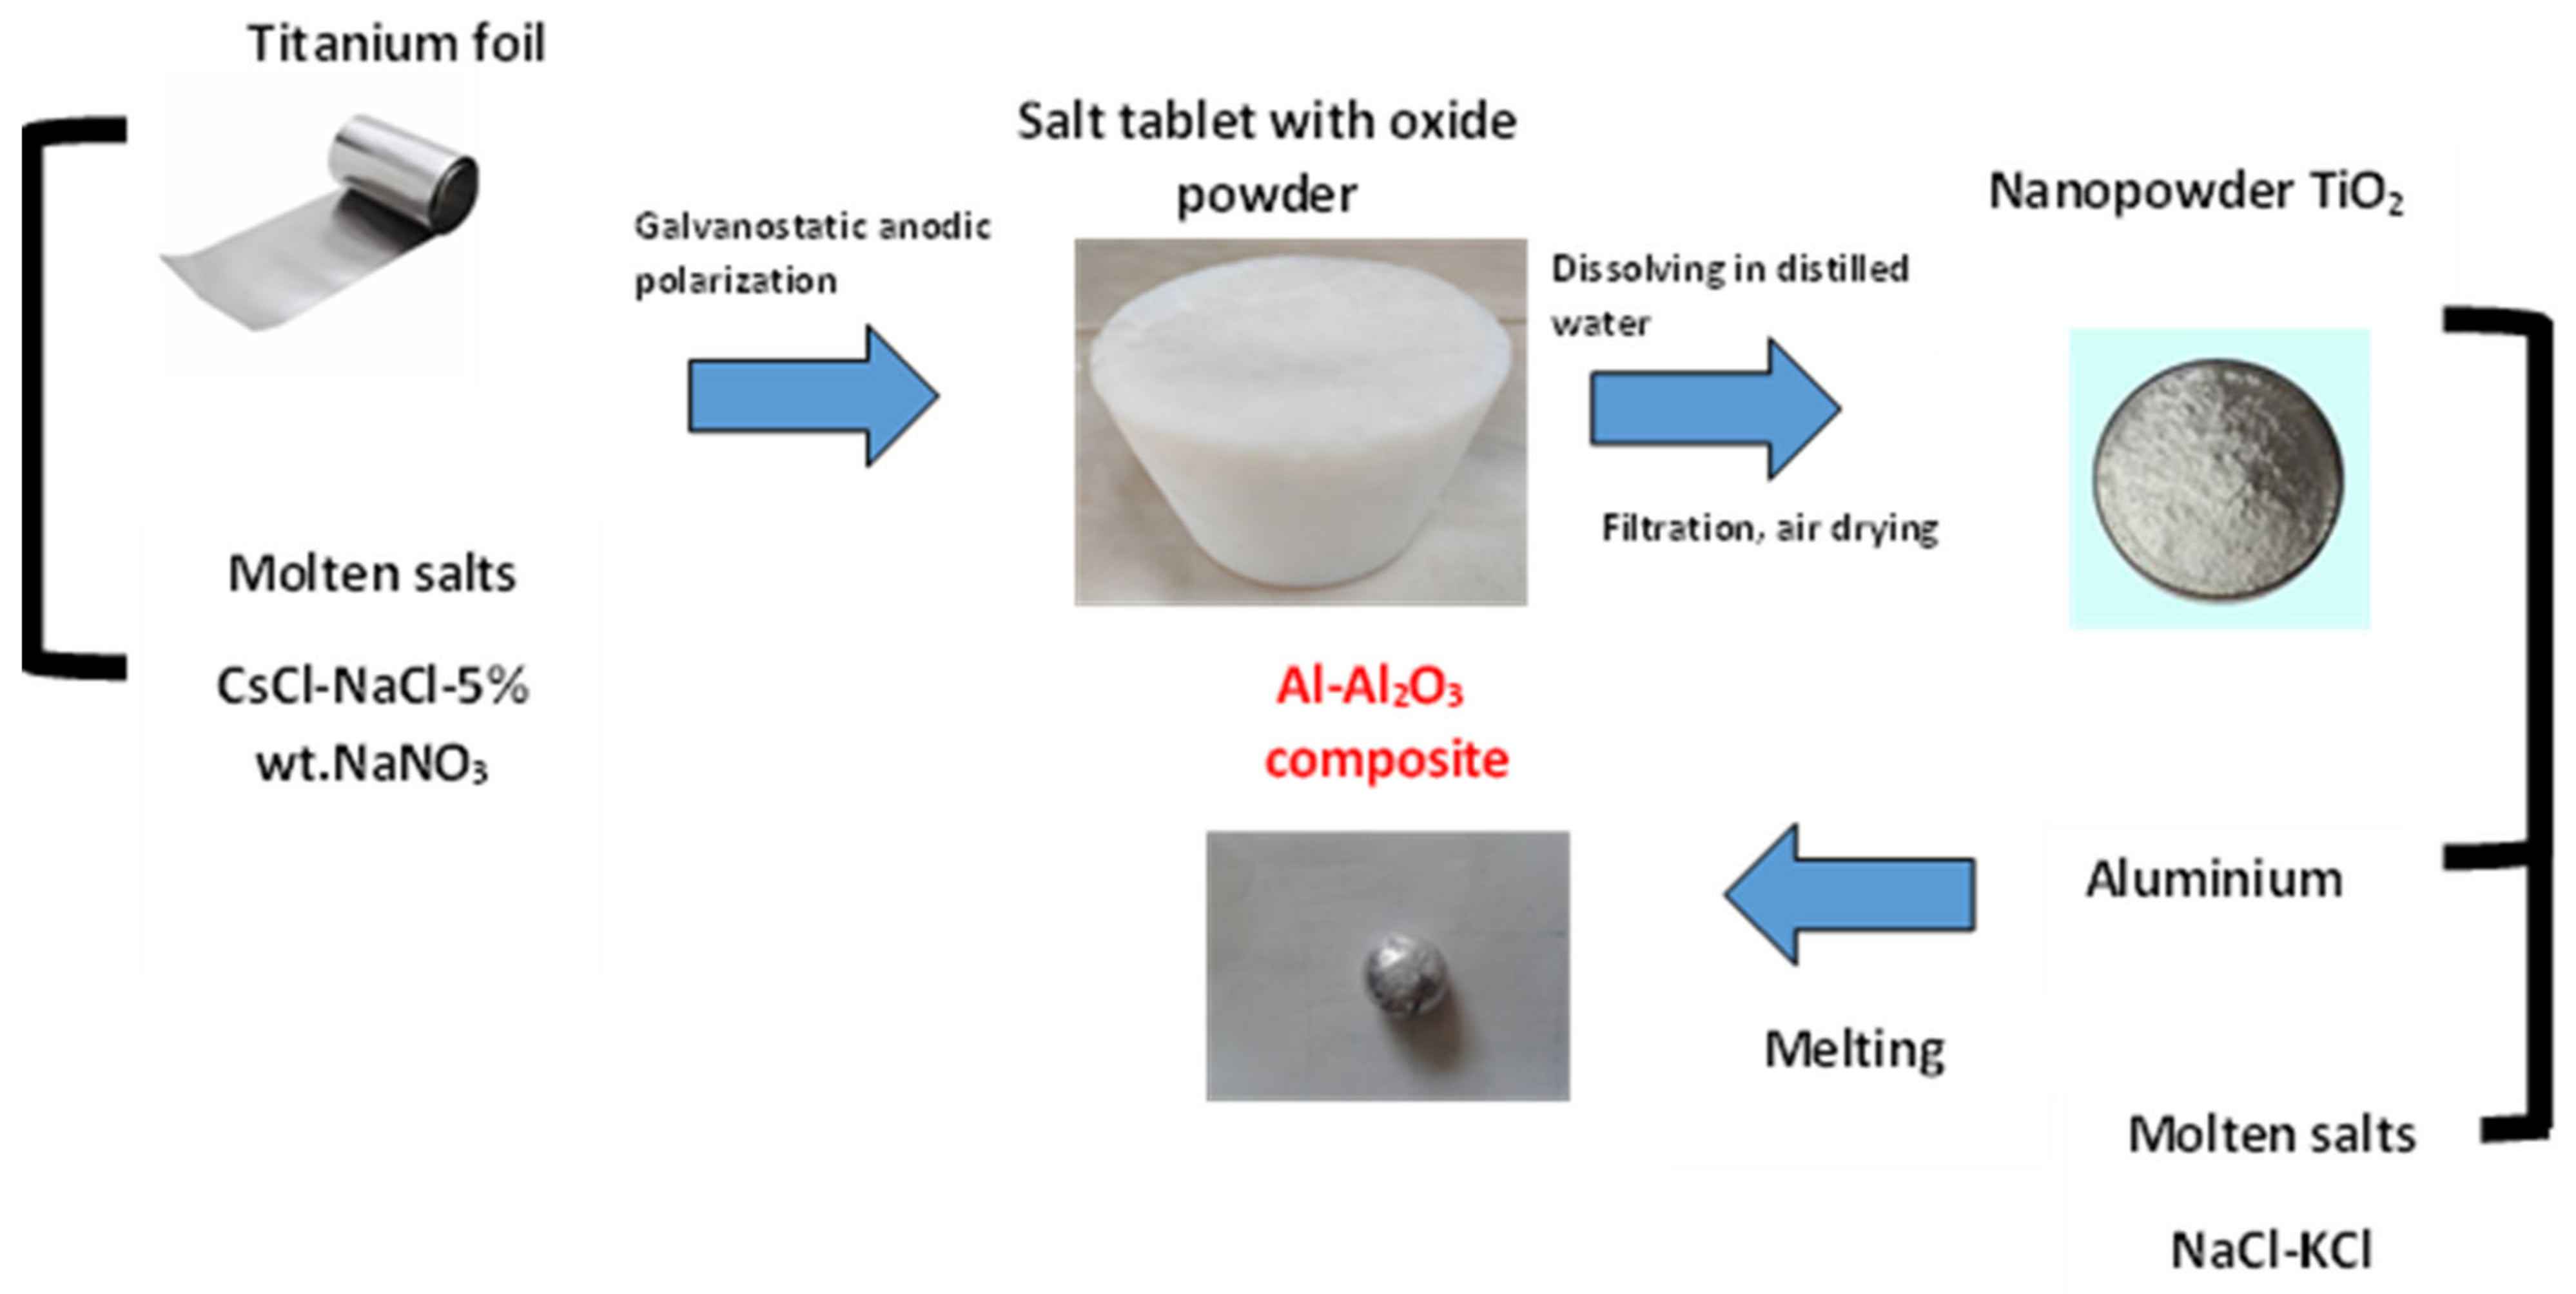
3.1. Formation of Nano-Titanium Dioxide as a Precursor
The formation of titanium nano-oxide powders as precursors of composite synthesis was carried out by electrochemical oxidation of pure titanium in a chloride-nitrate melt in an argon atmosphere [
27]. The main function of the nitrate melt is corrosion protection against the aggressive environment due to the formation of dense protective oxide layers on metals. Chloride-nitrate melts allow synthesizing both dense protective coatings and nanocrystalline powders of metal oxides such as Al
2O
3, TiO
2, ZrO
2, and PbO [
33,
34] varying the nitrate concentration in the flux. Due to the alkali nitrates’ thermal instability, the temperature range of their application is narrow, while amorphous oxides are usually formed at low temperatures. It is necessary to synthesize oxides using salt electrolytes with higher melting points to increase the temperature of the crystalline metal oxide synthesis.
The metal oxidation in the chloride-nitrate salt melt bulk at the current densities ranging from 3 to 5 mA/cm2 lead to the accumulation of significant amounts of oxide nanopowder in the bulk salt electrolyte. The chemical composition and modification of the formed oxides depended mainly on the oxidation temperature.
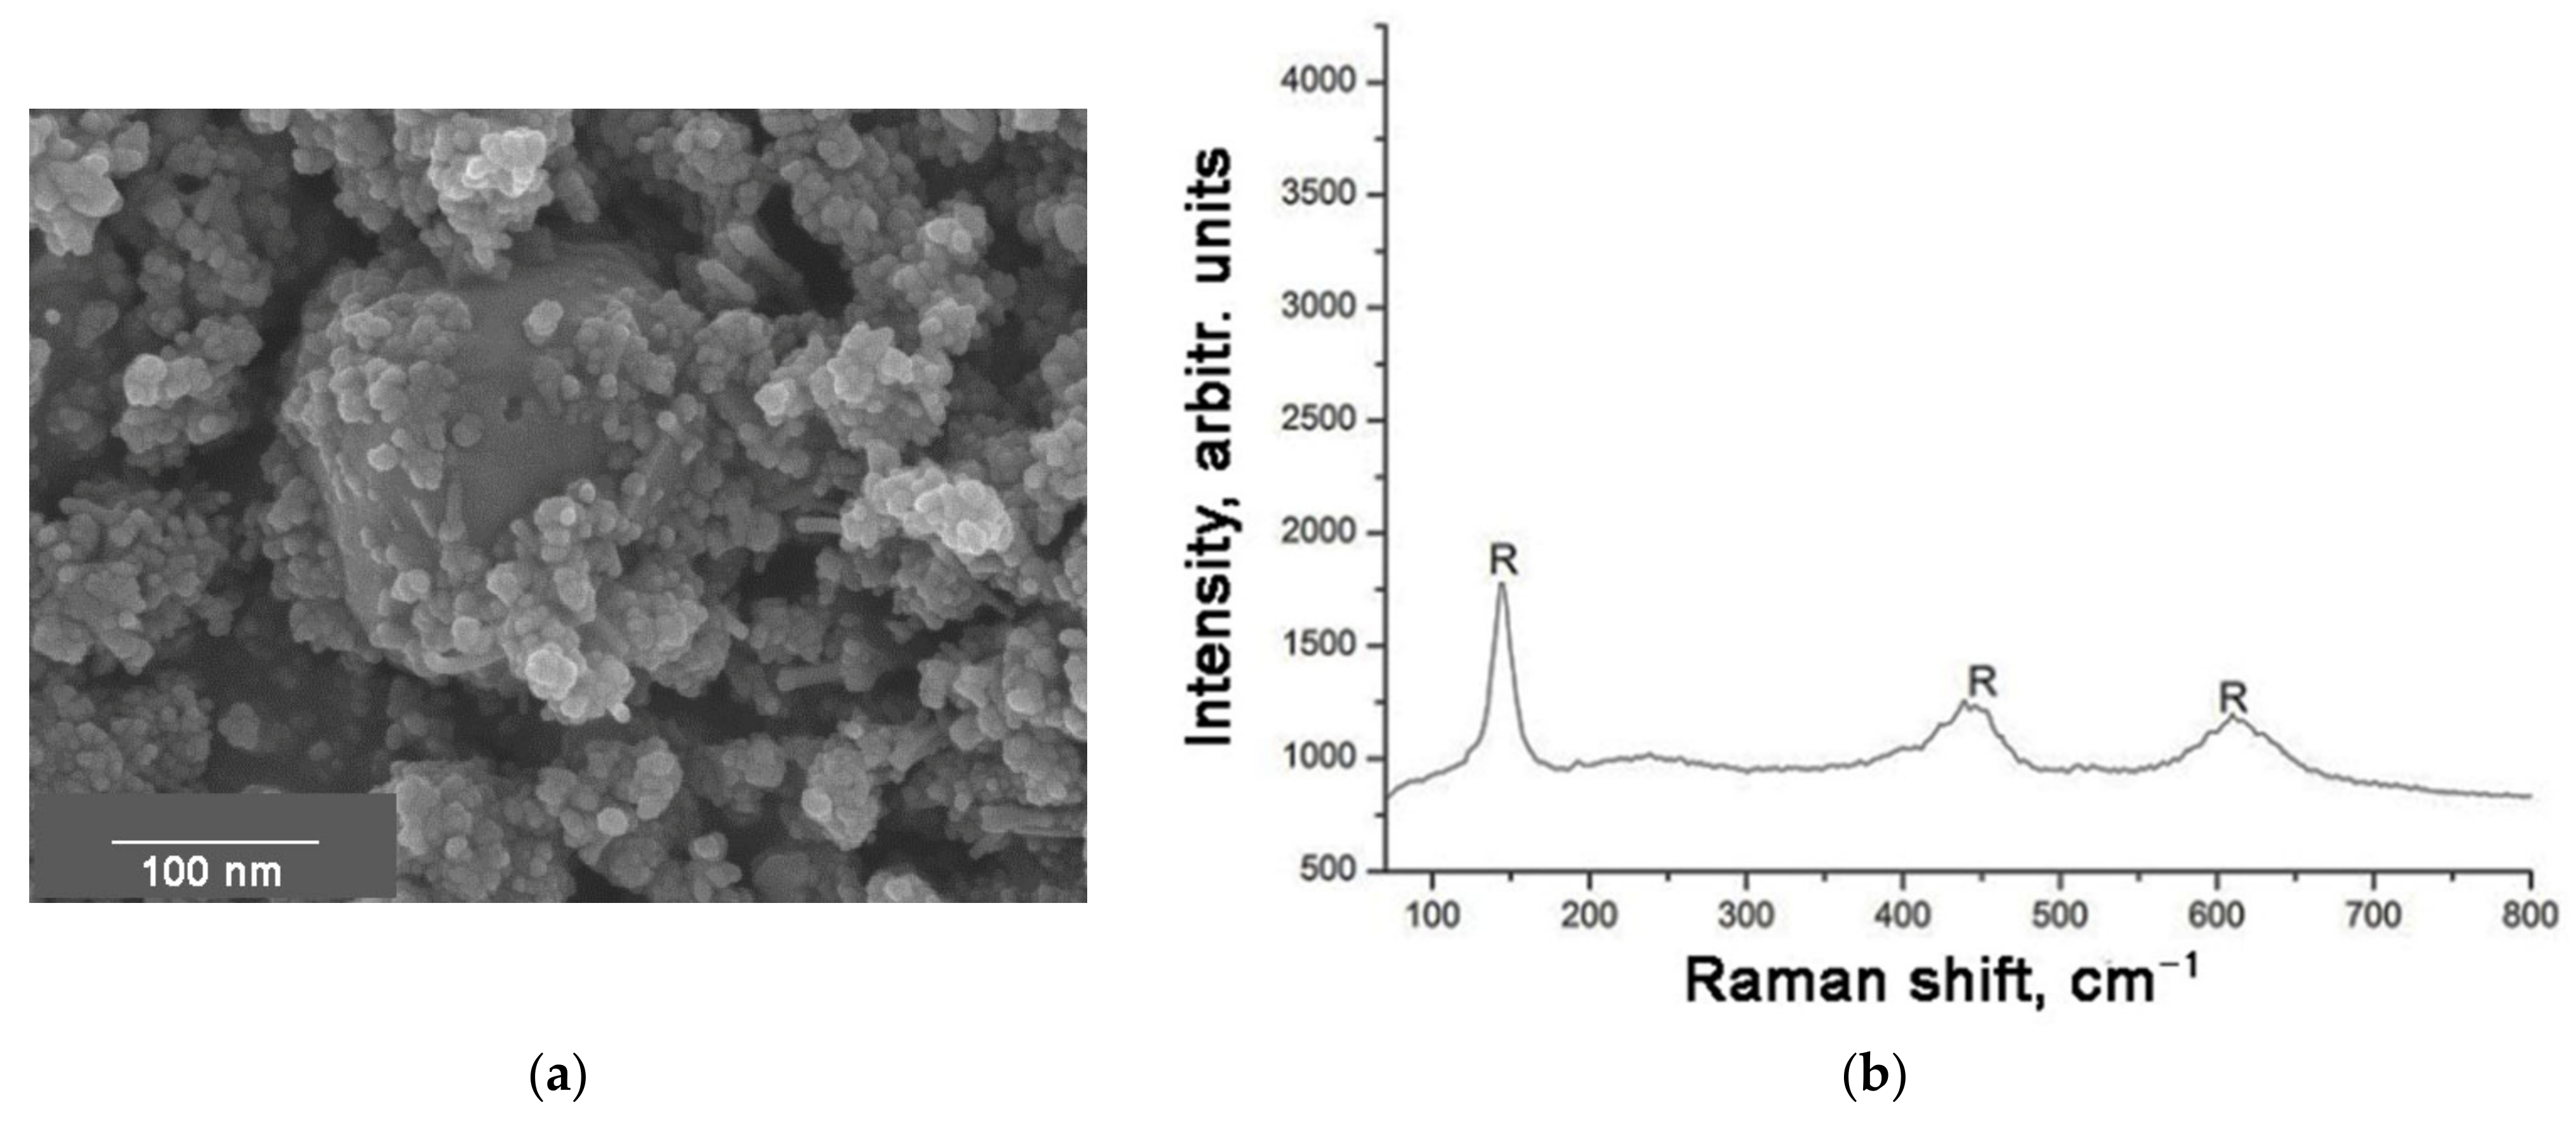
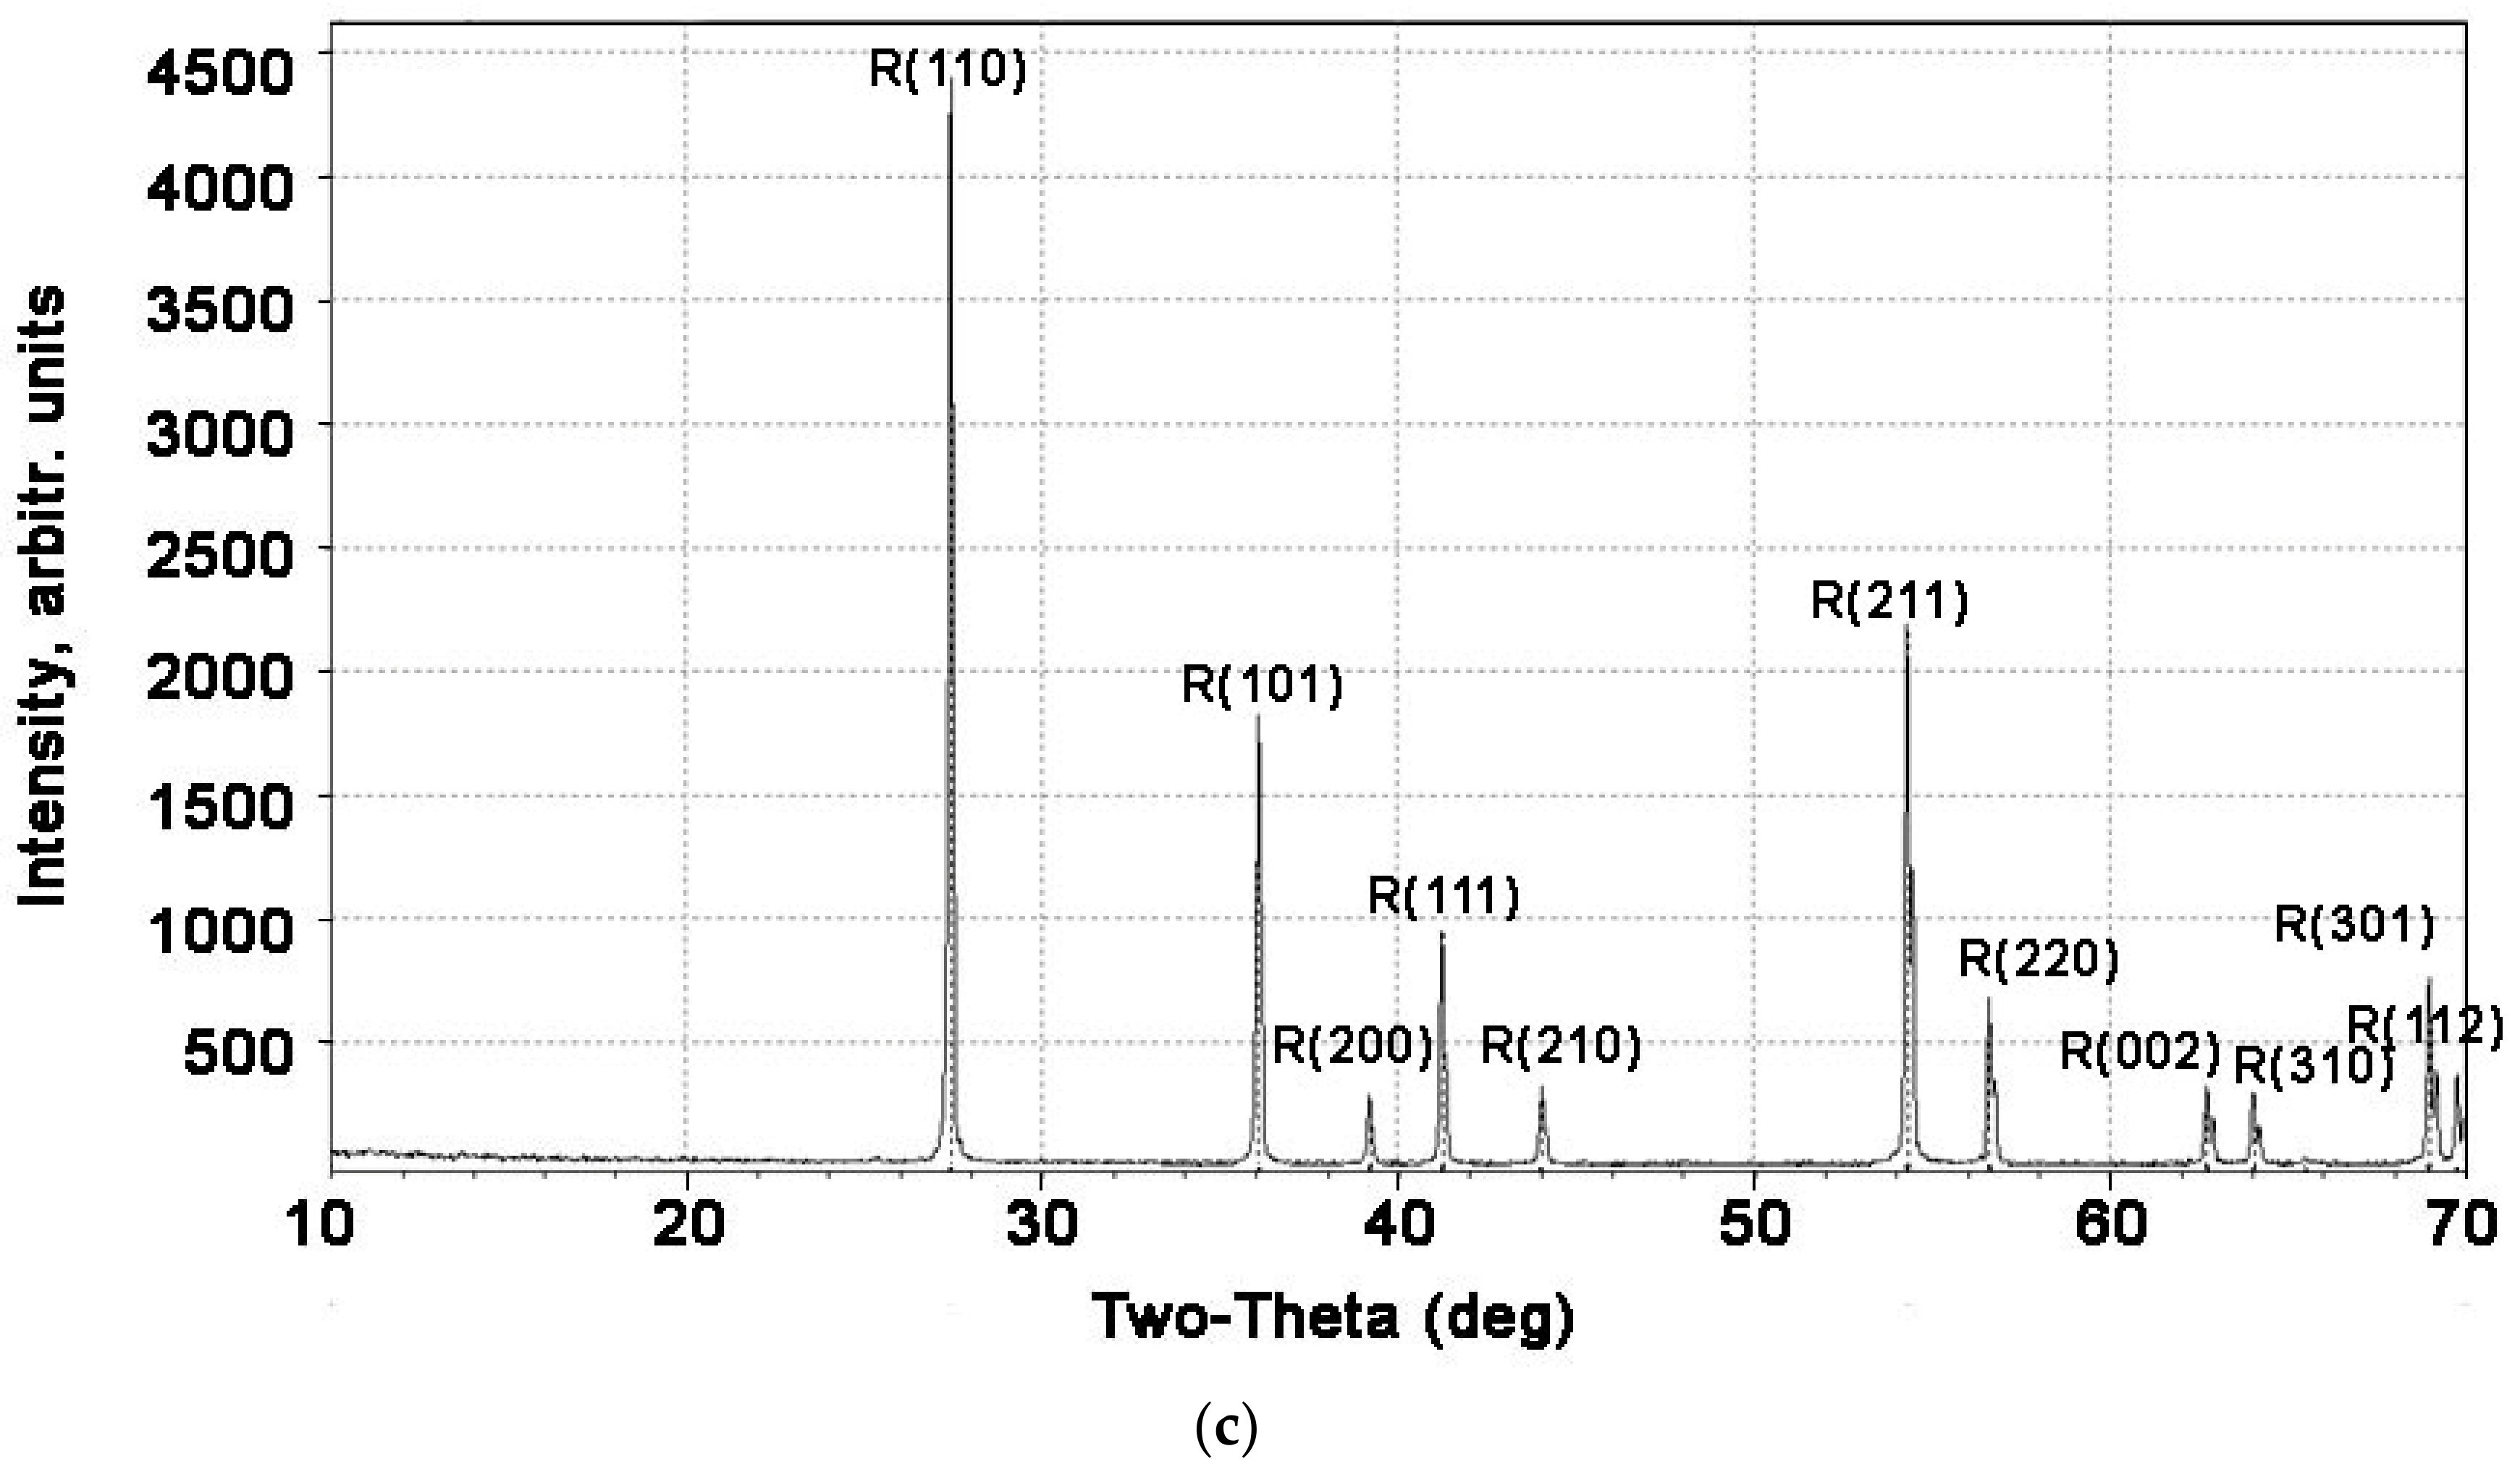
Despite the nanometer size of titanium dioxide crystallites (
Figure 2a), the X-ray diffraction pattern contained main rutile titanium dioxide lines of 2θ angle at 27.5°, 36.16°, 39.26°, 41. 32°, 44.14°, 54.42°, 56.72°, 63.44°, and 69.11° with diffraction plans (110), (101), (200), (111), (210), (211), (220), (002), and (301), respectively (JCPDS no. #88-1175) [
35] (
Figure 2c). The broadening of lines or a halo was not observed, which may be explained by the fact that the formed oxide particles were well-faceted cubic crystals, and not spheroids, as is often the case, which happens in the synthesis of nano-oxides by the sol-gel method. Titanium dioxide nanopowders synthesized in a molten chloride-nitrate electrolyte at the current density of 3.5 mA/cm
2 were characterized by a high degree of crystallinity and took the form of titanium dioxide cubes with a size up to 30 nm (
Figure 2a).
According to the results of the Raman spectroscopy of the sample obtained at 700 °C, peaks characteristic for the modification of rutile TiO
2 were determined in the Raman bands: 144 cm
−1, 448 cm
−1, 612 cm
−1 (
Figure 2b).
Further, rutile titanium dioxide nanopowder formed under the above conditions was used as a precursor.
Various industrially sol-gel methods for nano- and micro-powders production in the form of rutile and anatase were previously studied as precursors for the synthesis of the nanocomposite. However, all these nanopowders were sedimented to the bottom of the crucible and reaction (3) (
Table 1) did not proceed. The titanium dioxide nanopowder in the rutile modification synthesized by the electrochemical oxidation of titanium in a chloride–nitrate melt was the only precursor with which the above reaction was successful.
3.2. Interaction between Molten Aluminum and Titanium Nanodioxide under the Layer of Molten Halides and Analysis of Interaction Products
The AMMC material dispersion reinforcement is typically achieved by casting or powder metallurgy, with the ceramic particles being introduced ex situ into a solid or liquid matrix. A new AMMC production method has been developed on the basis of the controlled “in-situ” chemical reactions; reinforcing fillers are formed during the chemical interaction between the matrix components and reactive additives [
9,
12]. Such AMMCs demonstrate excellent mechanical and physical properties, because coherent (i.e., having a standard atomic layer at the interface) or partially coherent interfaces are formed between the matrix and new phases that arise in “in-situ” reactions.
The uniform distribution of fine particles of alumina in the aluminum matrix was achieved by the modified method of molten salt synthesis. Molten halides (alkali or alkali-earth chlorides and/or fluorides) are the optimal reactive media for the formation of aluminum–alumina composites, as was shown in our previous papers [
26,
36].
The synthesis of alumina particles inside aluminum is carried out by a one-step chemical reaction of titanium dioxide with molten aluminum under the layer of molten halides in air atmosphere by reaction (3); therefore, newly formed alumina nanoparticles are perfectly wetted by the liquid metal.
Obviously, these reactions, except for the direct interaction between TiO2 and molten sodium chloride, are thermodynamically feasible at sufficiently low temperatures of 700–800 °C. The presented process is a special case of aluminothermy.
The interaction between liquid aluminum and fine titanium dioxide particles by reactions (5) and (6) can proceed up to the formation of the intermetallic AlTi and Al3Ti titanium aluminide compounds. The Gibbs energies of reactions (5) and (6) are more negative than that of reaction (3). It makes reactions (5) and (6) more favorable.
Titanium aluminides were not detected in the reaction product by X-ray phase analysis, Raman spectroscopy, EDS spectra of composites, and mapping sample surfaces in X-rays. Intermetallic compounds of aluminum and titanium or titanium species were not detected by means of an inductively coupled plasma optical emission spectrometer OPTIMA 4300 DV (Perkin Elmer, USA) after dissolving the resulting composite in hydrochloric acid. Thus, it can be argued that the interaction occurred according to the mechanism described above by reaction (3).
The reason for such a result is the appearance of a side reaction (4) in the system. The interaction between titanium atoms, sodium chloride, and gaseous oxygen according to reaction (4) resulted in the formation of Na
2Ti
6O
13 nanowires and nanorods, which was experimentally proved [
37]. The value of Gibbs energy of this reaction is 15 times greater that of all other reactions.
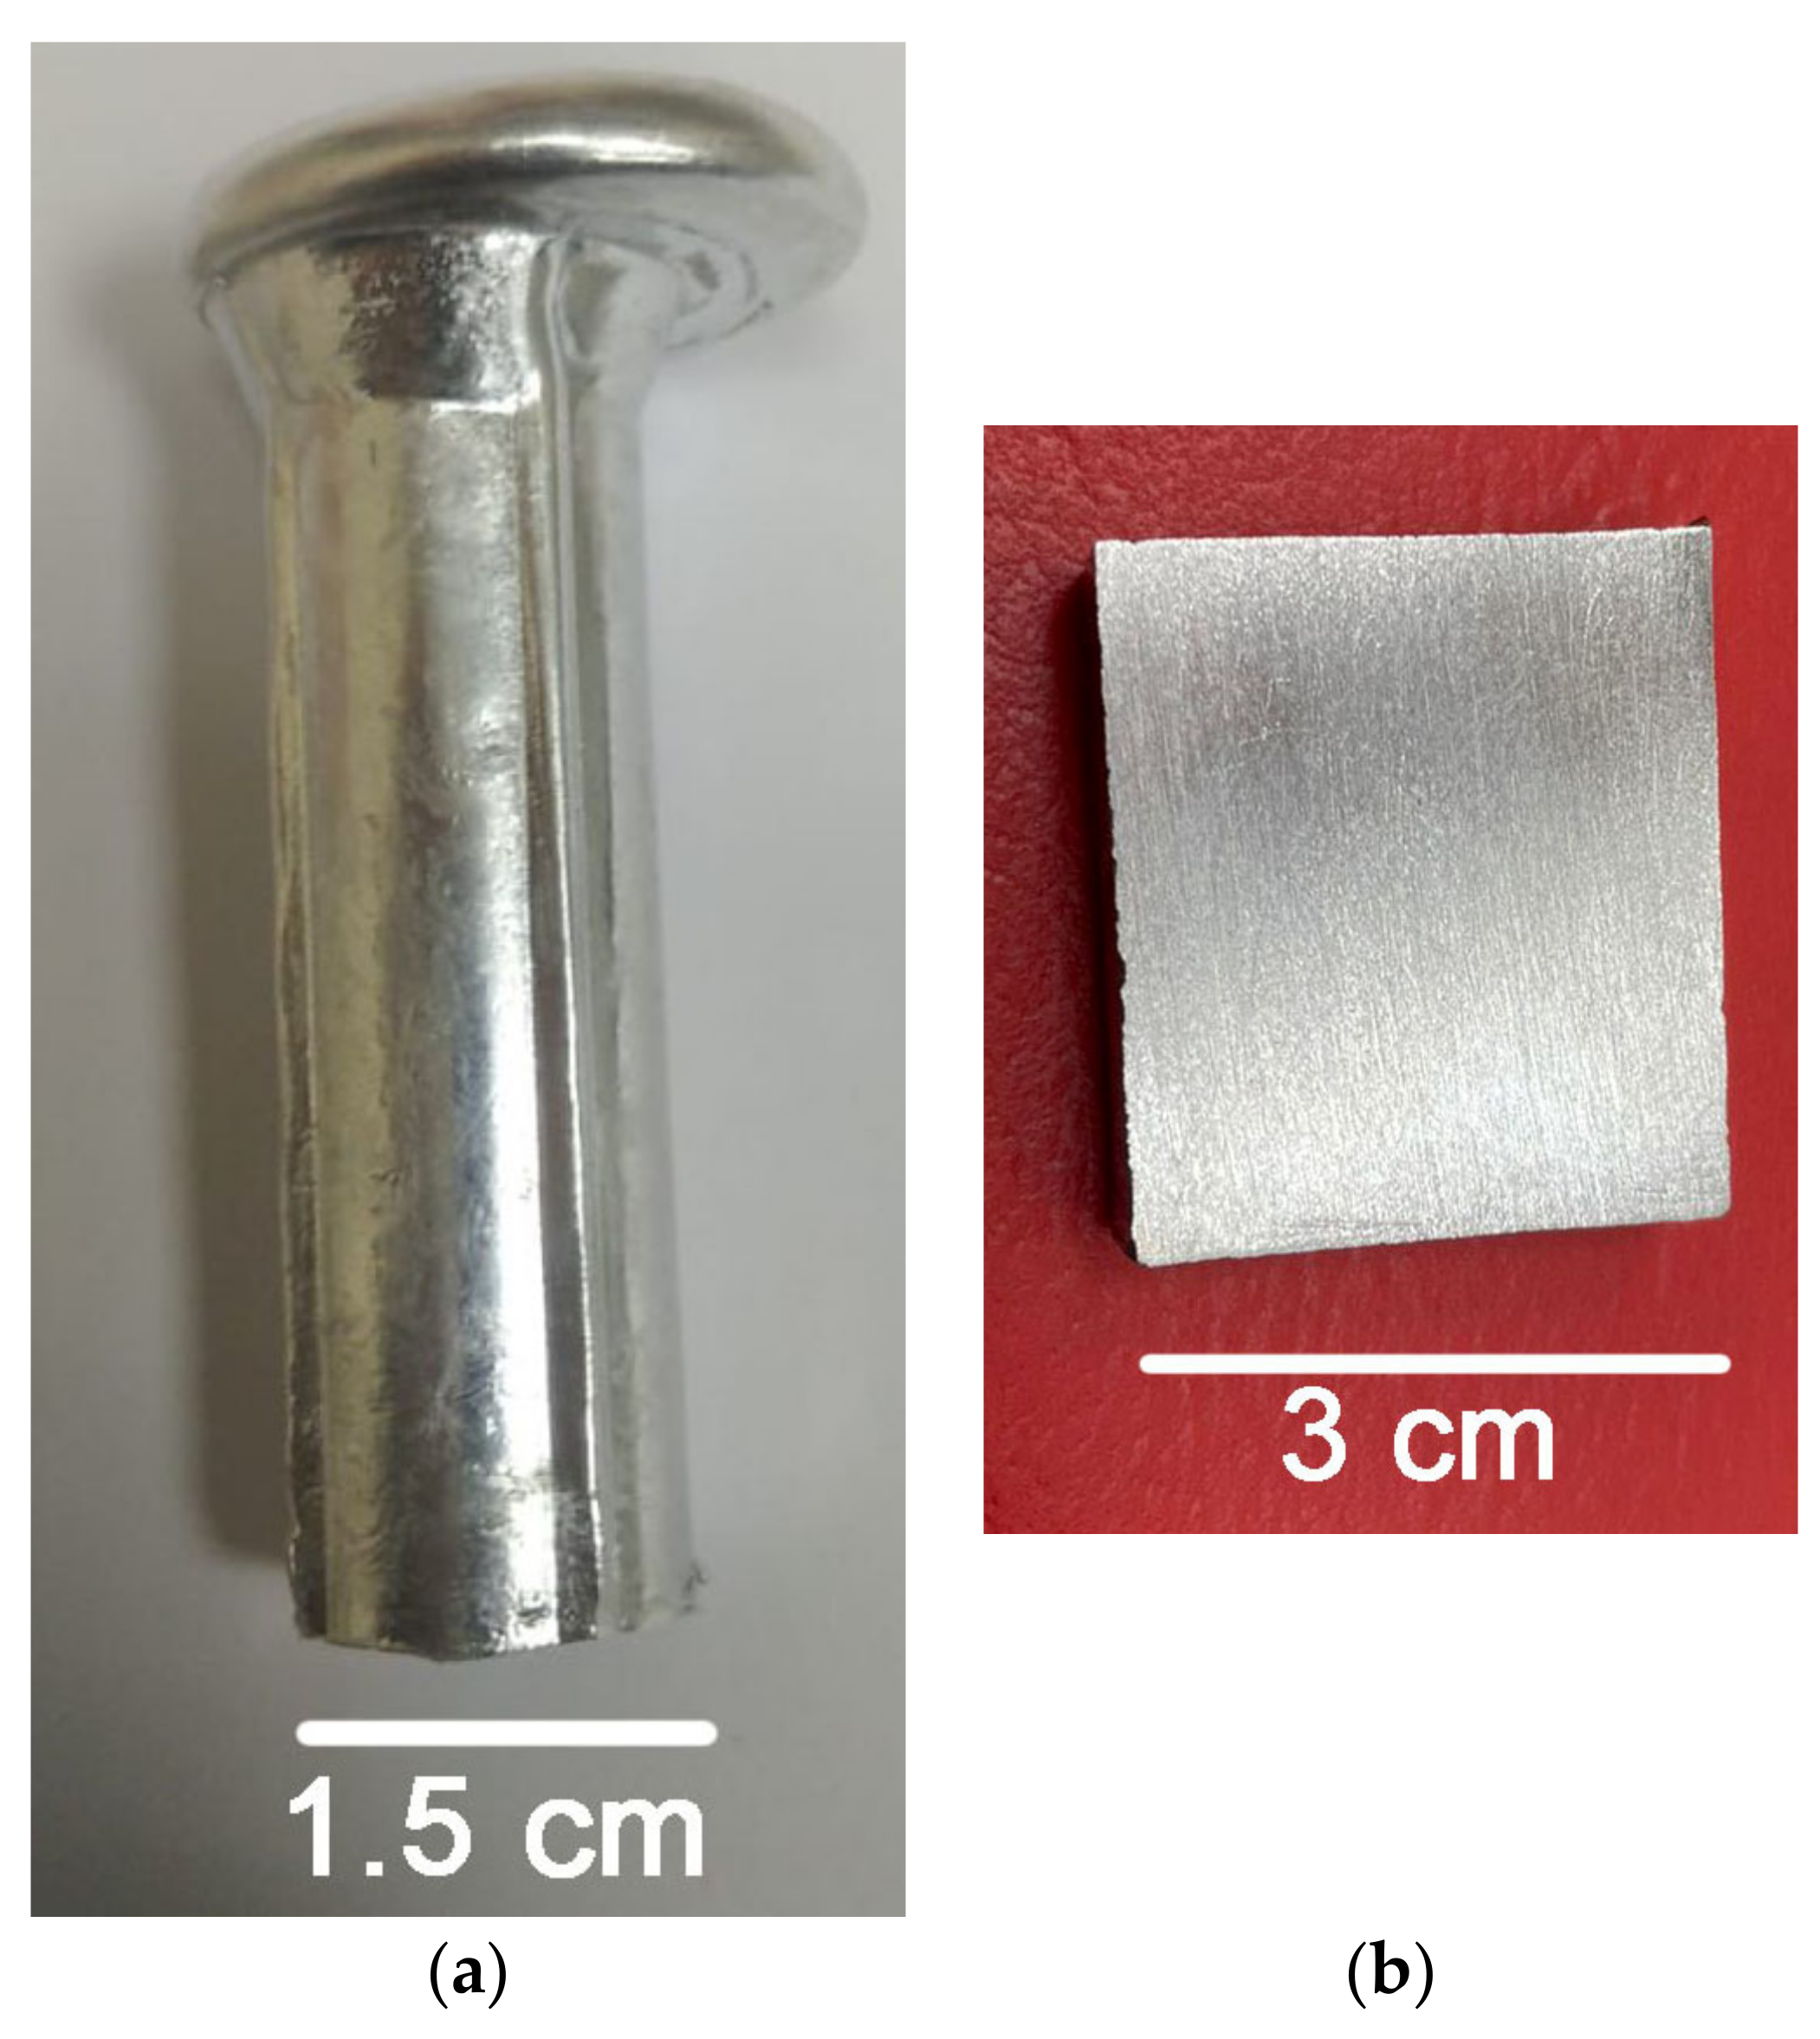
The composites obtained in this way were non-porous with a characteristic metallic luster (
Figure 3). They exhibited high electrical conductivity and are excellently suited for mechanical processing. It was experimentally proved that the aluminum oxide content did not change from the surface of the aluminum drop to its center. The density of the obtained composite averaged 2.6977 g/cm
3, which is very close to that of pure aluminum (2.6989 g/cm
3), and indicates the absence of porosity in the composite, which is typical for such samples obtained by traditional methods.
According to the X-ray diffraction data, the thus obtained material was composed of Al and α-Al
2O
3 [
36].
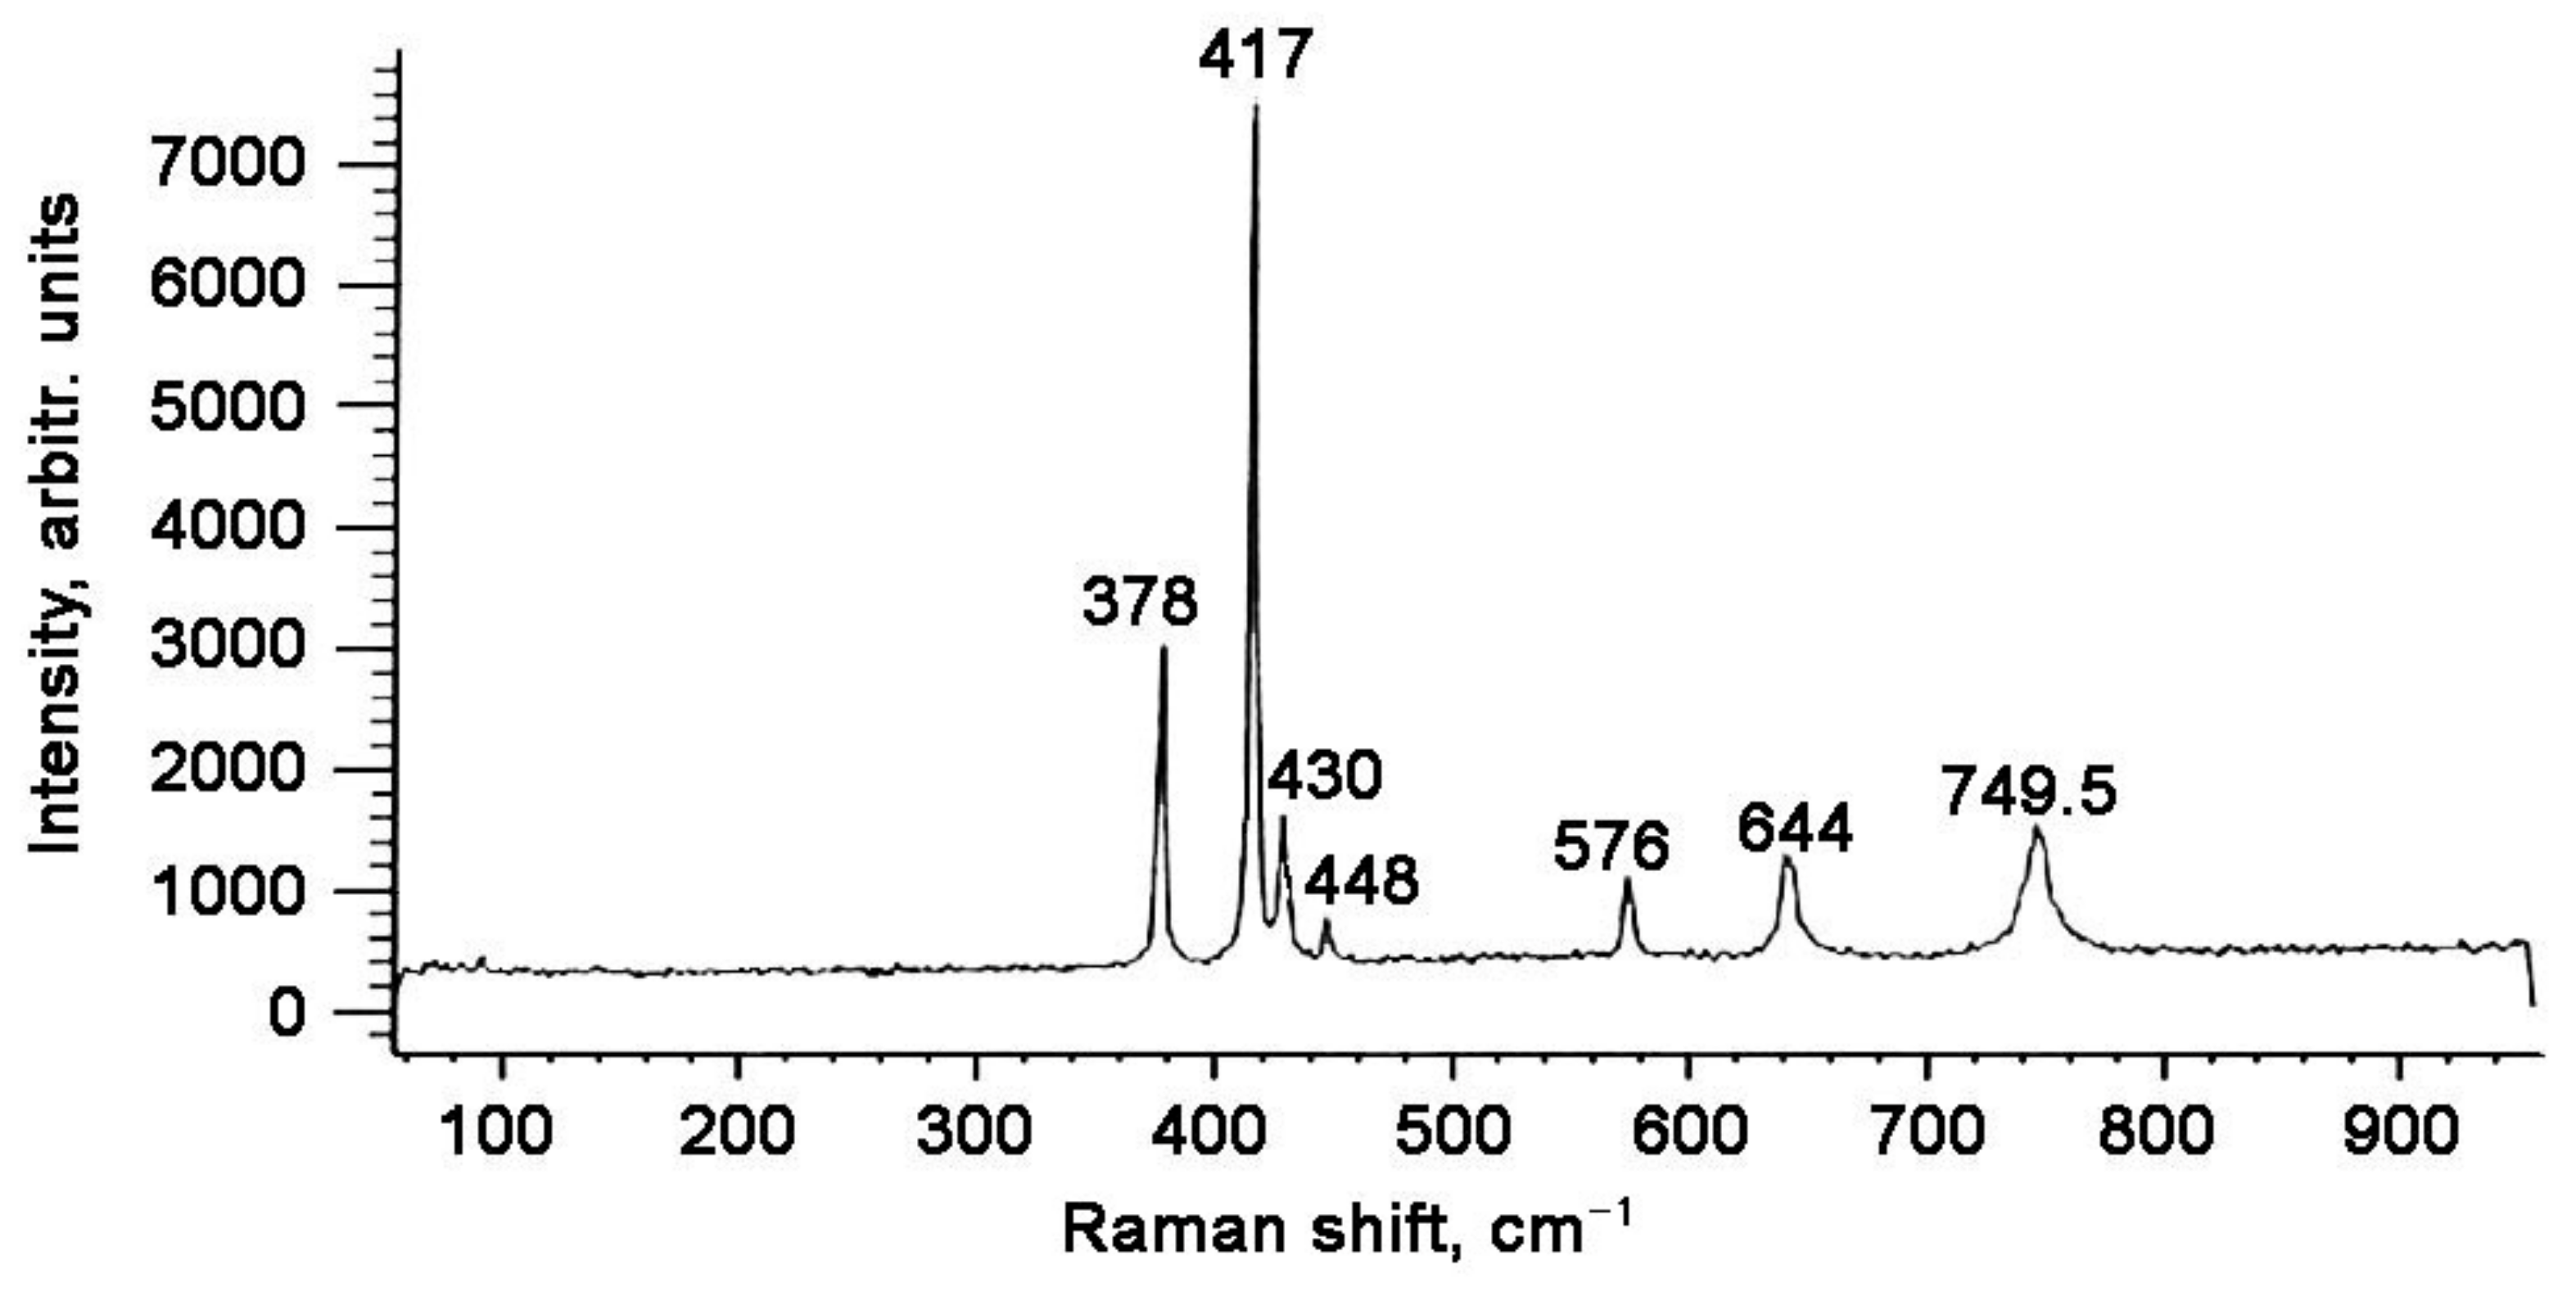
Raman spectra of the oxide inclusions were collected from several crystals inside the aluminum matrix. The average spectrum of the oxide inclusion is presented in
Figure 4. It is obvious that this spectrum was a standard spectrum of α-Al
2O
3 with the characteristic bonds at 378 cm
−1, 417 cm
−1, 430 cm
−1, 448 cm
−1, 576 cm
−1, 644 cm
−1, and 749.5 cm
−1 [
38]. It confirmed the XRD data about the synthesis of α-Al
2O
3 inside the aluminum matrix [
36].
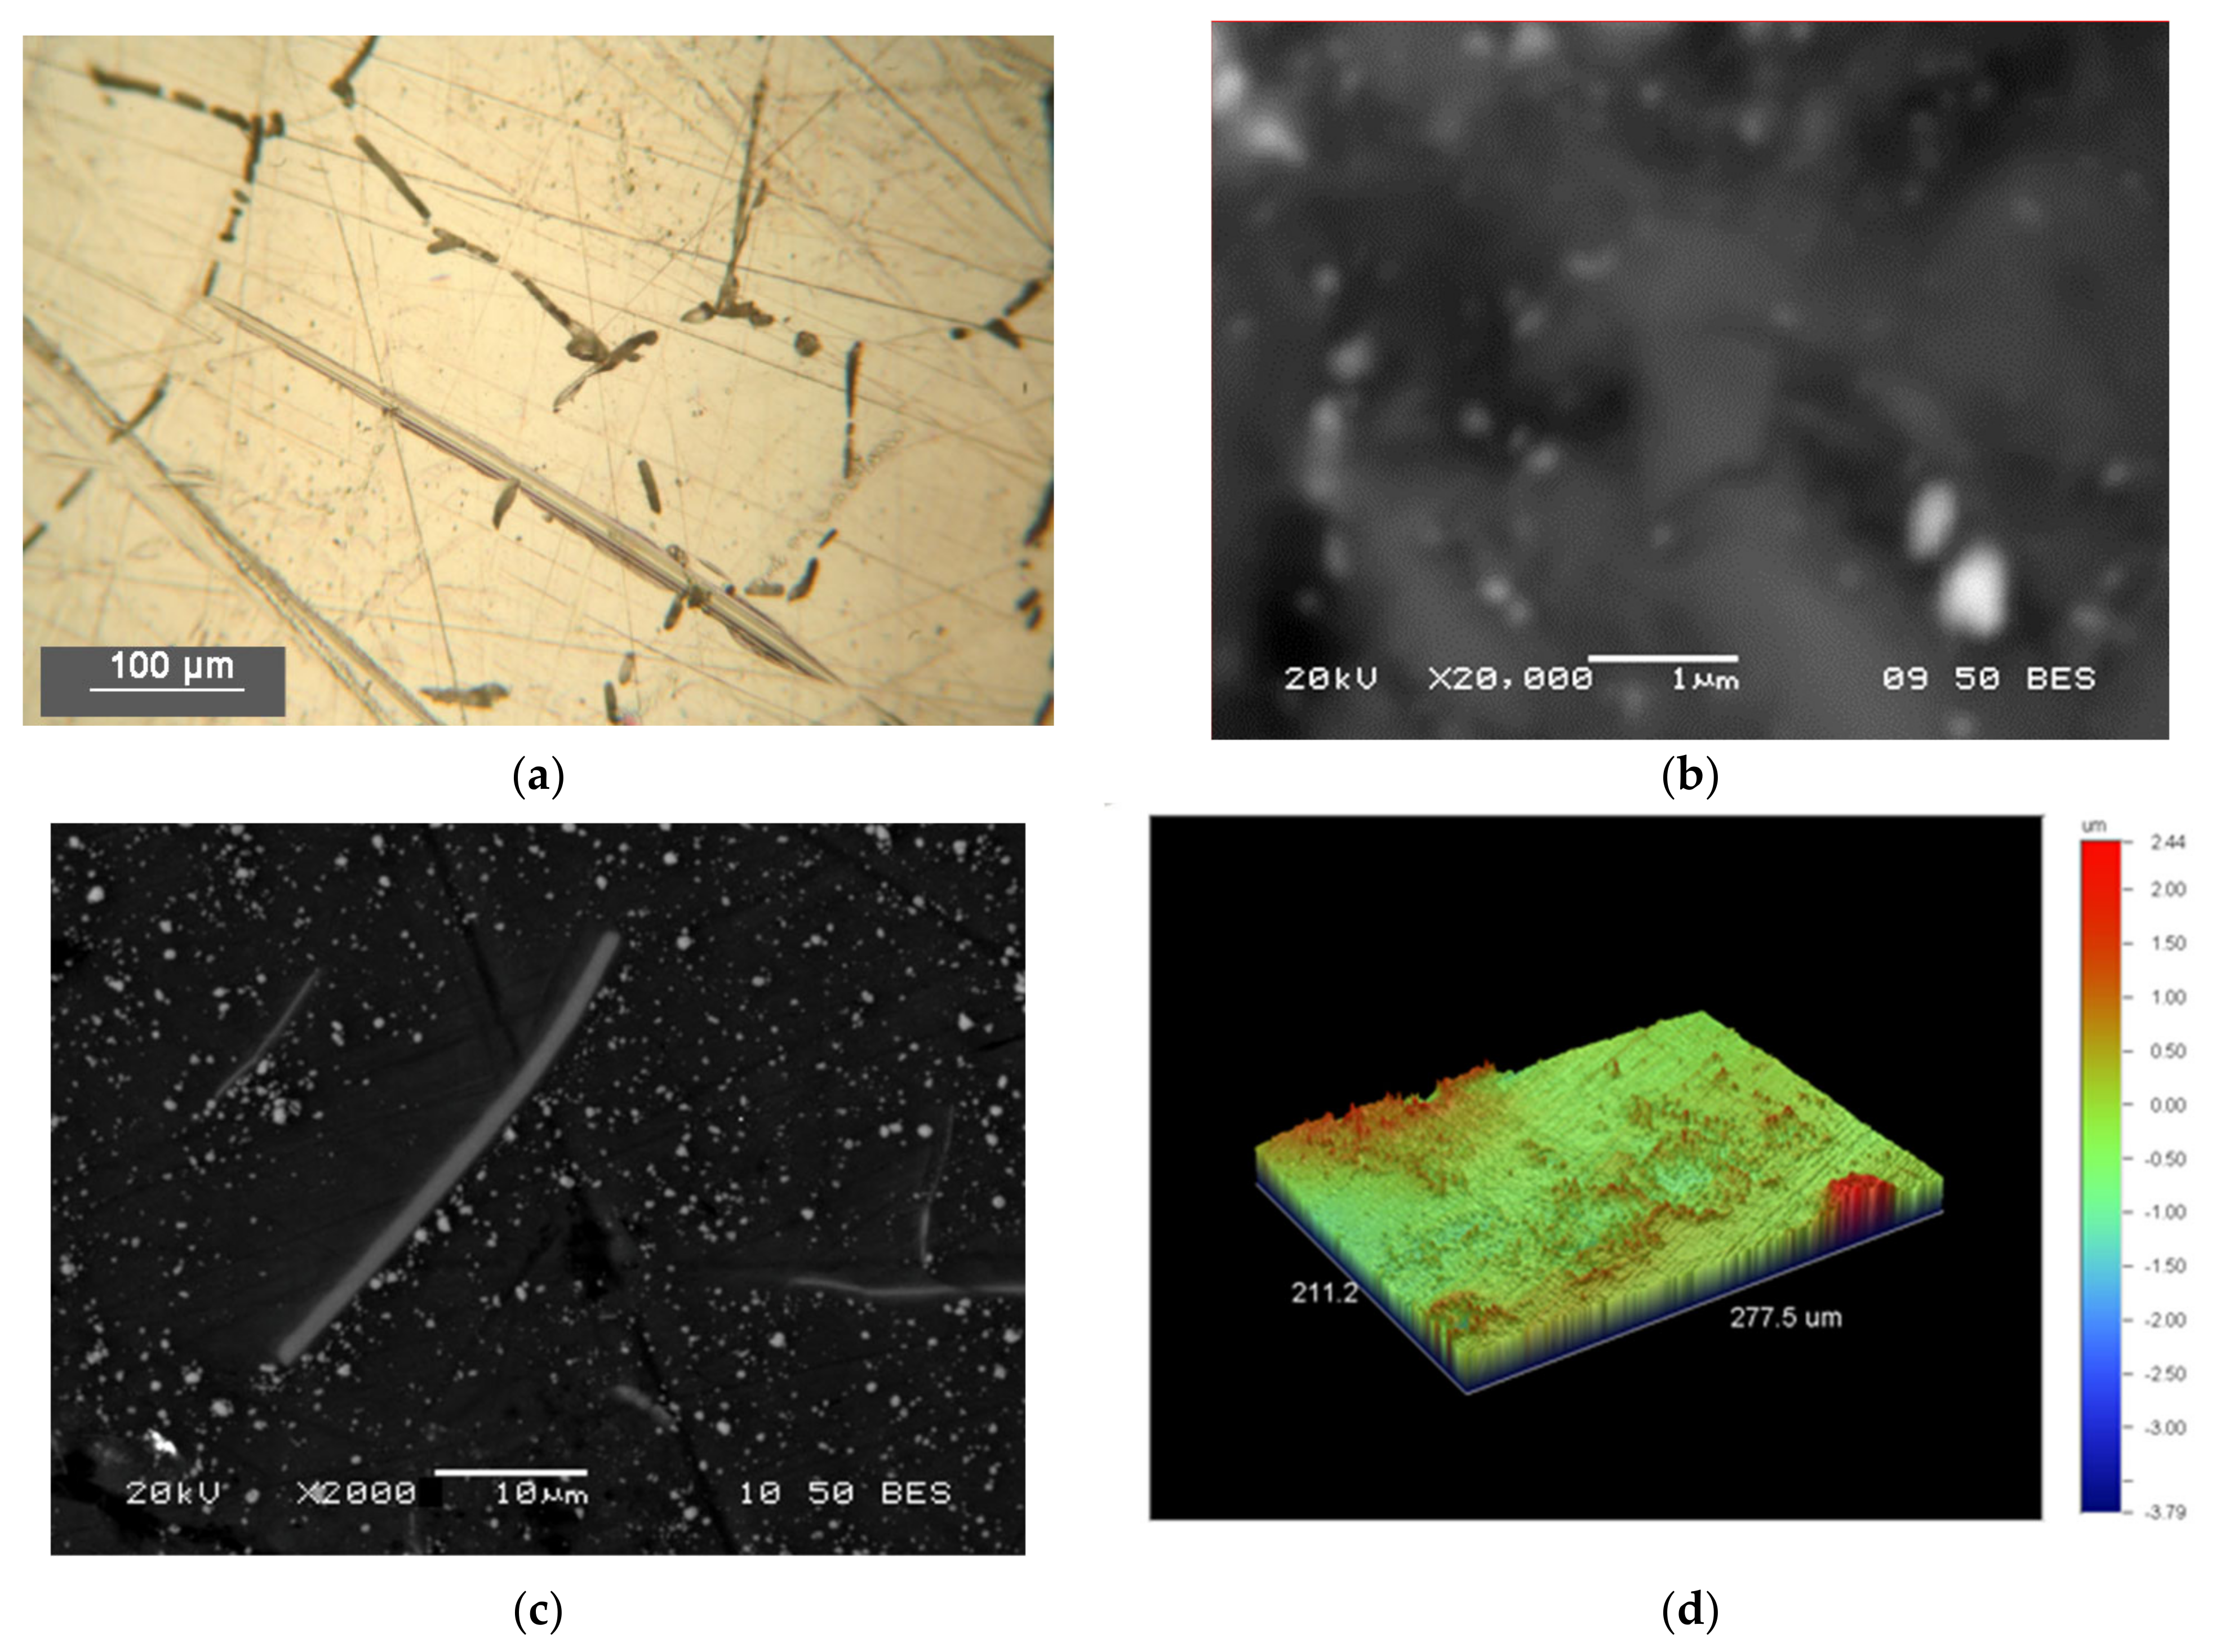
Micro- and nanosized inclusions of aluminum oxide were also clearly visible in the micrographs in the optic microscope (
Figure 5a) and in backscattered electrons in a scanning electron microscope (
Figure 5b,c). The EDS spectrum of inclusion showed the content of aluminum and oxygen in the stoichiometric ratio of Al
2O
3; inclusions of aluminum oxide had sizes close to 100 nm.
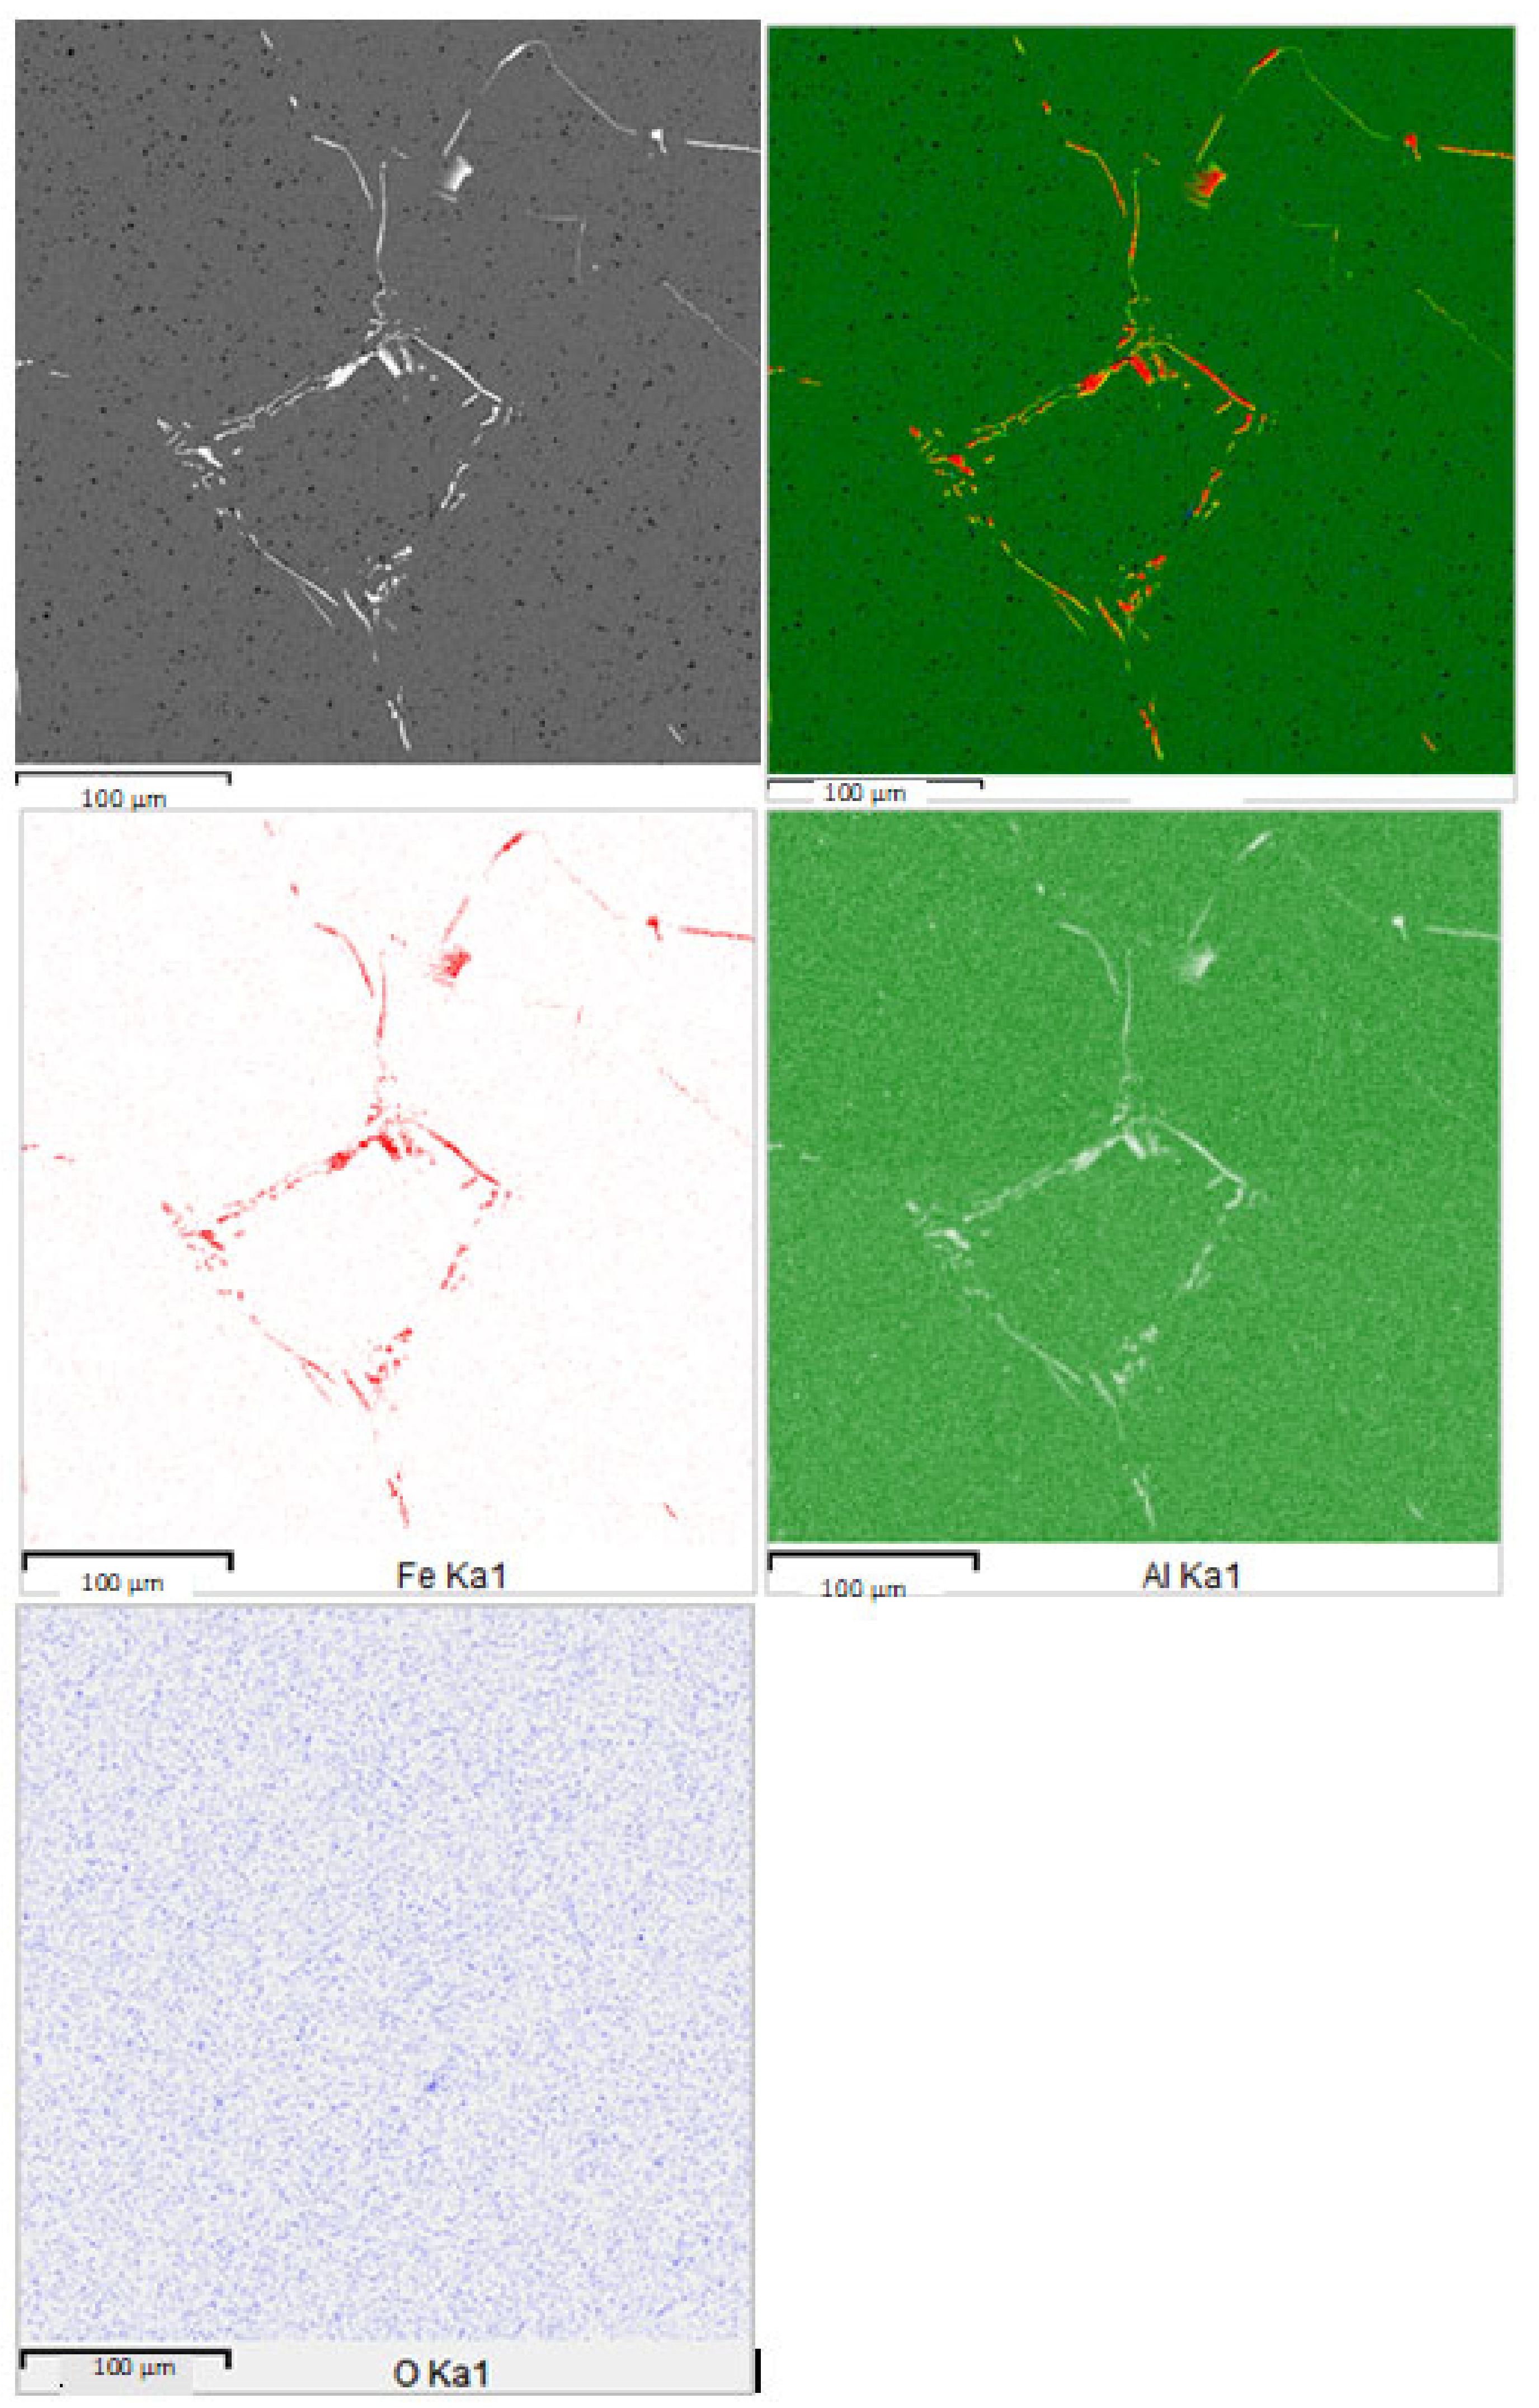
A very uniform distribution of oxide inclusions inside aluminum grains of the cross-section of Al-Al
2O
3 composite is presented in
Figure 6.
Inclusions in the form of long rods were crystals of iron aluminide Al
3Fe (
Figure 6), which were present in the starting aluminum as an admixture. According to the phase measurements of the cross-section of this sample, the Al area is 97.5%, Al
3Fe-1.4%, and Al
2O
3-1.2%. The 3D image of the cross-section of AMMC (
Figure 5d) also shows a uniform distribution of alumina nanoparticles inside the grain of the aluminum matrix.
To prove the possibility of finding nanoparticles mainly inside the grain rather than at the grain boundary, as would be expected from classical considerations, we calculated the value of the critical nucleus (
rc) during the crystallization of aluminum using well-known Formula (7) [
39]:
where
σ is the surface tension of the metal melt;
T12 is the melting point of the metal;
M is the molecular weight;
Q12 is the heat of crystallization (heat of fusion); Δ
T is the supercooling of the melt, at which the nucleation of the crystallization center occurred;
ρ is the density of the metal.
As a result, the value of the radius of the critical nucleus of Al2O3 was rc = 108.33 nm.
Thus, the size of the critical nucleus was three times larger than the initial size of the nanoparticles (30 nm), and the calculated value of synthesized α- alumina in the aluminum matrix was very close to the experimental one, which varied from 100 to 150 nm.
Thus, it can be assumed that nano-α aluminum oxide formed as a result of the chemical interaction between fused aluminum and nanopowder of titanium dioxide and was not grouped along the grain boundaries but was uniformly distributed in the volume of the aluminum grain (
Figure 5 and
Figure 6), which is a favorable factor in assessing the mechanical properties of the composite.
The composite samples were dissolved in hydrochloric acid HCl solution to determine the quantitative content of aluminum oxide in the produced AMMCs using the volumetric method. The concentration of Al2O3 in the composite was determined by the difference in hydrogen evolution.
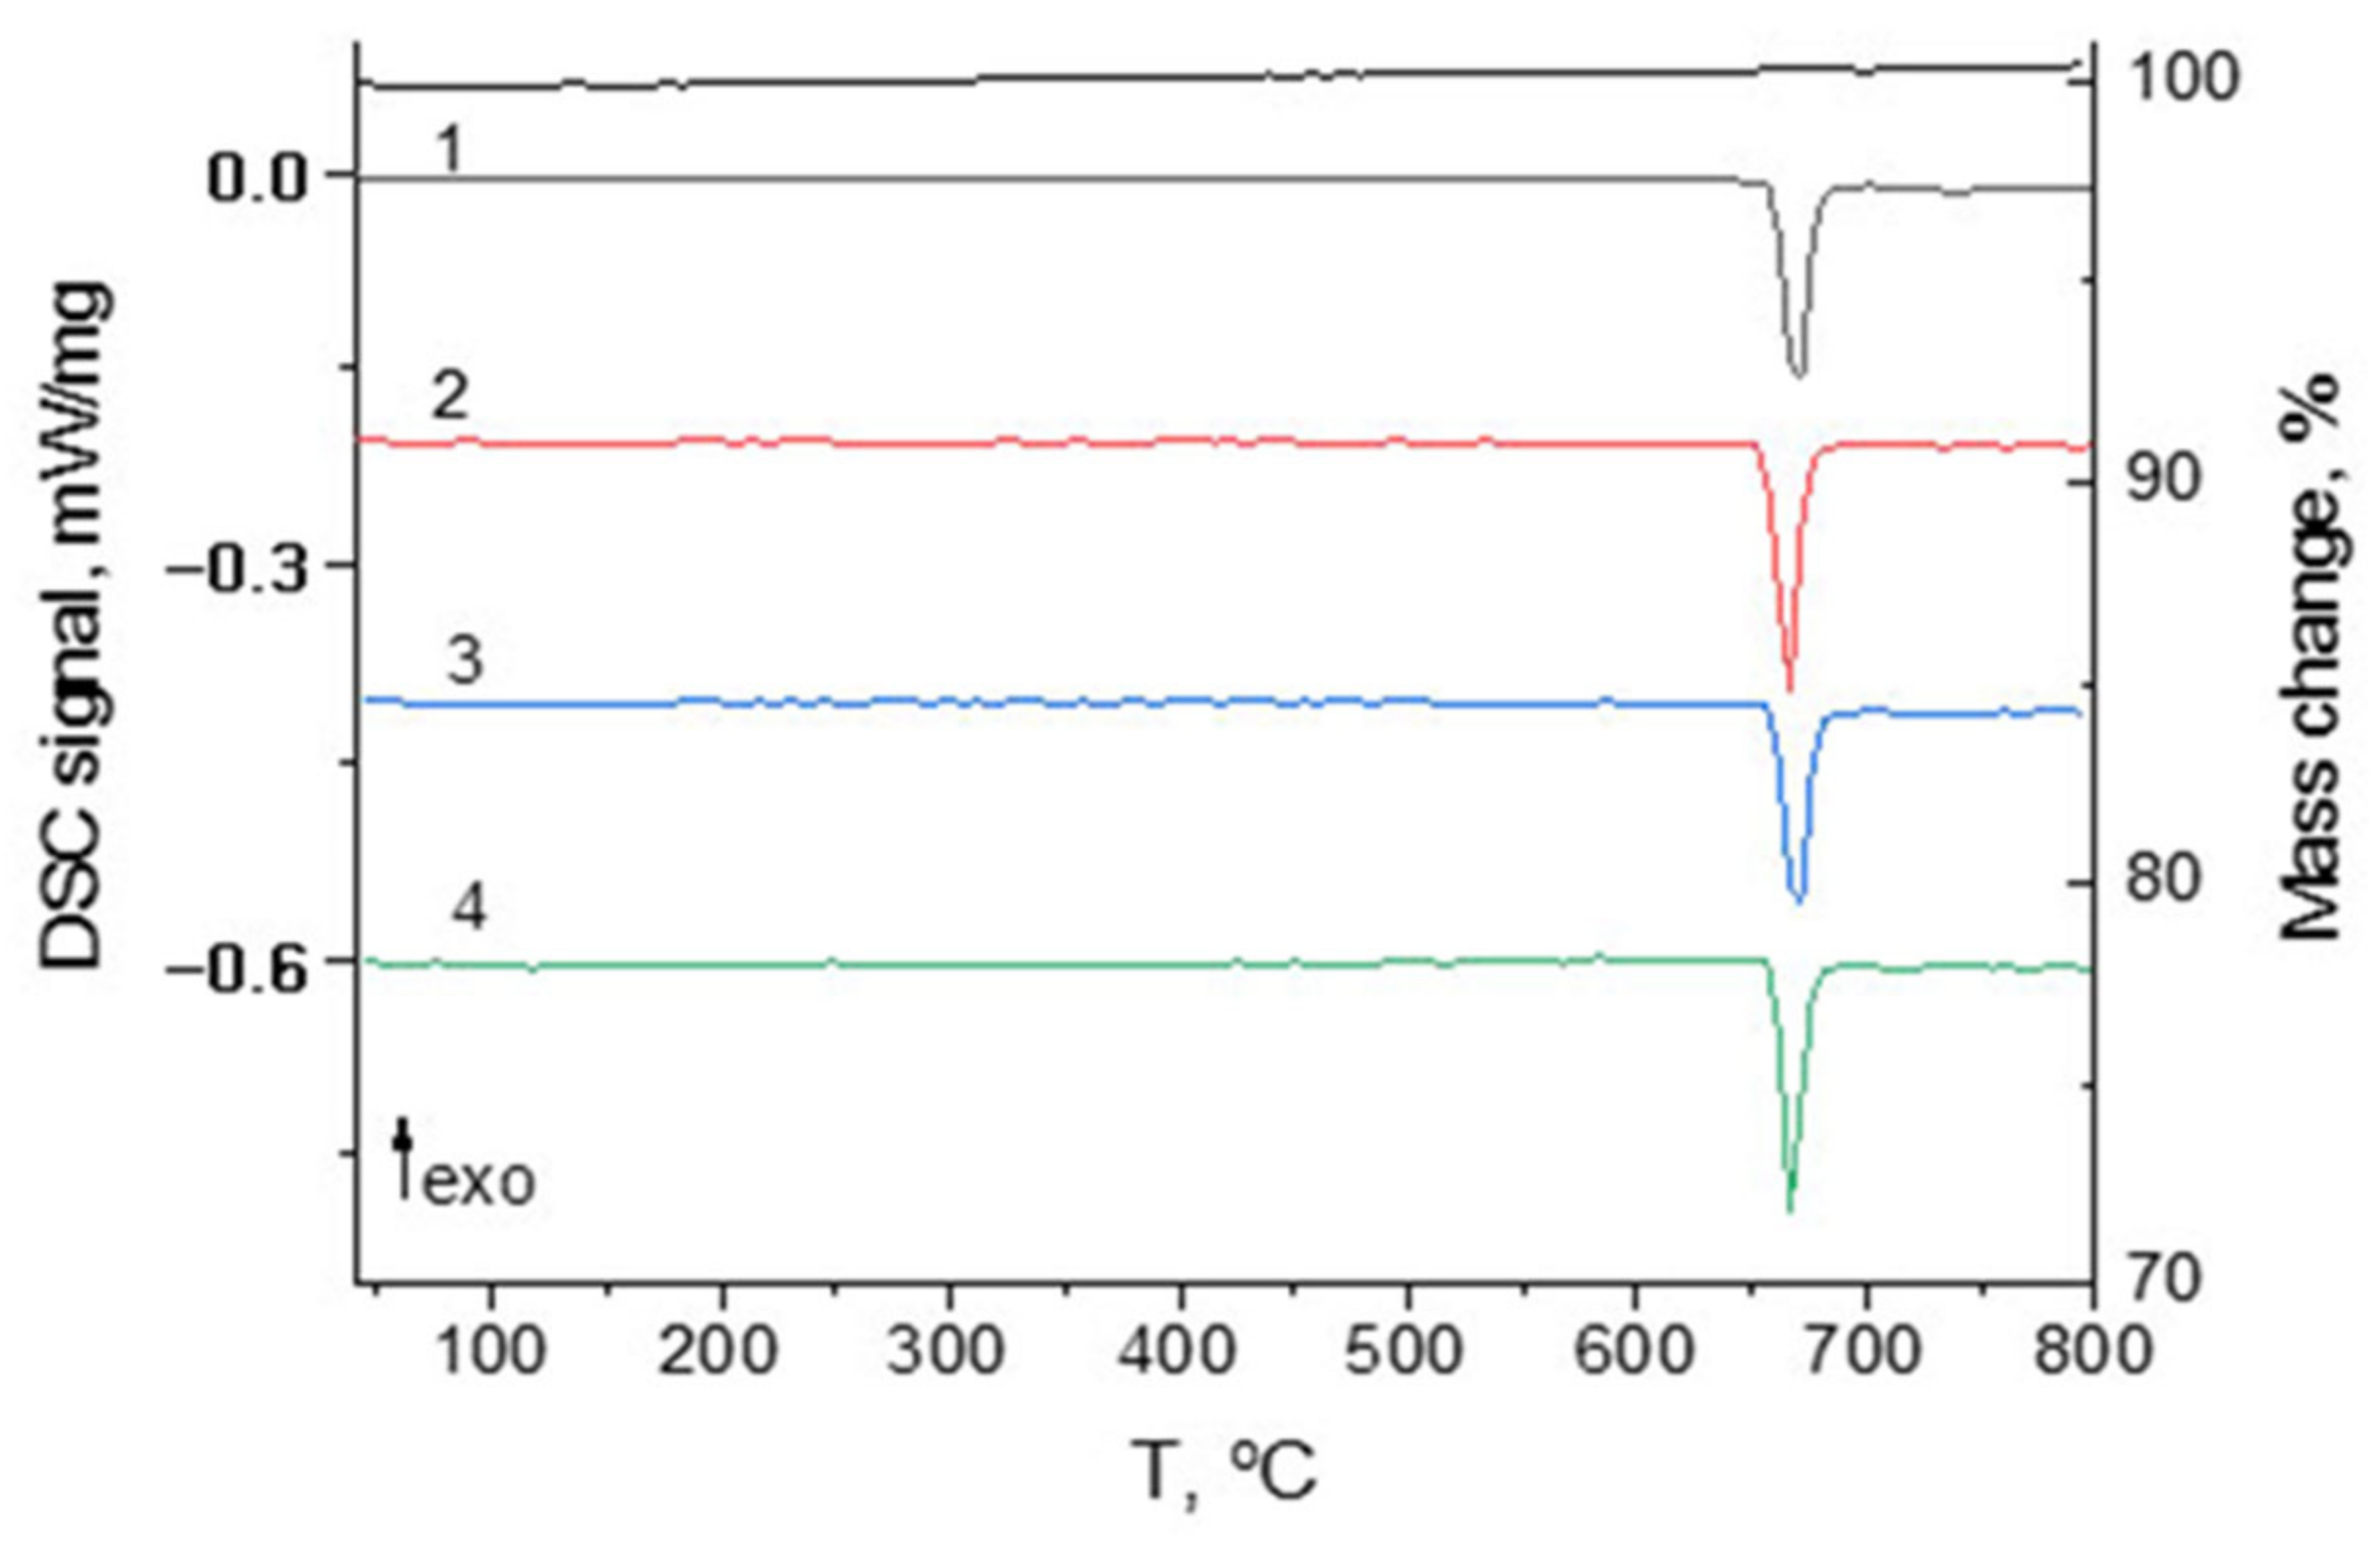
The data in
Table 2 elucidates that an increase in the exposure time and concentration of titanium dioxide in the melt leads to an increase in the mass fraction of aluminum oxide in the composite. However, when the titanium dioxide concentration increased significantly above 1% and exposure time was up to 9 h, it was not possible to obtain samples with a reinforcing phase concentration of more than 19%. A slight decrease in the mass fraction of aluminum oxide in the composite caused by an increase in temperature to 750 °C could be associated with the interaction between atomic titanium and a salt flux, which resulted in the formation of sodium titanate.
As can be seen from
Table 2, we varied the concentration of aluminum oxide of AMMC not by introducing a certain amount of aluminum oxide into the aluminum matrix, but by changing the synthesis time and temperature. The content of aluminum oxide formed by the reaction (3) did not depend on the titanium dioxide weight. Titanium dioxide was a necessary seed for the formation of aluminum oxide in the composite; when interacting in a salt melt, it formed sodium hexatitanate nanofibers in stoichiometric amounts [
37].
3.4. Measurement of Mechanical Properties of Composite Al-Nano-Al2O3
Experimental methods to study mechanics of deformable “Al-nano-α-alumina” composites included hardness studies and tensile testing of the material with data registration in the form of “stress-strain” curves. For the in-depth mechanical studies, samples with an aluminum oxide concentration of 10 and 14 wt.% were selected.
The instrumented indentation data on the specific features of Al and Al-Al
2O
3 behavior under elastoplastic strain are given in
Table 4. It is evident that the “in situ” implementation of uniformly distributed nano-α Al
2O
3 (10 and 14 wt.%) into the aluminum matrix decreased in the maximum and residual indentation depth h
max and h
p and increased in the Martens hardness H
M and the indentation hardness at all loads HIT. Such simultaneous change in the characteristics h
max, h
p, H
M, H
IT, W
e, and W
t measured in the indentation process is commonly caused by the material hardening and mainly is observed in aluminum composites with uniformly distributed alumina nanopowders [
40,
41,
42]. In particular, for the samples “Al- nano-alumina “, an average increase in H
IT was nearly 20–25%. Contact elasticity modulus E * decreased for Al-14% Al
2O
3 composite at the load 1000 mN and did not change for all other composites.
The AMMC was characterized by higher resistance to elastoplastic strain as evidenced by an increase in the calculated parameters R
e by factor 1.22–1.52, H
IT/E* by factor 1.2–1.5, and H
3IT/E*
2 by the factor 2.1–2.7 (
Table 5). The plasticity index δ
A did not change at the increased hardness and remained relatively high in the range of 0.972–0.982.
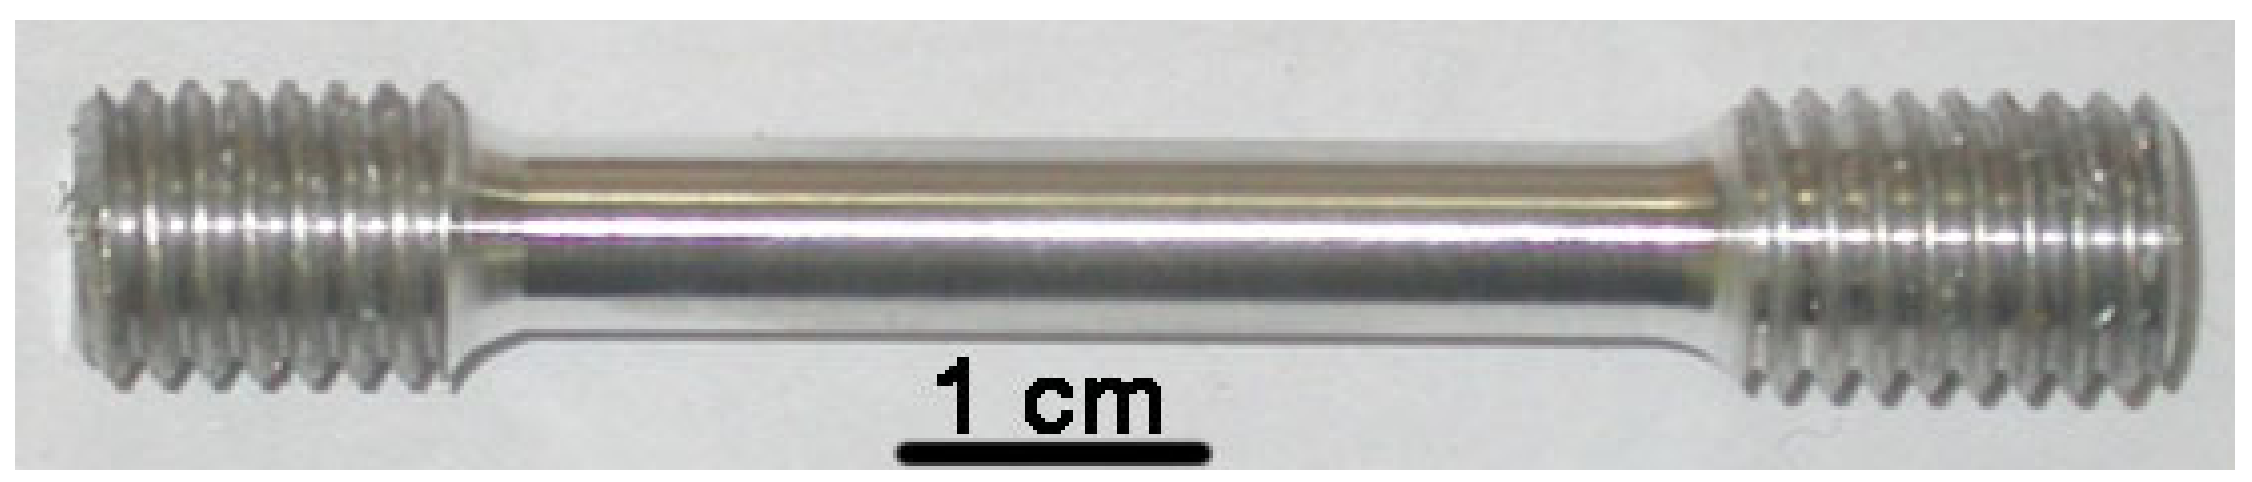
Mechanical tensile tests of aluminum–aluminum oxide composite samples were carried out in order to determine the strength and plastic properties. The tests were carried out in accordance with RF GOST 1497-84 on IV type samples (
Figure 8).
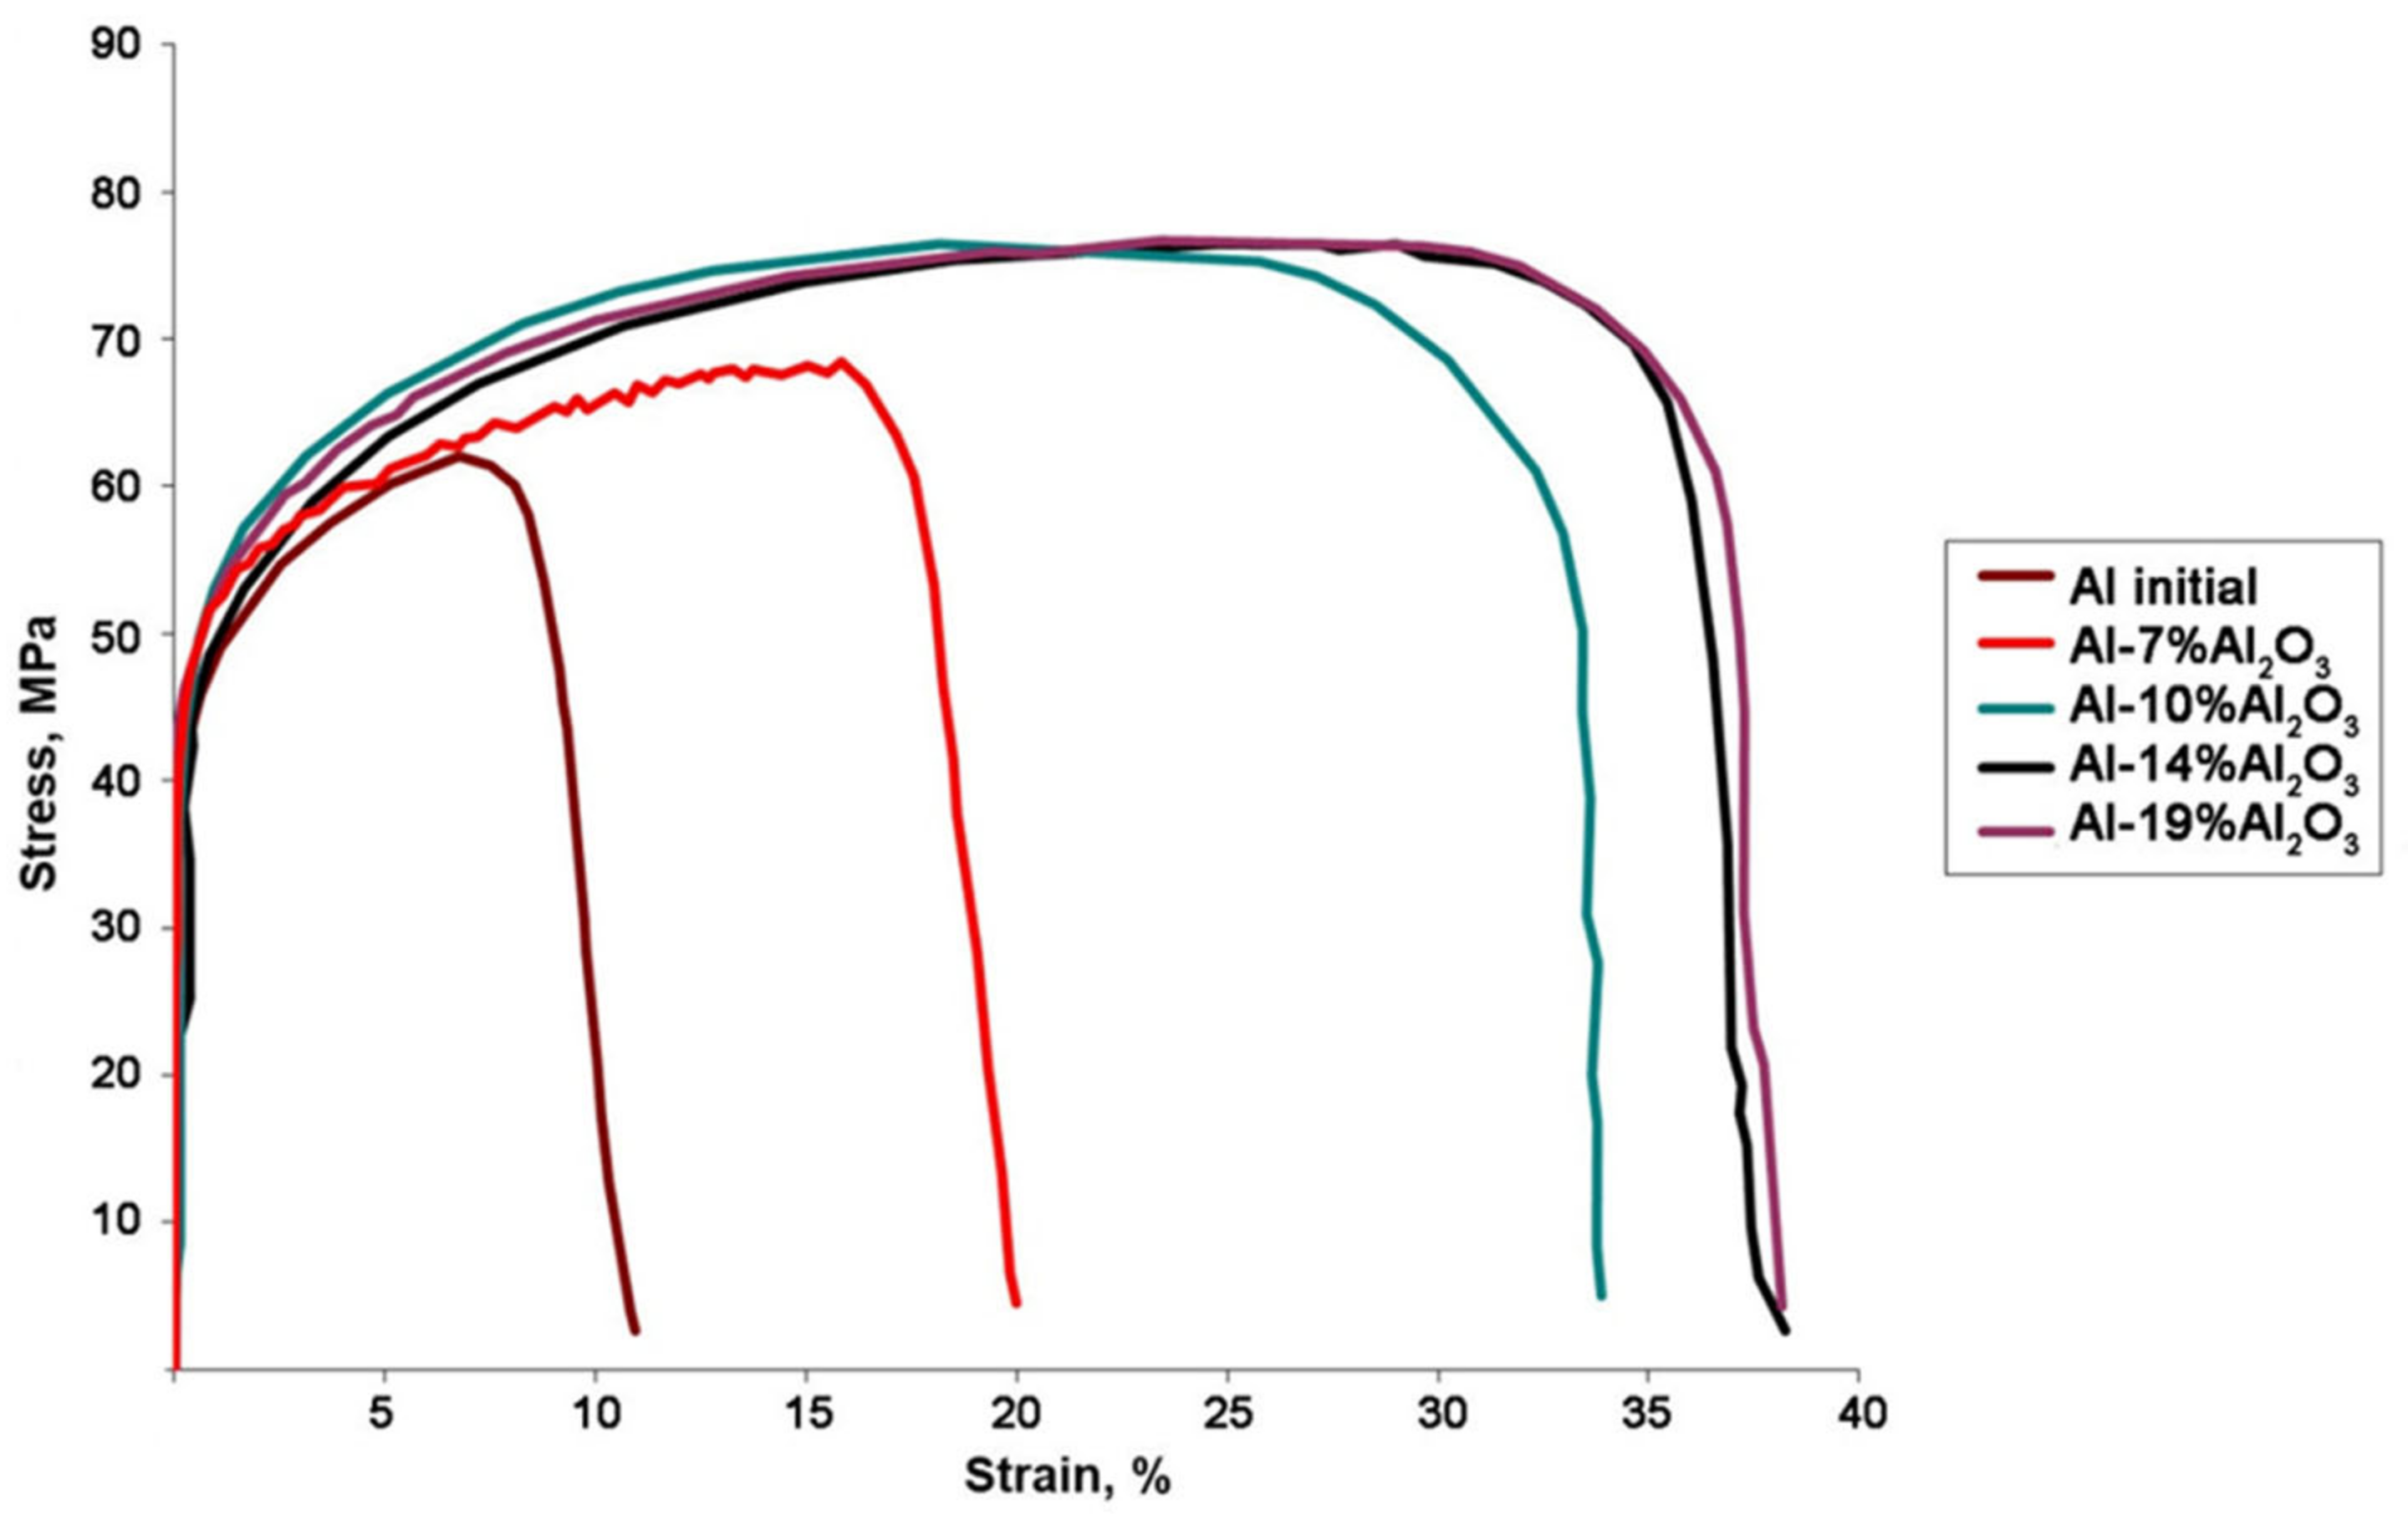
Typical room temperature stress–strain curves of the aluminum–alumina composites reinforced with varying alumina content are shown in
Figure 9.
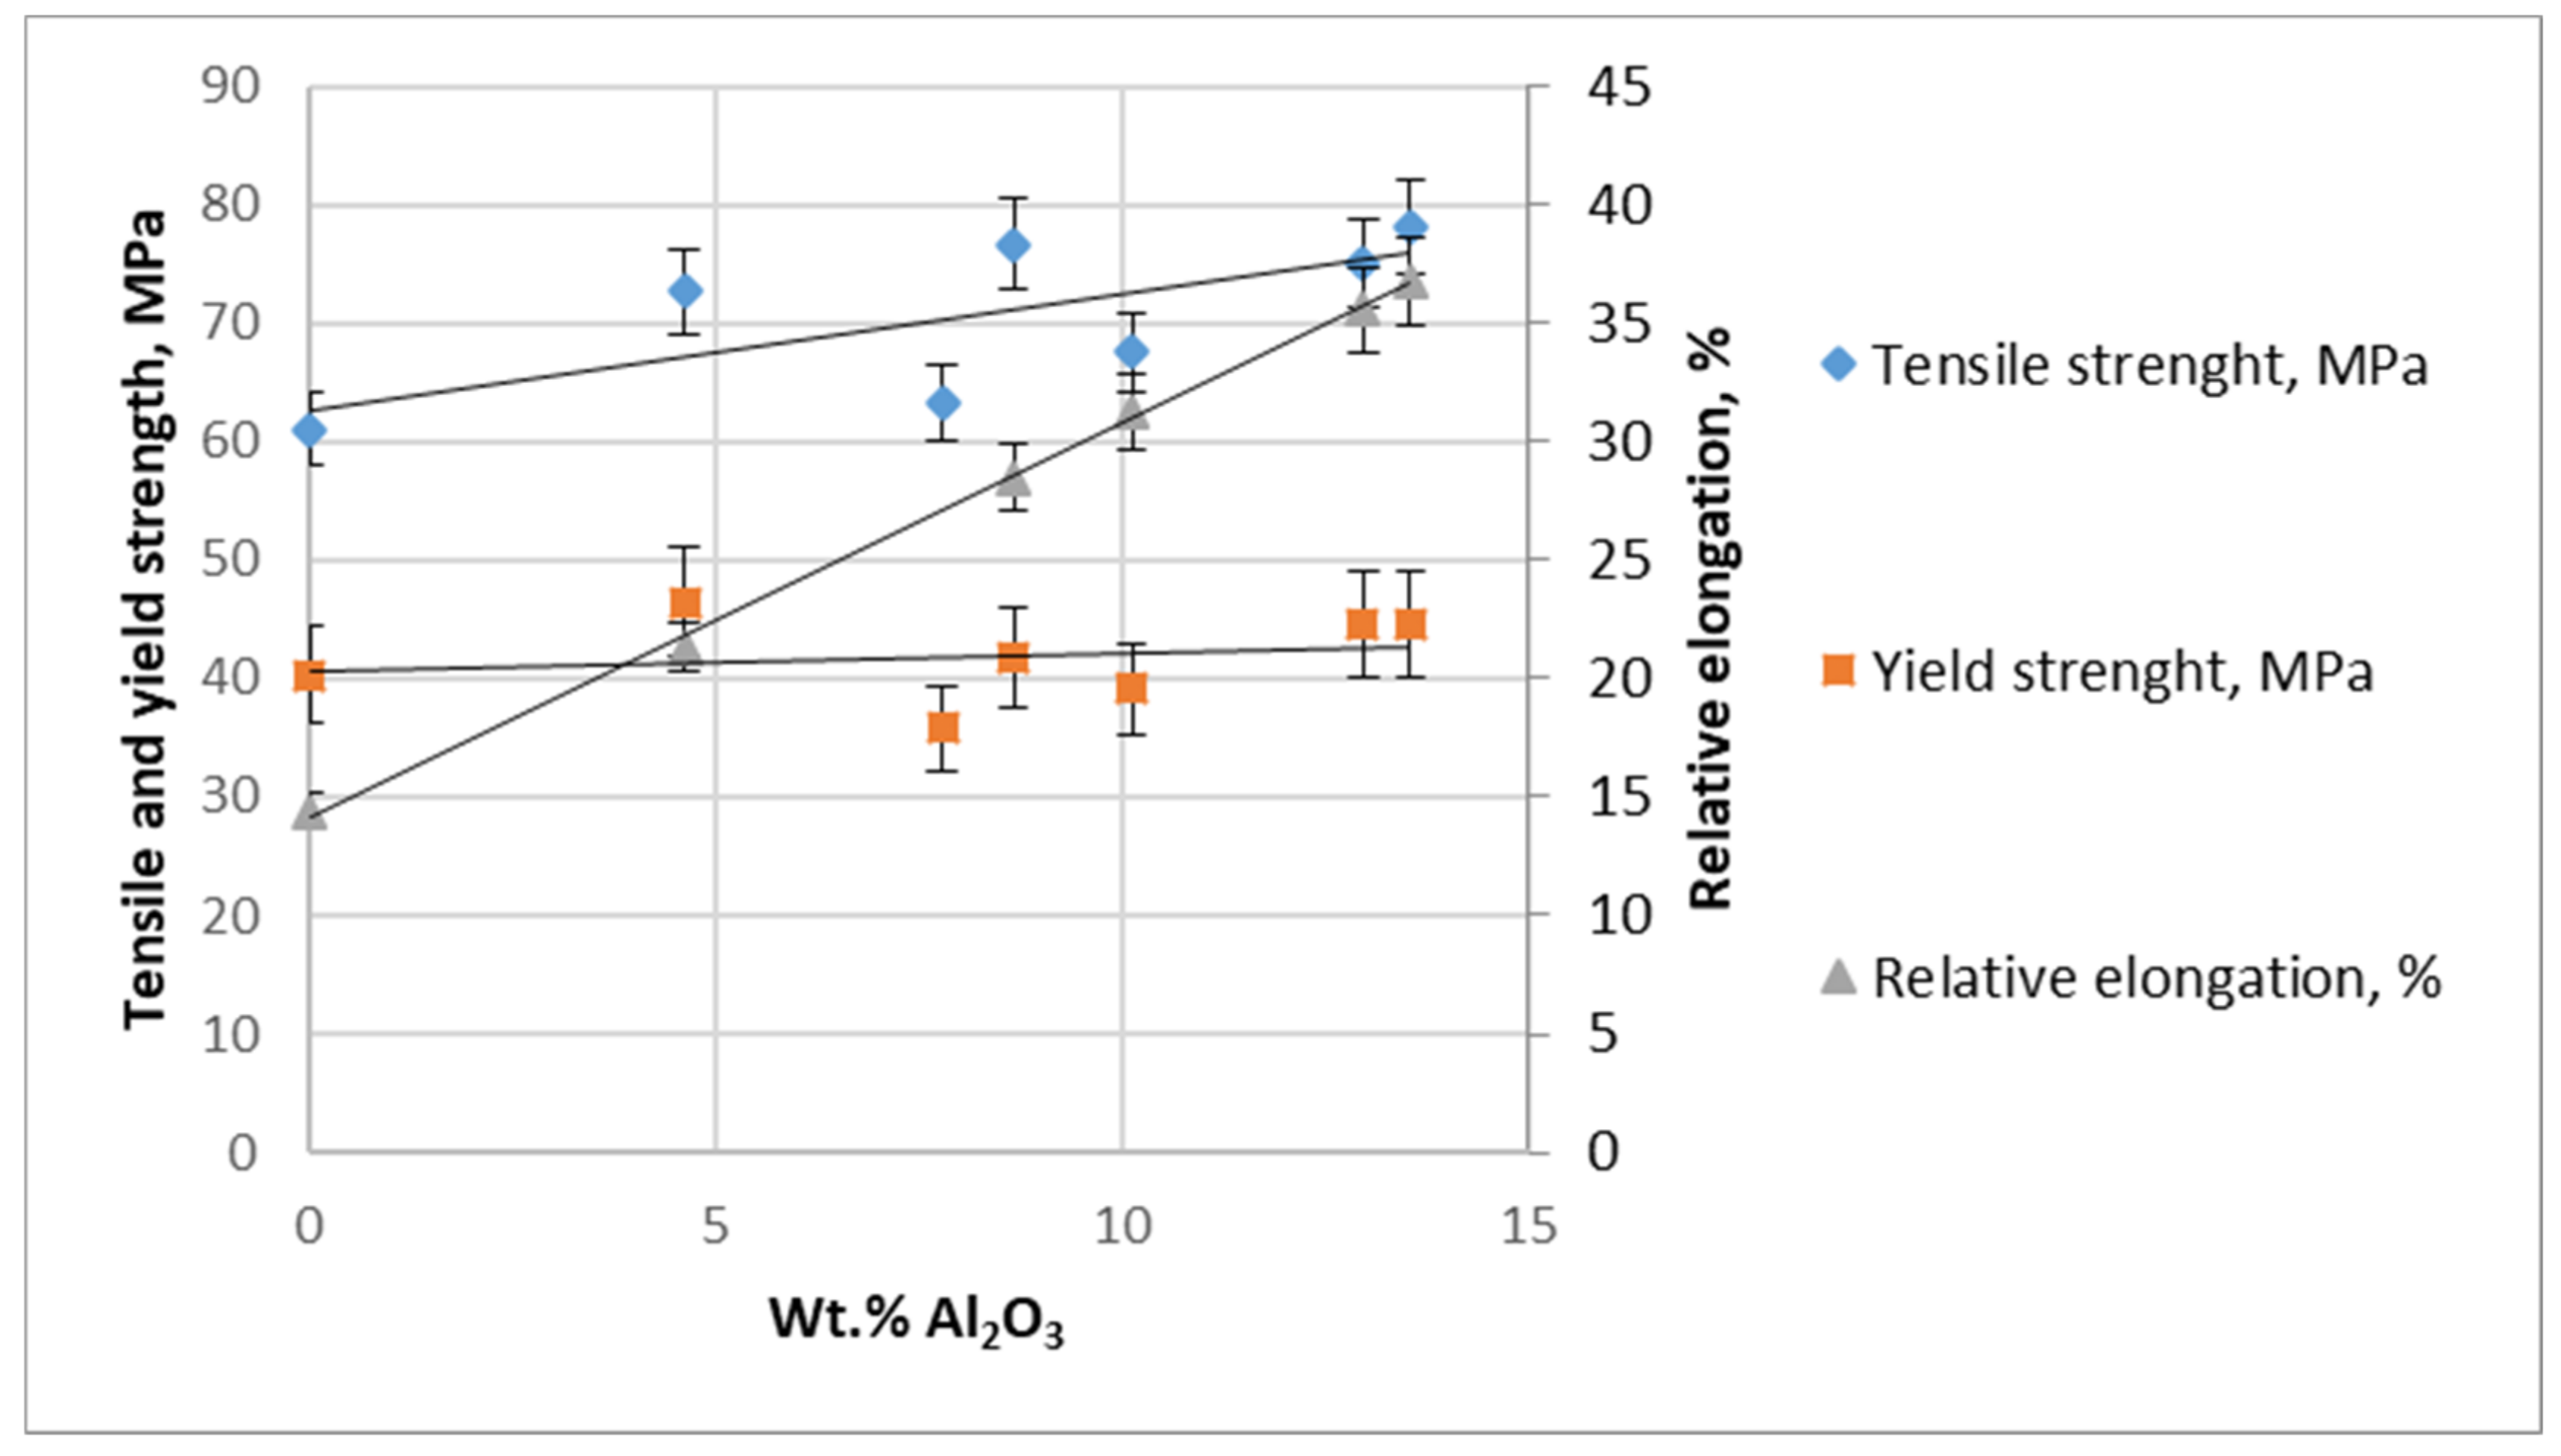
It is evident that the yield strength did not increase with the increase of nano-α- alumina content up to 14 wt.% in the composite (
Figure 10). This is in opposition to conclusions drawn in [
43] that the increase in tensile strength was observed only up to α-Al
2O
3 concentrations of about 5 wt.% and the tensile strength decreased at other concentrations. The composites with an addition of 7–14 wt.% of α- Al
2O
3 possessed tensile strengths of 67.56 and 78.16 MPa, which were 1.10 and 1.27 times greater than that of the aluminum matrix sample (61.38 MPa). As can be seen from
Figure 8, a further increase in the content of aluminum oxide in the composite to 19 wt.% neither improved, nor worsened, the mechanical properties of the composite. Thus, it can be considered that the aluminum oxide concentration of 14 wt.% was optimal from the point of view of the combination of all properties.
A great simultaneous increase in the sample elongation accompanied this strong improvement of tensile strength. At the same time, significant hardening was accompanied by the elongation of the samples with the addition of 7–14 wt.% of α-Al2O3, which increased from 1.64 to 3.06 times with the greater addition of alumina and reached values of 21.32% and 39.77%, compared with 13% for pure aluminum. This means that the hardness, elasticity, and ductility of the aluminum-nano-α-Al2O3 composite improved simultaneously according to the oxide concentration with uniformly distributed α-Al2O3 nanoparticles inside the aluminum grains. Commonly, improving the hardness of materials leads to brittle deformation, however, the addition of up to 14 wt.% of nano-α-alumina into the aluminum matrix allows increasing simultaneously the strength, hardness, ductility, and elasticity of the resultant aluminum-nano-α-Al2O3 composite.
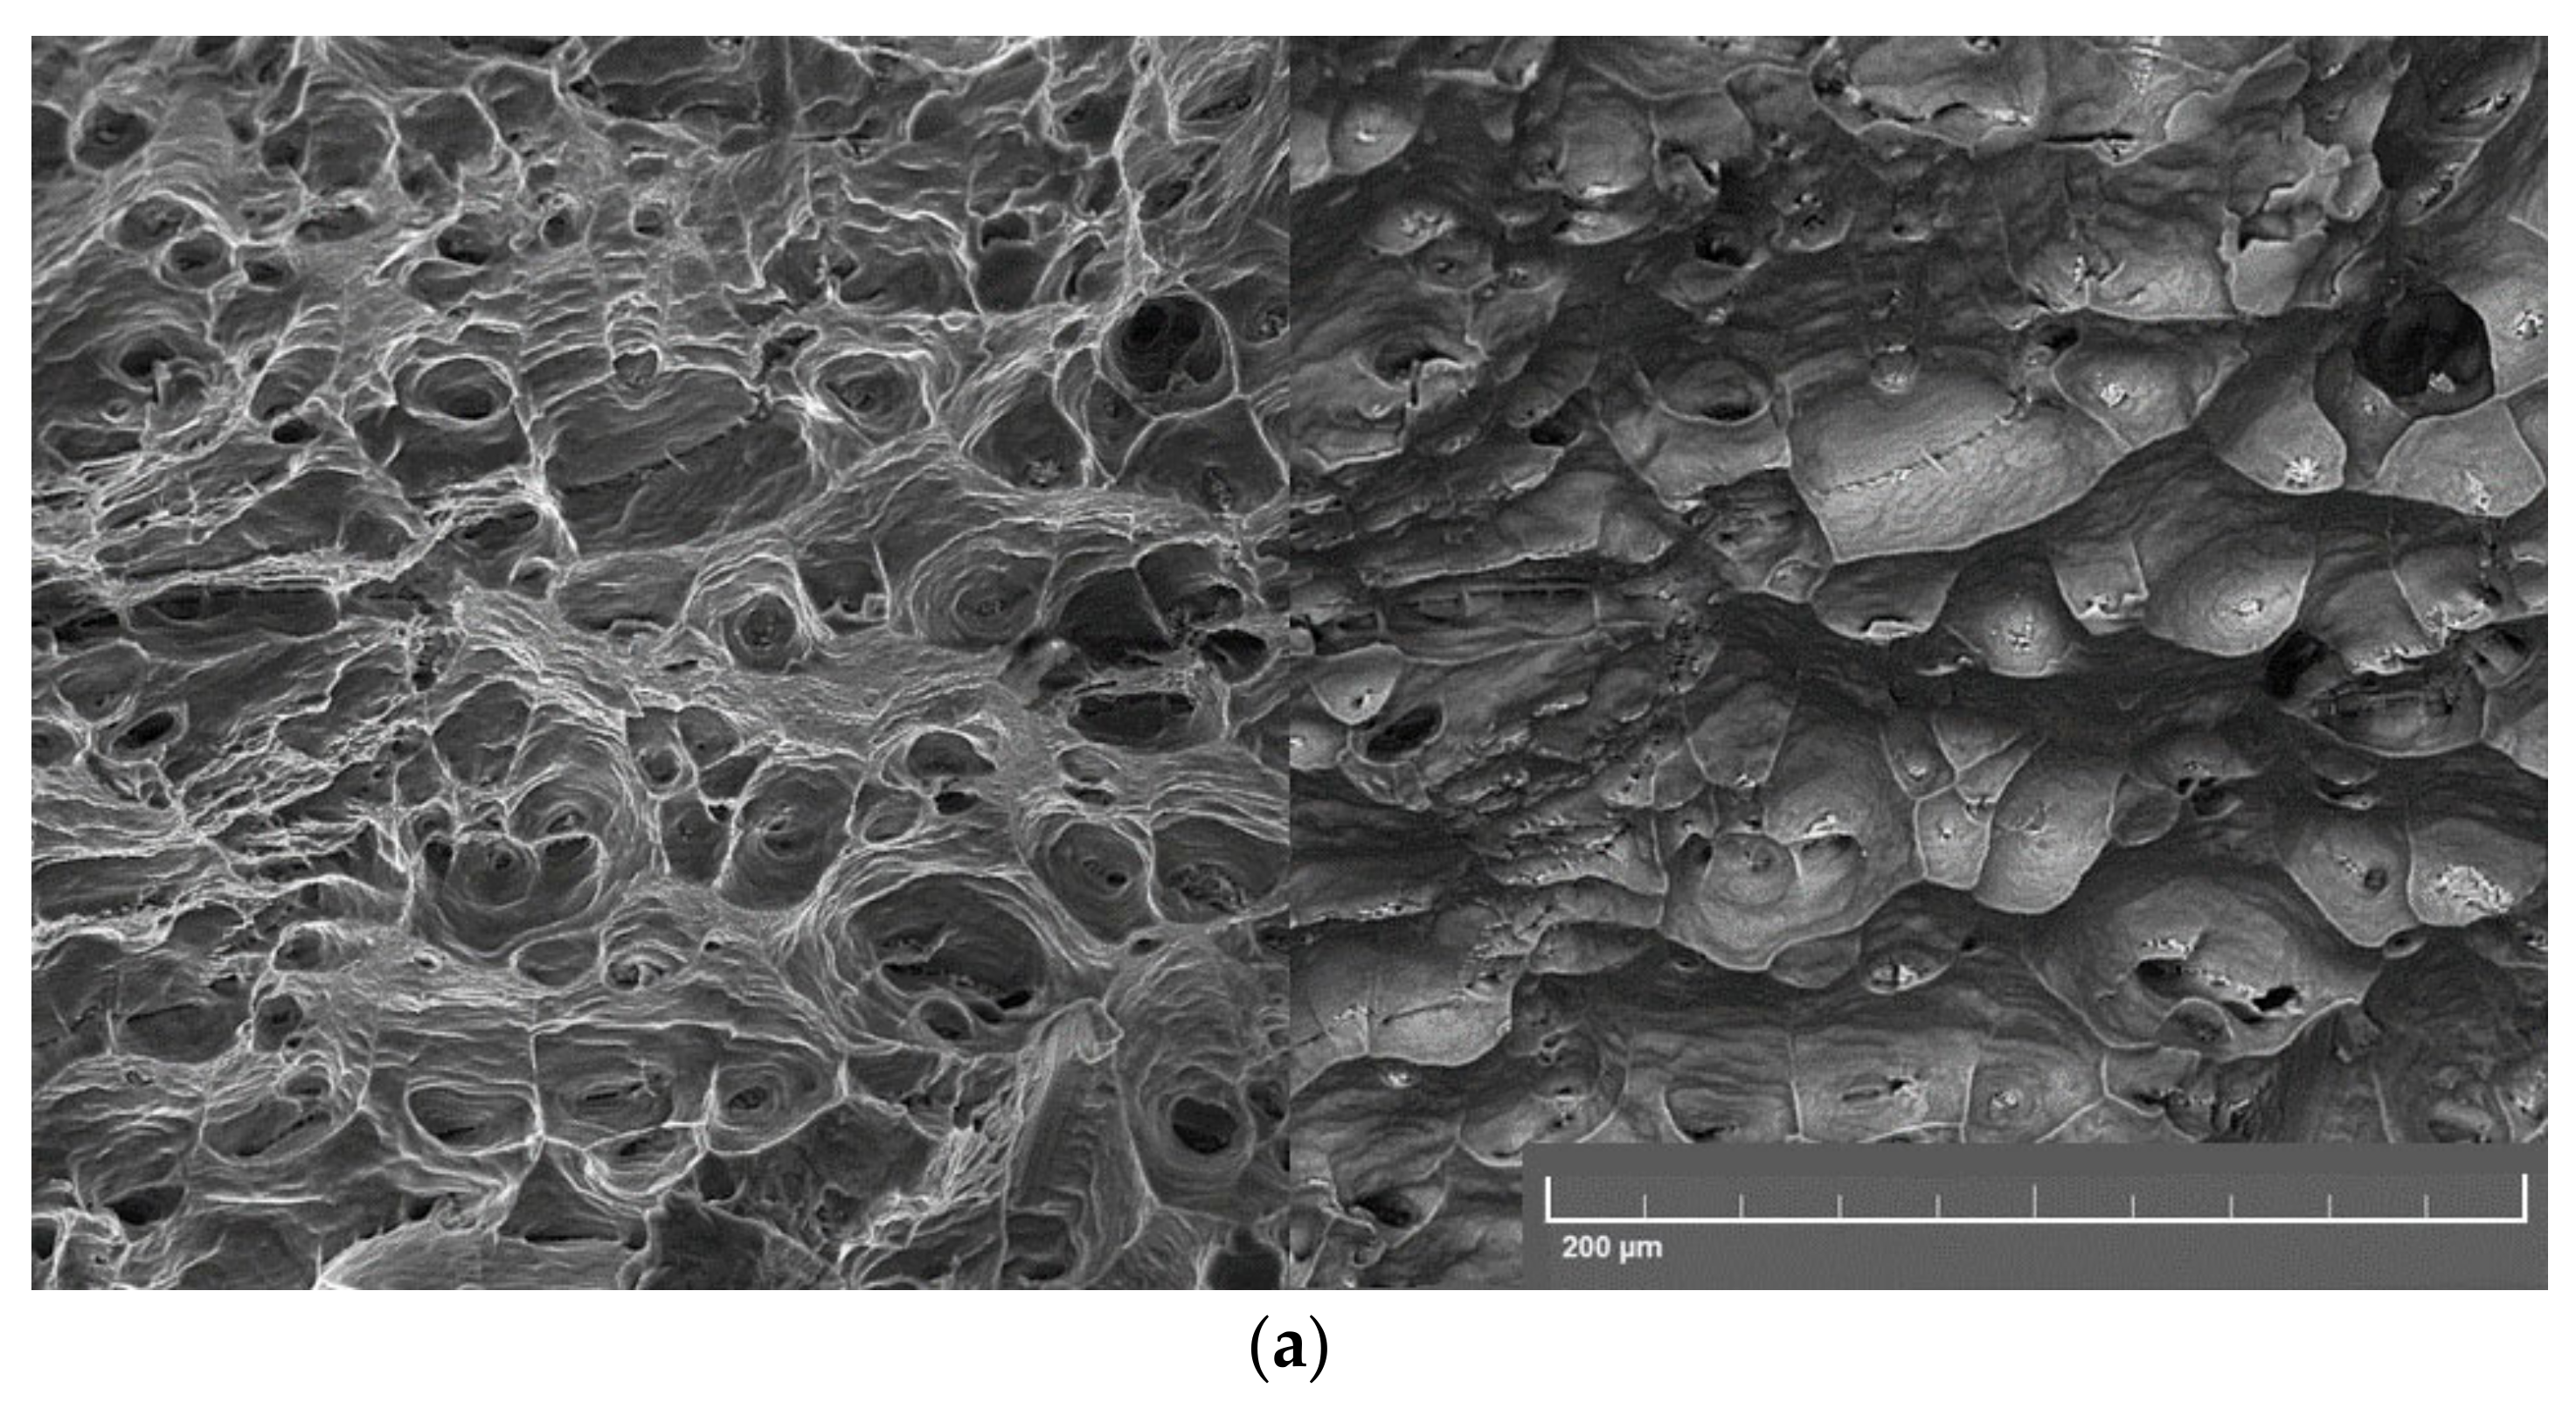
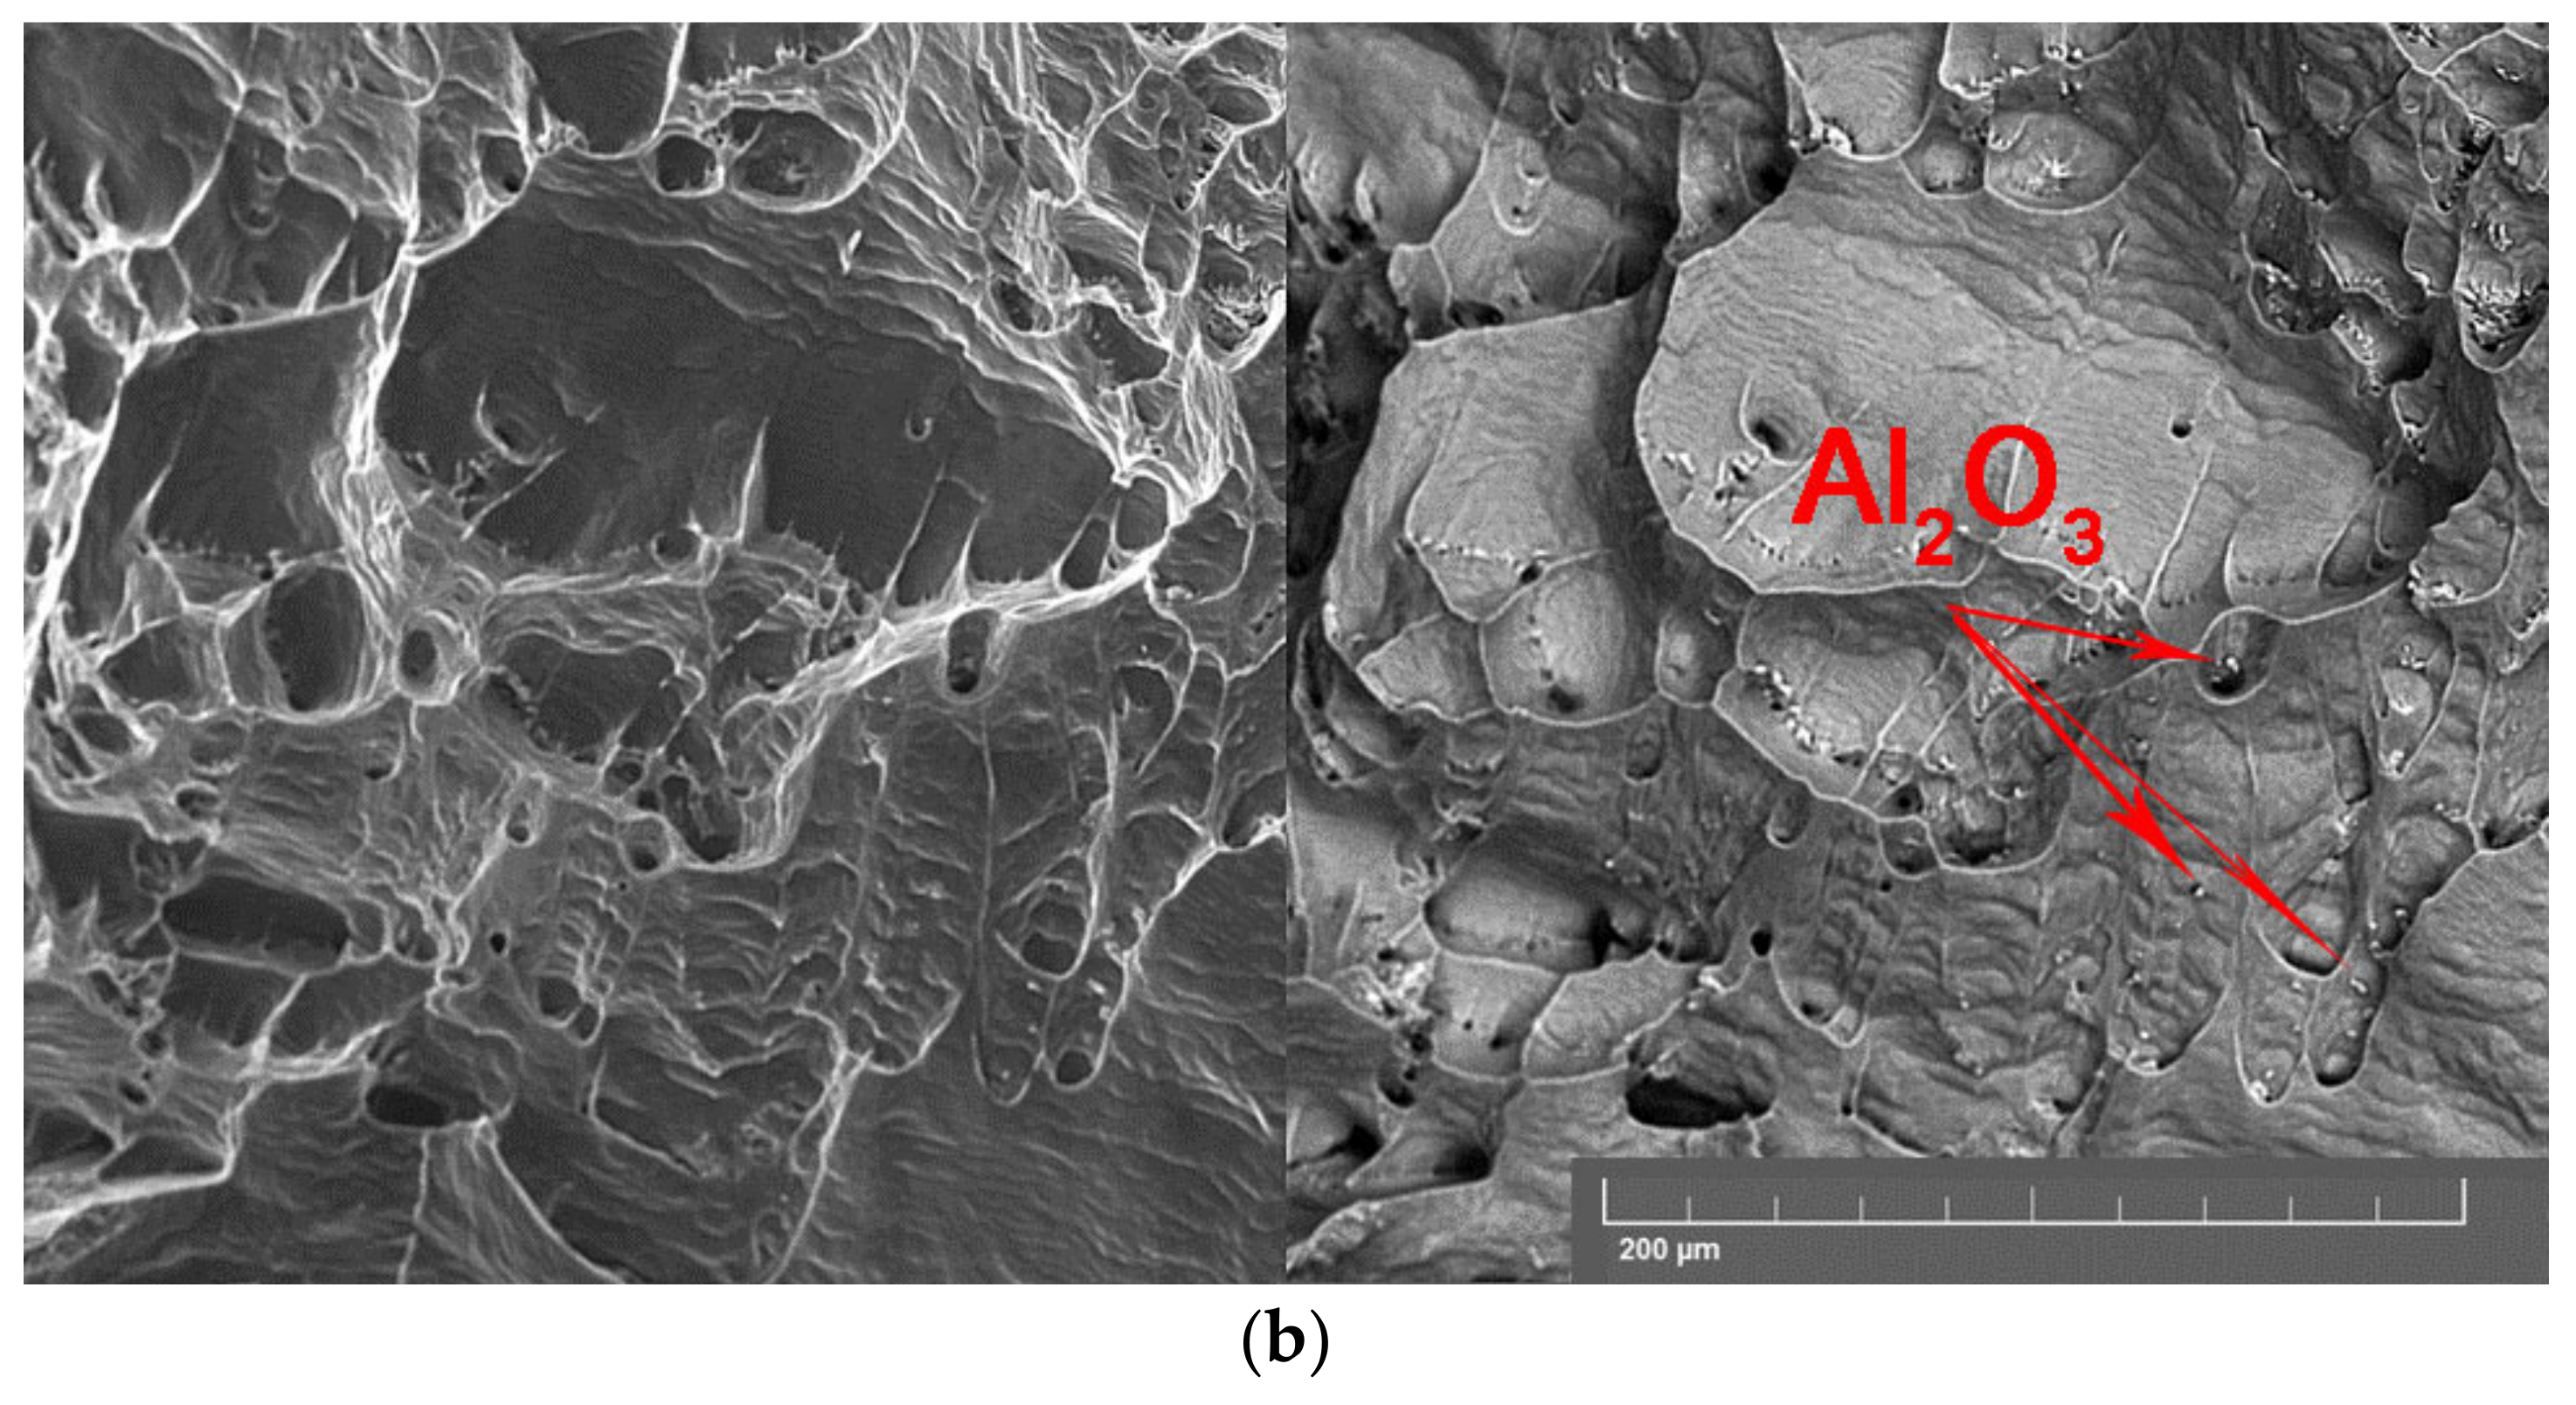
Figure 11 shows SEM images of the tensile fracture surfaces of Al-Al
2O
3 nanocomposites. The fracture mode of the initial matrix Al is predominantly not ductile, with several dimples all over the surface. As shown in
Figure 11b, 14 wt.% nano Al
2O
3-reinforced composite also displayed dimples similar to the Al matrix, except that the length and depth scale of the dimples was very different. No cracks on the fracture image of Al- nano-α Al
2O
3 nanocomposite were observed at tensile strength tests.
When the Al
2O
3 content in the composite was increased, the number and depth of the dimples decreases significantly, and the dimples’ size increased at least three times, leading to a very ductile type of failure. This three-fold increase in the length of the cracks was in excellent agreement with the three-times-increased elongation of AMMC under room temperature stress–strain tests. As seen in
Figure 11b, nanoparticles of α-alumina did not agglomerate in the aluminum matrix and were uniformly distributed even after tensile strength tests. Cracks or porosity were not observed because of the very uniform distribution of α-Al
2O
3 nanoparticles in the aluminum matrix.
3.5. Strengthening Mechanism of Al-Al2O3 Nanocomposites
The strengthening mechanism of Al-Al
2O
3 nanocomposites can be described by the strengthening of fine nanoparticles. Fine Al
2O
3 particles can act throughout the matrix as barriers to the dislocations and thus the elevated mechanical properties may significantly improve the hardness and ductile properties of the composites compared to the base alloy. The contributions of different strengthening mechanisms were estimated according to well-known formulas [
43] (
Table 6).
The ultra-hard α-Al
2O
3 nanoparticles in the Al matrix acted as barriers to the motion of dislocations generated in the matrix. The higher particle density caused the Orowan strengthening, which is the main influence according to
Table 6. It is obvious that the experimental values were much closer to the sum of the load transfer (Δσ
load) and Orowan strengthening (Δσ
Orowan). The yield strength of the composites increased mostly because of the Orowan strengthening.
However, an increased addition of α-Al
2O
3 nanoparticles up to 14 wt.% did not lead to the agglomeration of the reinforcement, and we did not observe any subsequent degradation of the hardness values as opposed to Srivastana et al. and Su et al. [
1,
7]. Further increase in the concentration of highly dispersed α-Al
2O
3 nanoparticles up to 19 wt.% did not result in any hardness improvements as compared to the composite containing 14 wt.% of α-Al
2O
3, but we did not observe any deterioration in the hardness. The concentrations above 19 wt.% Al
2O
3 in the composite were not produced by our method. The strengthening from fine nanoparticles can describe the strengthening mechanism of Al-Al
2O
3 nanocomposites. Fine Al
2O
3 particles spread throughout the matrix can act as barriers to the dislocations, and thus mechanical properties of composites (hardness and ductile properties) are improved as compared to the base alloy.
The increase in hardness and strength (approximately 1.2–1.3 times) of the new composite material compared to the original aluminum is explained by the inclusion of α-Al
2O
3 particles into the aluminum matrix. The α-Al
2O
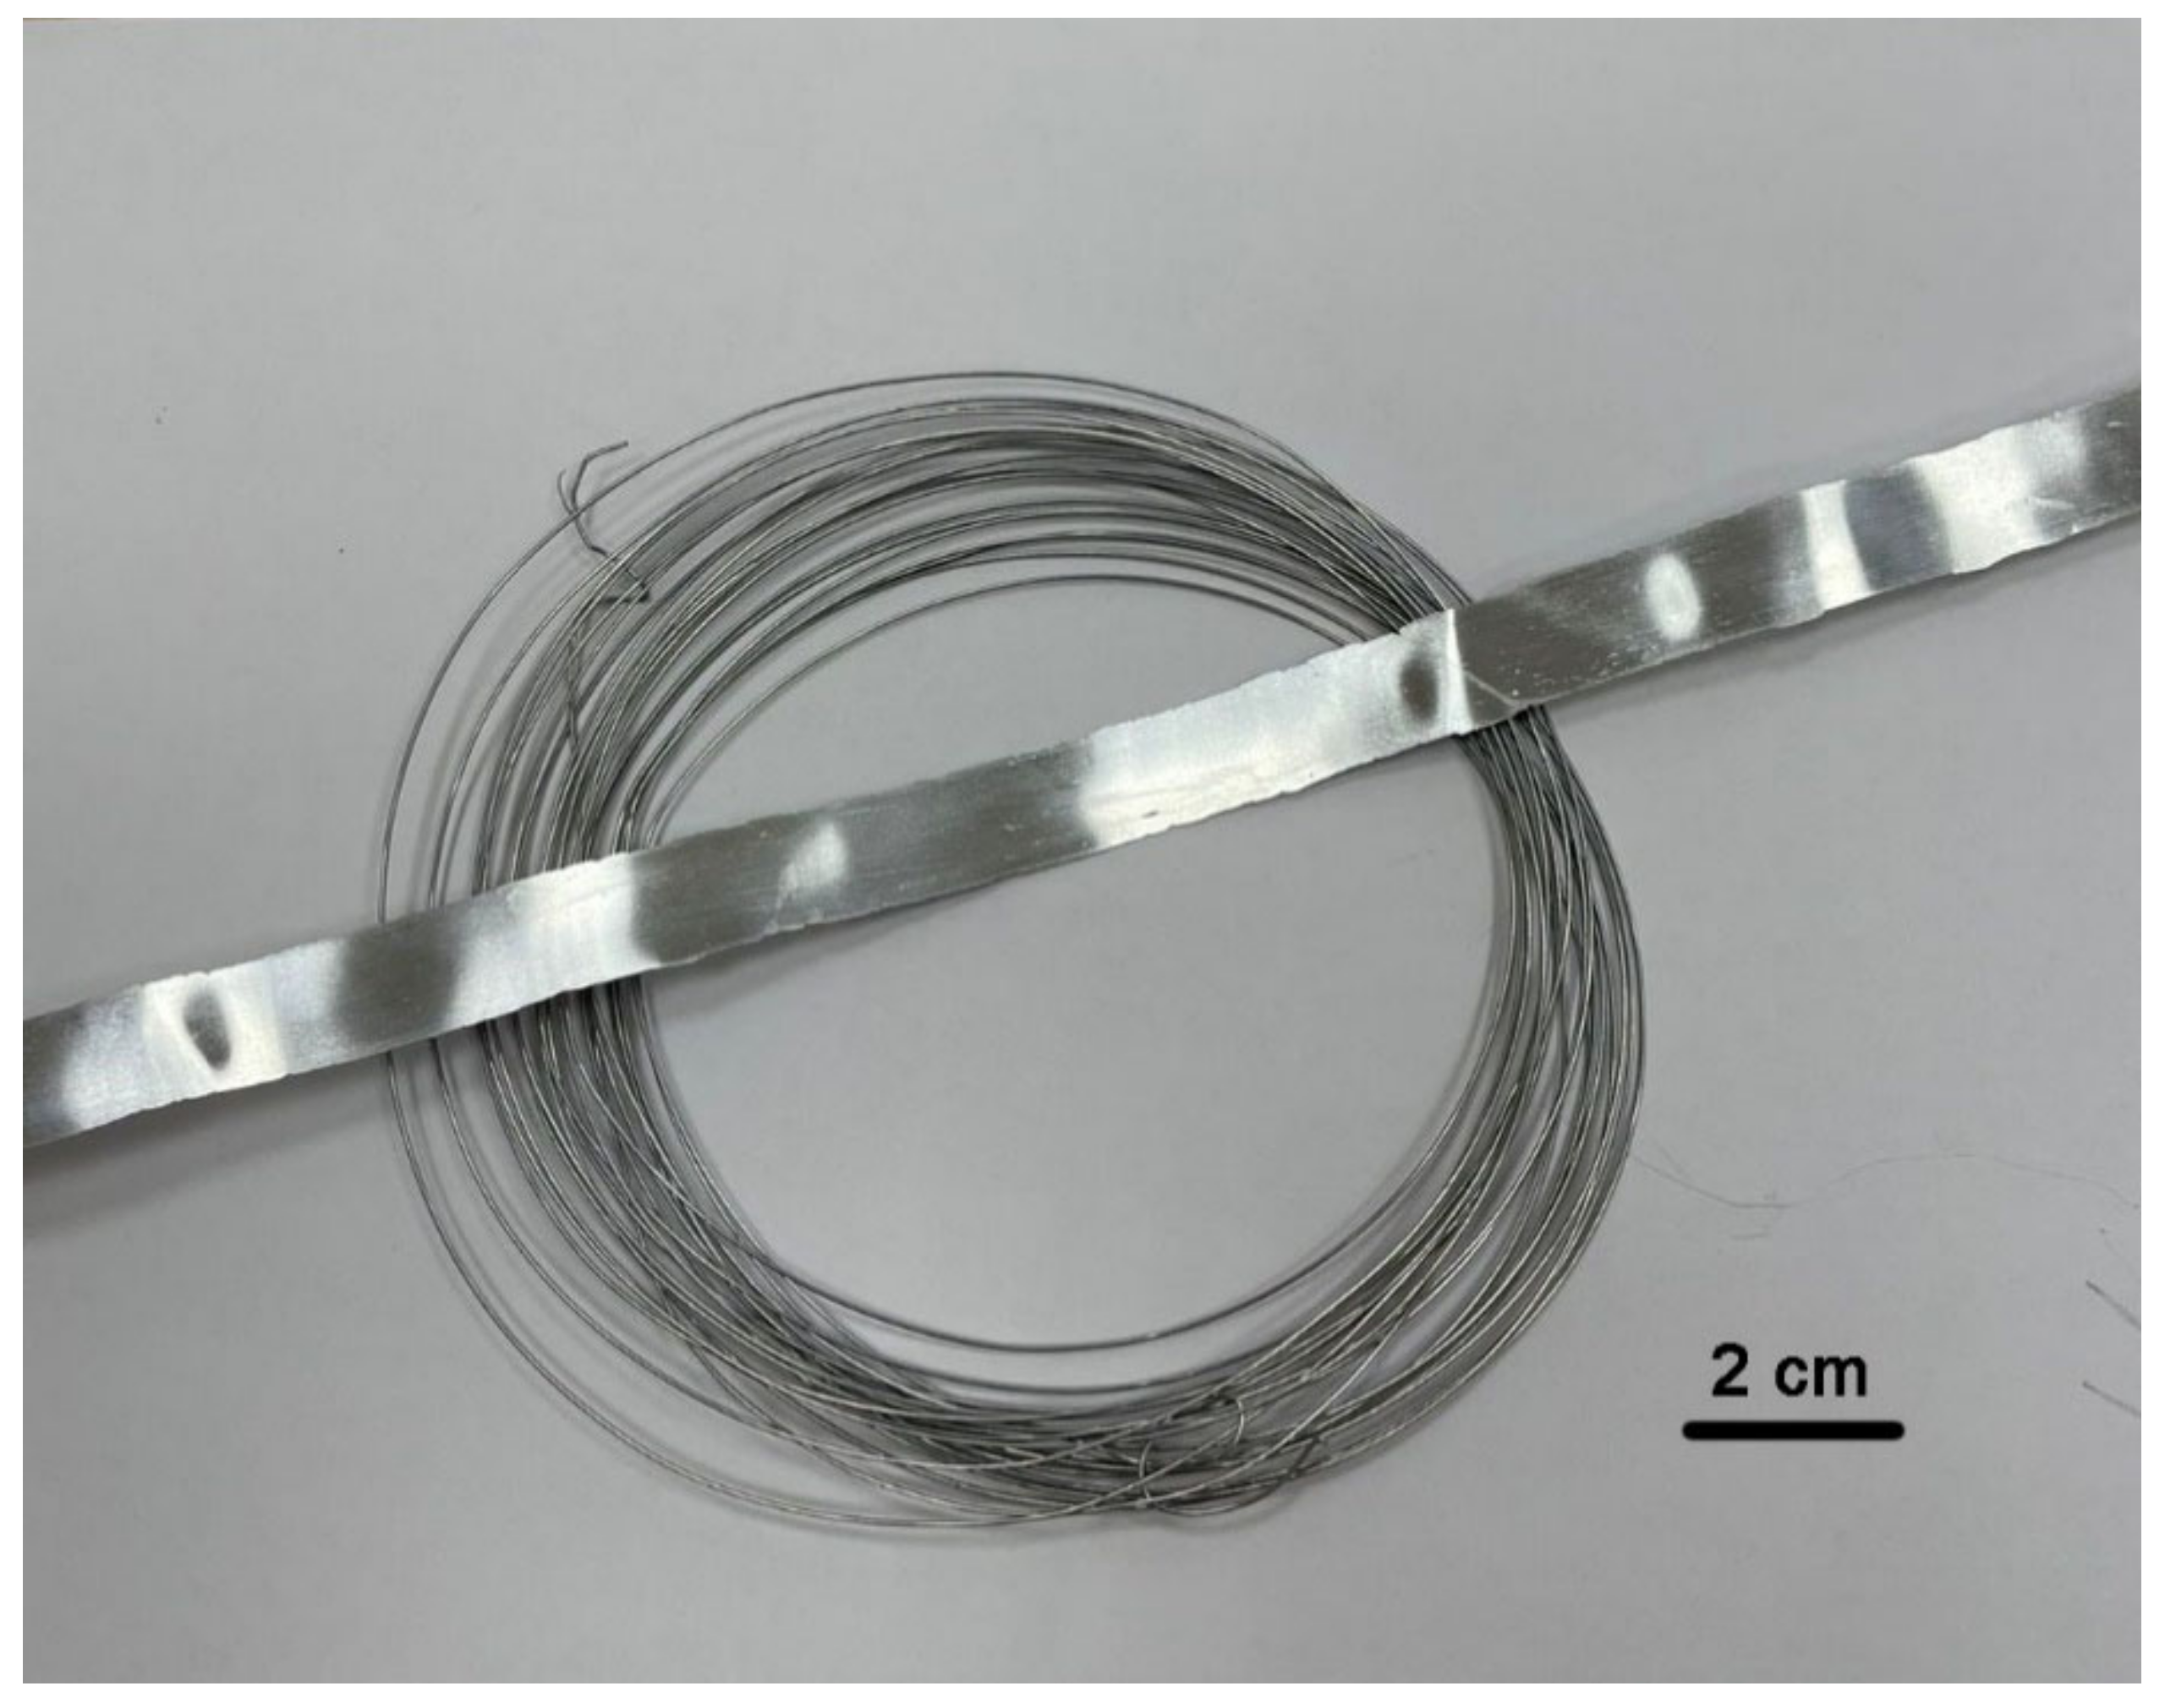
3 particles are in their strongest allotropic corundum modification, which has a hardness close to that of a diamond. An unusual increase in the relative elongation of the composite by a factor of three makes it possible to roll up to 15 µm thick foil on conventional rolling equipment with a deformation of about 500%, as well as to draw 0.2 mm thick wire from Al-Al
2O
3 nanocomposites (
Figure 12).

 ,
, 


