Article

Geometric Characterization of Local Changes in Tungsten Microneedle Tips after In-Vivo Insertion into Peripheral Nerves

1
Translational Neural Engineering Area, The Biorobotics Institute, Department of Excellence in Robotics and AI, Sant’Anna School of Advanced Studies, 56127 Pisa, Italy
2
Department of Health Science and Technology, Aalborg University, Fredrik Bajersvej 7D-3, 9220 Aalborg, Denmark
3
Department of Biomedical Engineering, Purdue School of Engineering and Technology, Indiana University—Purdue University Indianapolis, 723 W. Michigan Str. SL220F, Indianapolis, IN 46202, USA
*
Author to whom correspondence should be addressed.
Appl. Sci. 2022, 12(18), 8938; https://doi.org/10.3390/app12188938
Submission received: 6 May 2022 / Revised: 23 August 2022 / Accepted: 26 August 2022 / Published: 6 September 2022

Abstract

:
Peripheral neural interfaces are used to connect the peripheral nervous system to high-tech robotic devices and computer interfaces. Soft materials are nowadays used to build the main structural part of these interfaces because they are able to mimic the mechanical properties of peripheral nerves. However, if on the one hand soft materials provide effective connections, reducing mechanical mismatch with nervous tissues and creating a close contact between active sites and neural fibers, on the other hand, most of them are not mechanically stable during implantation. As a consequence, tungsten (W) microneedles are used to insert soft neural interfaces, because they are able to pierce the peripheral nervous tissue because of their high stiffness. Nevertheless, this stiffness cannot prevent microneedles from local microscopic structural damage, even after successful insertions. In addition, the nature of this damage is not totally clear. Therefore, this work aimed at quantitatively investigating the phenomenological changes of the microneedles’ tip shape after insertion into the in vivo peripheral nerves. In particular, a quantification of the interactions between peripheral nerves and W microneedles was proposed through the Oliver-Pharr formula, and the interaction force was found to be directly proportional to the power < m > = 2.124 of the normalized indentation depth. Moreover, an experimental correlation between insertion force and the opening tip angle was described together with an assessment of the minimum diameter to effectively puncture the peripheral nervous tissue. Finally, a computational framework was presented to describe the local changes affecting the microneedles’ tip shape. This approach was able to detect a bulging phenomenon along with the microneedle tips with a characteristic amplitude of approximately 100 μm, and a folding phenomenon, with a characteristic mean amplitude of less than 20 μm, affecting the extreme ending sections of the microneedle tips. These geometrical changes were related to the synergistic action of interaction forces likely resulting in compression and elastic instability of the tip.

1. Introduction

Tungsten (W) is a strong metallic element having many different applications in modern conventional industry. The W-cemented carbide (WC) has extreme toughness and hardness [1], which suits it to create cutting tools [2,3], wear parts, and drill bits [4]. This ceramic is used in industrial segments like aerospace, defence, automotive, oil and mineral exploration, as well as within the construction sector [5]. Similarly, it is well known to provide steel and super alloys [6].
In addition, W has the highest melting point of all metals, a low-sputter erosion rate together with a good radiation resistance greater than carbon fiber composite, beryllium, and iron [7,8], and it is also a key structural material for fusion energy systems [9]. W was used to provide fiber-reinforced composites overcoming the technical performances of the baseline materials for plasma-facing components. In particular, high-energy ions were used as a substitute for the displacement damage due to neutrons, and a very thin tungsten wire was used to study the influence of irradiation damage on its mechanical properties [10]. Microwires of tungsten with repeatedly similar cross-sectional variations were recently produced by using wire electrochemical machining (WECM) [11], whereas in biomedical sciences, W microwires were crucial to build microelectrodes to record neural signals, thanks to their conductivity coupled with high stiffness [12,13]. However, their permanent contact with biological tissues enhanced electrochemical reactions resulting in corrosion and structural failure [14,15]. In addition, as the foreign body reaction (FBR) affects the interaction between living tissues and synthetic materials [16,17] it similarly affects the interaction between the peripheral nervous tissue [18,19,20,21,22,23,24,25] and all kinds of intraneural interfaces [26,27,28,29], resulting in the formation of a tissue capsule [30] around the implanted structures. In the same way, interface phenomena, due to the high stiffness of W, triggered a foreign body response resulting in the encapsulation of microwires [30,31,32,33,34,35].
As a consequence, soft electrodes were proposed [36,37] to lower the stiffness mismatch between the nervous tissues and the materials of neural interfaces as much as possible. However, they could be mechanically unstable when implanted into the tissue; thus, a possible implantation strategy involves the use of stiff microneedles to previously pierce the nerve before their insertion. This is not a novel strategy in surgery, because in several medical procedures needles/microneedles are used to penetrate into biological tissues. More specifically, needles are used in brachytherapy [38] to place radioactive seeds close to clusters of tumour cells, to perform biopsy [39,40], and reach less accessible body sites to extract biological specimens, to perform several types of injections [41] inoculating drugs inside the body with accuracy. In neuroscience, they are commonly used in microneurography [42,43].
Moreover, further research was recently performed to study needles for aesthetic filler injections, investigating their tip deformation following injection procedures. Repeated injections, performed with the same needle, were related to a progressive needle tip deformation, increasing the lack of precision and patient discomfort [44]. Similarly, mechanical deformation of dental cannula tips after injections in animal models [45], as well as needle tip deformation after administration of local anesthesia in human patients, were investigated and resulted in a correlation between multiple use of the same cannula, more pronounced tip deformation, and increasing risk of complications [46].
In this work, the reaction force of the tissue to the action of the force exerted by the microneedle tip (action-reaction principle) was defined as “interaction force”. As shown in the literature [41], the interaction force between microneedle and several soft tissues (e.g., skin, liver, etc.) had a characteristic evolution, whereas the insertion of microneedles into peripheral nerves was not a well-studied subject. Hence, in order to explore the nature of this interaction force, the insertion of metallic microneedles within in vitro specimens was studied [47], as well as the interaction force between W microneedles and in vitro specimens [48]. Again, the interaction force between W microneedles and in vivo peripheral nerves [49] was studied, whereas the effects of abiotic and biotic factors into in vivo and in vitro insertions have been explored for W microneedles [50]. In all these cases, as well as in the literature [41], the contact force increased along the first phase of interaction. Thus, even if the mechanical characteristics (e.g., stiffness, toughness, etc.) of the W definitely exceeded those of peripheral nerves [51,52,53,54,55,56,57,58,59,60], the main shaft of the microneedles was designed to avoid elastic instability [47,48]. In addition, this first phase of interaction between W microneedles and peripheral nerves (up to the piercing of the tissue), was modelled as an indentation through the Sneddon’s framework [49,61]. Nevertheless, no studies related to the tip deformation of W microneedles were performed, although it is not currently clear whether the avoidance of the main shaft buckling could nevertheless result in localized deformations at the tip level. Similarly, it is not clear whether these deformations result in clear geometric changes of the tip shape.
As a consequence, in this work, a phenomenological and quantitative investigation of the interaction between W microneedles and in vivo peripheral nerves was provided. To this aim, the Oliver-Pharr approach was tested to obtain an explicit framework accounting for the interaction force between tissue and microneedles. This model was optimized and all the relevant numeric parameters (coefficients and exponents) were characterized. In addition, the relationship between the tip angle and the insertion force was investigated; thus, an experimental formula between tip angle and the diameter of the microneedle’s main shaft was proposed. Therefore, the effects of the interaction force on the tip geometric shape were investigated: the geometric shape of the intact tip of microneedles was quantitatively mapped as a function of the distance from the contact point with the peripheral nervous tissue, whereas the geometric changes of the tip in the post insertion microneedles were assessed with respect to the shape of the intact ones. Finally, the amount of deformation was quantified through simple indices.

2. Materials and Methods

2.1. Experimental Data

Original data deriving from previous experiments [49] were used to quantify the interaction forces resulting from the puncture of in vivo peripheral nerves with W microneedles. As previously described [49,50], microneedles were obtained from 20-mm-long W rods (A-M Systems) with diameters of ⌀75 μm, which were manually electro-sharpened keeping a ∼8 VAC potential between extremities. A large carbon counter electrode was used to etch tips in a 2N KNO3 solution for 20–40 s through the anodic dissolution of tungsten oxides [62]. Moreover, the microneedle tips were visually inspected during etching and then cleaned in deionized water before experiments. W microneedles were inserted through a surgical access in the upper forelimb to the ulnar and median nerves (∼⌀3–5 mm) of three adult Danish Landrace pigs. More specifically, the site of insertion was chosen ∼50 mm above the elbow, and the nerve was supported by a holed platform (hole diameter ∼4 mm). A servo-controlled motor (Maxon DC Motor 22-60-881, JVL Industri Elektronik A/S, DK) and a hydraulic micromanipulator (Narishige MMO-220) were used to control the microneedle position, and a constant velocity (2 mm/s) [63] ramp-hold-ramp profile was used to insert, hold, and retract the needle into/out of the nerve. The interaction force was quantified by using an in-line load cell (Model 31/1435-02, max load 0.1 kg, resolution 1.31 mV/g, Sensotec Inc., Columbus, OH, USA), and the signal was filtered with a third-order Butterworth lowpass filter (F3 dB = 12.5 Hz). Eleven experiments were analyzed, and the resulting interaction force-indentation depth curves were studied.

2.2. Modeling of the Interaction between W Microneedles and In Vivo Tissue

The first phase of the interaction between W microneedles and in vivo peripheral nerves (i.e., up to the puncture of the nerve, see Figure 1) was modelled as an indentation. However, the shape of the W microneedle was different with respect to standard geometries of indenters. As a consequence, to gain more insight on the nature of this interaction, the experimental force/indentation depth curve was tested for the Oliver-Pharr formula [64,65]:
F ( ξ , m ) = a m ξ m ,
where F ( ξ , m ) (in the following F) was the intensity (modulus) of the vector interaction force, which was assumed to be normal to the nerve surface at the contact point and directed along the longitudinal axis of the microneedle (see Figure 1), amR were numerical coefficients, ξ = h/hmax was the normalized indentation depth, and h and h m a x were the current and the maximum indentation depth, respectively (see Figure 1). In particular, real values of m were chosen through a simple parametrization in the form
m = 1 + k 2 ,
where, k N . More specifically, in this work the values k = 2 , 3 , 5 , 7 , 11 , 13 , 15 , 17 were tested to explore values matching experimental data. The accuracy of the fitting procedure was assessed through the R 2 standard metric together with the plot of residuals. Each value of this metric was correlated to the value of m, and this correlation was expressed through a simple implicit function as
Φ ( y , m ) = 0 ,
where, to avoid confusion, y = R 2 ( m ) was the value of the standard metric R 2 resulting from the fitting of the experimental data for each value of m in Equation (1). Thus, Equation (3) was optimized through the calculation of
m Φ ( y , m ) = 0 .
Moreover, the correlation between the maximum indentation depth (before the puncture of the tissue) and the coefficients a m in Equation (1) was studied for different values of m. Finally, the same procedure was applied to the optimal value of m, which was therefore considered the reference value to match the interactions between the in vivo peripheral nerves and the W microneedles.

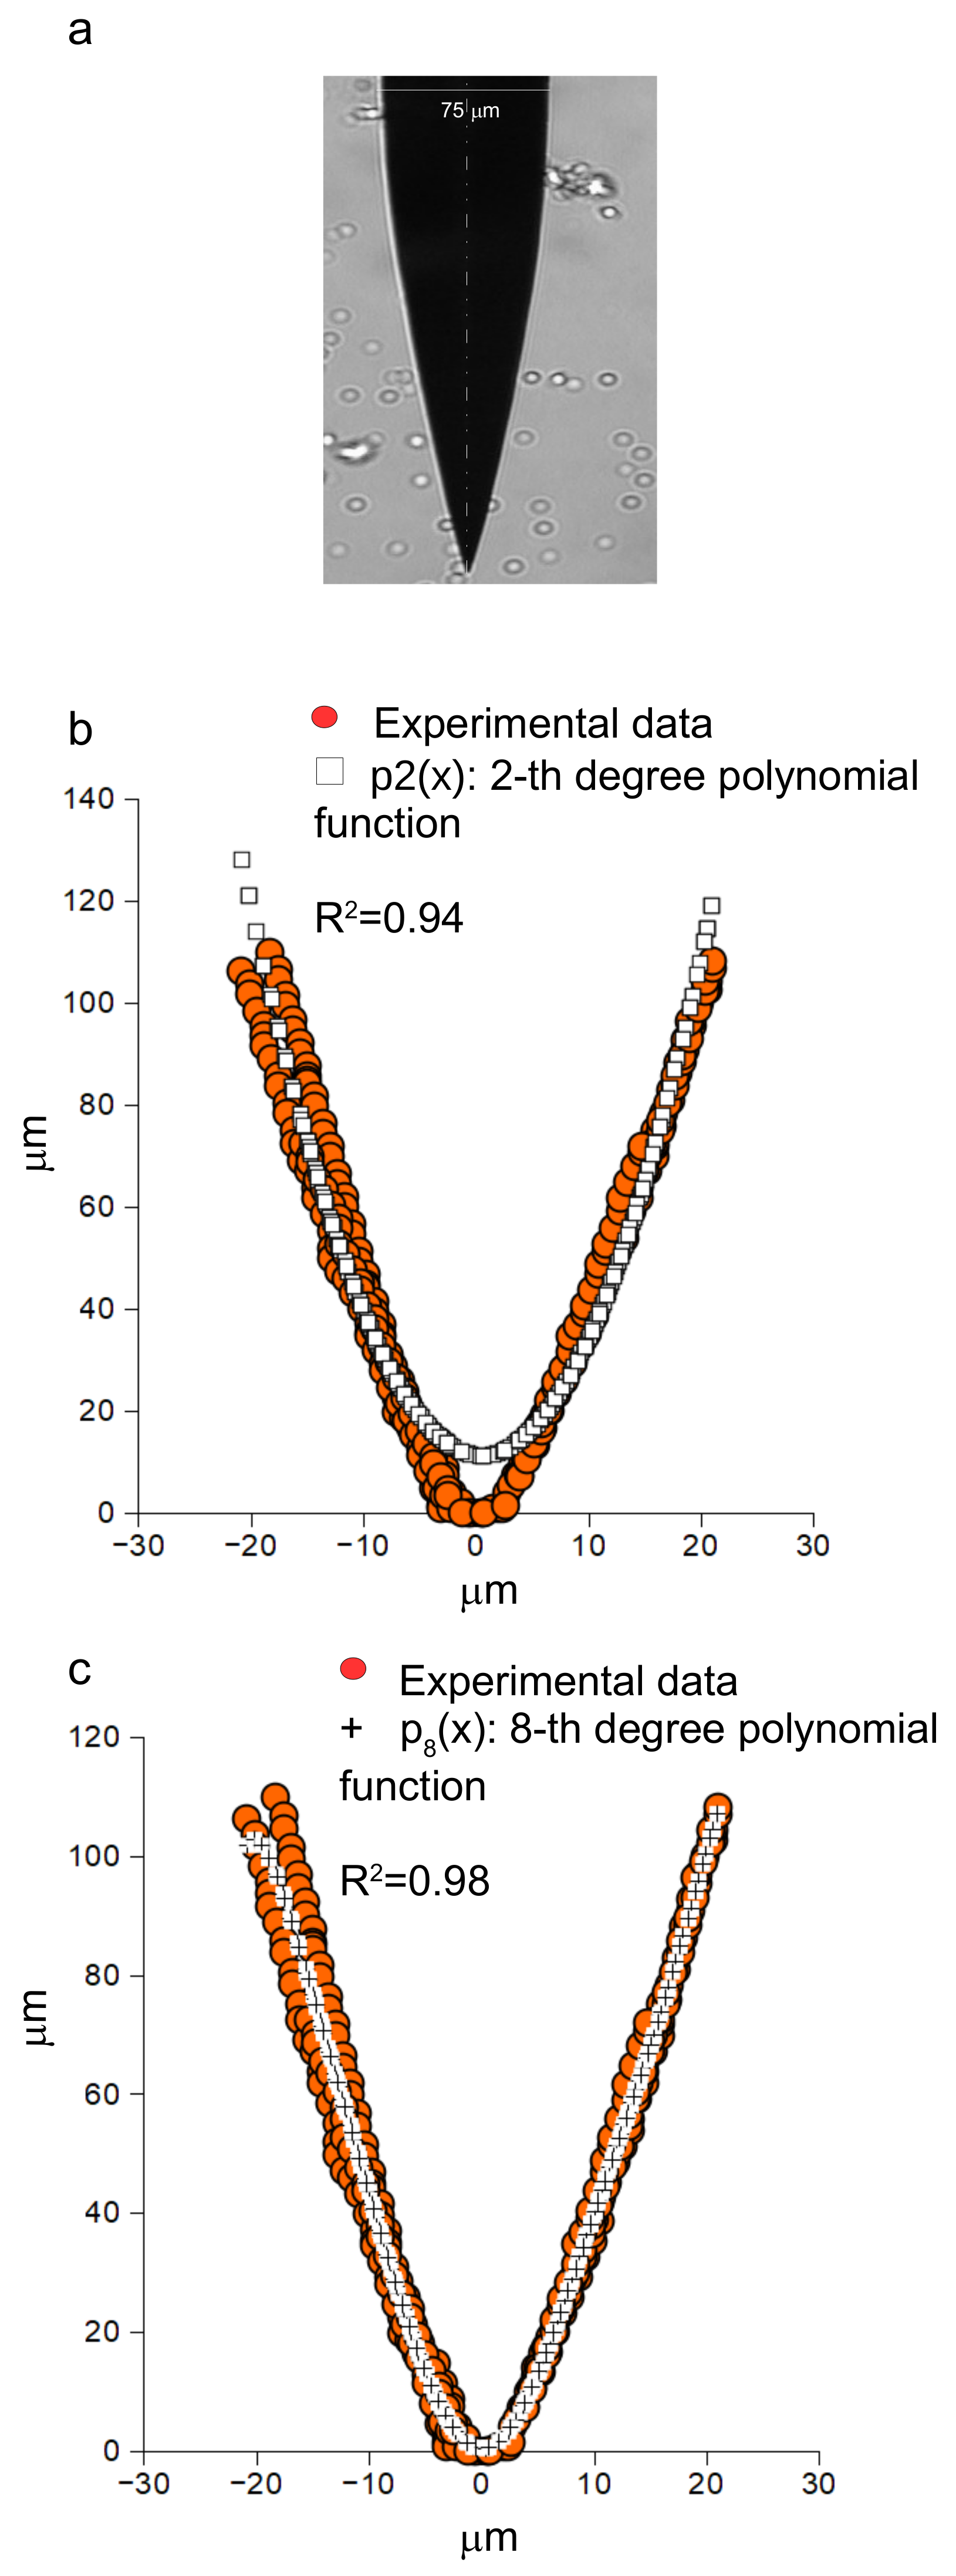
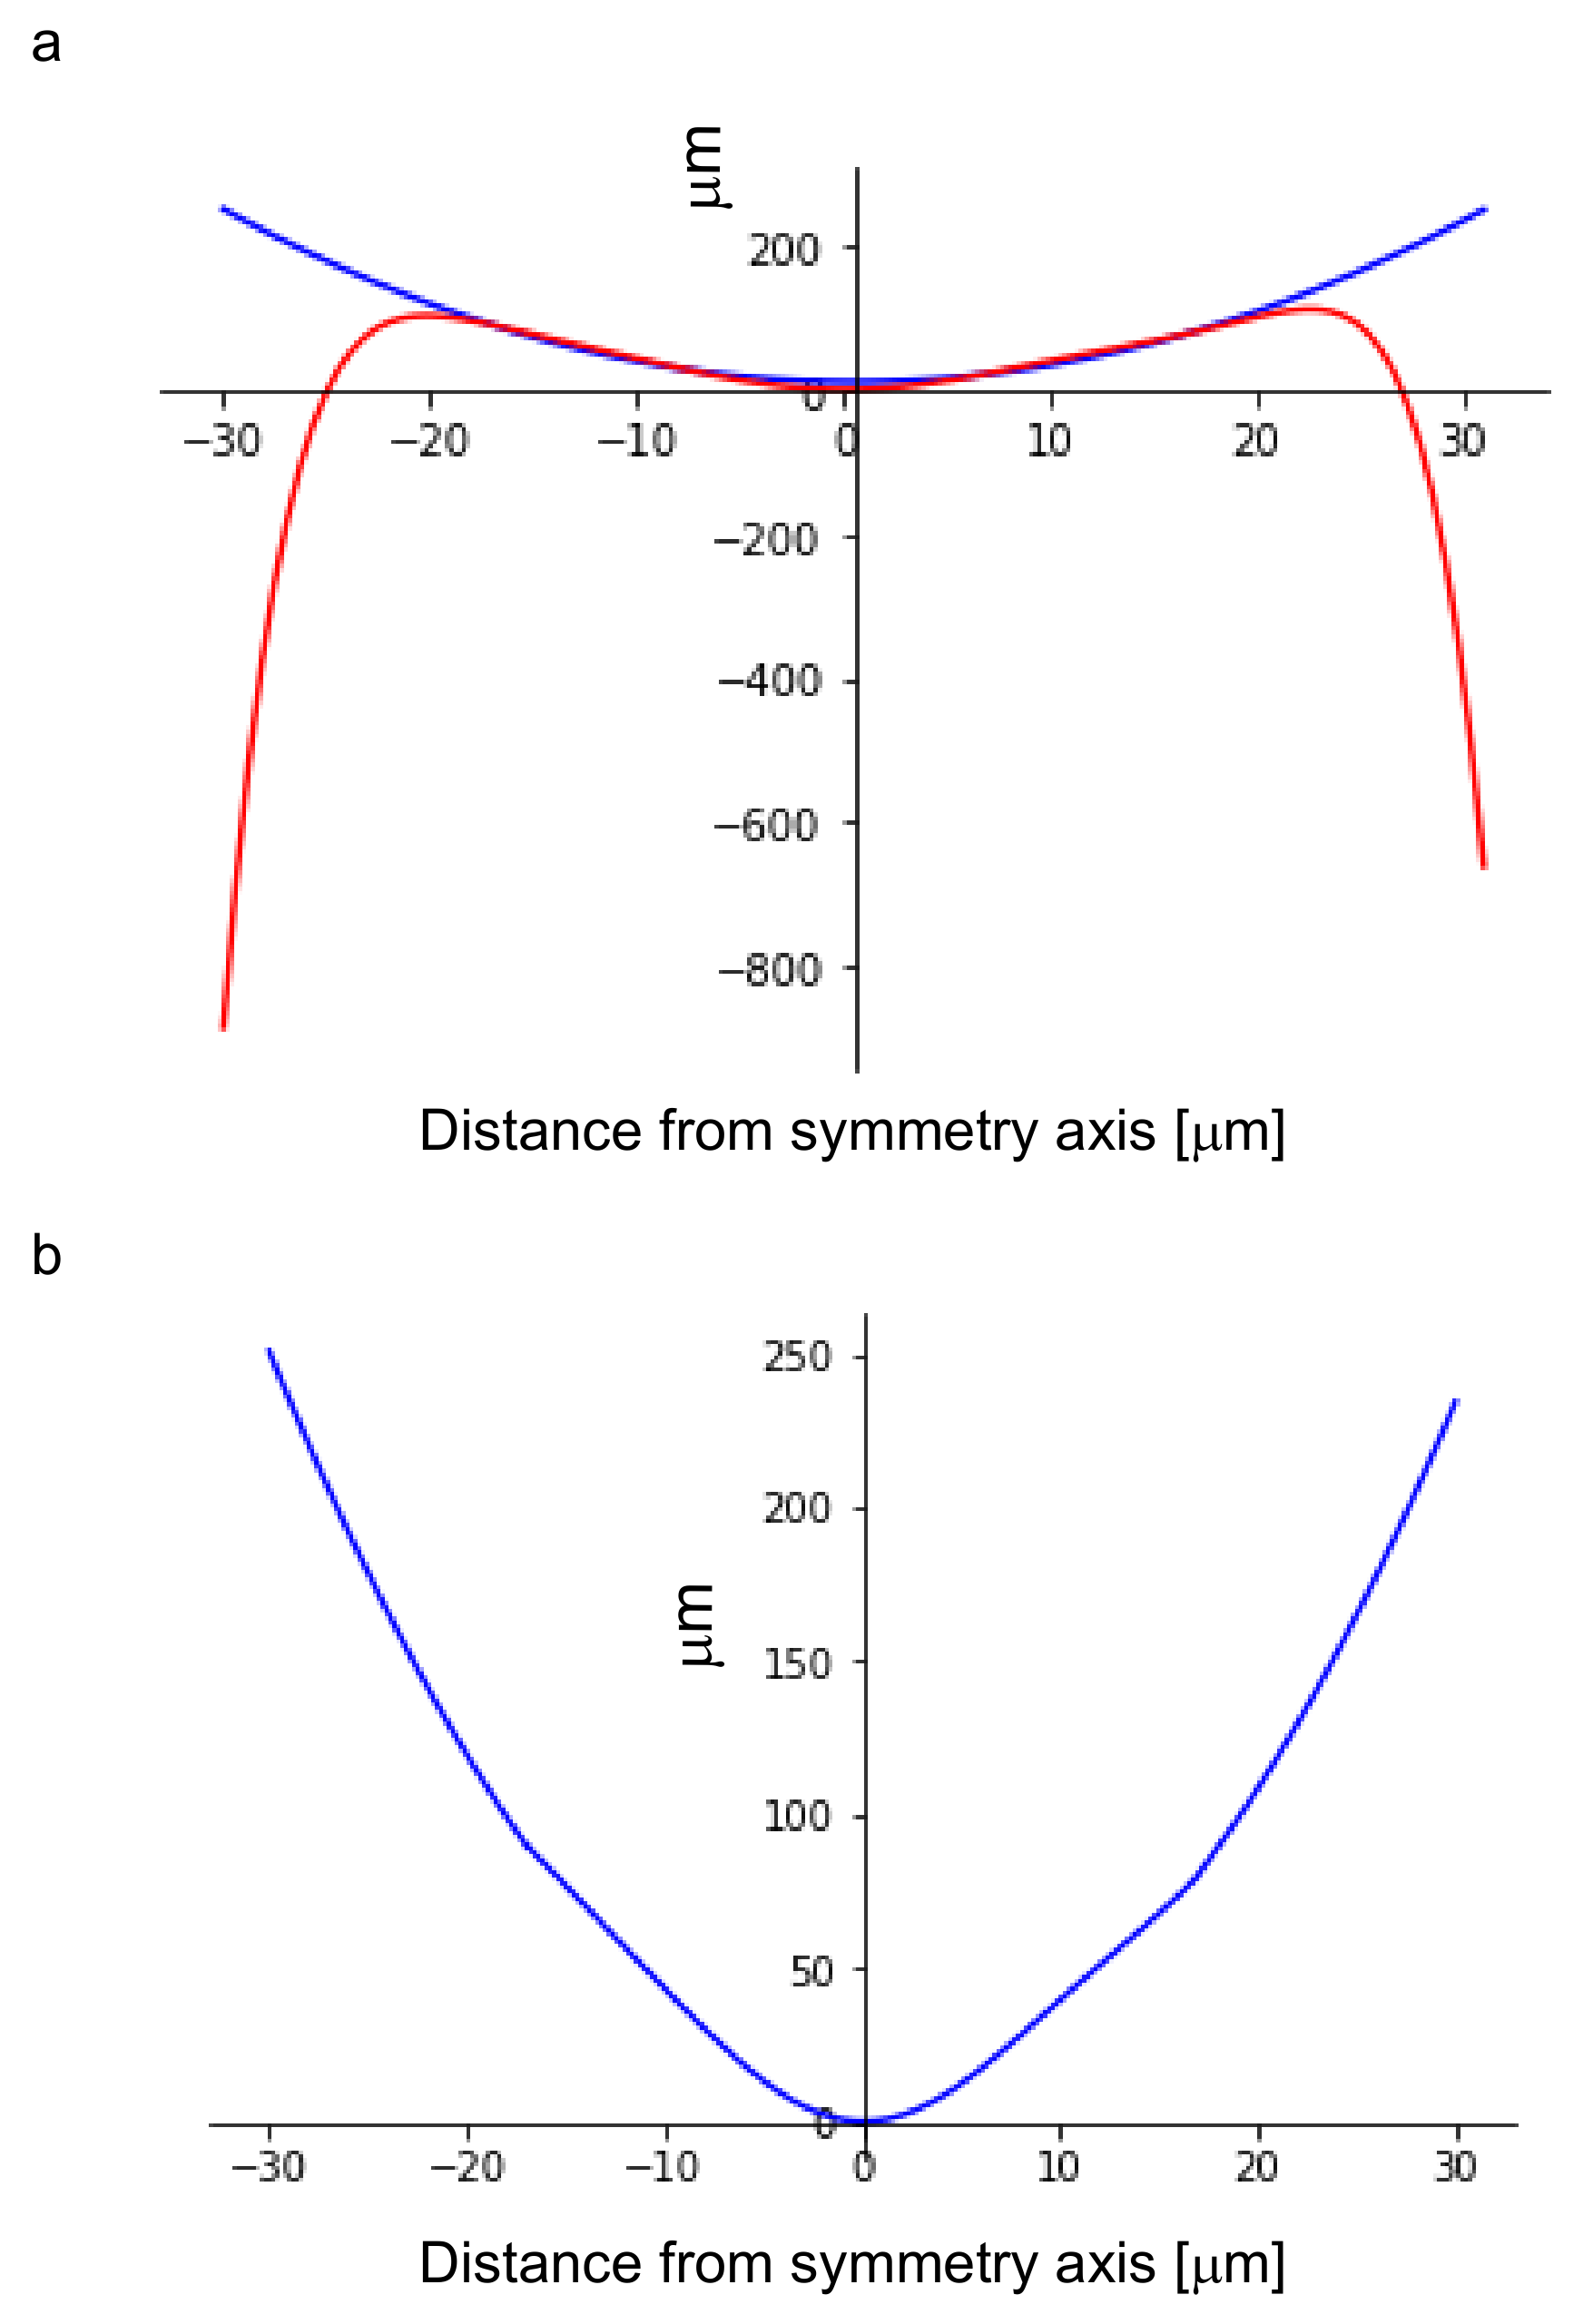
2.3. Modelling of the Undeformed Shape of W Microneedles

Four experimental pictures of W microneedles ( 75 μ m) were chosen before both contact and insertion within peripheral nerves and used to model the mean shape of the undeformed tip. More specifically, the ending part of each microneedle was considered for a length of about 100 μ m from the tip end and for a width of 30 μ m from the symmetry axis. ImageJ [66], through the plug-in NeuronJ, was used to provide a semiautomatic track of the microneedle profile and to extract the numerical coordinate of the microneedle shape from the experimental images. To standardize all images, they were further elaborated through a Python custom program to align the microneedles’ symmetry axis with the vertical one and to center each profile with respect to the theoretical contact point (that is the lowest point of the experimental profile was superimposed to the origin of the axes). All the four images were used to achieve a single cluster of points, which was fitted to provide the mean shape of the intact tip of microneedles.
In particular, a closed and limited set A = [ x i , x f ] was considered, where x i and x f were the initial and final abscissas whose the experimental shape was the image. Polynomial candidate functions of n degree P t h n : A B R + , were tested to fit the cluster of experimental points for each x A , and their suitability was assessed through the value of the standard statistic R 2 , for increasing value of the maximum power n. In addition, to combine the features of polynomials of different powers, piecewise polynomial candidates were considered and compared to simple polynomial candidates in order to assess the best way to match the undeformed shape of the microneedle tips. In this case, the limited and closed sets A 1 = [ x i , x m ] , A 2 = [ x m 1 , x m 2 ] , A 3 = [ x m 2 , x f ] , where, x f > x m 2 > x m 1 > x i , were considered together with the functions P t h 1 n 1 : A 1 B 1 R + , P t h 2 n 2 : A 2 B 2 R + , P t h 3 n 3 : A 3 B 3 R + , where B 1 , B 2 , B 3 R + were the images of A 1 , A 2 , A 3 , while A 1 A 2 A 3 = A , and n 1 , n 2 , n 3 N were the maximum powers of the fitting functions, respectively. In the following, a theoretical candidate function matching the mean experimental microneedle shape was written as
P t h n 1 , n 2 , n 3 ( x ) = P t h n 1 f o r x i x < x m 1 P t h n 2 f o r x m 1 x x m 2 P t h n 3 f o r x m 2 < x x f
to specify the power of the three branches of the piecewise function, whereas, when a single polynomial candidate function of power n was used to reproduce the experimental mean shape of the microneedle, the condition n 1 = n 2 = n 3 = n was imposed.

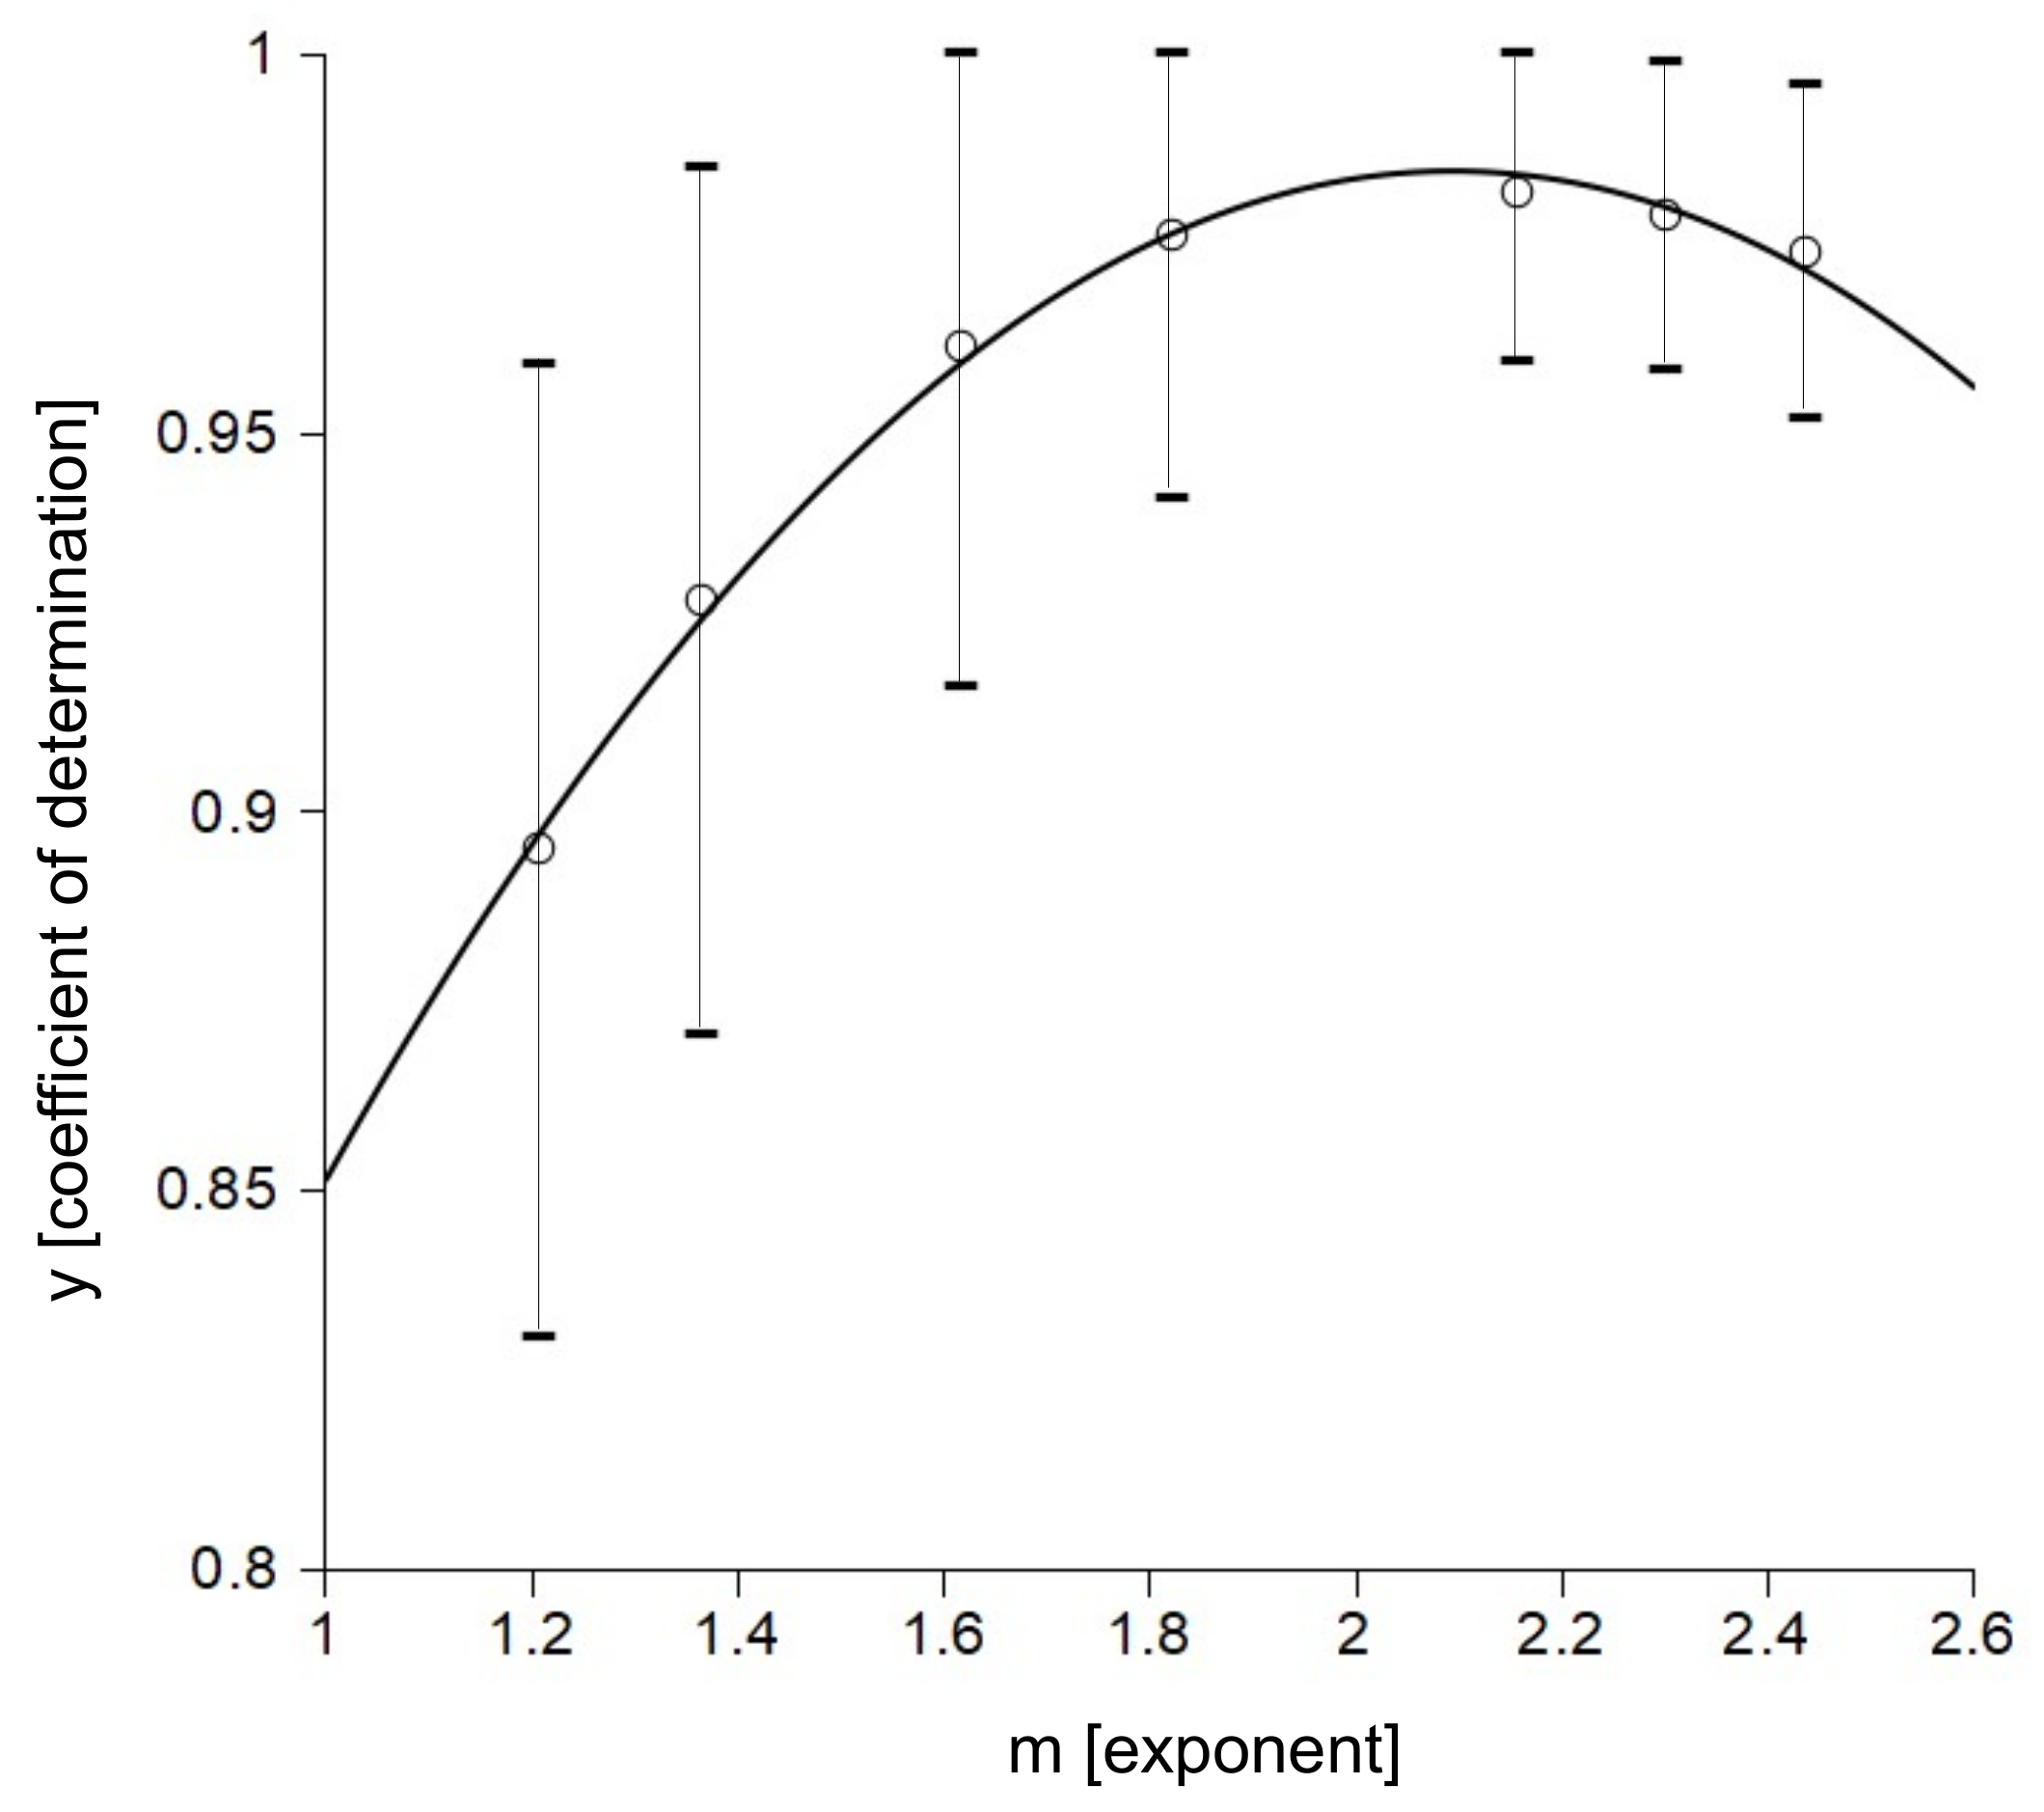
2.4. Quantification of Microneedle Tip Angle and Force-Angle Experimental Relationship

The opening angle of the microneedle tip was, then, calculated as
γ = π a t a n ( λ 1 ) a t a n ( λ 2 ) ,
where λ 1 = l i m x x m 1 + x P t h n 1 , n 2 , n 3 ( x ) and λ 2 = l i m x x m 2 x P t h n 1 , n 2 , n 3 ( x ) were the slope of the tangent lines to the theoretical profile in x m 1 and x m 2 points, respectively. Moreover, insertion forces to enter in vivo peripheral nerves and in vitro specimens for intact W microneedles with the same tip angle (18 degrees) [48] were used to perform a quantitative comparison. These groups were statistically compared through the Wilcoxon-Mann-Whitney test to check significant differences. Thus, literature data [48] were used to quantify the insertion forces of W microneedles with different tip angles ranging between 15 and 24 degrees. Here, an experimental correlation between the mean tip angle and the mean insertion force < F i > was provided:
< F i > = K F < γ > + q ,
where K F R was the slope and q R was the constant term of a straight line, whereas < γ > was the mean angle of the tip. Again, a further relationship was investigated for microneedles able to enter the peripheral nervous tissue, avoiding the buckling of their main shaft. Indeed, starting from previous literature [47,48], a safety factor 2 was chosen; thus the minimum force to bear was set to be twice the mean puncture force [48]. Therefore, starting from the Euler theory of the first critical buckling load, the minimum diameter needed to effectively insert the microneedle was written as
d ( F i ) = L e 128 < F i > π 3 E .
Coupling Equations (7) and (8) the following experimental relationship between opening angle and minimum diameter to avoid buckling was written as
d ( γ ) = L e 128 ( K F < γ > + q ) π 3 E ,
where E = 411 GPa was the Young modulus of the W, and L e was the equivalent length of the microneedle accounting for the boundary conditions. More specifically, each microneedle was modelled as a circular cylinder with diameter d and with pinned or fixed ends. Here, the combinations pinned-pinned, pinned-fixed, and fixed-fixed ends were explored; then the equivalent length L e in Equation (9) was 1 , 0.7 , 0.5 times the length of the microneedle shaft, respectively.
Alternative tip geometries could be used to perform insertions. In particular, W microneedles with a flat tip were described in the literature [67], together with the ratio between the puncture force with flat and sharp tips. Therefore, an approximated assessment of the insertion force for W microneedles with a flat tip was provided through Equation (8), where < F i > f l a t = ω < F i > , and ω ranged between 18.8 and 25.6 for the puncture of a single perinerium, whereas it ranged between 5.4 and 9.7 for the puncture a single epineurium.

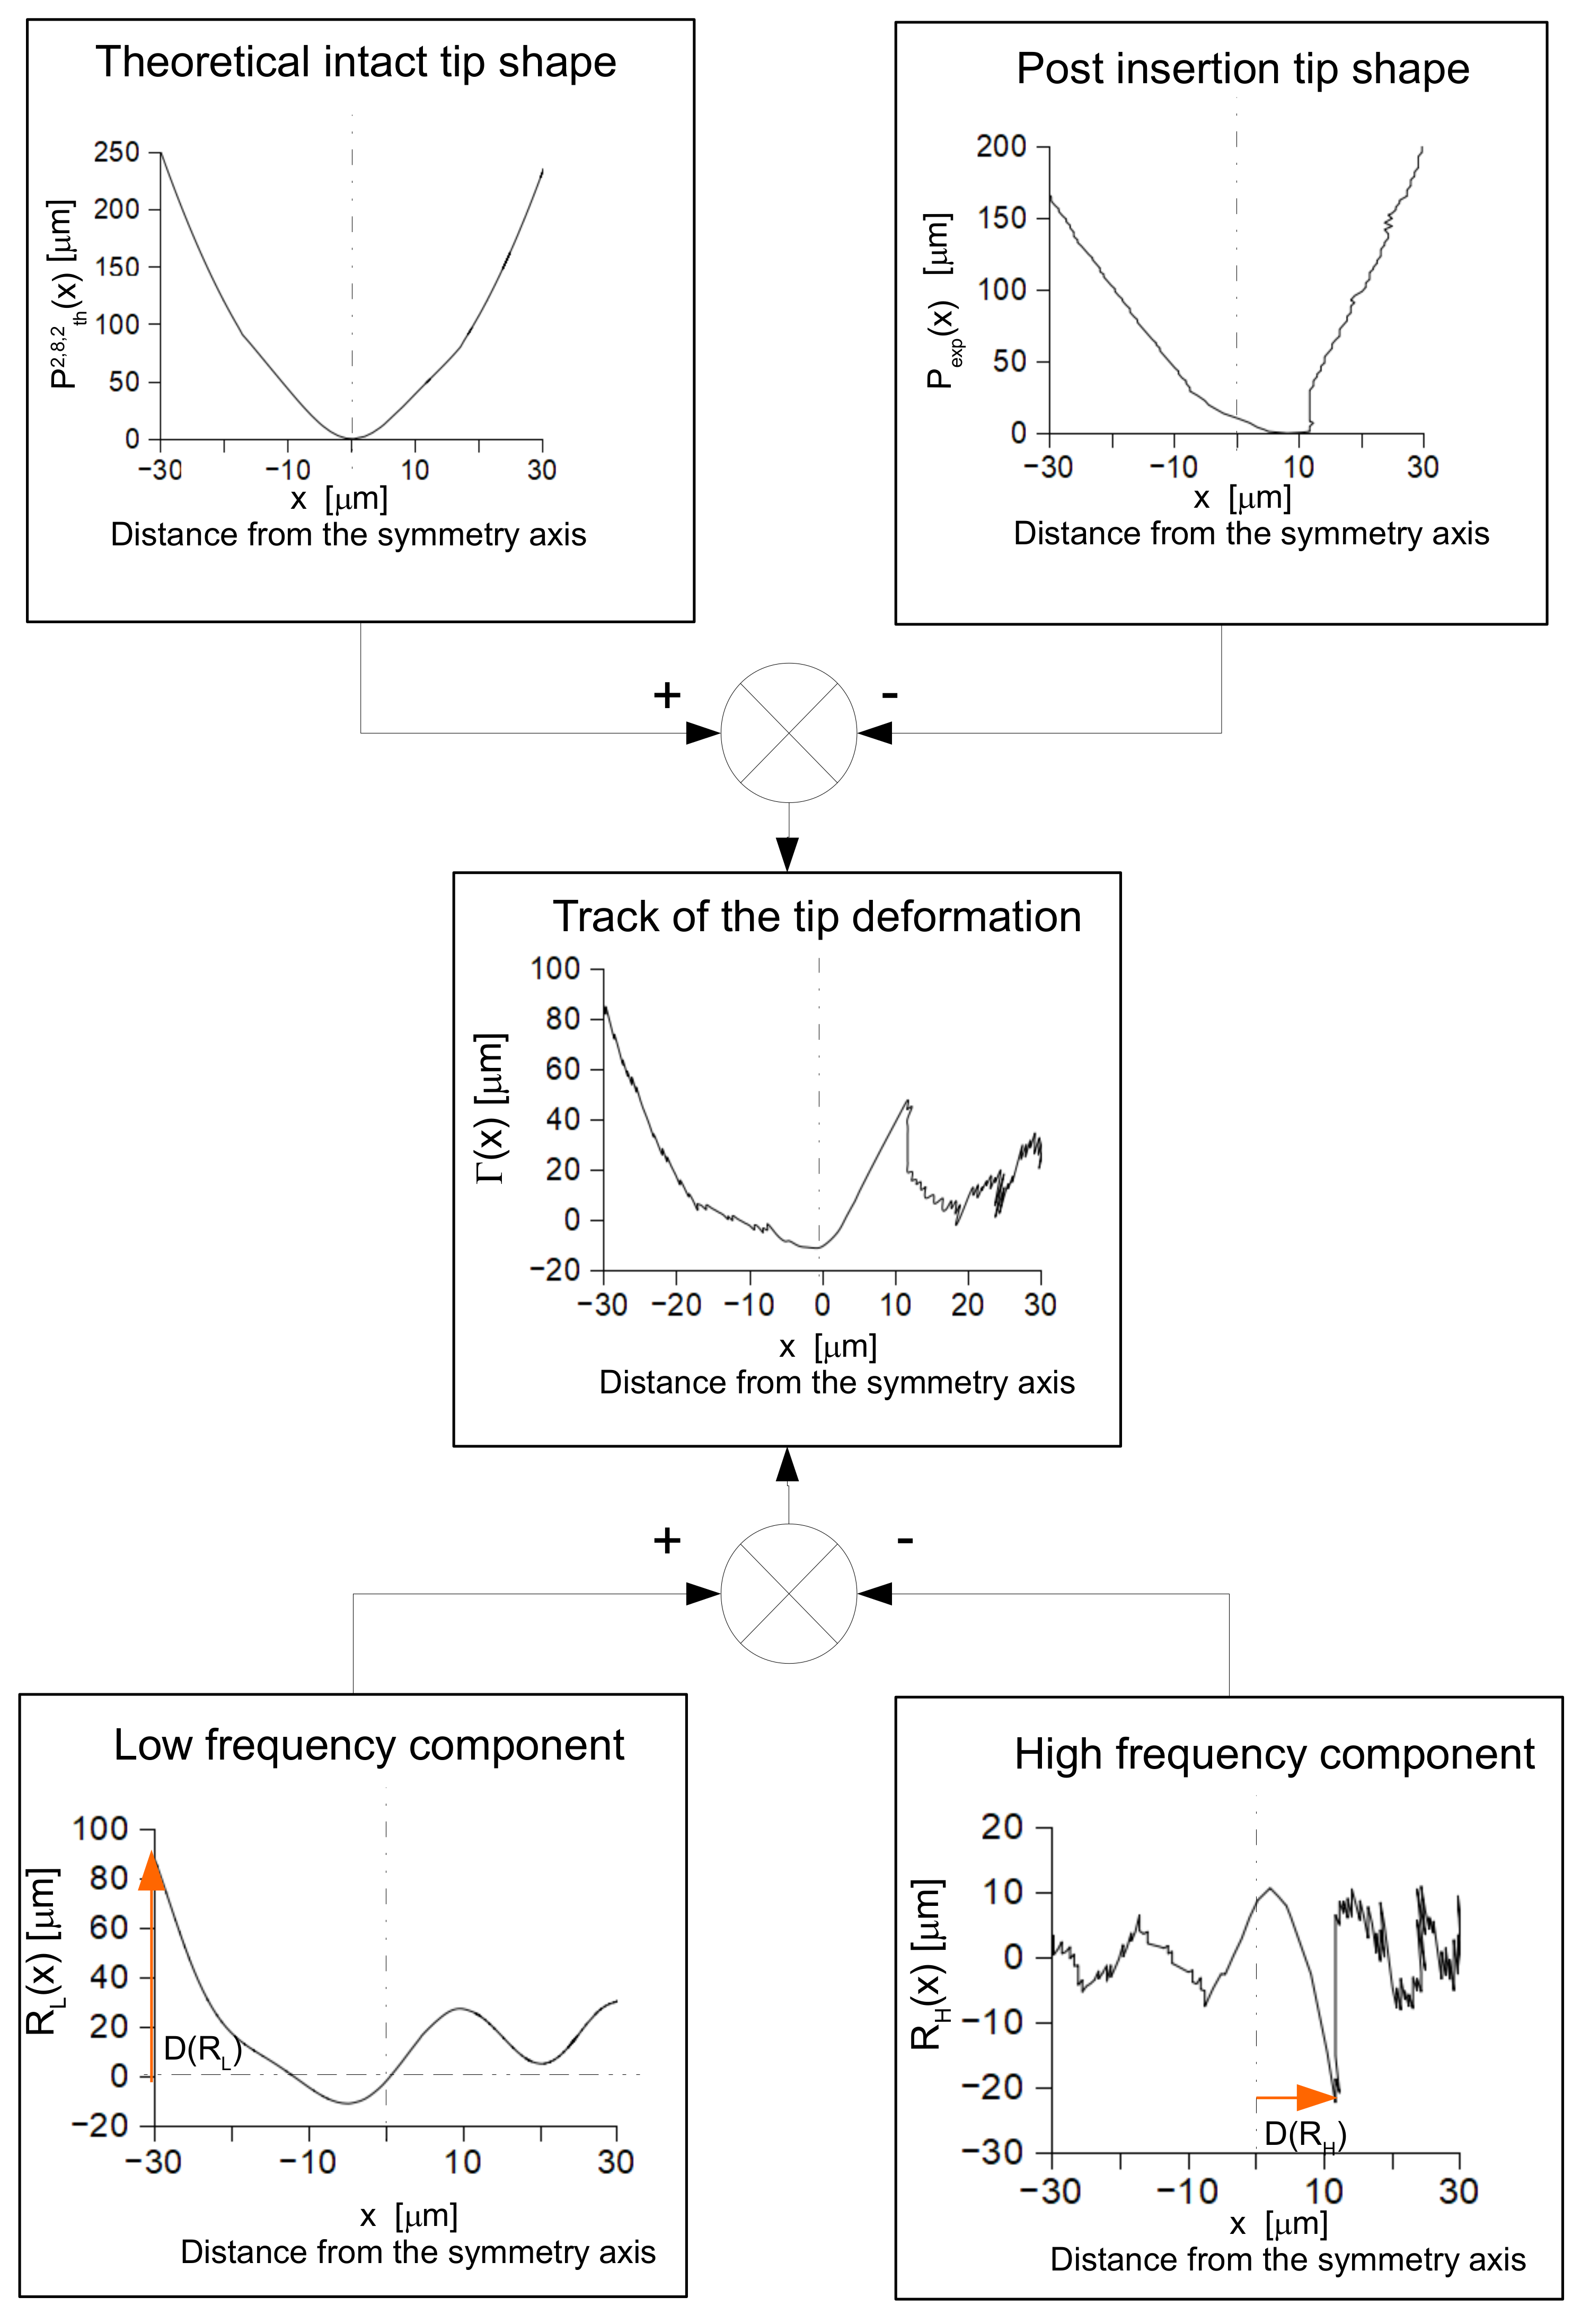
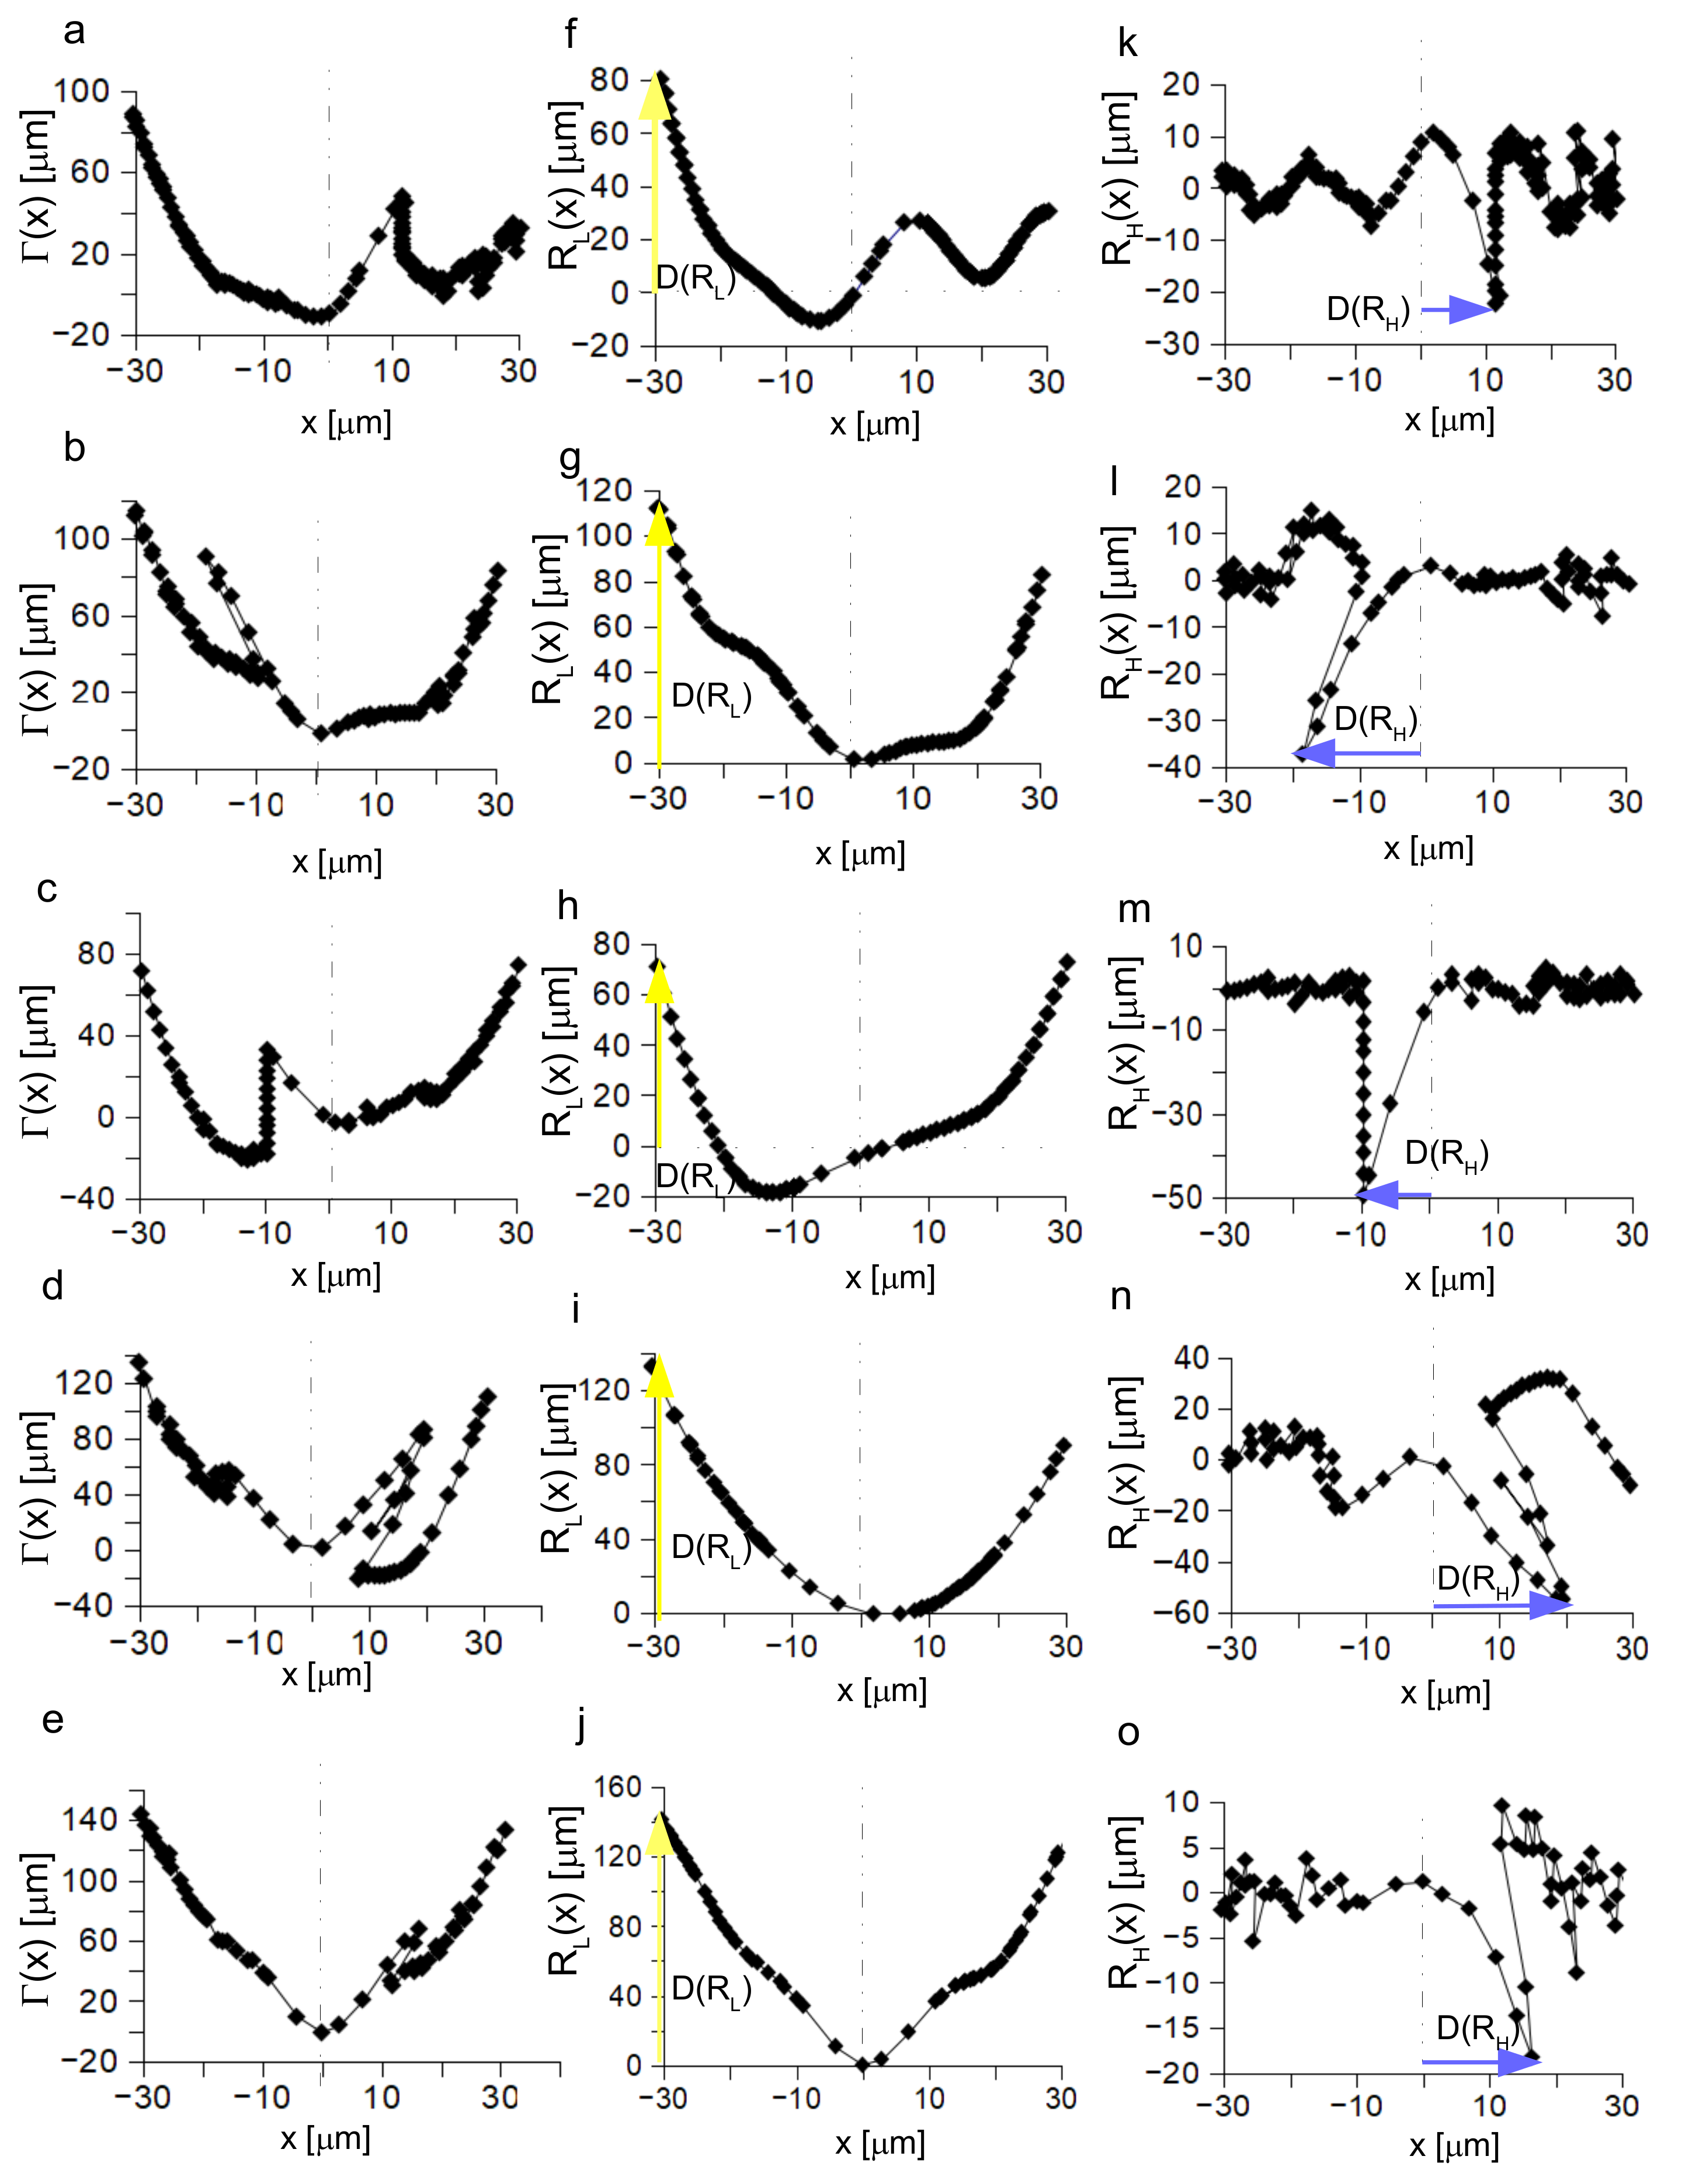
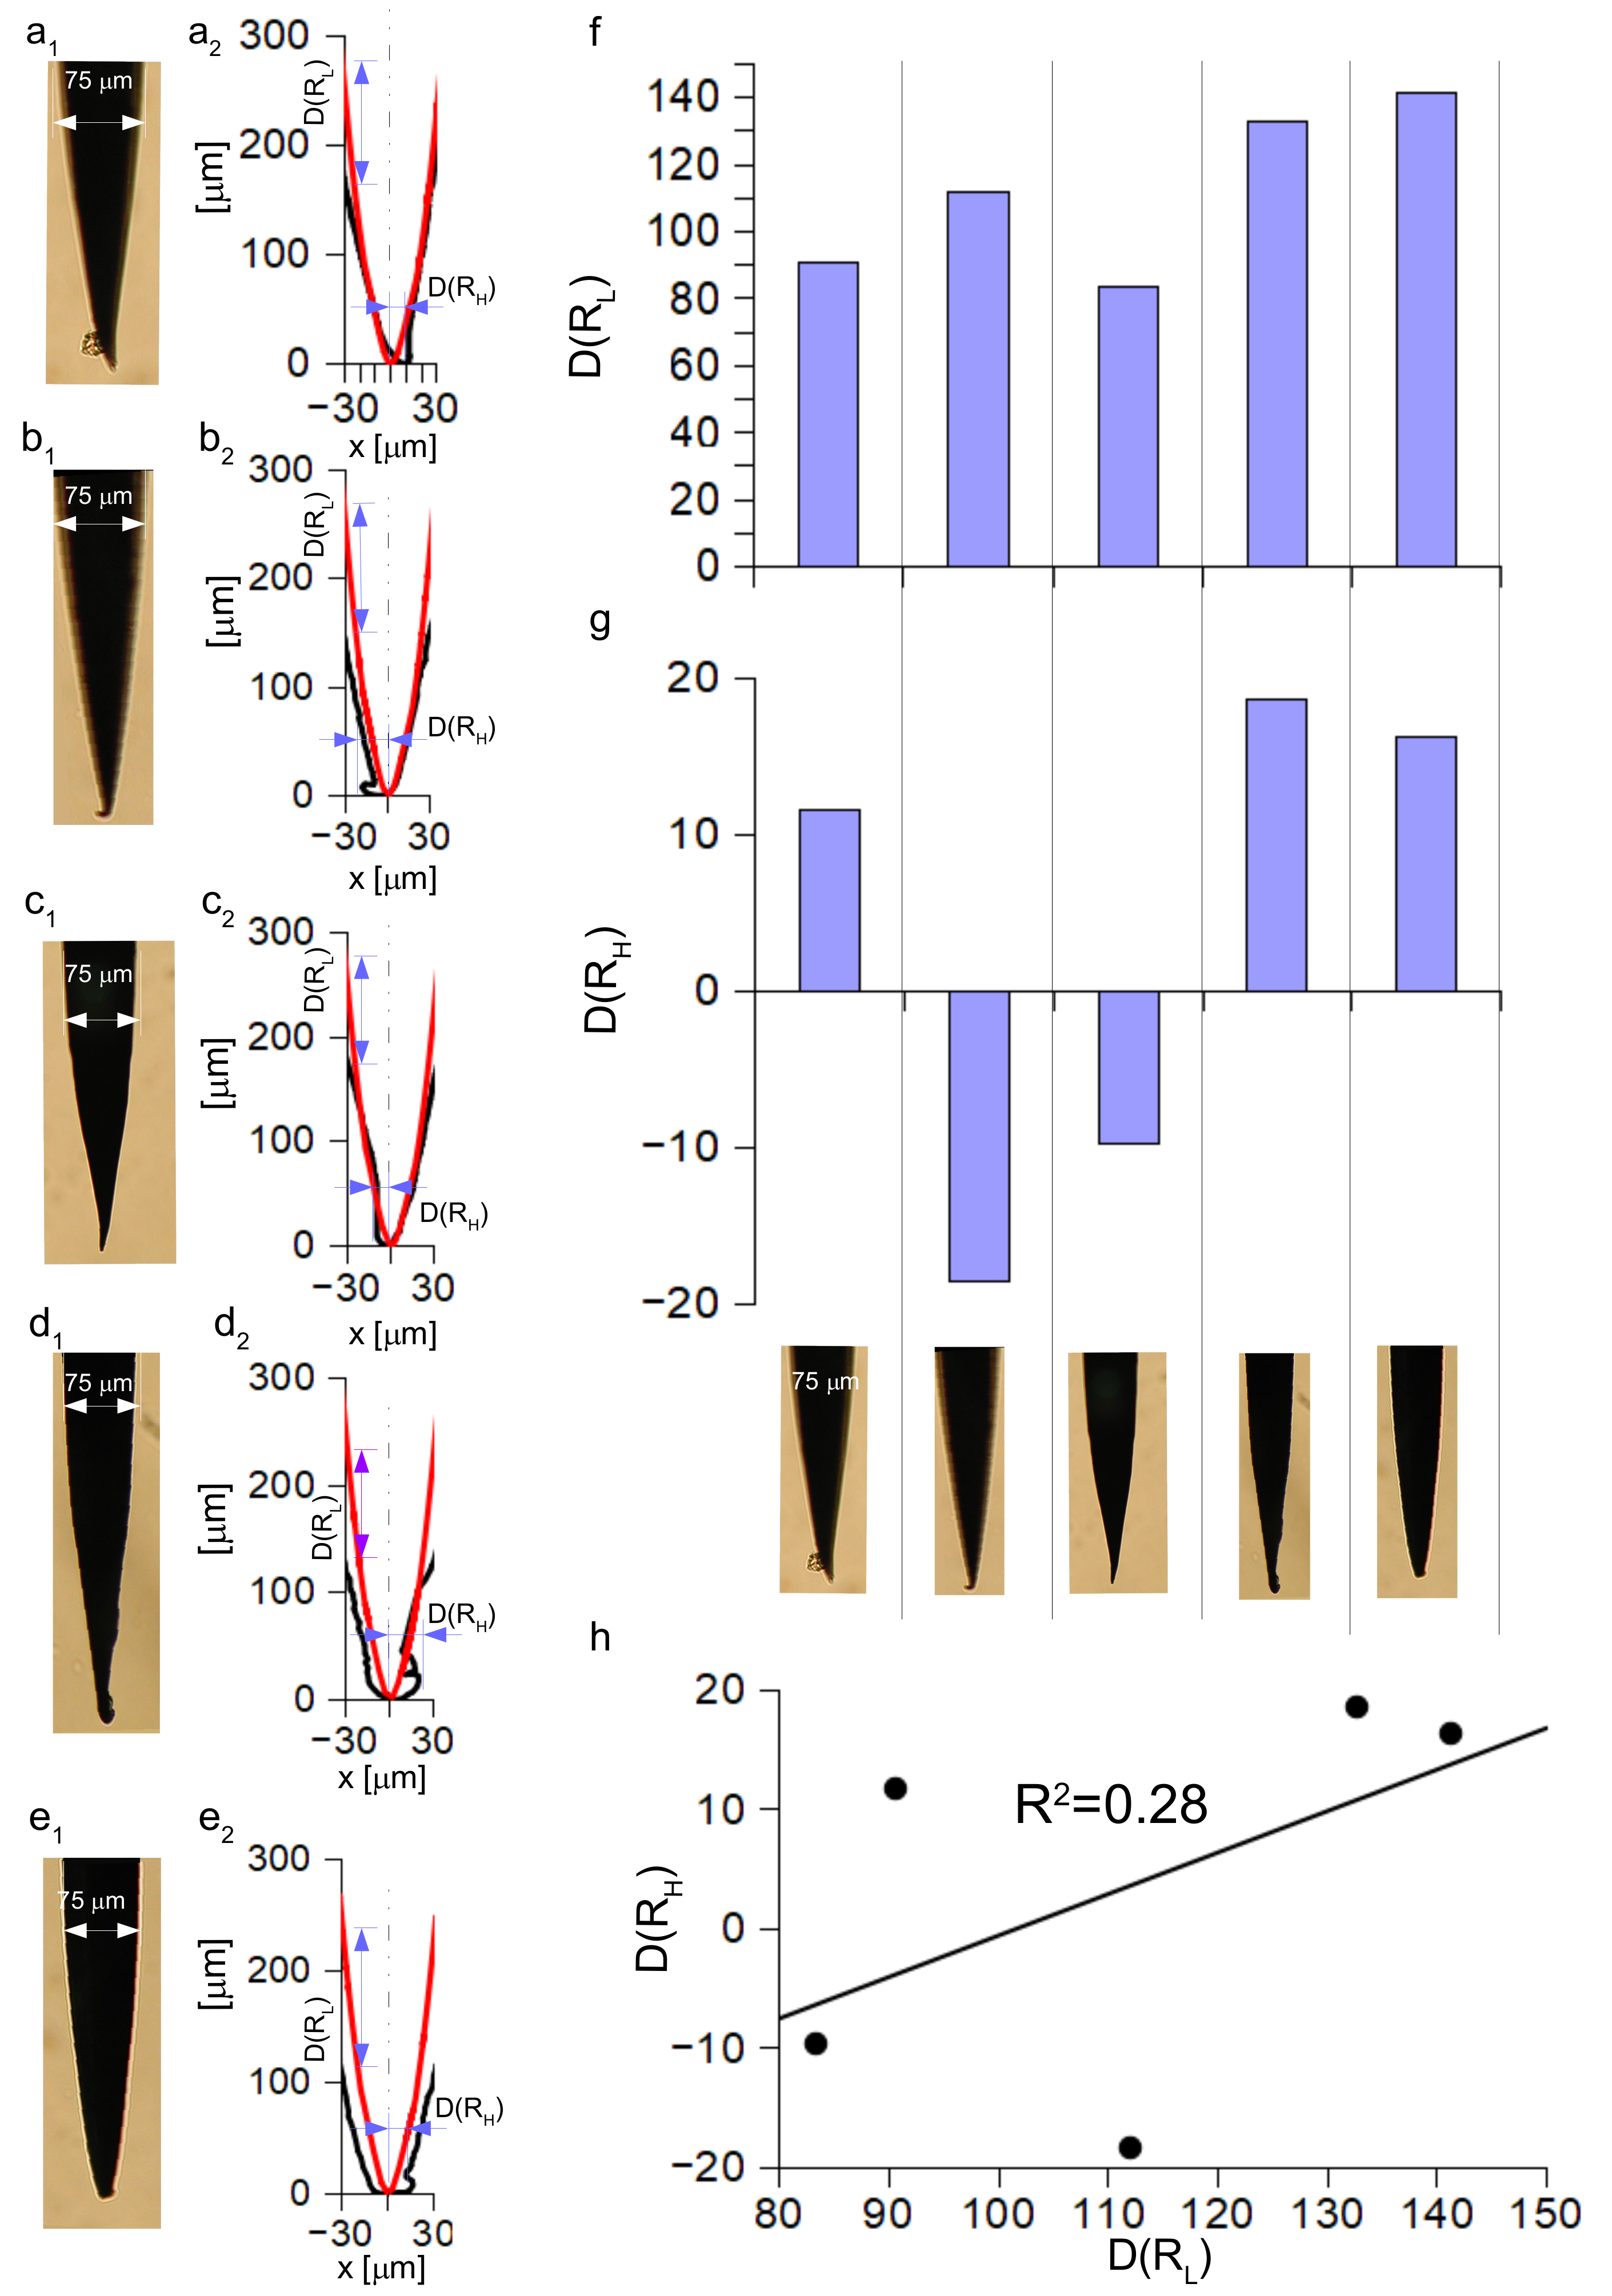
2.5. Investigation and Quantification of Post Insertion Shape Changes

Similarly, the post insertion shapes of microneedles were numerically acquired through the elaboration of 5 experimental images. The geometric shape of each image was extracted by using ImageJ [66], NeuronJ plugin. These files were further elaborated through a Python custom program in order to center and rotate the microneedles’ shape with respect to the image barycenter, providing the standardization of all experimental post insertion shapes. For each microneedle, the relationship between the theoretical shape of the intact tip P t h n 1 , n 2 , n 3 ( x ) and the post insertion geometrical shape P e x p was approximated as
P t h n 1 , n 2 , n 3 ( x ) P e x p ( x ) = Γ ( x ) R L ( x ) R H ( x ) ,
where Γ ( x ) was the track of the tip deformation, accounting for the difference between the theoretical shape and the experimental one, and R L ( x ) C ( 15 ) , R H ( x ) C ( 0 ) were the low-frequency and the high-frequency components of Γ ( x ) [68], respectively. In addition, C ( 0 ) was the set of the continuous functions, and C ( 15 ) was the set of the continuous function differentiable 15 times. In Figure 2, a scheme of the procedure used in this work is shown. The measured post insertion tip shape was compared to the theoretical one and the track of the geometrical tip change was achieved by subtracting the measured shape from the theoretical one. The origin of the abscissas (0 value) described the theoretical position of the symmetry axis of the intact tip, and the contact point between the microneedle and the tissue was chosen as the common point for the two shapes. The Γ ( x ) function was then expressed as the difference between low- and high-frequency contributions ( R L ( x ) and R H ( x ) , respectively see Figure 2).
The difference between post insertion shapes and the initial mean shape of intact microneedles was quantified through the two indices that were not dimensional:
D ( R L ) = m a x x A { R L ( x ) } δ
and
D ( R H ) = X m i n [ R H ( x ) ] δ ,
where X m i n [ R H ( x ) ] = { x : R H ( x ) = m i n x A { R H ( x ) } } , and δ = 1 μ m was a dimensional constant and A = [−30 μ m, +30 μ m]. More specifically, D ( R L ) measured the maximum amplitude of the R L ( x ) function, and D ( R H ) measured the distance of the peak of the R H ( x ) function from the origin of the abscissas.

3. Results

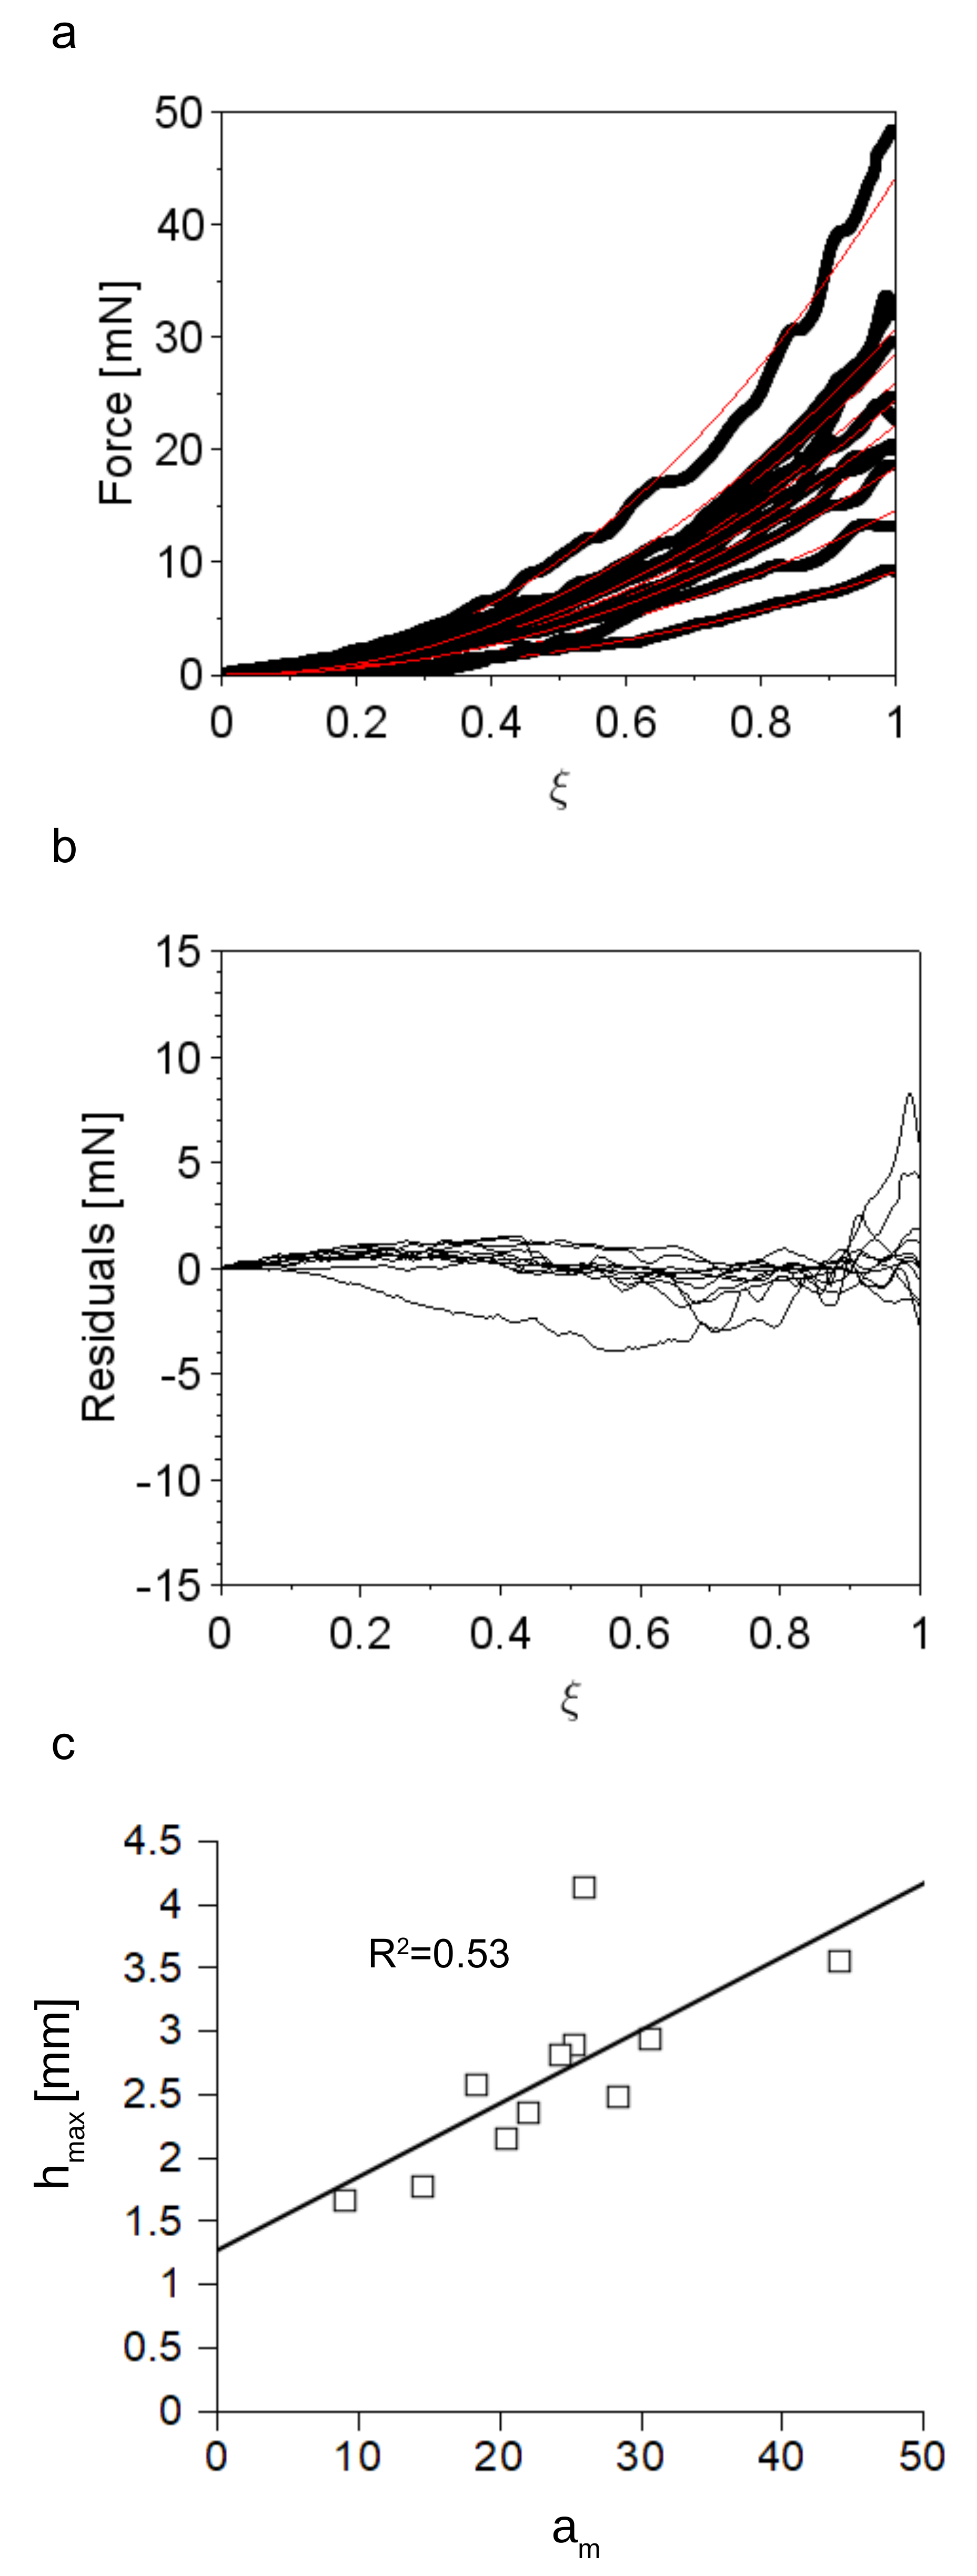
3.1. Accuracy of the Insertion Force Model of W Microneedles into In Vivo Peripheral Nerves

The Oliver-Pharr approach [64,65] was tested to fit experimental data through Equation (1). The evolution of the interaction force between tungsten microneedles and in vivo peripheral nerves was investigated for increasing values of the normalized indentation depth ξ (see Figure 1). Equation (1) was tested for k = 3 , 7 , 13 , 17 , and the results are shown in Figure 3a,d,g,j, whereas the residual plots are shown in Figure 3b,e,h,k. For k = 3 , 7 they slightly exceeded the range 5 , 0 mN up to ξ = 0.9 , and for k = 13 , 17 the difference between experimental values and theoretical predictions was fully within the range 5 , + 2 mN up to ξ = 0.9 . On the contrary, for ξ > 0.9 the residuals increased and for ξ 1 exceeded the range 0, + 10 mN for k = 3 , 7 and the range 2 , + 5 mN for k = 13 , 17 . As shown in Figure 3c,f,i,l, the increase of the m parameter resulted in a different degree of correlation between the maximum indentation depth h m a x and the value of the a m coefficient in Equation (1). In this case, the values of the R 2 statistic (between h m a x and a m ) ranged between 0.499 and 0.543 for increasing values of m.
The variation of the accuracy of the Oliver-Pharr model is shown in Figure 4 for increasing values of m. The average values of the y variable (i.e., y = R 2 was the standard R 2 statistic computed when experimental data were fitted through Equation (1)) had a non-monotonic evolution, whereas the errors (±one standard deviation) tended to decrease for increasing values of m. A suitable functional form for Equation (3) was found as
Φ ( y , m ) = y a m 2 b m c = 0 .
Equation (13) was able to effectively match data ( R p 2 = 0.99 ) for the values of a , b , c listed in Table 1.
Figure 3. Investigation of the accuracy of Equation (1) to match experimental data as a function of m (top row). In the first row, experimental curves were fitted with values of k = 3 , 7 , 13 , 17 (see sub-figures a,d,g,j, respectively). In the second row (sub-figures b,e,h,k), the resulting residuals have been calculated. In the third row, the correlation between the maximum indentation depth and the value of the coefficient a m has been investigated (sub-figures c,f,i,l).
Applsci 12 08938 g003
Figure 4. Variation of the accuracy of the Oliver-Pharr model with the value of m. The average accuracy to fit experimental data is plotted as a function of the value of m (black circles, error bars = ± one standard deviation). The function Φ ( R 2 , m ) = 0 (solid line) is able to effectively match experimental data ( R p 2 = 0.99 ) as a function of the value of the exponent m. It can be used to explicitly predict the best value of m (i.e., abscissa corresponding to the vertex of the parabola).
Applsci 12 08938 g004
Table 1. Φ ( y , m ) numerical coefficients.
CoefficientValue(95% Confidence Interval)
a−1.024 × 10 1 ( 1.163 , 0.885 ) × 10 1
b + 4.349 × 10 1 ( + 3.823 , + 4.876 ) × 10 1
c + 5.224 × 10 1 ( + 4.747 , + 5.701 ) × 10 1
Then Equations (3) and (4) were used together with the condition 2 Ψ ( y , m ) m 2 < 0 to find an expression for the optimal value of m, which was written as
m m = 1 + Ω 2 ,
where the optimized value Ω = 10.546 , which was a generalization of the k values of Equation (2) for real values, resulted in m m = 2.124 ( 95 % confidence interval: 1.643–2.755). The optimized value m m was tested to match the experimental dataset through Equation (1). In particular, the evolution of the interaction force between microneedles and in vivo nerves was investigated with the increase of the normalized indentation depth (Figure 5a). In this case, the numeric residuals oscillated within the range 5 , + 9 mN (Figure 5b), and the degree of correlation between h m a x and a m in Equation (1) was quantified through R 2 = 0.53 , as shown in Figure 5c.

3.2. Tip Shape of Intact Microneedles

Different candidate functions were tested to model the tip shape of intact microneedles (see Figure 6a). More specifically, a 2-th degree polynomial candidate function was chosen, and expressed as:
p 2 ( x ) = p 22 x 2 + p 21 x + p 20
where p 22 , p 21 , p 20 R were numerical coefficients.
This candidate function was able to match experimental data ( R 2 = 0.94 ), with the numerical coefficients listed in Appendix A (Table A1), only for a limited range of distances from the symmetry axis (i.e., 5–20 μ m on the left and on the right of the symmetry axis), whereas the experimental shape was not exactly tracked close to the symmetry axis (Figure 6b). As a consequence, an 8-th degree polynomial function was tested for distances up to 20 μ m from the axis of symmetry on both sides. In particular, it was expressed as
p 8 ( x ) = p 88 x 8 + p 87 x 7 + p 86 x 6 + p 85 x 5 + p 84 x 4 + p 83 x 3 + p 82 x 2 + p 81 x + p 80 .
where all numerical coefficients p 8 i R , for i N ranging between 0 and 8. This function was able to model experimental data ( R 2 = 0.98 ) with the numerical coefficients listed in Appendix A (Table A2). Nevertheless, this candidate function (see Figure 6c) failed to closely reproduce the experimental tip shape for a distance greater than 20 μ m (see Figure 7a). Therefore, a piecewise function was built starting from the two previously described candidate functions and expressed as
P 2 , 8 , 2 ( x ) = p 2 ( x ) f o r x i x < x m 1 p 8 ( x ) f o r x m 1 x x m 2 p 2 ( x ) f o r x m 2 < x x f ,
where x i = 30 μ m, x m 1 = 16.967 μ m, x m 2 = 16.676 μ m, and x f = 30 μ m, respectively (see Figure 7b).

3.3. Quantification of the Microneedle Tip Angle and Its Relationship to the Insertion Force

The tip angle of the microneedles was calculated starting from the mean profile of intact microneedles through Equations (17) and (6), where λ 1 = l i m x x m 1 + x P t h 2 , 8 , 2 ( x ) and λ 2 = l i m x x m 2 x P t h 2 , 8 , 2 ( x ) . From these equations, we obtain results showing that < γ > 18 degrees. In addition, the experimental value of the maximum insertion force for in vivo nerves (and for < γ > 18 degrees) resulted in 24.573 ± 10.761 mN (mean value ± standard deviation). The previous set of insertion forces was compared to the literature values [48] related to the insertion of similar microneedles into in vitro specimens (see Figure 8a), showing that the difference between the two set of forces was not statistically relevant (Wilcoxon-Mann-Whitney test p = 0.58 ). As a consequence, assuming the same phenomenon for all the tip angles ranging from 15 to 24 degrees [48], Equation (7) resulted in < K F > = 6.307 mN/degree and < q > = 86.888 mN ( R 2 = 0.93 , see Figure 8b). This experimental correlation between the force of insertion and the tip angle was used to provide, through Equation (9), the minimum diameter needed to avoid buckling following Euler’s theory. In particular, a safety coefficient of 2 was used to provide structures able to withstand a maximum force which is twice the maximum mean force of insertion [48]. To assess the effect of the boundary conditions, the combinations pinned-pinned, pinned-fixed, and fixed-fixed ends, were studied to provide the minimum diameter size needed to avoid the failure of microneedles for critical buckling load (Figure 8c). Finally, starting from Equation (8) together with experimental data of puncture force in epineurial and perineurial sheets [67], an assessment of the theoretical diameter size of 15 mm long W microneedles with a flat tip was provided in Figure 8d. In particular, a combination between minimum and maximum puncture forces and different boundary conditions (pinned-pinned, pinned-fixed, fixed-fixed ends) is shown both for epineurial and perineurial layers. More specifically, to enter the epineurial layer the median values of the microneedle diameters were about 120 μ m, 135 μ m, and 165 μ m for pinned-pinned, pinned-fixed, and fixed-fixed ends, respectively (Figure 8d, top). Similarly, to effectively puncture the perineurial layer the assessed median values of the diameter size were 155 μ m, 185 μ m, and 220 μ m for pinned-pinned, pinned-fixed, and fixed-fixed ends, respectively (Figure 8d, bottom).

3.4. Analysis of the Post Insertion Shape

After defining the theoretical shape of the intact microneedle in Equation (17), all the geometrical changes due to the insertion procedure were quantified with respect to this standard configuration (see Figure 2). In particular, the track of the geometrical deformation was obtained as the difference between the post insertion and the theoretical microneedle tip shape, resulting in the function Γ ( x ) , described through Equation (10) (see Figure 9a–e). This function was further split in two different parts: a low frequency contribution R L ( x ) , which was modelled through smooth 15-th degree polynomials in the range 30 , 30 μ m ( R 2 = 0.9976 , 0.9957 , 0.9958 , 0.9944 , 0.9981 , Figure 9f–j), and a high frequency jagged and irregular contribution R H ( x ) , as shown in Figure 9k–o. In addition, in Figure 9f–j the values of the metric D ( R L ) , defined in Equation (11), were indicated through the length of the yellow arrows, whereas in Figure 9k–o the values of the metric D ( R H ) , defined in Equation (12), were indicated through the length of the blue arrows. Nevertheless, to provide a physical meaning to the previous metrics, the experimental images were presented together with the comparison between the post insertion and the intact shapes of the microneedle tips. Indeed, in Figure 10a1–e1, the five experimental images of the W microneedle tips were shown with a metric bar, and in Figure 10a2–e2, the comparison between the intact reference profile of the tip (in red) and the post insertion profiles (in black) was presented. The values of both metrics D ( R L ) and D ( R H ) were also inserted in the plots in order to visualize their physical relationship with deformed shape of post insertion tips. More specifically, in Figure 10f the values of the D ( R L ) metric were compared in a bar plot (all the values are reported in Appendix A, Table A3 first column), as well as in Figure 10g the values of the D ( R H ) metric (all the values are in Appendix A, Table A3 second column). The length of the bars was related to the amount of folding, and their signum was related to the direction of the folding of the extreme section of the post insertion microneedle tips: the signum “−” indicated that the tip folded up toward the left, and the signum “+” indicated a folding toward the right. The reference (0 value) was the position of the symmetry axis of the theoretical intact tip. In particular, this metric was able to measure how the post insertion tip folded up toward the right, up to 11.63 μ m in the first specimen, toward the left up to 18.46 μ m in the second specimen. Similarly, this metric measured that the deformed tip folded up toward the left, up to 9.47 μ m, in the third specimen, whereas it folded up toward the right up to 18.59 and 16.26 μ m in the fourth and fifth specimens (see Figure 10g). Finally, the value of the correlation between D ( R L ) and D ( R H ) was computed through the coefficient of determination and resulted in R 2 = 0.28 , as shown in Figure 10h.

4. Discussion

Neural interfaces are used to connect the nervous system to high-tech robotic and computer interfaces. Although different strategies are currently implemented to enhance neural connections [69,70,71,72,73] through regenerative interfaces [74], the insertion of intraneural interfaces still remains a quite good trade-off between invasiveness and selectivity [74]. However, to minimize the stiffness mismatch between peripheral nerves and neural interfaces, soft materials are currently used to produce their main structural parts. However, soft materials are able to provide effective connections, and most of them are not mechanically stable during implantation. As a consequence, tungsten microneedles are used to insert soft neural interfaces into peripheral nerves, because they are able to pierce the nervous tissue because of their high stiffness. In this work, the first phase of the interaction between W microneedles and in vivo peripheral nerves (i.e., up to the piercing of the nerve surface) was modelled as an indentation through the standard Oliver-Pharr framework [64,65], expressed through Equation (1). This approach, which was theoretically derived for perfect axial symmetric geometries of indenters, was used here because the geometry of the tip of the intact microneedles was almost perfectly axially symmetric. Indeed, their experimental profile was first modelled through a 2-th symmetric polynomial ( R 2 = 0.94 see Figure 6b), and then through an 8-th degree polynomial ( R 2 = 0.98 see Figure 6c). Although both these functions were axially symmetric, the first one (2-th polynomial) was not able to model the experimental mean tip profile near the symmetry axis, whereas the second one (8-th polynomial) was affected by numeric instability [75,76] for distances greater than 20 μ m from the symmetry axis (see Figure 7a). Therefore, a piecewise function was built starting from these previous two candidate functions (see Figure 7b) to match experimental data both near and far from the symmetry axis. The previous geometrical considerations support the use of Equation (1) to investigate the interactions between intact microneedles and peripheral nerves. In addition, this approach resulted in a weak direct correlation between the a m values and the maximum depth of indentation for all the tested values of m (see Figure 3). The optimal value of the m parameter was then found (see Figure 4), in order to optimize the matching of experimental data (see Figure 5a,b) and resulted in a mean value m = 2.124 . It could be worth noting that the 95 % confidence interval for this value was 1.643 2.755 . Therefore, this value was in the range of other well-known values used for axially symmetric indenters (i.e., m = 3 / 2 for spherical indenters and m = 2 for conical and parabolical shapes [61,64,65]). In addition, the use of Equation (1) involved a mainly elastic response of the peripheral nervous tissue, and the accomplishment of this condition was previously discussed for these experiments in previous literature [49,50]. However, the previous approach could be generalized also in case of hysteresis due to a non-negligible viscous component of the nervous tissue response. Indeed, in this case both the loading and the unloading curves could be fitted by generalizing the Oliver-Pharr model in Equation (1) for higher degree polynomials [65,77].
In order to explore how to improve the design of microneedles to be inserted into in vivo peripheral nerves, a relationship between the tip angle of the microneedles and the force needed to pierce the nervous tissue was investigated. More specifically, a comparison between the insertion forces needed to penetrate in vitro specimens and in vivo peripheral nerves was performed. The difference between the force sets was not statistically relevant (Wilcoxon-Mann-Whitney test p = 0.28), whereas both sets of microneedles in [48,49] had a mean tip angle of 18 degrees. In addition, the insertion conditions were similar [48]. As a consequence, the same phenomenon was assumed for the other experimental values of the tip angle [48], and the experimental relationship in Equation (7) was found. In addition, to avoid the failure of the main shaft of the microneedles due to elastic instability, the maximum force to bear was set to be the twice the insertion force. Therefore, in Equation (9) an experimental relationship between the minimum diameter needed to effectively pierce the tissue and the tip angle was provided. Although this relationship involved only in vitro data, it was able to correctly assess the diameter needed to pierce in vivo nerves, as presented in this work. In addition, different kinds of boundary conditions were accounted for to better model the interaction between stiff microneedles and soft peripheral nerves [49,50]. More specifically, this framework was able to assess that a structure with a 15-mm-long shaft, a tip angle of 18 degrees, and a diameter of about 75 μ m should survive implantation in case of a maximum interaction force of about 100 mN with pinned-fixed ends. This prediction was in agreement with empirical observations in the literature [48,49] and was able to predict a range of diameters between 60 and 90 μ m in case of variable end conditions within two extreme cases. In particular, these two extreme cases were a stable contact between microneedle and connector, as well as between microneedle and peripheral nervous tissue (fixed-fixed ends), and a less stable connection between microneedle and connector, as well as between microneedle and tissue (pinned-pinned ends). In this last case, possible small reciprocal rotations were allowed. Therefore, a W microneedle with a main shaft of 15 mm, a tip angle of 18 degrees, and a diameter of 80 μ m was confirmed to be a reasonable choice to enter human-sized nerves (i.e., 3–5 mm of diameter), and a shaft diameter of 90 μ m was predicted to be effective in case of pinned-pinned ends and a tip angle of 18 degrees. Similarly, with the increase of the tip angle up to 24 degrees, the predicted diameter ranged between 80 (fixed-fixed ends) and about 110 μ m (pinned-pinned ends, see Figure 8c).
Nevertheless, this study reported that the tip of W microneedles was damaged, even if their main shaft was able to withstand the interaction forces and to enter the nerves. Indeed, the large stiffness mismatch between W and peripheral nerves seems to be unable to prevent the tip from these kinds of failure. In other words, even if the main structure of the microneedles was able to enter the tissue, local small-sized damages could nevertheless happen, resulting in conformational changes of the geometric shape of the tips.
The geometrical changes of the shape of post insertion microneedles were analysed through a standard approach [68]. On the one hand, the experimental shape of the post insertion microneedles was quantitatively measured. On the other hand, the shape of the intact microneedles was reconstructed. The post insertion tip shape was, then, the “measured surface”, and the reconstructed intact tip shape was the “form” of the tip. The track of the geometrical changes of the tip was achieved by subtracting the measured post insertion shape from the intact shape. This track was assumed as the superimposition of a low frequency component, accounting for the “waviness” of the surface, and a high frequency component, accounting for the “roughness” of the tip surface. The first contribution, which was quantitatively assessed through the R L ( x ) function and modelled through smooth polynomials, was related to the bulging phenomenon. This apparent phenomenon was likely physically related to the compression of the tip due to the action of the interaction force; that is, to the action of the reaction of the tissue on the microneedle tip. The second contribution, which was quantitatively assessed thorough the R H ( x ) function, was characterized by the presence of a main dominant spike. The position of this spike, with respect to the reference (0 value) was measured through the metric D ( R H ) and physically related to the amount of folding of the extreme sections of the microneedle tip; that is, this metric measured the length of the bent part of the tip. In this work, a phenomenological characterization of the geometry of the post insertion microneedle tip was performed through the description of the bulging and folding phenomena. However, this geometrical description is likely related to the coupled effects of compression and bending due to the effects of the interaction force on the microneedle tip. The first phenomenon had a characteristic length, measured through the D ( R L ) of about 100 μ m, whereas the second one has a characteristic length, measured by the D ( R H ) metric, within 20 μ m. Therefore, the compression phenomenon apparently dominated on the bending of the tip due to the action of the interaction force on the extreme sections of the microneedles in contact with the nerves. The reported values of D ( R L ) and D ( R H ) supported this hypothesis, because | D ( R L ) | > | D ( R H ) | for all the analyzed W microneedles. In addition, the signum of the D ( R H ) metric was able to identify the direction of the folding of the microneedle tip (i.e., toward left or right). Furthermore, the small value of the standard statistic R 2 in the correlation between D ( R L ) and D ( R H ) supported the hypothesis that both are needed to fully characterize the damage of the post insertion microneedle tips.
This work underlined that conformational changes of the tip geometry still happen although W microneedles are designed to effectively penetrate in vivo peripheral nerves without fracture or buckling of their main shaft. These changes, which are likely related to the sharp geometry of the tip, were already related to the lack of precision in insertion procedures and to patients’ discomfort [44]. As a consequence, to avoid bulging and folding effects, W microneedles with a flat tip could be used. Nevertheless, in this case, an increase of the size of their main shaft was predicted (see Figure 8d). In particular, the size of their main shaft should range between 110 μ m (fixed-fixed ends) and 180 μ m (pinned-pinned ends) to puncture the epineurium, and it should range between 150 μ m (fixed-fixed ends) and 230 μ m (pinned-pinned ends) to penetrate the perineurium. Because the available data [67] are referred to single epineurial and perineurial sheets, the size of the diameter of the main shaft of the W microneedles should likely be in the range 150–230 μ m to penetrate a whole nerve, where epineurial and perineurial layers are superimposed. Then, a good tradeoff should be identified between sharp microneedles with a smaller diameter but prone to tip damage, and microneedles with a flat tip, but with a bigger size of the main shaft to puncture the nerves. A further possible strategy to decrease the tip damage probability is to change the insertion procedure. Indeed, because the interaction force is the main cause of damage, a cut of the external layers of the nerve before the insertion of the main shaft can considerably lower the interaction force at the puncture, preventing the tip structure from damage.

5. Conclusions

In this work, a computational framework was provided to quantify the geometrical changes in the tips of W microneedles used to puncture in vivo peripheral nerves. The interaction force between tissue and microneedles was modelled through the Oliver-Pharr framework with < m > = 2.124 . Euler’s theory of elastic instability together with in vivo and in vitro data of puncture forces were used to provide predictions. More specifically, the diameter of the main shaft of a W microneedle with an opening angle of 18 degrees was assessed in the range 60–90 μ m to efficiently puncture peripheral nerves. However, a tip damage was detected and geometrically described as a superimposition of bulging and folding with characteristic length of 100 and 20 μ m, respectively. These effects were likely related to compression and elastic instability of the tip. To avoid these effects, W microneedles with a flat tip were explored, but this choice resulted in a larger main shaft diameter to avoid elastic buckling. To the best of our knowledge, the exploration of the geometrical changes of the tip shape a post insertion W microneedles is not a well-investigated topic, and the proposed framework could help further studies aiming at improving the design of these devices.

Supplementary Materials

The following supporting information can be downloaded at: https://www.mdpi.com/article/10.3390/app12188938/s1. Supplementary Materials shows raw data of force needed to puncture in vivo peripheral nerves.

Author Contributions

Conceptualization, P.N.S.; methodology, P.N.S., W.J., K.Y.; soft-ware, P.N.S.; validation, P.N.S.; formal analysis, P.N.S.; investigation, P.N.S., W.J., K.Y; resources, P.N.S., W.J., K.Y.; data curation, P.N.S., W.J., K.Y.; writing—original draft preparation, P.N.S.; writing—review and editing, P.N.S.; supervision, P.N.S., W.J., K.Y.; project administration, P.N.S., W.J., K.Y.; funding acquisition, P.N.S. All authors have read and agreed to the published version of the manuscript.

Funding

This research received no external funding. Publication funds were provided by Pier Nicola Sergi.

Institutional Review Board Statement

Not applicable.

Informed Consent Statement

Not applicable.

Data Availability Statement

Data and methods used in this research are presented in sufficient detail in the paper. Part of the dataset generated and analysed during the current study is available, as raw data, in Supplementary Materials.

Conflicts of Interest

The authors declare no conflict of interest.

Appendix A

In order to provide further details about the polynomial candidate functions used to reproduce the experimental geometrical shape of the microneedle tips, all the numeric coefficients are provided here in Appendix A. More specifically, all numerical coefficients of Equation (15) are listed below in Table A1 below:
Table A1. Numerical coefficients of the p 2 ( x ) polynomial candidate.
p 2 ( x ) CoefficientsValue(95% Confidence Interval)
p 22 + 2.57093 × 10 1 ( 2.49911 , 2.64276 ) × 10 1
p 21 2.73708 × 10 1 ( 3.42039 , 2.05377 ) × 10 1
p 20 + 1.11576 × 10 + 1 ( 0.986676 , 1.24485 ) × 10 + 1
Similarly, all the numeric coefficients of Equation (16) are listed below in Table A2:
Table A2. Numerical coefficients of the p 8 ( x ) polynomial candidate.
p 8 ( x ) CoefficientsValue(95% Confidence Interval)
p 88 4.36518 × 10 9 ( 7.23074 , 1.49964 ) × 10 9
p 87 + 1.73697 × 10 8 ( 1.25436 , 4.72831 ) × 10 8
p 86 + 4.36394 × 10 6 ( 2.00743 , 6.72047 ) × 10 6
p 85 4.56316 × 10 6 ( 2.55054 , 1.6379 ) × 10 5
p 84 1.79969 × 10 3 ( 2.42436 , 1.17502 ) × 10 3
p 83 8.88945 × 10 4 ( 5.21313 , 3.43526 ) × 10 3
p 82 + 5.54513 × 10 1 ( 4.9553 , 6.13496 ) × 10 1
p 81 7.05236 × 10 2 ( 3.31031 , 1.89982 ) × 10 1
p 80 + 2.71132 × 10 1 ( 1.25911 , 1.80137 ) × 10 0
More specifically, these functions had four point of intersections at x = 16.967   μ m, x = 1.631 μ m, x = 6.583 μ m, x = 16.676 μ m, respectively. Therefore only the couple of intersection points furthest from the symmetry axis was selected to satisfy the boundary conditions.
Finally, all the numeric values resulting from the metrics D ( R L ) and D ( R H ) are listed below in Table A3:
Table A3. Values of D ( R L ) and D ( R H ) accounting for the geometrical changes in the post insertion microneedle tips.
D ( R L ) D ( R H )
+ 9.0697 × 10 + 1 + 1.1632 × 10 + 1
+ 1.1205 × 10 + 2 1.8465 × 10 + 1
+ 8.3406 × 10 + 1 9.7405 × 10 + 0
+ 1.3280 × 10 + 2 + 1.8592 × 10 + 1
+ 1.4141 × 10 + 2 + 1.6263 × 10 + 1

References

  1. Pervikov, A.; Krinitcyn, M.; Glazkova, E.; Rodkevich, N.; Lerner, M. Synthesis of tungsten carbide from bimodal tungsten powder produced by electrical explosion of wire. Int. J. Refract. Met. Hard Mater. 2022, 103, 105733. [Google Scholar] [CrossRef]
  2. Chayeuski, V.; Zhylinski, V.; Rudak, P.; Rusalsky, D.; Visniakov, N.; Cernasejus, O. Characteristics of ZrC/Ni-UDD coatings for a tungsten carbide cutting tool. Appl. Surf. Sci. 2018, 446, 18–26. [Google Scholar] [CrossRef]
  3. Li, X.; Yuan, D.; Jiang, X.; Wang, F. Damages and wear of tungsten carbide-tipped rippers of tunneling machines used to cutting large diameter reinforced concrete piles. Eng. Fail. Anal. 2021, 127, 105533. [Google Scholar] [CrossRef]
  4. Katiyar, P.K. A comprehensive review on synergy effect between corrosion and wear of cemented tungsten carbide tool bits: A mechanistic approach. Int. J. Refract. Met. Hard Mater. 2020, 92, 105315. [Google Scholar] [CrossRef]
  5. Li, S.; Wang, J.; Zhang, G.; Liu, J.; Lv, Y.; Zhang, Y. Highly stable activity of cobalt based catalysts with tungsten carbide-activated carbon support for dry reforming of methane: Role of tungsten carbide. Fuel 2022, 311, 122512. [Google Scholar] [CrossRef]
  6. Salama, E.; Eissa, M.; Tageldin, A. Distinct properties of tungsten austenitic stainless alloy as a potential nuclear engineering material. Nucl. Eng. Technol. 2019, 51, 784–791. [Google Scholar] [CrossRef]
  7. Roth, J.; Tsitrone, E.; Loarte, A.; Loarer, T.; Counsell, G.; Neu, R.; Philipps, V.; Brezinsek, S.; Lehnen, M.; Coad, P.; et al. Recent analysis of key plasma wall interactions issues for ITER. J. Nucl. Mater. 2009, 390–391, 1–9. [Google Scholar] [CrossRef]
  8. Gilbert, M.; Dudarev, S.; Zheng, S.; Packer, L.; Sublet, J.C. An integrated model for materials in a fusion power plant: Transmutation, gas production, and helium embrittlement under neutron irradiation. Nucl. Fusion 2012, 52, 083019. [Google Scholar] [CrossRef]
  9. Chirayutthanasak, O.; Sarochawikasit, R.; Wisitsorasak, A.; Rujisamphan, N.; Frolov, T.; Oppelstrup, T.; Dangtip, S.; Rohrer, G.S.; Ratanaphan, S. Anisotropic grain boundary area and energy distributions in tungsten. Scr. Mater. 2022, 209, 114384. [Google Scholar] [CrossRef]
  10. Riesch, J.; Feichtmayer, A.; Coenen, J.W.; Curzadd, B.; Gietl, H.; Höschen, T.; Manhard, A.; Schwarz-Selinger, T.; Neu, R. Irradiation effects in tungsten—From surface effects to bulk mechanical properties. Nucl. Mater. Energy 2021, 30, 101093. [Google Scholar] [CrossRef]
  11. Debnath, S.; Masanta, M.; Bhattacharyya, B. Wire Electrochemical Machining employing newly developed tungsten micro wire with repeatedly similar cross sectional variations. J. Manuf. Process. 2022, 74, 535–543. [Google Scholar] [CrossRef]
  12. Burger, R.E.; Estavillo, J.; Osborne, J.; Stoll, P.J.; Wallace, W. Low-Impedance Tungsten Microelectrode for Recording from Sensory Ganglia. IEEE Trans. Biomed. Eng. 1973, BME-20, 378–380. [Google Scholar] [CrossRef]
  13. Williams, J.C.; Rennaker, R.L.; Kipke, D.R. Long-term neural recording characteristics of wire microelectrode arrays implanted in cerebral cortex. Brain Res. Protoc. 1999, 4, 303–313. [Google Scholar] [CrossRef]
  14. Patrick, E.; Orazem, M.E.; Sanchez, J.C.; Nishida, T. Corrosion of tungsten microelectrodes used in neural recording applications. J. Neurosci. Methods 2011, 198, 158–171. [Google Scholar] [CrossRef]
  15. Prasad, A.; Xue, Q.S.; Sankar, V.; Nishida, T.; Shaw, G.; Streit, W.J.; Sanchez, J.C. Comprehensive characterization and failure modes of tungsten microwire arrays in chronic neural implants. J. Neural. Eng. 2012, 9, 056015. [Google Scholar] [CrossRef]
  16. Anderson, J.M.; Defife, K.; Mcnally, A.; Collier, T.; Jenney, C. Monocyte, macrophage and foreign body giant cell interactions with molecularly engineered surfaces. J. Mater. Sci. Mater. Med. 1999, 10, 579–588. [Google Scholar] [CrossRef]
  17. Luttikhuizen, D.T.; Harmsen, M.C.; Luyn, M.J.V. Cellular and Molecular Dynamics in the Foreign Body Reaction. Tissue Eng. 2006, 12, 1955–1970. [Google Scholar] [CrossRef]
  18. Sunderland, S. The intraneural topography of the radial, median and ulnar nerves. Brain 1945, 68, 243–299. [Google Scholar] [CrossRef]
  19. Sunderland, S. The connective tissues of peripheral nerves. Brain 1965, 88, 841–854. [Google Scholar] [CrossRef]
  20. Lundborg, G.; Hansson, H.A. Regeneration of peripheral nerve through a preformed tissue space. Preliminary observations on the reorganization of regenerating nerve fibres and perineurium. Brain Res. 1979, 178, 573–576. [Google Scholar] [CrossRef]
  21. Lundborg, G. Intraneural microcirculation. Orthop. Clin. N. Am. 1988, 19, 1–12. [Google Scholar]
  22. Zochodne, D.W.; Huang, Z.X.; Ward, K.K.; Low, P.A. Guanethidine-induced adrenergic sympathectomy augments endoneurial perfusion and lowers endoneurial microvascular resistance. Brain Res. 1990, 519, 112–117. [Google Scholar] [CrossRef]
  23. Stolinski, C. Structure and composition of the outer connective tissue sheaths of peripheral nerve. J. Anat. 1995, 186 Pt 1, 123–130. [Google Scholar] [PubMed]
  24. Millesi, H.; Zoch, G.; Reihsner, R. Mechanical properties of peripheral nerves. Clin. Orthop. Relat. Res. 1995, 314, 76–83. [Google Scholar]
  25. Topp, K.S.; Boyd, B.S. Structure and biomechanics of peripheral nerves: Nerve responses to physical stresses and implications for physical therapist practice. Phys. Ther. 2006, 86, 92–109. [Google Scholar] [CrossRef] [PubMed]
  26. Green, R.A.; Lovell, N.H.; Wallace, G.G.; Poole-Warren, L.A. Conducting polymers for neural interfaces: Challenges in developing an effective long-term implant. Biomaterials 2008, 29, 3393–3399. [Google Scholar] [CrossRef] [PubMed]
  27. Grill, W.M.; Norman, S.E.; Bellamkonda, R.V. Implanted Neural Interfaces: Biochallenges and Engineered Solutions. Annu. Rev. Biomed. Eng. 2009, 11, 1–24. [Google Scholar] [CrossRef]
  28. Carpaneto, J.; Cutrone, A.; Bossi, S.; Sergi, P.; Citi, L.; Rigosa, J.; Rossini, P.M.; Micera, S. Activities on PNS neural interfaces for the control of hand prostheses. In Proceedings of the 2011 Annual International Conference of the IEEE Engineering in Medicine and Biology Society, Boston, MA, USA, 30 August–3 September 2011; pp. 4637–4640. [Google Scholar]
  29. Cutrone, A.; Sergi, P.N.; Bossi, S.; Micera, S. Modelization of a self-opening peripheral neural interface: A feasibility study. Med Eng. Phys. 2011, 33, 1254–1261. [Google Scholar] [CrossRef]
  30. Anderson, J.M.; Rodriguez, A.; Chang, D.T. Foreign body reaction to biomaterials. Innate and Adaptive Immune Responses in Tissue Engineering. Semin. Immunol. 2008, 20, 86–100. [Google Scholar] [CrossRef]
  31. McConnell, G.C.; Rees, H.D.; Levey, A.I.; Gutekunst, C.A.; Gross, R.E.; Bellamkonda, R.V. Implanted neural electrodes cause chronic, local inflammation that is correlated with local neurodegeneration. J. Neural. Eng. 2009, 6, 056003. [Google Scholar] [CrossRef]
  32. Biran, R.; Martin, D.C.; Tresco, P.A. Neuronal cell loss accompanies the brain tissue response to chronically implanted silicon microelectrode arrays. Exp. Neurol. 2005, 195, 115–126. [Google Scholar] [CrossRef]
  33. Sankar, V.; Patrick, E.; Dieme, R.; Sanchez, J.C.; Prasad, A.; Nishida, T. Electrode impedance analysis of chronic tungsten microwire neural implants: Understanding abiotic vs. biotic contributions. Front. Neuroeng. 2014, 7, 13. [Google Scholar] [CrossRef] [Green Version]
  34. Sheikh, Z.; Brooks, P.J.; Barzilay, O.; Fine, N.; Glogauer, M. Macrophages, Foreign Body Giant Cells and Their Response to Implantable Biomaterials. Materials 2015, 8, 5671–5701. [Google Scholar] [CrossRef]
  35. Gori, M.; Vadala, G.; Giannitelli, S.M.; Denaro, V.; Di Pino, G. Biomedical and Tissue Engineering Strategies to Control Foreign Body Reaction to Invasive Neural Electrodes. Front. Bioeng. Biotechnol. 2021, 9, 411. [Google Scholar] [CrossRef]
  36. Lacour, S.P.; Courtine, G.; Guck, J. Materials and technologies for soft implantable neuroprostheses. Nat. Rev. Mater. 2016, 1, 16063. [Google Scholar] [CrossRef]
  37. Tringides, C.M.; Vachicouras, N.; de Lazaro, I.; Wang, H.; Trouillet, A.; Seo, B.R.; Elosegui-Artola, A.; Fallegger, F.; Shin, Y.; Casiraghi, C.; et al. Viscoelastic surface electrode arrays to interface with viscoelastic tissues. Nat. Nanotechnol. 2021, 16, 1019–1029. [Google Scholar] [CrossRef]
  38. Nath, S.; Chen, Z.; Yue, N.; Trumpore, S.; Peschel, R. Dosimetric effects of needle divergence in prostate seed implant using and radioactive seeds. Med. Phys. 2000, 27, 1058–1066. [Google Scholar] [CrossRef]
  39. Youk, J.H.; Kim, E.K.; Kim, M.J.; Lee, J.Y.; Oh, K.K. Missed Breast Cancers at US-guided Core Needle Biopsy: How to Reduce Them. RadioGraphics 2007, 27, 79–94. [Google Scholar] [CrossRef]
  40. Gupta, S.; Madoff, D.C. Image-Guided Percutaneous Needle Biopsy in Cancer Diagnosis and Staging. Interventional Oncology—Part 2: Non-Hepatic Interventions and Biopsy Techniques. Tech. Vasc. Interv. Radiol. 2007, 10, 88–101. [Google Scholar] [CrossRef]
  41. Abolhassani, N.; Patel, R.; Moallem, M. Needle insertion into soft tissue: A survey. Med. Eng. Phys. 2007, 29, 413–431. [Google Scholar] [CrossRef]
  42. Gandevia, S.; Hales, J. The methodology and scope of human microneurography. J. Neurosci. Methods 1997, 74, 123–136. [Google Scholar] [CrossRef] [PubMed]
  43. Vallbo, R.B.; Hagbarth, K.E.; Wallin, B.G. Microneurography: How the technique developed and its role in the investigation of the sympathetic nervous system. J. Appl. Physiol. 2004, 96, 1262–1269. [Google Scholar] [CrossRef] [PubMed]
  44. Pineiro, M.L.; Green, J.B.; Kaufman, J.; Blackwelder, P.L.; Freytag, D.L.; Frank, K.; Alfertshofer, M.; Cotofana, S. Deformation of Needle Tips During Facial Soft Tissue Filler Injections: An Electron-Microscopic Study. Aesthetic Surg. J. 2021, 41, NP2011–NP2019. [Google Scholar] [CrossRef] [PubMed]
  45. Skapetis, T.; Doan-Tran, P.D.; Hossain, N.M. Evaluation of bevelled needle tip deformation with Dental Inferior Alveolar Nerve blocks. Aust. Endod. J. 2019, 45, 325–330. [Google Scholar] [CrossRef]
  46. Amely, H.; Tina, L.; Luhrenberg, P.; Monika, D. Needle tip deformation in local dental anesthesia: A technical note. J. Mech. Behav. Biomed. Mater. 2022, 126, 105034. [Google Scholar] [CrossRef]
  47. Sergi, P.N.; Carrozza, M.C.; Dario, P.; Micera, S. Biomechanical characterization of needle piercing into peripheral nervous tissue. IEEE Trans. Biomed. Eng. 2006, 53, 2373–2386. [Google Scholar] [CrossRef]
  48. Yoshida, K.; Lewinsky, I.; Nielsen, M.; Hylleberg, M. Implantation mechanics of tungsten microneedles into peripheral nerve trunks. Med. Biol. Eng. Comput. 2007, 45, 413–420. [Google Scholar] [CrossRef]
  49. Sergi, P.N.; Jensen, W.; Micera, S.; Yoshida, K. In vivo interactions between tungsten microneedles and peripheral nerves. Med. Eng. Phys. 2012, 34, 747–755. [Google Scholar] [CrossRef]
  50. Sergi, P.N.; Jensen, W.; Yoshida, K. Interactions among biotic and abiotic factors affect the reliability of tungsten microneedles puncturing in vitro and in vivo peripheral nerves: A hybrid computational approach. Mater. Sci. Eng. C 2016, 59, 1089–1099. [Google Scholar] [CrossRef]
  51. Bora, F.W.; Richardson, S.; Black, J. The biomechanical responses to tension in a peripheral nerve. J. Hand Surg. 1980, 5, 21–25. [Google Scholar]
  52. Layton, B.E.; Sastry, A.M. A Mechanical Model for Collagen Fibril Load Sharing in Peripheral Nerve of Diabetic and Nondiabetic Rats. J. Biomech. Eng. 2005, 126, 803–814. [Google Scholar] [CrossRef]
  53. Layton, B.E.; Sastry, A.M. Equal and local-load-sharing micromechanical models for collagens: Quantitative comparisons in response of non-diabetic and diabetic rat tissue. Acta Biomater. 2006, 2, 595–607. [Google Scholar] [CrossRef]
  54. Main, E.K.; Goetz, J.E.; Rudert, M.J.; Goreham-Voss, C.M.; Brown, T.D. Apparent transverse compressive material properties of the digital flexor tendons and the median nerve in the carpal tunnel. J. Biomech. 2011, 44, 863–868. [Google Scholar] [CrossRef] [Green Version]
  55. Ma, Z.; Hu, S.; Tan, J.S.; Myer, C.; Njus, N.M.; Xia, Z. In vitro and in vivo mechanical properties of human ulnar and median nerves. J. Biomed. Mater. Res. A 2013, 101, 2718–2725. [Google Scholar] [CrossRef]
  56. Giannessi, E.; Stornelli, M.R.; Sergi, P.N. A unified approach to model peripheral nerves across different animal species. PeerJ 2017, 5, e4005. [Google Scholar] [CrossRef]
  57. Giannessi, E.; Stornelli, M.R.; Sergi, P.N. Fast in silico assessment of physical stress for peripheral nerves. Med. Biol. Eng. Comput. 2018, 56, 1541–1551. [Google Scholar] [CrossRef]
  58. Giannessi, E.; Stornelli, M.R.; Coli, A.; Sergi, P.N. A Quantitative Investigation on the Peripheral Nerve Response within the Small Strain Range. Appl. Sci. 2019, 9, 1115. [Google Scholar] [CrossRef]
  59. Giannessi, E.; Stornelli, M.R.; Sergi, P.N. Strain stiffening of peripheral nerves subjected to longitudinal extensions in vitro. Med. Eng. Phys. 2020, 76, 47–55. [Google Scholar] [CrossRef]
  60. Sergi, P.N. Deterministic and Explicit: A Quantitative Characterization of the Matrix and Collagen Influence on the Stiffening of Peripheral Nerves Under Stretch. Appl. Sci. 2020, 10, 6372. [Google Scholar] [CrossRef]
  61. Sneddon, I.N. The relation between load and penetration in the axisymmetric boussinesq problem for a punch of arbitrary profile. Int. J. Eng. Sci. 1965, 3, 47–57. [Google Scholar] [CrossRef]
  62. Anik, M. Anodic Behavior of Tungsten in H3PO4-K2SO4-H2SO4/KOH Solutions. Turk. J. Chem. 2002, 26, 915–924. [Google Scholar]
  63. Okamura, A.M.; Simone, C.; O’Leary, M.D. Force modeling for needle insertion into soft tissue. IEEE Trans. Biomed. Eng. 2004, 51, 1707–1716. [Google Scholar] [CrossRef] [PubMed]
  64. Oliver, W.C.; Pharr, G.M. An improved technique for determining hardness and elastic modulus using load and displacement sensing indentation experiments. J. Mater. Res. 1992, 7, 1564–1583. [Google Scholar] [CrossRef]
  65. Kontomaris, S.V.; Malamou, A. Hertz model or Oliver and Pharr analysis? Tutorial regarding AFM nanoindentation experiments on biological samples. Mater. Res. Express 2020, 7, 033001. [Google Scholar] [CrossRef]
  66. Schneider, C.A.; Rasband, W.S.; Eliceiri, K.W. NIH Image to ImageJ: 25 years of image analysis. Nat. Methods 2012, 9, 671–675. [Google Scholar] [CrossRef]
  67. Koppaka, S.; Hess-Dunning, A.; Tyler, D.J. Biomechanical characterization of isolated epineurial and perineurial membranes of rabbit sciatic nerve. J. Biomech. 2022, 136, 111058. [Google Scholar] [CrossRef]
  68. Jiang, X.J.; Gao, F.; Martin, H.; Williamson, J.; Li, D. Chapter 10—On-Machine Metrology for Hybrid Machining. In Hybrid Machining; Luo, X., Qin, Y., Eds.; Academic Press: Cambridge, MA, USA, 2018; pp. 239–268. [Google Scholar] [CrossRef]
  69. Ciofani, G.; Sergi, P.N.; Carpaneto, J.; Micera, S. A hybrid approach for the control of axonal outgrowth: Preliminary simulation results. Med. Biol. Eng. Comput. 2011, 49, 163–170. [Google Scholar] [CrossRef]
  70. Sergi, P.N.; Cavalcanti-Adam, E.A. Biomaterials and computation: A strategic alliance to investigate emergent responses of neural cells. Biomater. Sci. 2017, 5, 648–657. [Google Scholar] [CrossRef]
  71. Sergi, P.N.; Morana Roccasalvo, I.; Tonazzini, I.; Cecchini, M.; Micera, S. Cell Guidance on Nanogratings: A Computational Model of the Interplay between PC12 Growth Cones and Nanostructures. PLoS ONE 2013, 8, e70304. [Google Scholar] [CrossRef]
  72. Sergi, P.N.; Marino, A.; Ciofani, G. Deterministic control of mean alignment and elongation of neuron-like cells by grating geometry: A computational approach. Integr. Biol. 2015, 7, 1242–1252. [Google Scholar] [CrossRef]
  73. Roccasalvo, I.M.; Micera, S.; Sergi, P.N. A hybrid computational model to predict chemotactic guidance of growth cones. Sci. Rep. 2015, 5, 11340. [Google Scholar] [CrossRef]
  74. Navarro, X.; Krueger, T.B.; Lago, N.; Micera, S.; Stieglitz, T.; Dario, P. A critical review of interfaces with the peripheral nervous system for the control of neuroprostheses and hybrid bionic systems. J. Peripher. Nerv. Syst. 2005, 10, 229–258. [Google Scholar] [CrossRef]
  75. Sergi, P.N.; Valle, J.D.; Oliva, N.D.L.; Micera, S.; Navarro, X. A data-driven polynomial approach to reproduce the scar tissue outgrowth around neural implants. J. Mater. Sci. Mater. Med. 2020, 31, 59. [Google Scholar] [CrossRef]
  76. Sergi, P.N.; De la Oliva, N.; del Valle, J.; Navarro, X.; Micera, S. Physically Consistent Scar Tissue Dynamics from Scattered Set of Data: A Novel Computational Approach to Avoid the Onset of the Runge Phenomenon. Appl. Sci. 2021, 11, 8568. [Google Scholar] [CrossRef]
  77. Kontomaris, S.V.; Stylianou, A.; Nikita, K.S.; Malamou, A.; Stylianopoulos, T. A simplified approach for the determination of fitting constants in Oliver-Pharr method regarding biological samples. Phys. Biol. 2019, 16, 056003. [Google Scholar] [CrossRef]
Figure 1. Evolution of the indentation force with respect to the normalized indentation depth ξ : The reaction force F (black arrow) of the tissue to the action of the microneedles tip (with opening angle γ ) at the current indentation depth h (subfigure ➀). Similarly, the tissue responds with a reaction force F max (black arrow) to the action of the microneedle tip (with opening angle γ ) at the maximum indentation depth h m a x (subfigure ➁). In this work, the reaction force to the action of the microneedle tip is defined as “interaction force”. The ratio ξ = h / h m a x is defined as normalized indentation depth. The plot shows that increasing the normalized indentation depth also increases the interaction force up to a maximum value, when the peripheral nervous tissue is punctured by the microneedle tip. The indentation phase is defined for 0 ξ 1 .
Applsci 12 08938 g001
Figure 2. Analysis and quantification of changes in the tip shape of post insertion microneedles: The measured shape of the post insertion microneedle (i.e., the function P e x p ( x ) ) was compared to the theoretical intact shape (i.e., the function P t h n 1 , n 2 , n 3 ( x ) ). The track of the geometric deformation of the tip (i.e., the function Γ ( x ) ) is obtained by subtracting the measured shape from the theoretical one. The Γ ( x ) function was expressed as the superimposition of a low-frequency component (i.e., the function R L ( x ) ) and a high-frequency component (i.e., the function R H ( x ) ). More specifically, the Γ ( x ) function is obtained by subtracting R H ( x ) from R L ( x ) . The measure of the amount of change was performed by the metric D ( R L ) (red arrow down left), which measured the maximum amplitude of the R L ( x ) function, while through the metric D ( R H ) (red arrow down right), which measured the distance of the peak of the R H ( x ) function from the origin of abscissas.
Applsci 12 08938 g002
Figure 5. Reference interactions between W microneedles and in vivo peripheral nerves achieved through Equation (1) for the optimal value m m = 2.124 . (a) Evolution of the interaction force with the increase of the normalized indentation depth ξ . (b) Residuals between theoretical forces modelled through Equation (1) and experimental data. (c) Correlation between a m coefficients and maximum indentation depth h m in Equation (1).
Applsci 12 08938 g005
Figure 6. Experimental images and accuracy of the polynomial candidate functions. (a) Experimental image of an intact microneedle tip. The symmetry axis and the diameter are highlighted. (b) A 2-th degree polynomial candidate function is able to match the mean shape of the intact microneedles ( R 2 = 0.94 ) for distances ranging between 5 and 20 microns from the symmetry axis. (c) An 8-th degree polynomial candidate function is able to match the mean shape of intact microneedles ( R 2 = 0.98 ) for distances ranging from 0 to 20 microns from the symmetry axis.
Applsci 12 08938 g006
Figure 7. Evolution of polynomial candidate functions. (a) The evolution of both P t h 2 (2-th polynomial candidate function, blue solid line) and P t h 8 (8-th polynomial candidate function, red solid line) is compared for distances greater than 20 microns from the symmetry axis of the microneedles. The P t h 2 candidate is able to follow the experimental shape, and the P t h 8 candidate function is affected by numeric instability for distances greater than 20 microns. (b) The piecewise candidate function P 2 , 8 , 2 is able to reproduce the experimental shape of intact microneedles both for distances lower than 20 μ m and greater than 30 μ m from the symmetry axis without numeric instability phenomena (blue solid line).
Applsci 12 08938 g007
Figure 8. Comparison between puncture force into in vivo and in vitro nerves and predictions of the size of the microneedle shaft. (a) Comparison between insertion forces of W microneedles with a tip angle of 18 degrees into in vivo [49] nerves and in vitro specimens [48]: the two groups do not show any significant statistical difference (Wilcoxon-Mann-Whitney test p = 0.58). (b) Experimental correlation between the mean value of the insertion force and the microneedle tip angle for in vitro specimens [48]. (c) Theoretical relationships between the diameter of 15-mm-long microneedles and their tip angle. Different boundary conditions are investigated to assess the minimum diameter needed to enter in vivo nerves without failure of the main shaft for buckling: pinned-pinned ends (circles), pinned-fixed ends (triangles), and fixed-fixed ends (squares). (d) Assessment of the diameter size of a 15-mm-long microneedle with a flat tip to puncture the perineurial and epineurial sheets with different boundary conditions (pinned-pinned, pinned-fixed, fixed-fixed ends), starting from literature data [67].
Applsci 12 08938 g008
Figure 9. Description of the changes in the tips of the post insertion microneedles. (ae) Tracks of the geometric deformation of the W microneedle tip. For each tip, the function Γ ( x ) is obtained as the subtraction of P e x p ( x ) from P t h 2 , 8 , 2 ( x ) . The origin of the abscissas (0 value) describes the theoretical position of the symmetry axis of the intact theoretical shape P t h 2 , 8 , 2 ( x ) . (fj) The low frequency contribution to the Γ ( x ) function is expressed through the function R L ( x ) . The length of the yellow arrows visually represents the value of the metric D ( R L ) , which quantifies the amount of bulging of the post insertion microneedle tips. (ko) The high frequency contribution to the Γ ( x ) function is expressed through the function R H ( x ) . The length of the blue arrows visually represents the value of the metric D ( R H ) , which quantifies the amount of the folding (bending) of the post insertion microneedle tips.
Applsci 12 08938 g009
Figure 10. Physical meaning of D ( R L ) and D ( R H ) . (a1e1) Experimental images of post insertion W microneedles with metric bar. (a2e2) Comparison between post insertion and the intact shapes of the post insertion microneedle tips. A physical interpretation of the D ( R L ) and D ( R H ) metrics is provided with arrows. (f) Bar plot of the values of the D ( R L ) metric for each post insertion microneedle tip. The value of the bar is related to the amount of the maximum bulging of the post insertion tip profile. (g) Bar plot of the value of the D ( R H ) metric. The value of the bar is related to the amount of folding to the right (+) or left (−) with respect to the reference (0 value) which was the position of the symmetry axis of the intact tip. (h) Correlation between D ( R L ) and D ( R H ) resulting in the value R 2 = 0.28 .
Applsci 12 08938 g010
Publisher’s Note: MDPI stays neutral with regard to jurisdictional claims in published maps and institutional affiliations.

