Abstract
The intercity railway is subject to variation and fluctuation in demand both in time and space over a day to a large extent. In that case, more advanced line planning techniques are practically needed to match the non-equilibrium passenger demand. We propose an integer linear programming model for adapting to the fluctuating demand and improving rail line profit, in which the multi-period planning approach and flexible train composition mode are taken into consideration. In particular, we also consider the limitations of the carriage and the dynamic transfer of resources during a finite period to ensure the better implementation of the line planning and subsequent operation plans. Our purpose is to improve on previous line planning models by integrating the multi-period strategic-level line planning decision with resource constraints. Since the problem is computationally intractable for realistic size instances, an improved round heuristic algorithm that is based on linear relaxation is proposed and we compare the round heuristic performance with the commercial solver Gurobi on artificial instances. The numerical experiments that are based on an intercity railway in China certify the effectiveness and applicability of the proposed model and algorithm. We evaluate the impact of different optimization parameters and reserved carriages and the computation results show that in comparison to the fixed composition mode, the proposed approach can improve the utilization efficiency of carriage resources and increase the line profit by 1.9% under the same carriage resource conditions.
1. Introduction
With the rapid development and expansion of metropolitan circles, more and more is travel demand increasing between neighboring cities. As an important part of the multi-mode rail transit system, the intercity railway has a vital role in breaking the space-time constraints between cities, stimulating regional economic growth, and promoting the integrated development of urban agglomerations. To meet the growing transportation demand, several intercity railway lines have been operated in China. The intercity railway has the characteristics of higher density and shorter distances covered compared with the trunk railway, and the demand is mainly for daily commuting, which causes the notable fluctuation of passenger demand over the space-time dimensions. The space non-equilibrium and time-dependent are two main characteristics of fluctuating passenger demand, which might cause great complexity to the operation planning and affect the service quality for the passenger accordingly. Since the passenger demand has the characteristics of significant fluctuation in terms of time and space, the static railway planning approach with a fixed train formation will result in a mismatch between the train capacity and passenger demand. In this case, more advanced planning techniques with flexible operation schemes are practically needed to match the non-equilibrium passenger demand, increase the utilization rate of rolling stocks, and then further save operation costs [1,2,3,4], which is conducive to the sustainable development of the transportation industry [5].
This paper proposes an integer linear programming model for adapting to the fluctuating demand considering carriage resources transfer under flexible compositions. We are motivated by the study of Güvenç Şahin [6] and Zhou W. [7]. The line planning problem with fluctuating demand was treated by Güvenç Şahin [6] and he presented a multi-period line planning mathematical model framework. There are three important features that are considered in that model: first, the variation and fluctuation of demand in both time and space are considered; second, a dynamic transfer of resources from one line to another throughout the planning horizon is considered; third, the available capacities are given by the line decisions, which generalizes the way of introducing the capacity through the number of carriages. While this model implicitly assumes that all trains stop at all stations and the passenger demand in both directions of the intercity line is symmetrical. Zhou proposed an optimization model of the train plan on the intercity railway that was oriented for elastic demand to maximize train operation benefits. Their models optimize the train stop schemes and departure times. However, only the line planning in one direction is generated and the transfer of resources between periods is not considered. In this paper, we concentrate our efforts on solving the line planning problem with asymmetrical fluctuating demand, multi-type stop-patterns, and limited carriage resources for a given intercity line. The main scientific contributions of this paper are as follows:
- (i)
- We consider a multi-period planning problem incorporating line frequency, capacity, stop-pattern, and the transfer of resources.
- (ii)
- Given the asymmetric fluctuating demand, the upstream and downstream line planning are generated simultaneously.
- (iii)
- Resource transfer between different periods and different directions is considered to ensure the availability and allocation of operational resources throughout the periods.
- (iv)
- Under the limited resources, the behavior that passengers may choose an alternative mode or continue to wait is considered.
- (v)
- The capacity of the line is determined by the number of carriages under flexible compositions.
The remainder of this paper is organized as follows. A brief review of the relevant literature is presented in Section 2. The problem description and base mathematical model are given in Section 3. We give a detailed description of the improved round heuristic algorithm in Section 4. In Section 5, numerical experiments with a real intercity railway line are provided to demonstrate the effectiveness of the proposed model and algorithm. Discussions are also given in this section. Section 6 provides a conclusion and recommendations for future studies.
2. Literature Review
The line planning problem (LPP) is a critical issue in railway planning which can balance demand and operation facilities. Line planning is usually based on the time-space distribution of demand, line capacity, and vehicle resources, which determines the train routes, frequency, stop patterns, and composition mode. The effectiveness of a line plan is often judged by the level of service and the associated travel costs from the passenger point of view and by the operation costs and facility utilization factors from the operators’ point of view [8]. In general, the development of LPP has experienced a process from simple to complex, from static demand to dynamic demand, from single line planning optimization to integrate optimization of another operational planning process. There have been numerous LPP studies that focus on sub-processes, such as those that are mainly concerning route design [9], frequency setting [10,11], stop planning [12,13], and a combination of the above [14,15]. Below, we briefly introduce the critical literature that is relevant to this paper.
LPP in transportation can go back to 1965 [16], which introduced the basic theoretical framework. Since then, numerous studies and reviews [6,8,17] have been conducted on LPP for public transportation. Initially, LPP was always designed with a static demand because of its complexity, e.g., a day, a certain part of the day, an hour [6,18,19]. The line planning literature has immensely progressed by considering the demand for transport as static, and problem formulations suppose that the demand rate stays the same for a given origin-destination during the planning horizon. The intercity railway systems are subject to a high level of variation and fluctuation in demand over the day. When this variation and fluctuation are observed in both time and space, it is crucial to develop line plans that are responsive to demand. Then, some scholars questioned the appropriateness of using the same line plan over the day [8,20]. When formulating the train line planning, the railway department always considers the impact of the fluctuation characteristics in both time and space of the passenger demand. For example, the “time-varying” characteristics of passenger flow demand urge the railway department to operate multi-period line planning under the flexible composition mode. The “space non-equilibrium” characteristics may cause the imbalance distribution of the number of carriage resources at different stations. In this case, the railway department also needs to consider the dynamic resources when formulating line planning. So, when the demand is extremely unsteady and asymmetric, the traditional line planning methods are not convincing and an approach that can adapt to the demand fluctuation is needed. Some scholars have taken the average daily passenger flow as the basis and considered the elastic characteristics of demand to a certain extent [7,15,21]. Recently, some studies have gradually focused on the time variability of demand [6,22,23,24,25] and they always apply the multi-period planning method to remedy any defects.
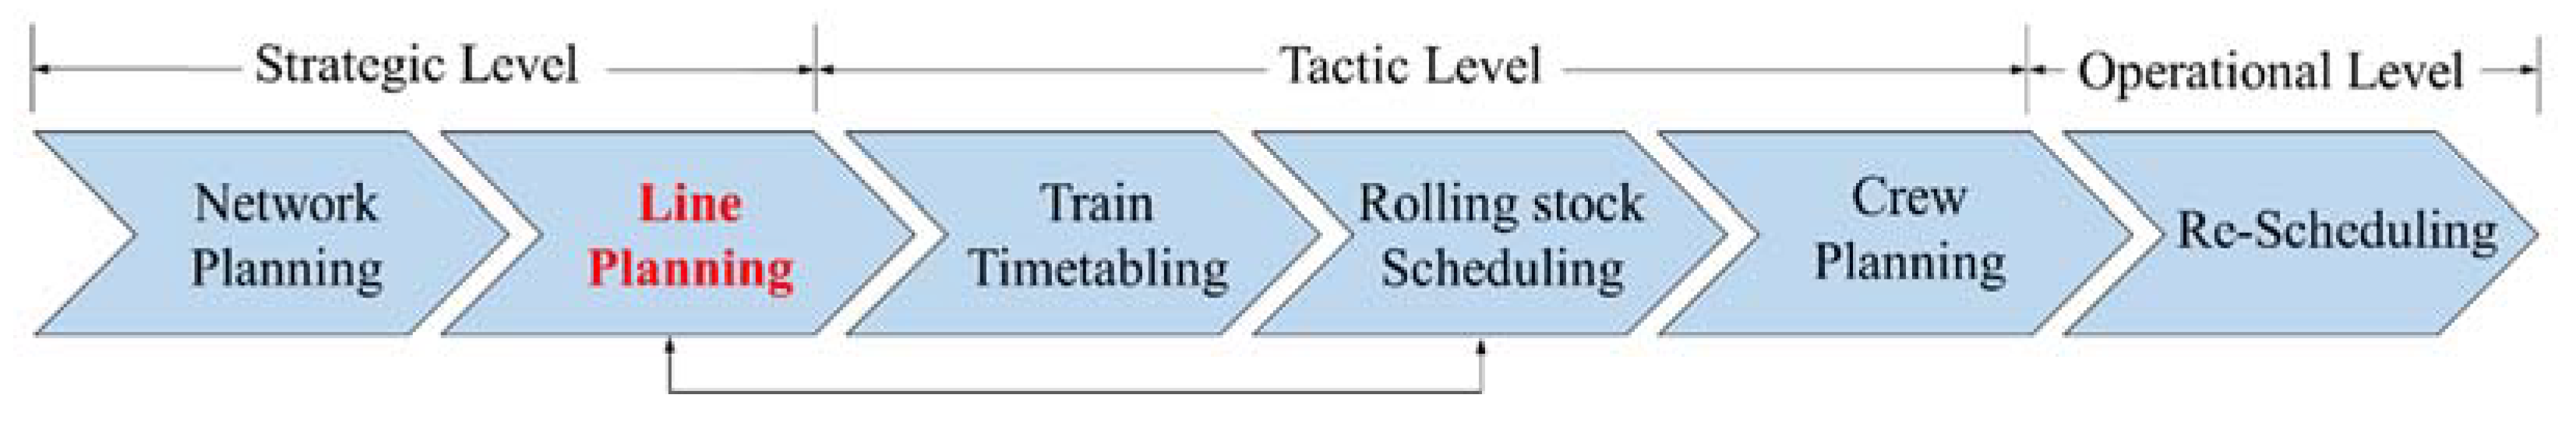
While a multi-period planning approach is a remedy for the demand fluctuation, the problem becomes more complicated due to the coupling constraints [26]. Although constraints for a period allocate essential resources to activities, coupling constraints transfer the resources among activities from one period to the next. In this respect, a multi-period LPP comes inherently with resource constraints and their allocation throughout periods because a multi-period line plan needs to be feasible during each period concerning the associated resources as well. This necessity leads to the integration of line planning decisions with decisions on allocating resources. Integrations between the different levels of decision-making in transportation systems planning have been a topic of general interest in the literature. A generic operational planning process [27,28] in railway transportation is illustrated in Figure 1, which generally follows a hierarchical top-down approach, from strategic network design and line planning, tactic timetabling, rolling stock planning and crew scheduling, to operational re-scheduling [25,29,30,31]. In most cases, studies explore the integration of line planning and timetabling or timetabling and rolling stock scheduling [32,33,34,35]. Line planning is often scheduled before rolling stock circulation planning, which may lead to the infeasibility of the following operation plan and increase the complexity of the operation plan [34]. If such systems are subject to limitations of resources, a dynamic transfer of resources from one line to another throughout the planning horizon should also be considered.
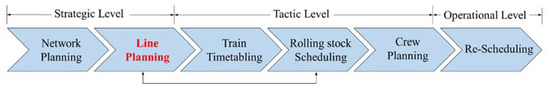
Figure 1.
Illustration of railway planning procedures.
This study focuses on the integrity of line planning and rolling stock scheduling in the form of resource constraints. The line planning problem is the first planning stage after network design in the public transportation system [36,37], which is an important basis for formulating the train timetable and resource circulation scheme. Thus, it is essential to study the new line planning approach with fluctuating passenger flow demand [6]. In this paper, we proposed a line planning approach in response to the space non-equilibrium and time-dependent demand. As stated by Güvenç Şahin [6], the line planning problem with fluctuating demand comes inherently with resource constraints to ensure the scheme’s feasibility. Different from Güvenç Şahin [6], we think that resources may be scarce during peak periods, and discussed the impact of the number of resources on the line planning scheme. We are motivated by the lack of line planning approaches to handle high variations and fluctuations of demand in both time and space. The flexible composition mode is an active method that can cope with complex passenger demand changes by making full use of the transport capacity of each rolling stock [4,38]. We aim to discuss multi-period line planning, recognizing the connection between period-coupling resource constraints in multi-period planning and the integration of line planning with resources that are associated with later stages of planning. We will mainly complete the following three tasks: (i) Proposing a multi-period planning approach in response to high levels of fluctuation and variation in demand. (ii) Integrating the multi-period strategic-level line planning decision with resource constraints that ensure the availability and allocation of operational resources throughout the periods. (iii) Applying the flexible composition mode to the LPP. This study focuses on developing a novel multi-period line planning approach that considers a changing demand and flexible composition mode. The optimization method is developed to solve the line planning problem with a profit-oriented approach considering the transfer of carriage resources during a finite length planning horizon of multiple periods. By this method, it is expected to match the passenger demand with the scheduled transportation capacity, further improve operational flexibility, and extract gains in efficiency through flexibly determining the number of train formations and formulating corresponding operation plans according to the demand in different periods.
3. Mathematical Model
3.1. Problem Description and Assumption
As stated above, more advanced planning techniques with flexible operation schemes are practically needed to match the non-equilibrium passenger demand and then further increase rail line profit. At present, the research and practical application of flexible composition mode are gradually mature.
To give a clear description of the operation process of this paper, some terms are introduced below. Here we define a train as a group of locomotives and carriages, which can be coupled with various carriages, yielding different marshalling types of trains. The type of trains for implementing a service can also be called composition mode which shows how many carriages are equipped with a train [4]. In general, a train consists of two locomotives and several carriages under a flexible composition mode. We extended the line to have the stops attribute. Specifically, a line is a simple path with stops between terminal stations 1 and L. The number of carriages of a line is denoted by k. The set of all the lines is called a line pool.
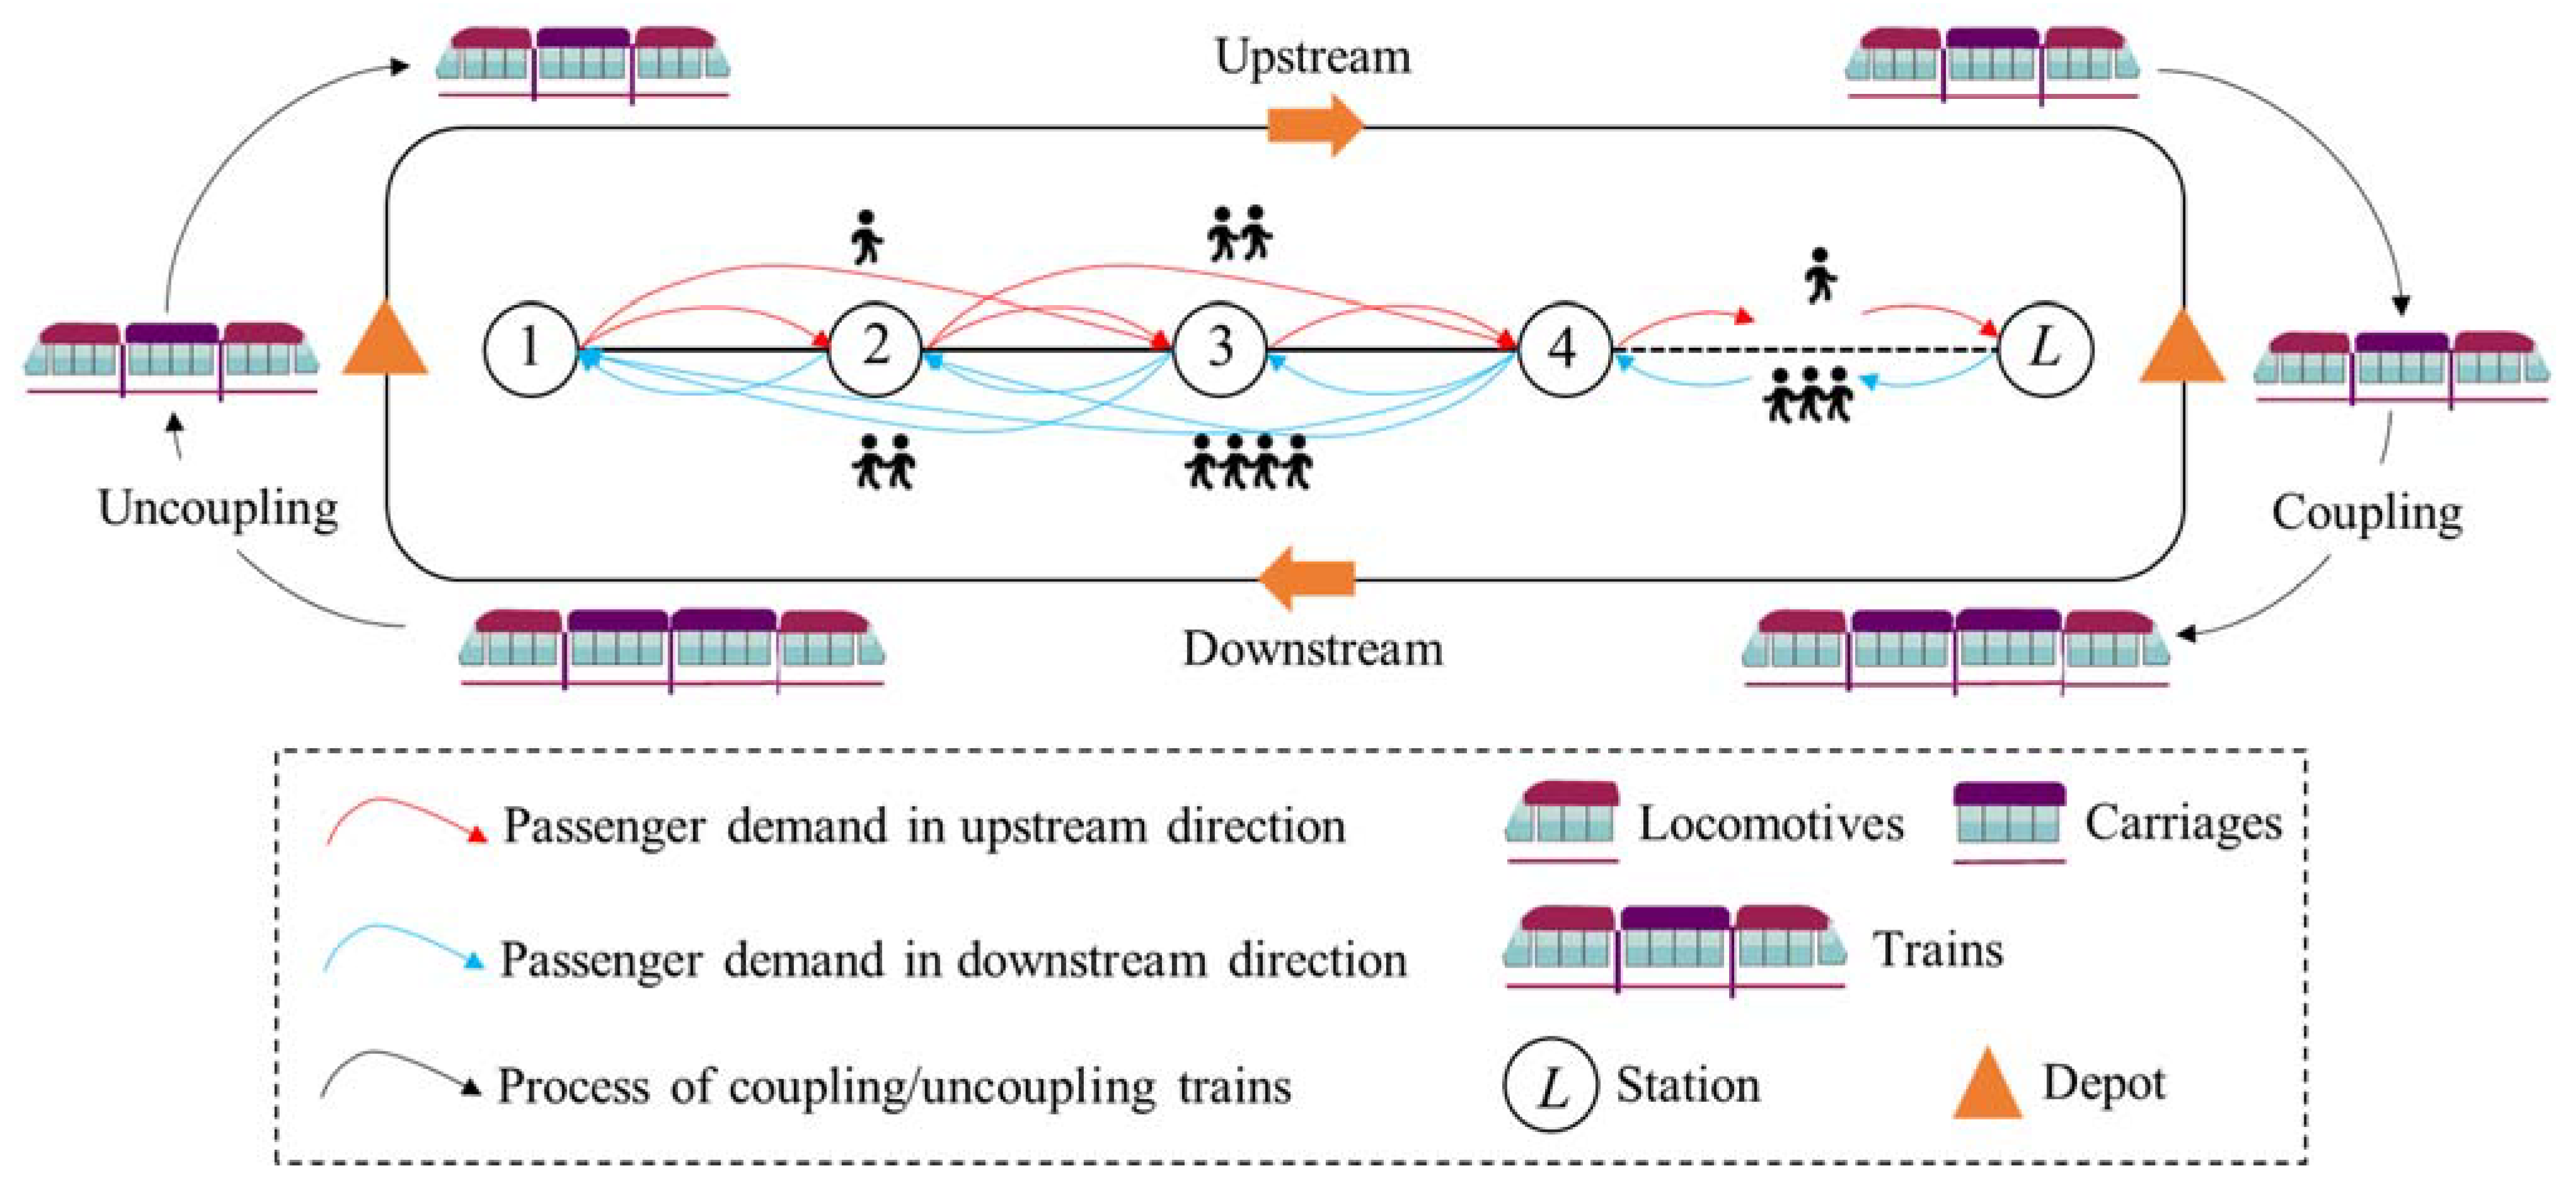
Figure 2 illustrates the operation process with the flexible composition mode. The stations of the rail line are numbered from 1 to L. All the trains with different numbers of carriages start at one of the two terminal stations, 1 or L, and end respectively at the other terminal station. As the rail line is a dual track, there will be no potential conflicts for collision between two trains using the same track heading in the opposite direction. The terminal stations can carry out train technical operations, such as turn back, disassembly, and reconnection. After the trains in one direction arrive at the terminal station, these carriages will be disassembled and reconnected to form the trains in another direction. Tthere will also be a depot nearby to store redundant locomotives and carriages. Compared with the fixed composition mode, the flexible composition mode can utilize the carriages more efficiently, which can reduce the purchase cost of carriages in reality.

Figure 2.
Illustration of the operation process in this study.
3.2. Parameters, Decision Variables, and Notations
The model in this section determines the line stops, their frequency, and the number of carriages in a given intercity railway line such that a given fluctuating demand transportation volume, again given by an OD-matrix, can be satisfied as much as possible under the rail line, then the profit can be maximized. We predefine a line pool for each direction, in which each line starts at a terminal station and ends, respectively, at the other terminal station. The line planning problem that was studied in this paper is different from the line planning problem with equilibrium demand, and the additional constraints must be considered when studying the line planning problem with fluctuating demand. The consideration of resource availabilities and the circulating of resources comes naturally and inherently with this problem.
The main assumptions are as follows. First of all, the fluctuating demand is given at an interval of 1 h. If the passengers arriving in a certain period cannot be fully satisfied, the remaining passengers have the probability of waiting for the next period to travel. This is because we have observed that in real life, some passengers may change their trip when they cannot travel at the expected time. Then, we do not assume the OD-matrix to be symmetric. Passenger flows in different directions are often asymmetric during peak periods. This also means we need to simultaneously consider the line planning problem in different directions. Next, we only consider one type of train, and the number of carriages can range from 2 to 16. Lastly, the train is only disassembled and reconnected at the terminal stations.
The notations, input parameters, and variables for the optimization problems that are under consideration are listed in Table 1.

Table 1.
Parameters, decision variables, and notations.
3.3. Mathematical Model
To maximize the revenue of train operation, on the one hand, we should optimize the structure of train operation and reduce the cost of train operation; on the other hand, we need to improve the level of train service and serve more passengers. Therefore, maximizing the revenue of train operation will help to improve the social and economic benefits of railway transportation simultaneously. This paper aims to maximize the revenue of train operations. Suppose the revenue of train operation is obtained by calculating the difference between the train ticket price revenue and train operation cost. In that case, the cost of train operation is divided into the fixed cost of train operation and train operation cost. Therefore, the objective function (line profit) of our problem is described as follows:
Equation (1) is composed of four terms. The first term represents the line revenue. The second and third terms represent the line operation cost in both directions. The last term is a waiting time penalty for passengers who cannot travel in the expected time period and choose the next time period.
The constraints that are considered in the model are as follows:
Equation (2) are used to calculate the number of passengers that are traveling from station to station who are not served in the time period. Equation (3) stipulate a passenger flow of for each OD-pair in the time period. Observe that the variable , constraint (3) can be replaced by constraints (2). Equations (4) and (5) enforce the sufficient transportation capacity on each riding arc. Equations (6) and (7) are upper-bounding the service capacity at each time period. Equations (8) and (9) ensure that a line is operated with at most one frequency and one number of carriages. Equations (10) and (11) guarantee that at least one line with all-stop pattern shall be operated in each period. Equations (12) and (13) are used to calculate the number of reserved carriages that are remaining after the time period. Equations (14) and (15) limit the number of carriages that can be used at each time period. Equation (16) assigns the reserved carriages to upstream and downstream directions. Equations (17)–(20) are domain constraints for all the decision variables.
4. Solution Algorithm
Note that the proposed line planning model with resource constraints becomes NP-hard. Although it is a linear integer programming model that can be solved by commercial solvers, it is not an effective method for real-scale cases. Heuristic algorithms and meta-heuristic algorithms [39,40] are widely used to solve various complex engineering problems. Due to integrating the multi-period strategic-level line planning decision with resource constraints, it will be a challenging task to design neighborhood rules. Fortunately, we can use the linear relaxation technique to deal with the complex constraints first. Then, a round heuristic [41,42] is designed to obtain a satisfied solution to the original problem.
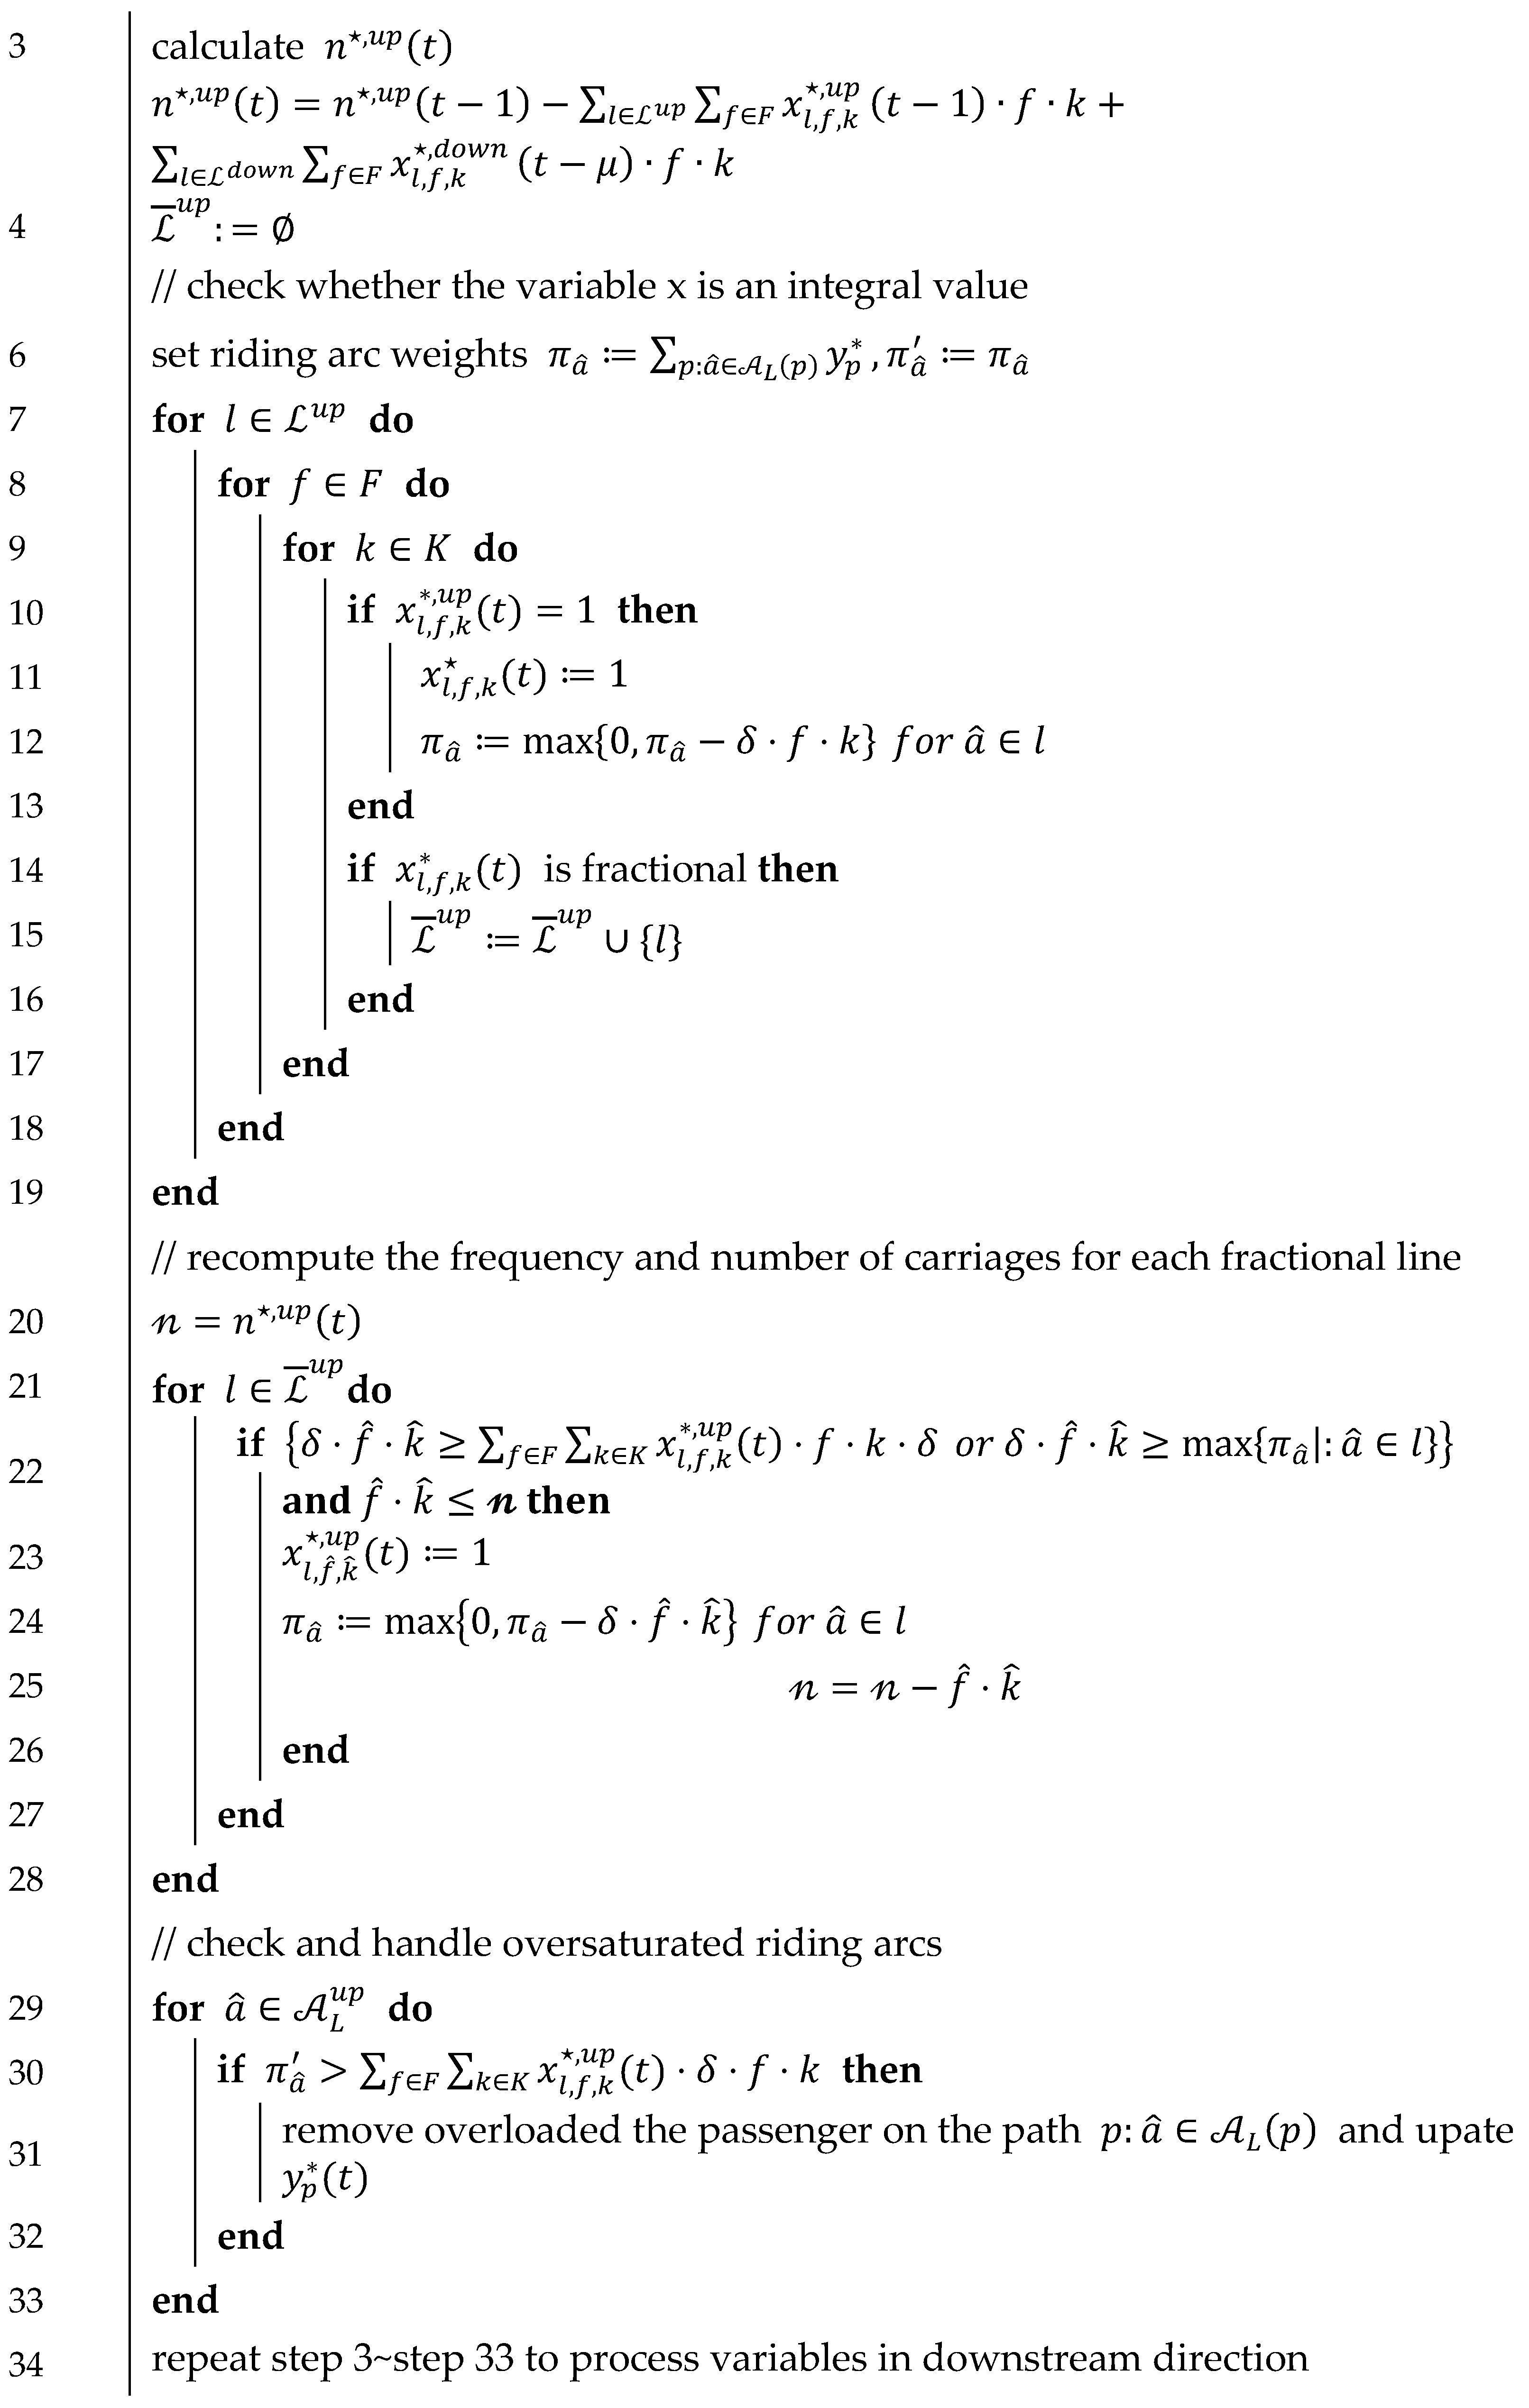
There are four main steps of the proposed heuristic algorithm: first, the linear relaxation solution of the original problem is obtained by a commercial solver, and round the variables of the first time period, ; second, count the number of passengers on each riding arc, and filter out the integer variable and update the number of passengers on each riding arc; third, round the remaining variables according to the remaining resources and passengers on the riding arc, then update the number of passengers on each riding arc; and fourth, check the line capacity and remove overloaded passengers. The detailed Algorithm 1 is described as follows:
| Algorithm 1: The improved round heuristic algorithm. | |
| Input: LP solution | |
| Output: IP solution | |
| 1 | set |
| 2 | for do |
 | |
| 35 | end |
5. Numerical Experiments
This section analyzes the proposed model’s validity based on the historical data of a particular intercity railway in China and formulates the intercity line planning based on the fluctuating passenger demand.
5.1. Scenario Setting
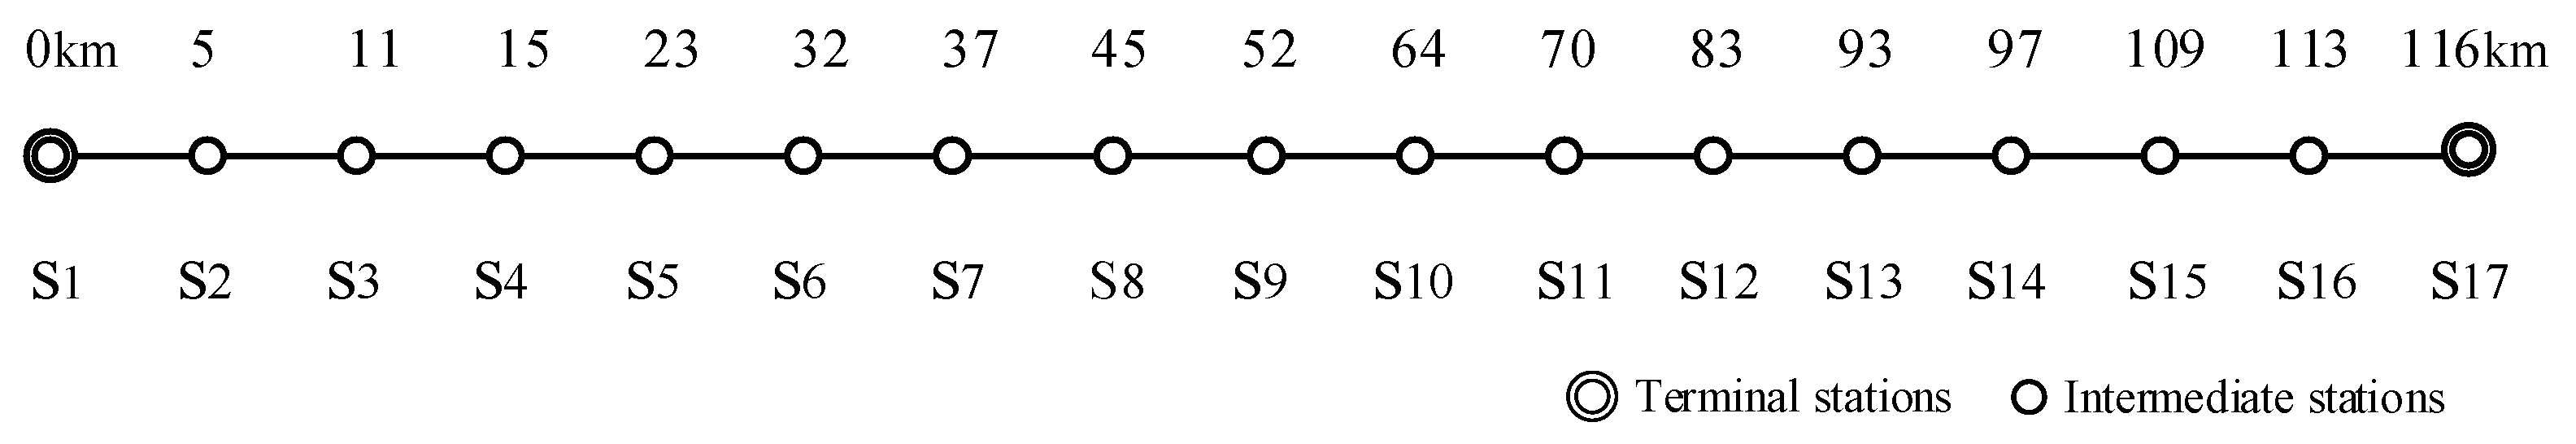
As shown in Figure 3, an intercity railway has 17 stations with a total length of 116 km. Stations 1 and 17 are the terminal stations. Currently, the operating speed is 200 km/h, and the 8-carriage EMU is used for operation with a rated capacity of 557 people. It is equipped with 9 storage lines of the bullet train, which can store 9 groups of 16-carriage EMUs at the same time.

Figure 3.
A certain intercity railway.
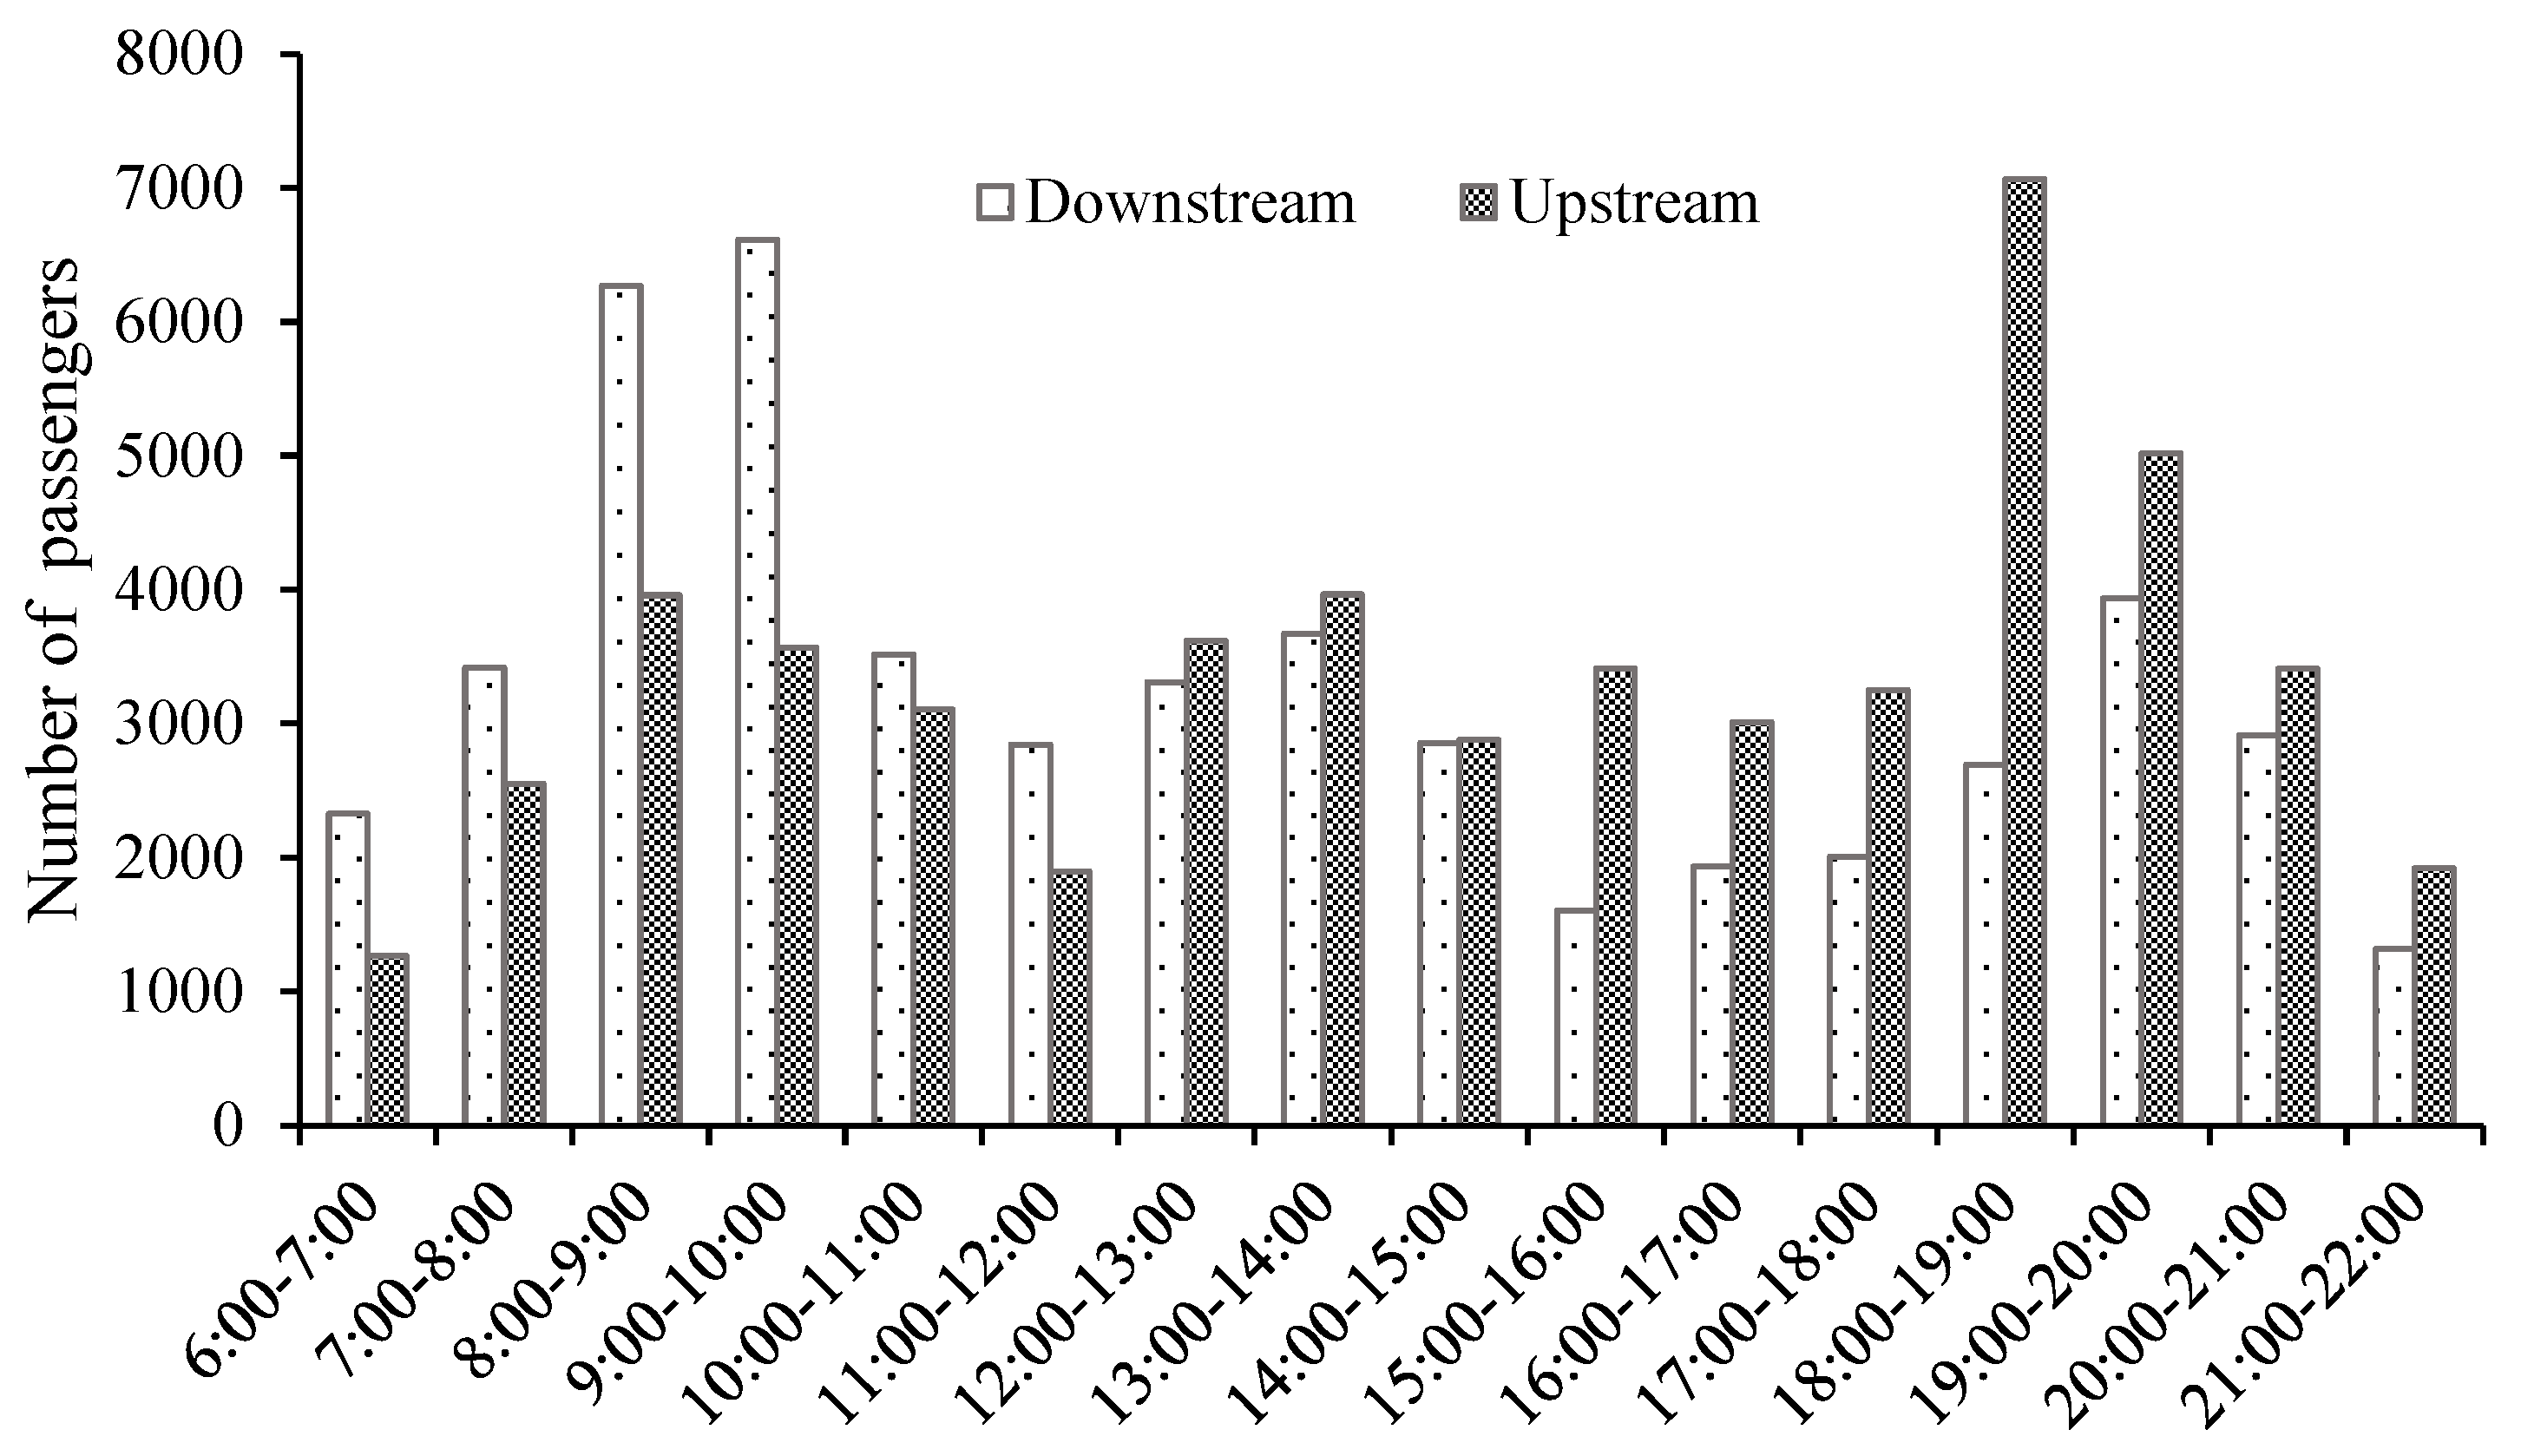
We selected 06:00 to 22:00 as the research period and divided it into 16 periods with 1 h as the duration. The passenger flow for each period is shown in Figure 4, and the total passenger flow is 105,099. According to the passenger flow data and the existing train schedule, a line pool with 78 lines in upstream and downstream directions is constructed, and 890 possible passenger paths are generated. Some alternative trains are shown in Table 2.
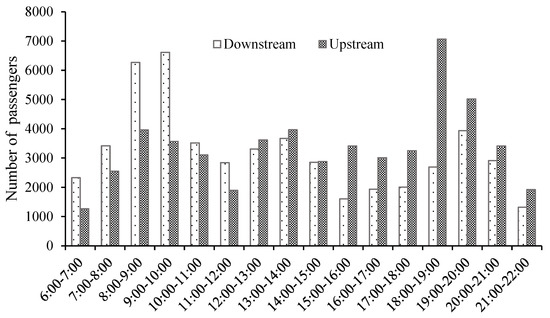
Figure 4.
The distribution of passenger flow.
Table 2.
Set of possible lines.
The basic parameters of the model are set as follows: the passenger-kilometer fare rate of the train is 0.73 RMB/km, the travel speed of the train is 200 km/h, the fixed organization cost of one carriage is 2000 RMB/unit, the operation cost per unit mileage of one carriage is 10 RMB/km, and the fixed number of passengers under one carriage is 118. The unit time value of passengers is 36 RMB/h. The probability that passengers who are not served choose to wait for the next travel period is 0.5. The line capacity is 10 trains/h. Since the intercity railway trains generally use an 8-carriage EMU, the set of the possible number of carriages of a line is set for . The maximum number of reserved carriages is 140. To ensure the quality of service, at least one train runs stop by stop in each running direction and time period. The time that is required for technical operations such as coupling, decoupling, and turnback is one hour.
5.2. Performance Analysis of Algorithm
In this section, we analyze the performance of the improved round heuristic and Gurobi on different datasets. The proposed heuristic algorithm is coded in Python 3.6, and the Gurobi version is 9.1.2. All numerical experiments were completed on a Windows 10 personal computer with Intel(R) Core (TM) i7-6700 CPU 3.40 and 16.0 GB of RAM. As shown in Table 3, we randomly generated five datasets with a different number of OD pairs. What is more, we set the parameter ‘TimeLimit’ of Gurobi to 30 min.
Table 3.
Performance comparison of the improved round heuristic and Gurobi.
As shown in Table 3, several tests indicate that the computation time of Gurobi increases nonlinearly with the number of OD pairs. When there are more than 200 OD pairs, the optimal solution cannot be found within a given time limit. Due to the mature large-scale linear solution technology, the improved round heuristic algorithm can find an acceptable solution in a relatively short time, and the worse gap with Gurobi is 9.45%. With the increase of the OD pairs, the gap gradually decreases. Experiments show that our improved algorithm is more suitable for solving real-scale cases.
5.3. Analysis of the Impact of the Number of Reserved Carriages on Train Operation
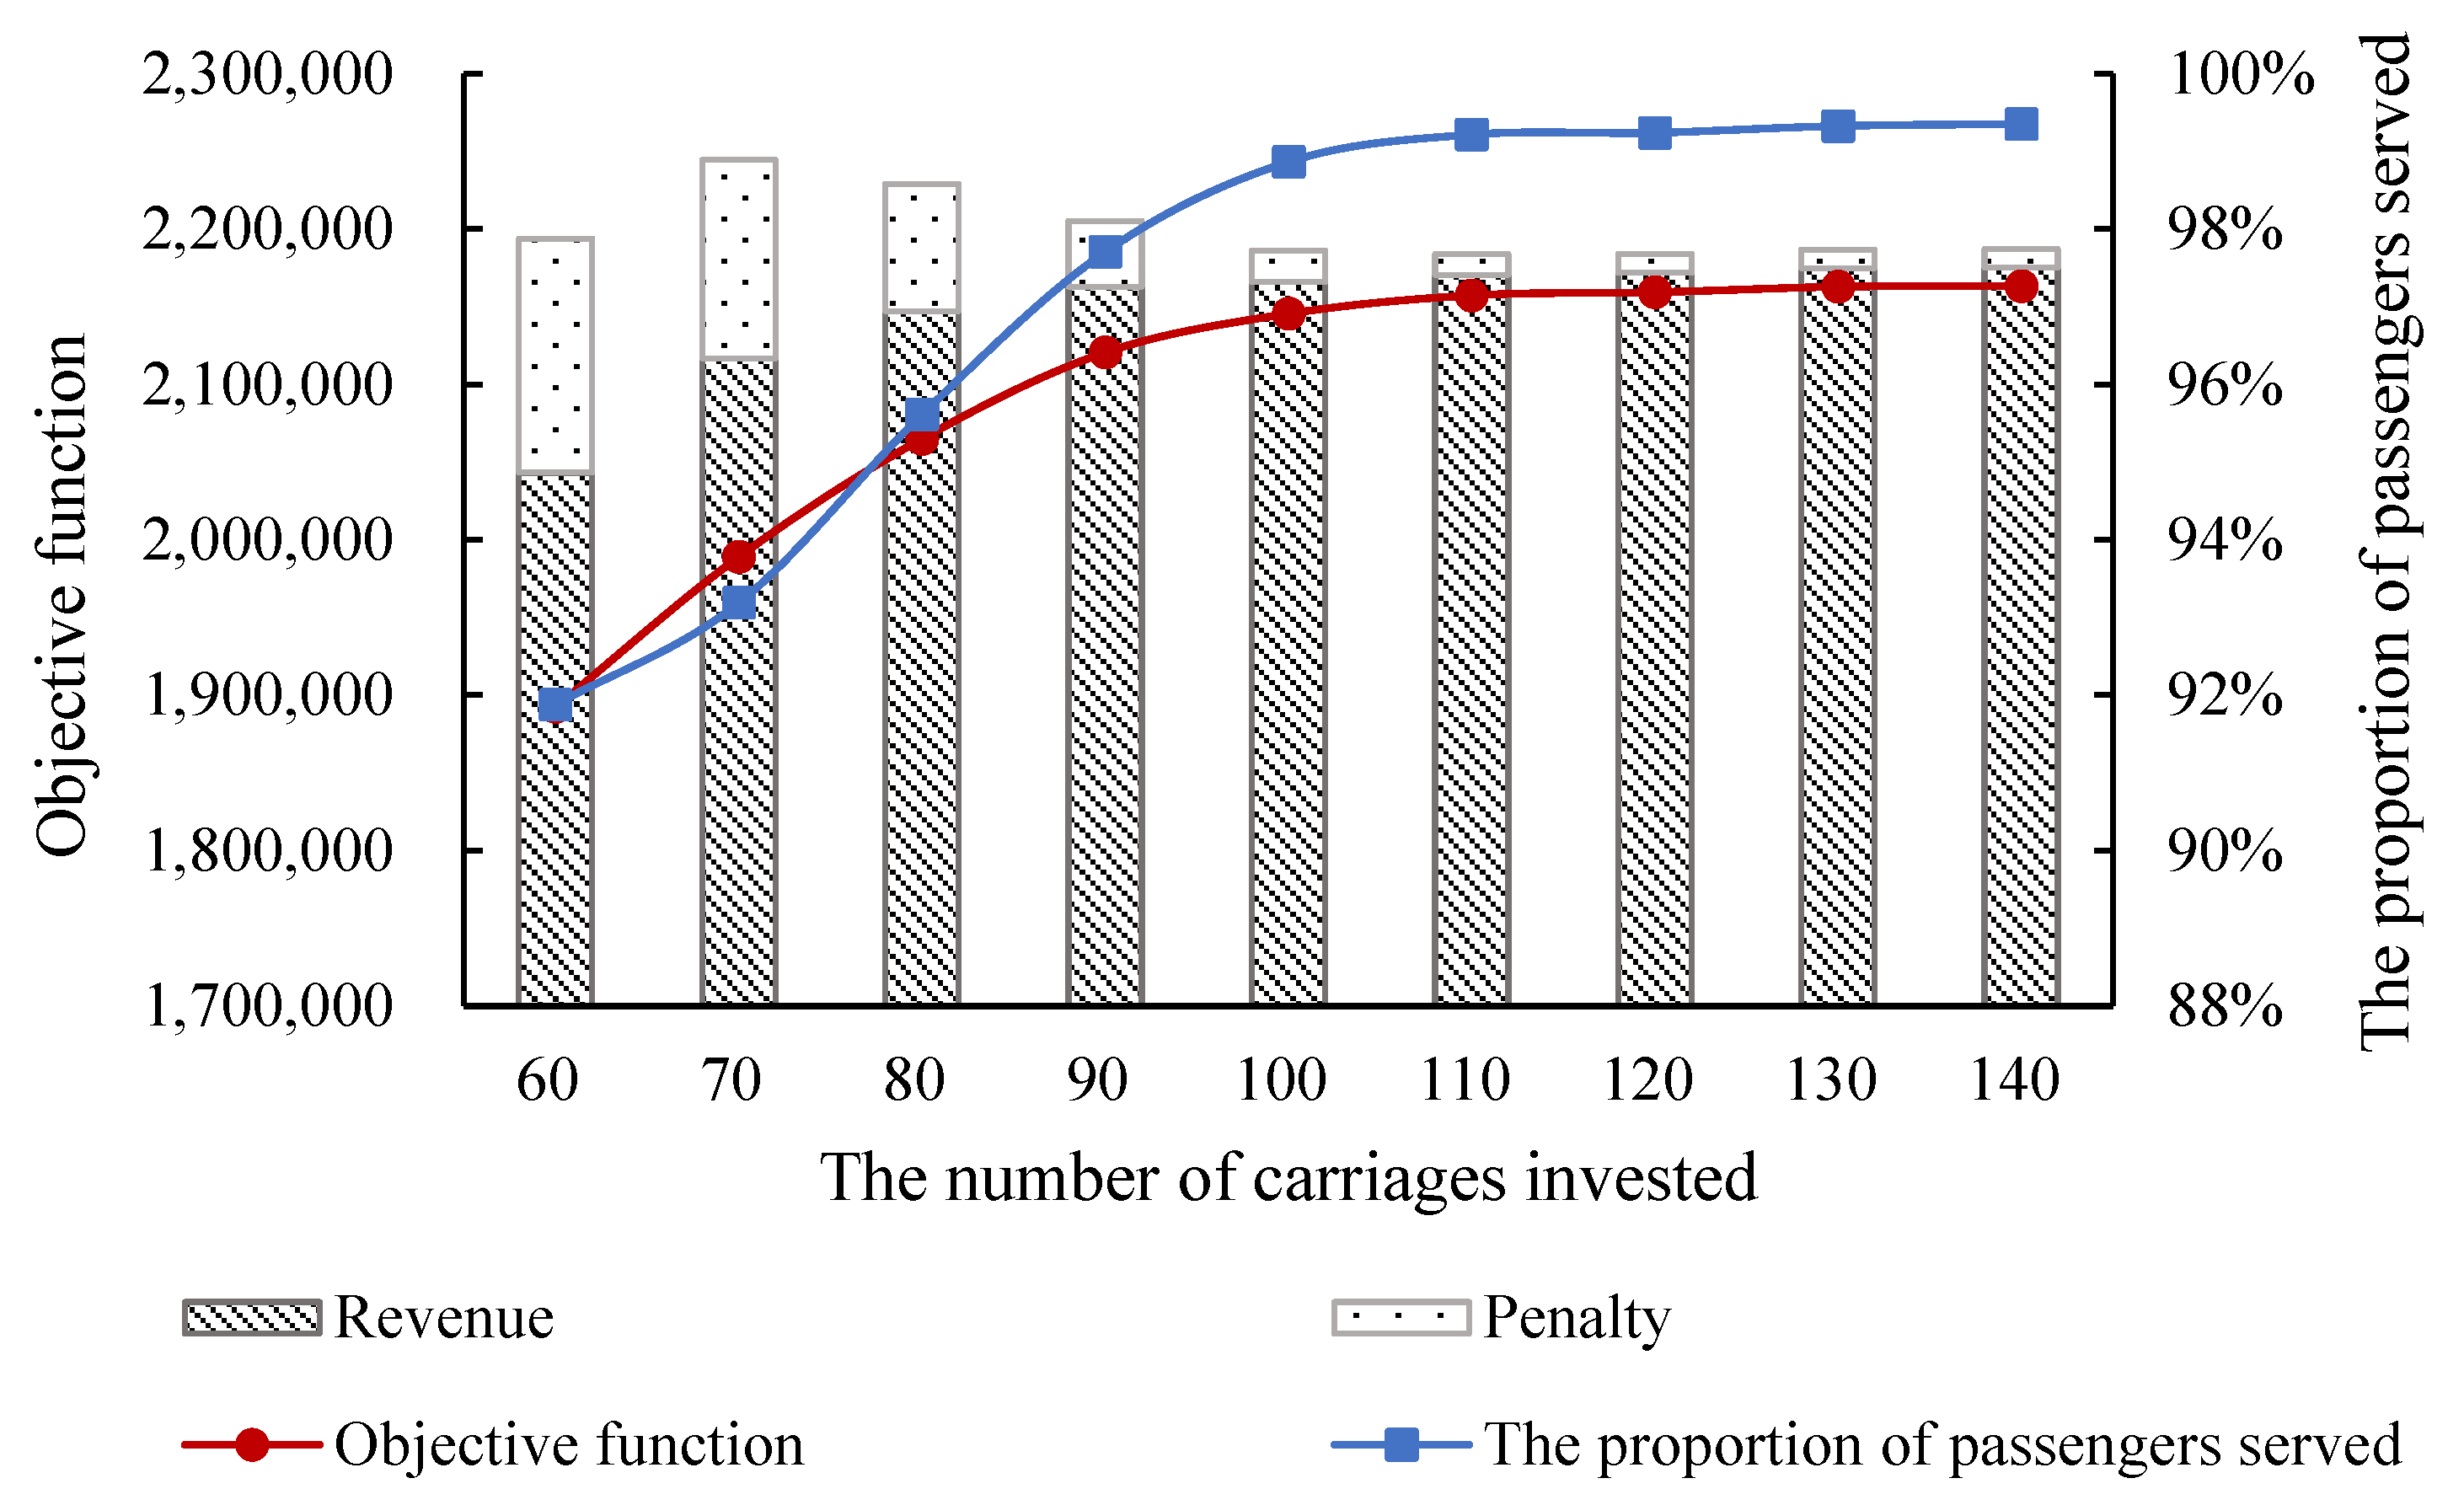
The transportation supply that is provided at each time period of a day should coincide with the distribution of passenger, to meet the travel demand of passenger flow and improve the transportation revenue. Since the fluctuating characteristics of passenger demand will have a great impact on the number of operational trains at each time period and the turnover of trains, the number of reserved carriages will affect the train line planning. In order to analyze the influence of the number of reserved carriages on the train that are running and rail line profit, we set the number of reserved carriages and the solution results are shown in Figure 5.
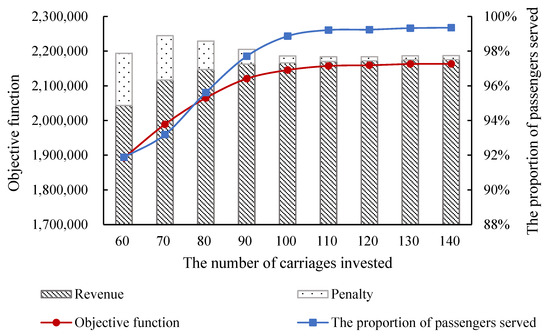
Figure 5.
The trend of the objective function and the proportion of passengers that are served.
As can be seen from Figure 5, with the increase in the number of reserved carriages, the rail line profit and the number of passengers that are served gradually increases, and the waiting time cost of unserved passengers who choose to travel in the next period gradually decreases. This is because when the carriage resources are increased, the impact of resource constraints on the line planning scheme is weakened, and the railway department can dispatch more trains, serve more passengers, and obtain more benefits. It should be noted that the objective function has a significant change when the carriage resources increase from 60 to 110. After that, the increase of carriage resources has little impact on the objective function. This indicates that 60 carriages are not enough to meet the given demand, which limits the railway company to provide a higher level of service. While 110 carriages are put into service, 99.22% of the demand can be served. Therefore, the car resources have little impact on the line planning scheme. Therefore, it is suggested that the railway company should consider investing 110 carriages to obtain satisfactory line revenue.
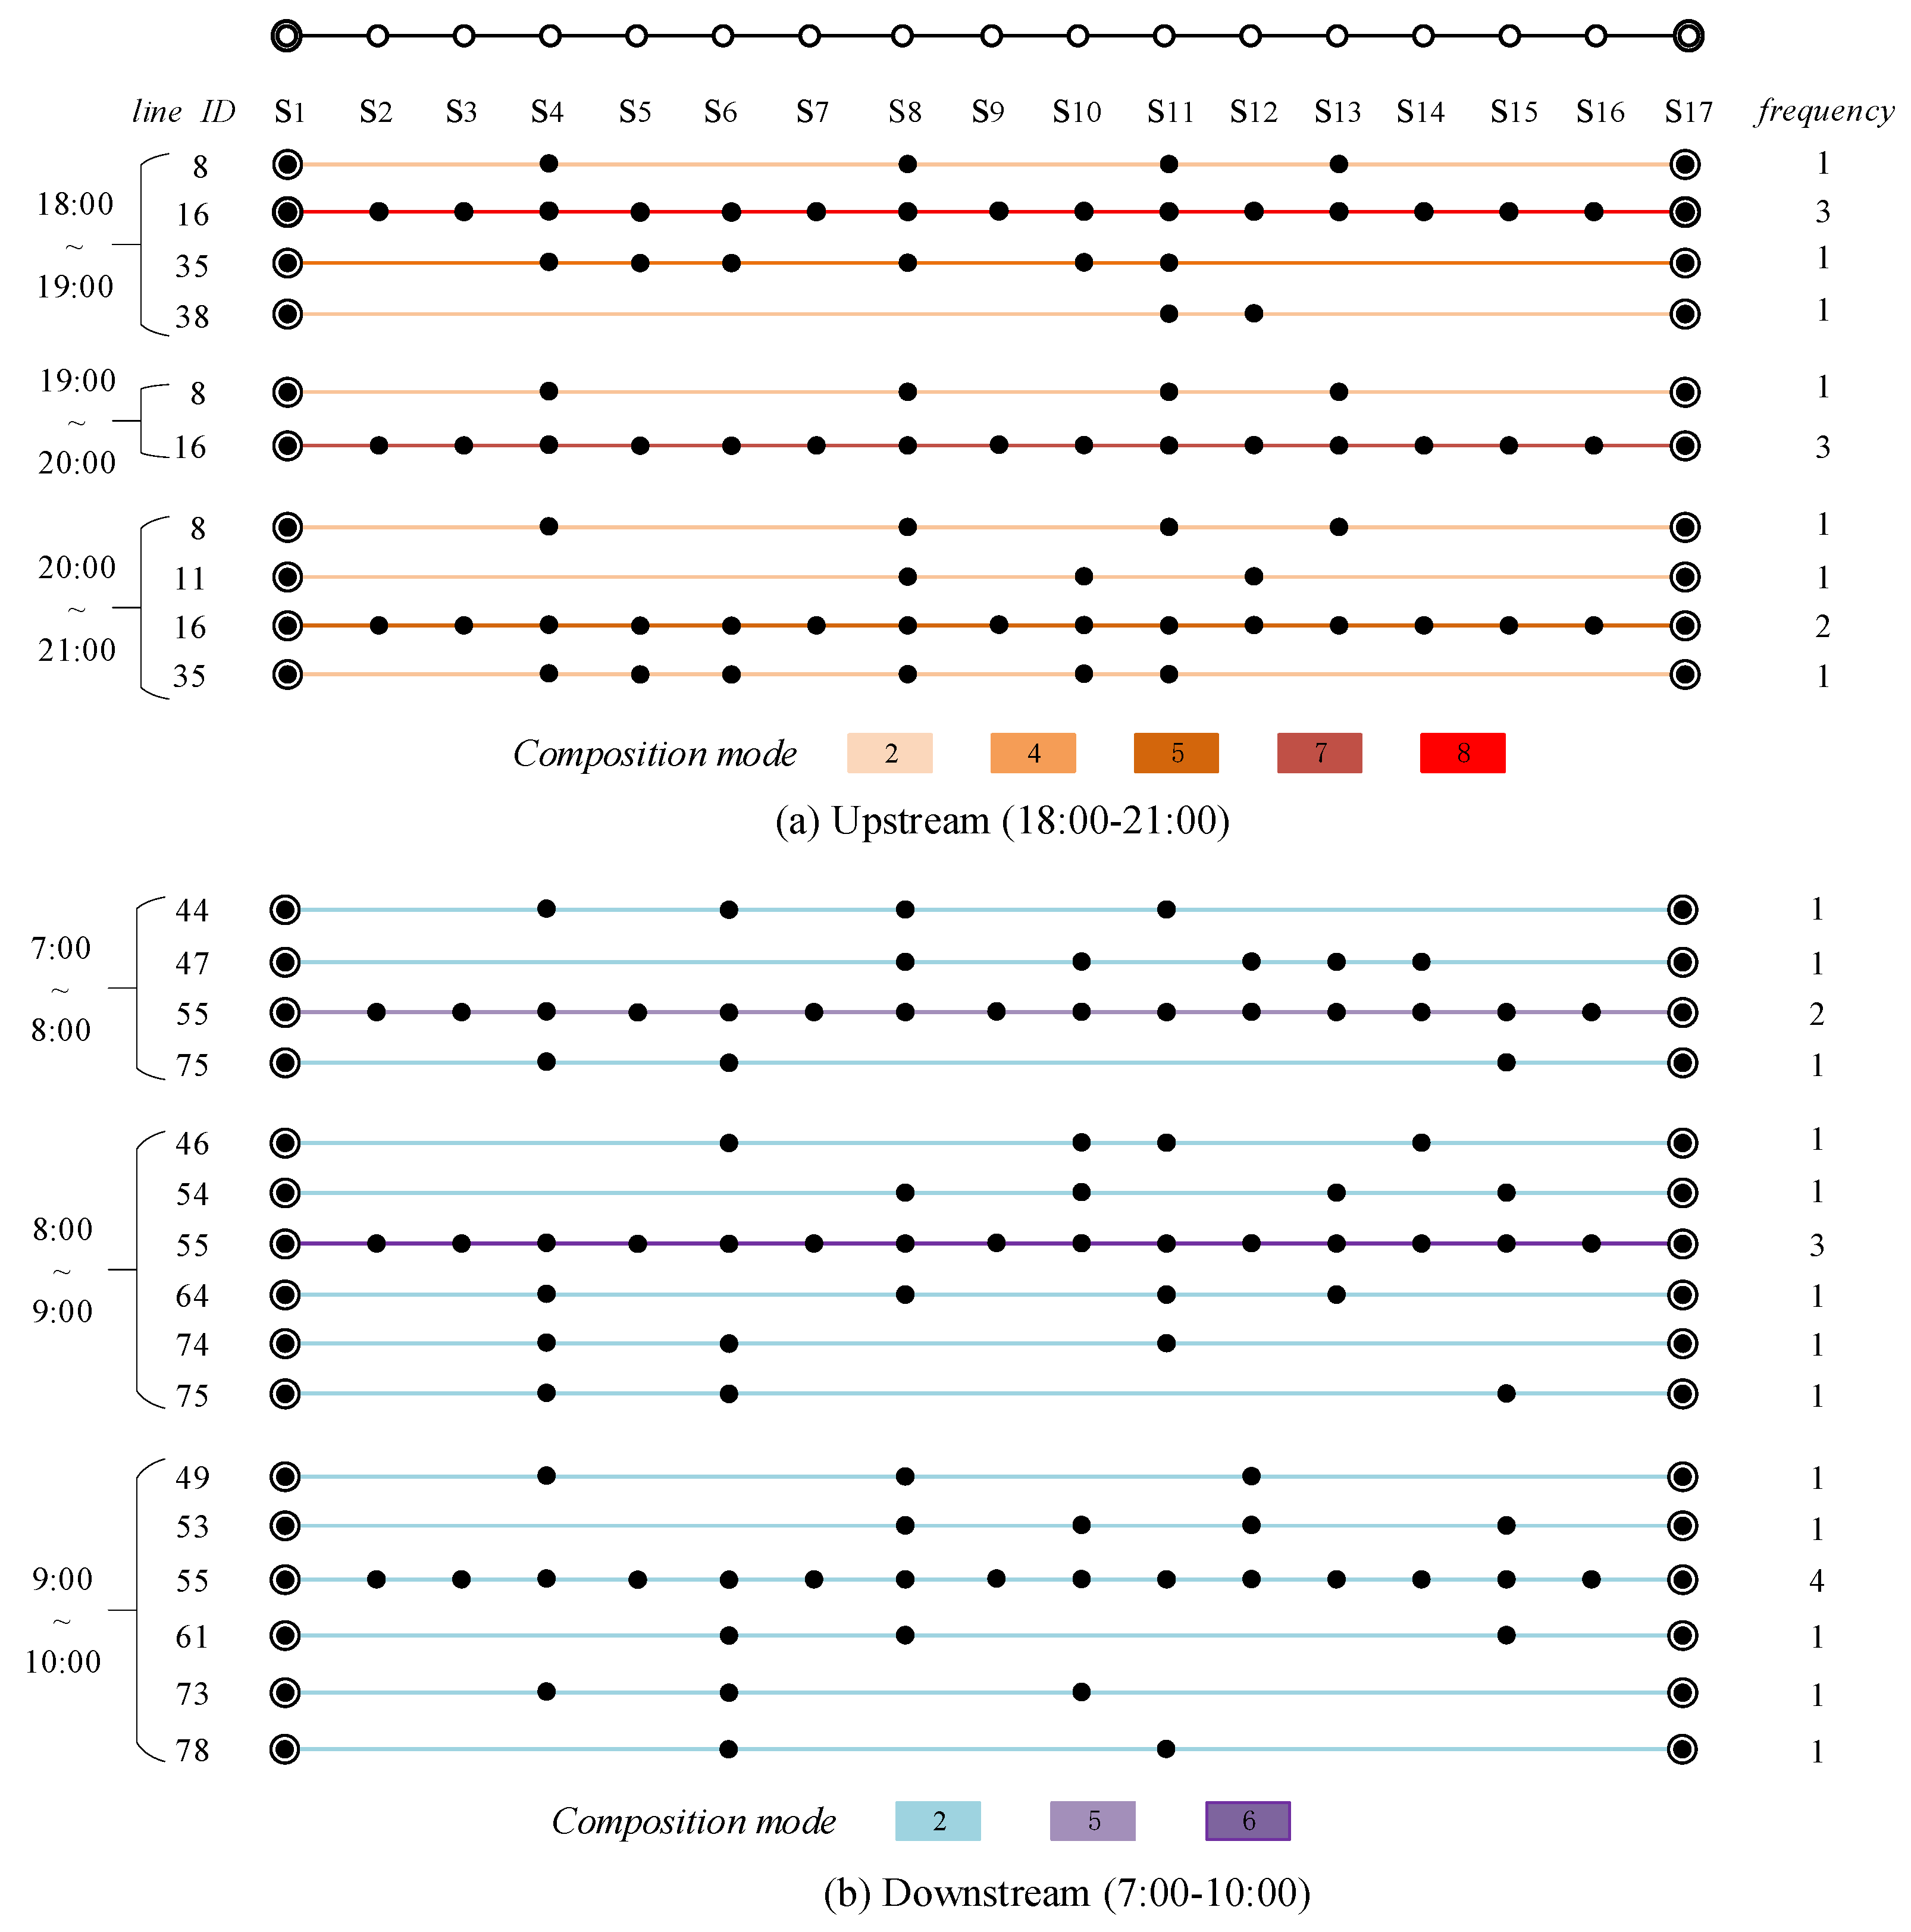
Next, we take as an example and analyze the relevant indicators of the optimized line planning. The corresponding indicators of the all-day train line planning scheme are shown in Table 4. It can be seen from Table 4 that the number of trains in the downstream direction is more than that in the upstream direction, which is caused by the asymmetry of demand. The average load factor of the train in the upstream direction is 70.03%, and that in the downstream direction is 72.20%, indicating that the passenger congestion is low and the trip is comfortable. The detailed line planning scheme of peak hours is shown in Figure 6, in the upstream direction from 18:00 to 21:00 and the downstream direction from 7:00 to 10:00. It can be seen from Figure 6 that the service frequencies of the station S4, S8, and S11 are more than those of other stations in the upstream direction, and that of station S4, S6, and S8 are more than those of other stations in the downstream direction, which is also related to the asymmetry of passenger demand. Thus, the asymmetric characteristics of fluctuating demand must be considered when preparing the multi-cycle line planning scheme.
Table 4.
Indicators of the line planning scheme.
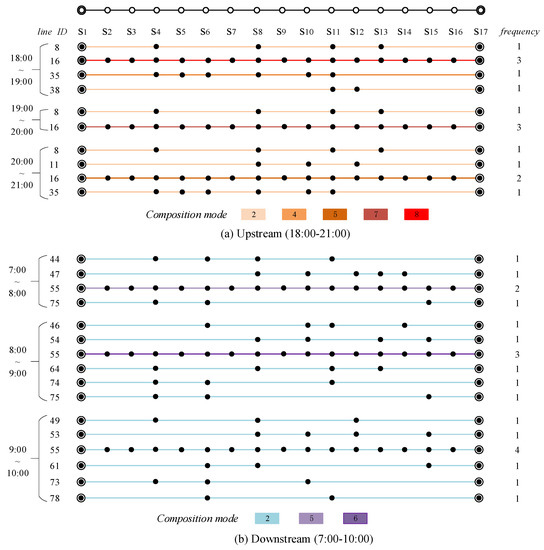
Figure 6.
The line planning scheme in the up and downstream direction during the peak hours.
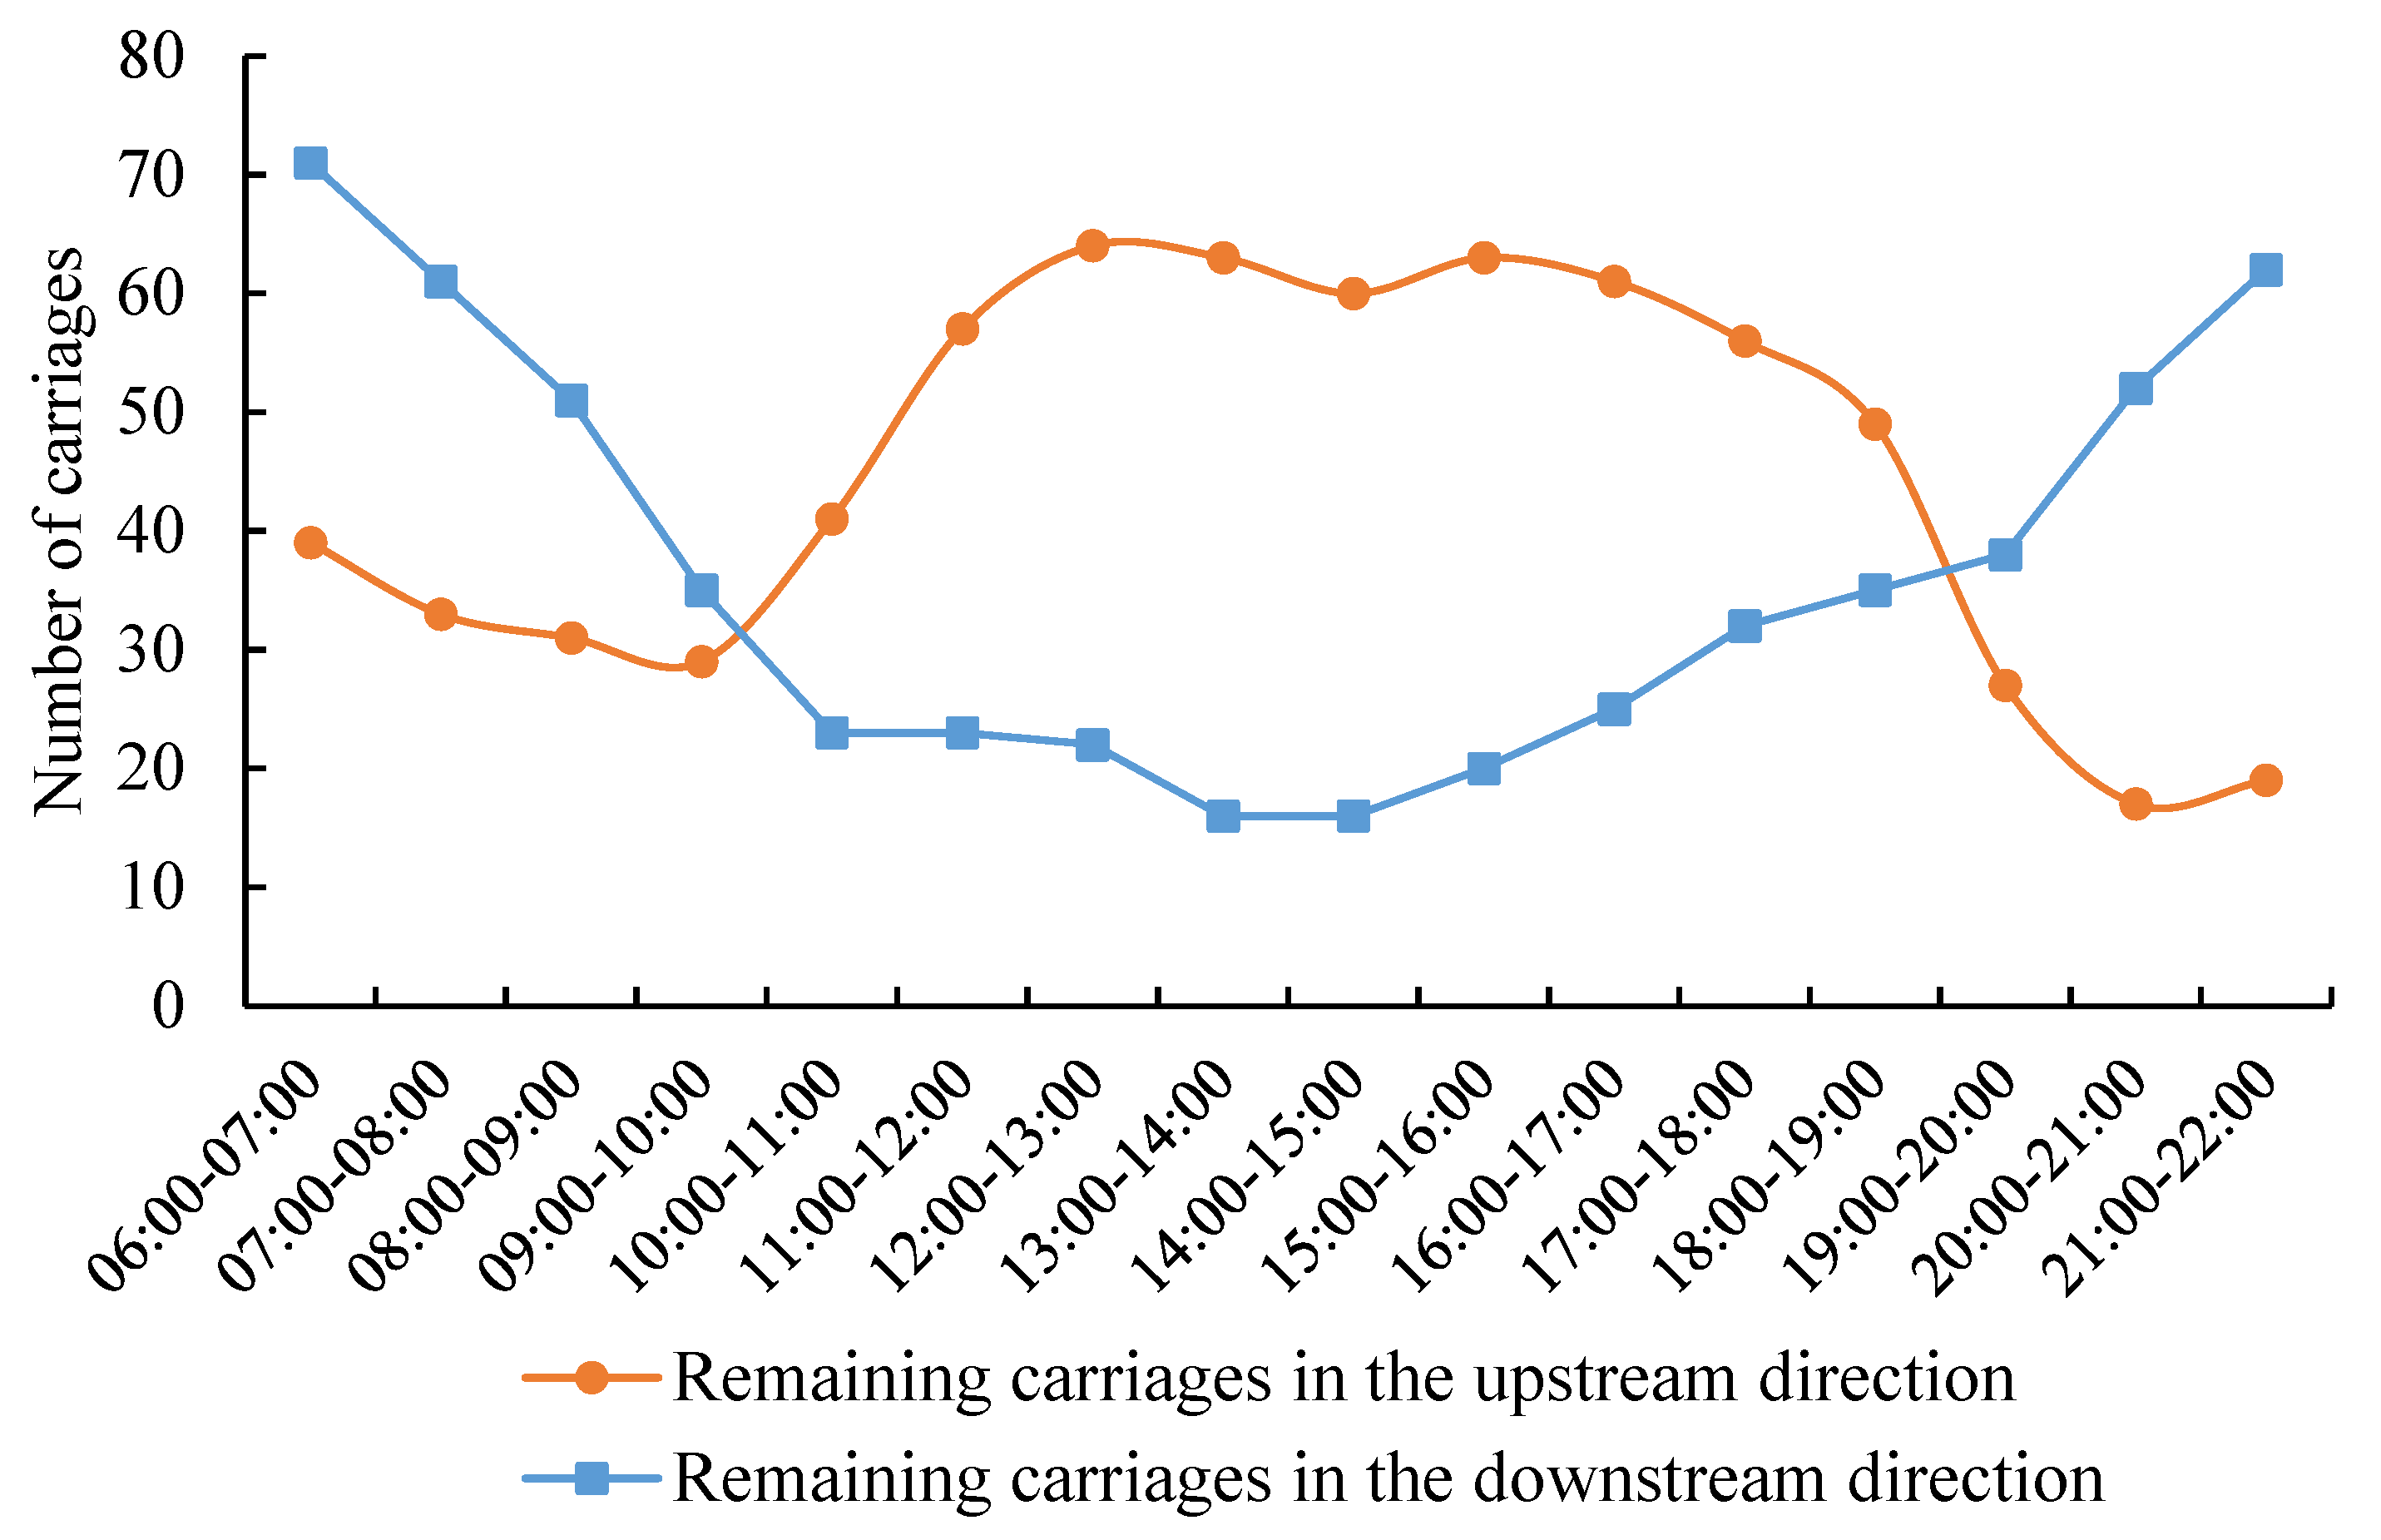
Then, we analyze the transfer of carriage resources. Figure 7 shows the number of remaining carriages in the upstream and downstream directions at each time period. It can be clearly seen from Figure 7 that the changing trend of the number of remaining carriages in the upward direction and the downward direction is opposite. We can find that the maximum slopes of the two curves do not appear at the same time period because the carriages can be reused only after coupling, decoupling, and cleaning. With the help of the remaining carriage curves, we can determine when to replenish the carriages to guarantee the carriages can be dispatched.
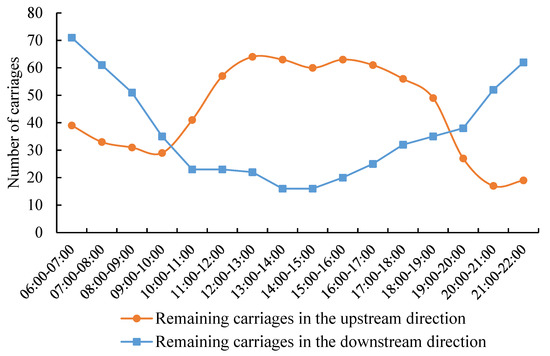
Figure 7.
The number of remaining carriages in each period.
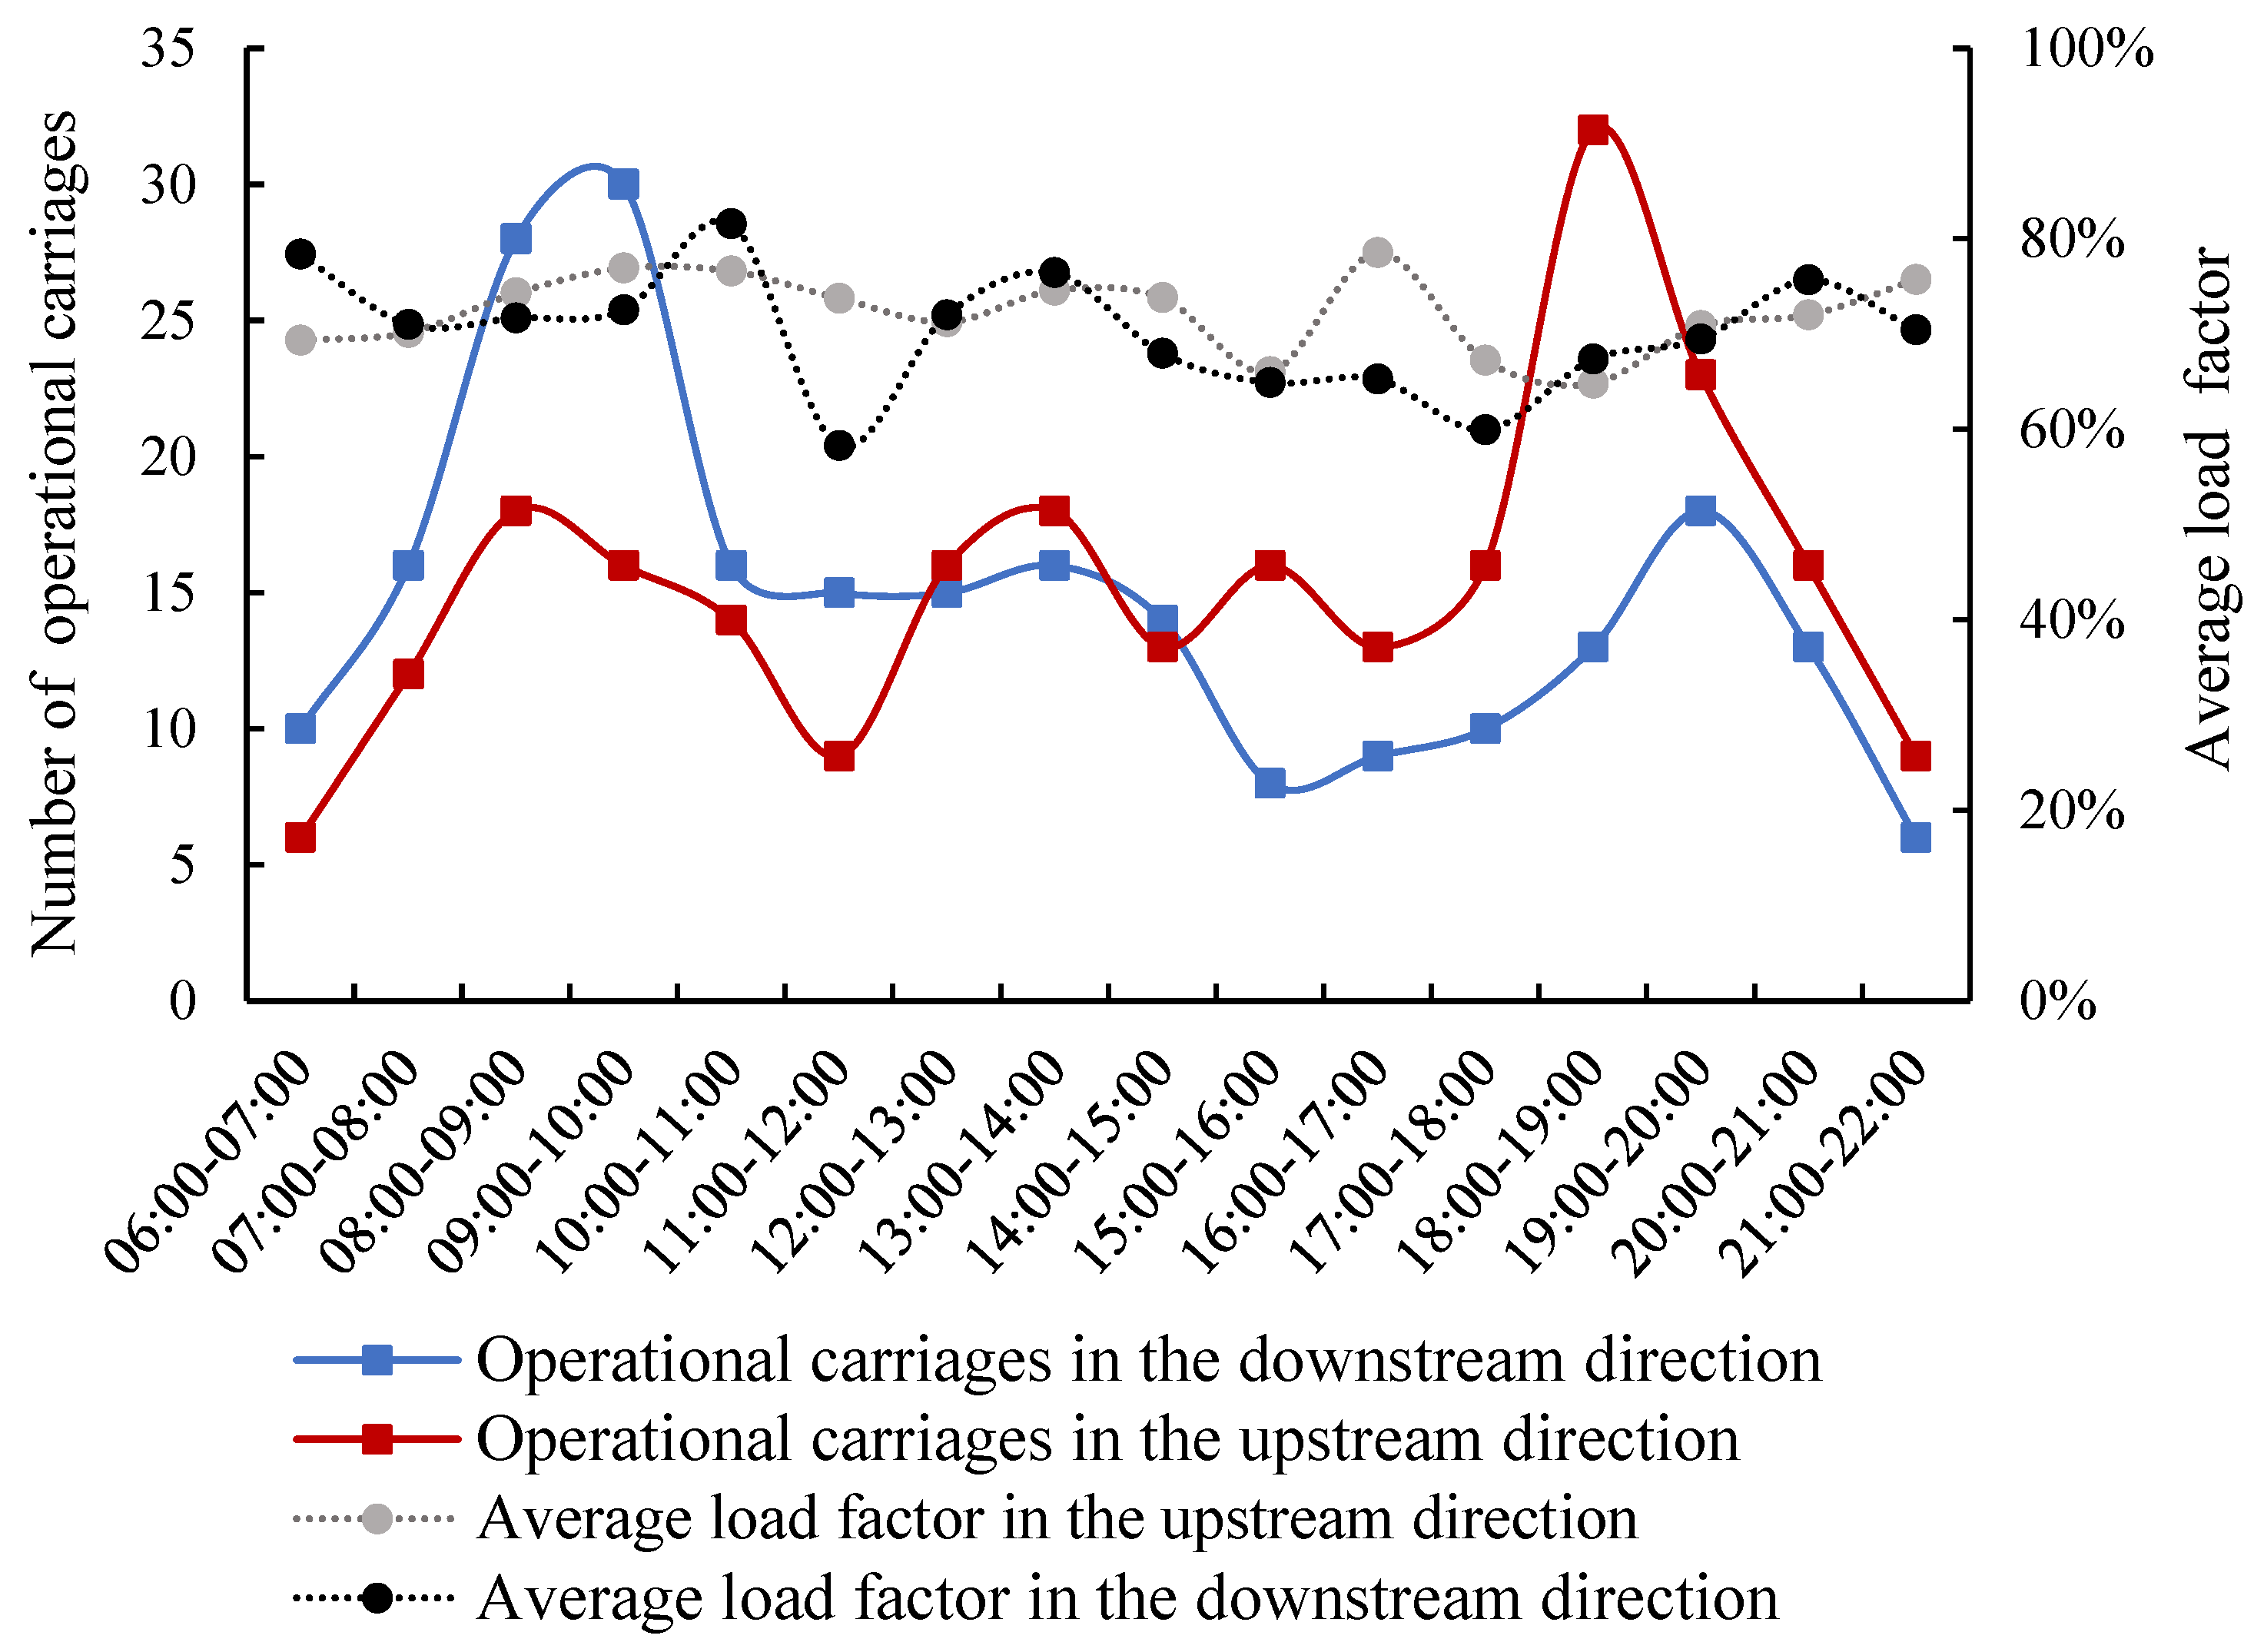
Then, the actual number of carriages that are put into operation at each time period and the average train passenger load factor are shown in Figure 8. By analyzing the curves, it is found that the number of operated carriages from 8:00 to 10:00 in the downstream direction is more than in other time periods, and the number of operated carriages from 18:00 to 20:00 in the upstream direction is more than in other time periods, which is consistent with the changing trend of passenger flow at that time period. According to the average passenger load factor curve of each time period, the average train load factor is maintained between 65% and 82%, which effectively avoids the insufficient transportation capacity in the peak time period and the excessive waste of transportation capacity in the non-peak time period. In other words, the obtained optimization line planning can better adapt to the passenger flow demand and provide a good service level.
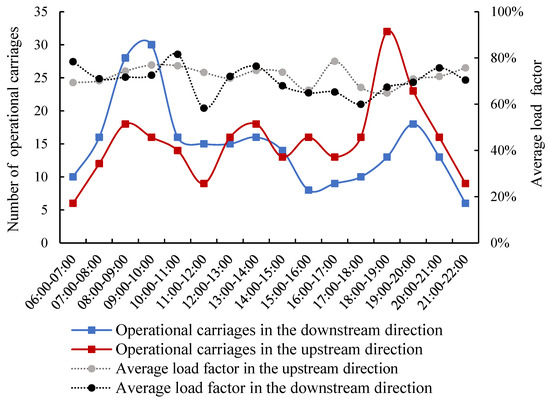
Figure 8.
The number of operational carriages and average load factor at each time period.
5.4. Comparison of Flexible and Fixed Composition Mode
In this section, we set as a constant, , to obtain a multi-period line planning model under the fixed composition and compared it with our model to illustrate that flexible composition is more suitable for fluctuating demand. Table 5 summarizes the influence of the two composition modes on the relevant indicators of the train line planning under the conditions of relatively tight () and relatively sufficient () reserved carriage resources. It can be seen that under the same conditions of train carriage resources: (i) the frequency under the flexible composition mode is about twice as much that under the fixed composition mode, and the service capacity can be increased by more than 2%, and the economic benefit can be increased by more than 1.9%; (ii) the number of trains in the fixed composition mode is relatively small, and the choice of passengers is more concentrated, so the average train passenger load ratio is slightly higher than that of the flexible composition mode. This result confirms that the flexible composition mode can help to improve the social and economic benefits simultaneously.
Table 5.
Indicators of the line planning.
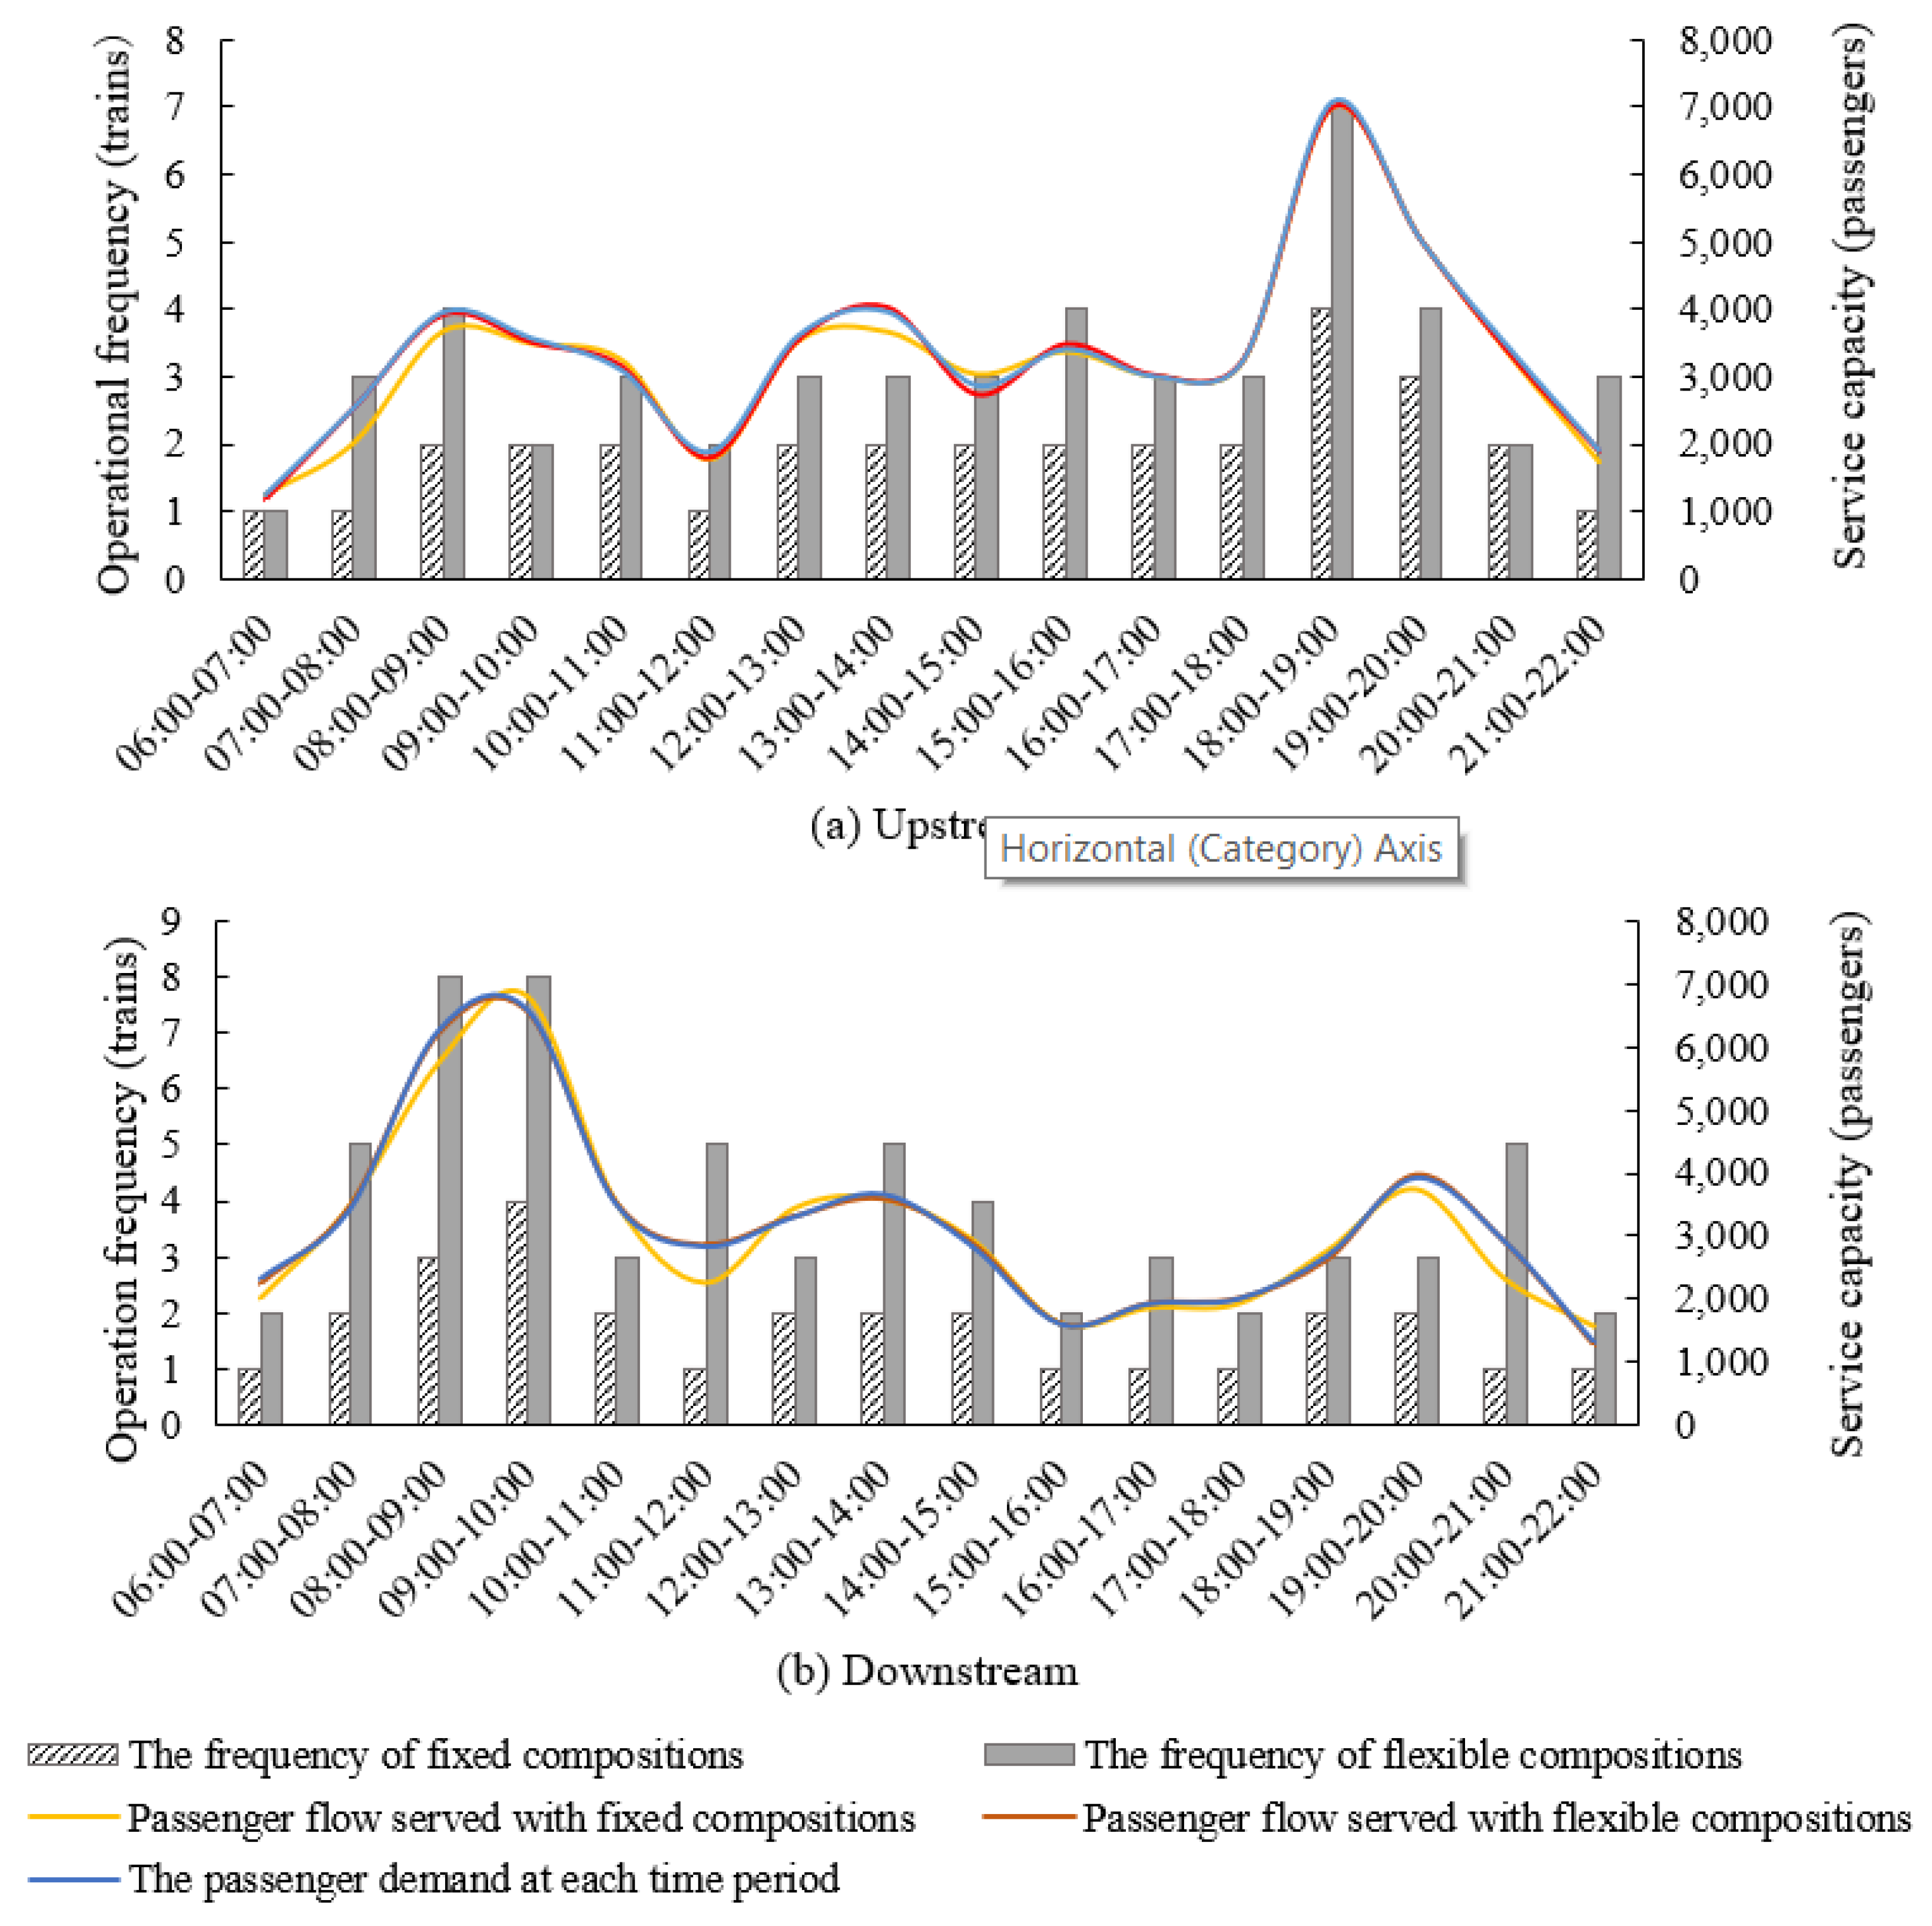
Figure 9 shows the comparison of the frequency and service capacity at each time period under different composition modes when . We can see that:
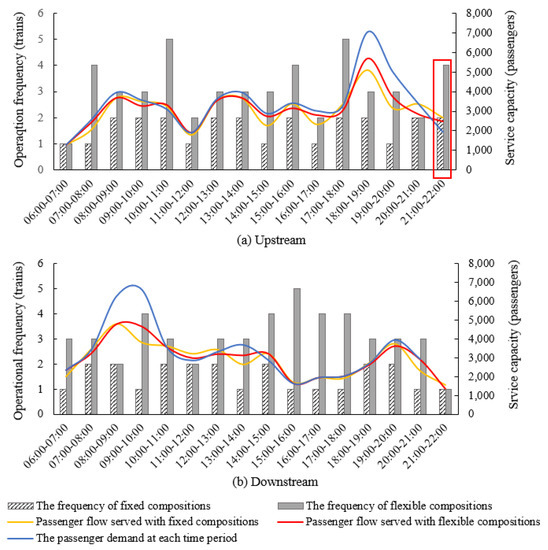
Figure 9.
The operational frequency and service capacity analysis in the upstream and downstream direction when N = 60.
- (1)
- When the flexible composition mode is adopted, the frequency of each time period is significantly higher than that of the fixed composition mode, and the passenger service capacity, especially in the peak hours of passenger flow, is also significantly higher than that of the fixed composition mode. The data show that the utilization efficiency of carriages of the flexible composition mode is higher than that of the fixed composition mode. The average transportation of each carriage under the flexible composition mode is 1609.35 person-times/day, which is higher than 1574.15 person-times/day under the fixed composition mode. The reason is that the number of remaining carriages in the same period is more than that of the fixed composition mode, and the number of carriages of the trains that are dispatched under the flexible composition mode is not unique, while that under the fixed marshalling mode must be 8. Thus, the utilization efficiency under the flexible composition mode is higher. For example, during the time period from 18:00 to 19:00 in the upstream direction, when the flexible composition mode is adopted, the number of remaining carriages is 21, so three trains with seven carriages can be operated, while when the fixed composition mode is adopted, the number of remaining carriages is 16, so only two trains with eight carriages can be operated.
- (2)
- Compared with the fixed composition mode, the train frequency under the flexible marshalling mode is more susceptible to the fluctuation of passenger flow. This is because the line capacity under flexible marshalling is more flexible.
It should be noted that the blue curve in Figure 9 is the hourly arrival passenger flow curve, which represents the number of passengers who arrive at the station at each time period and choose the intercity railway to travel. If the passengers in a certain period cannot be fully served due to insufficient transport capacity, the unserved passengers will choose to wait for the next time period with probability ε. Therefore, the number of passengers that are served in the next time period may be greater than the number of passengers that are arriving in the current period, which usually occurs after the peak period of passenger flow. Take the red rectangular box in Figure 9 as an example, when the flexible composition mode is adopted, 1594 people are not served during the period from 20:00 to 21:00 due to the capacity limit, of which 797 (ε = 0.5) passengers choose to travel in the next time period. The number of arriving passengers from 21:00 to 22:00 is 1918 (the blue line). Therefore, the total number of passengers during the period from 21:00 to 22:00 should be 2715, while the actual number of passengers which can be served is 2472 (the red line) due to the limited transport capacity.
Figure 10 shows the comparison of the line running frequency and service passenger flow at each time period under different composition modes when . Compared with the condition that the carriage resources are relatively tight, the service capacity that is provided by different composition modes at each time period is basically the same, but the frequency of departure in the flexible composition mode is still higher than that in the fixed composition mode.
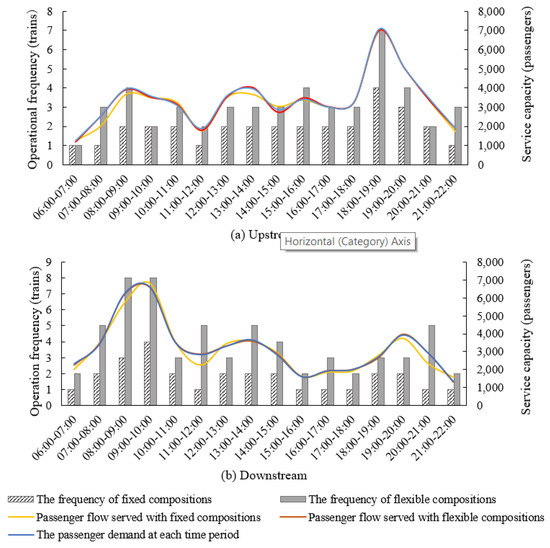
Figure 10.
The operational frequency and service capacity analysis in the upstream and downstream direction when N = 140.
Based on the above analysis, the flexible composition mode is more conducive to adapting to the fluctuation of passenger flow, which can improve the matching degree of the train running structure and passenger flow at each time period, improve the utilization efficiency of carriage resources, and increase the social and economic benefits. Moreover, the advantages of the flexible composition mode are more obvious under the condition of tight carriage resources.
6. Conclusions and Further Research
In this paper, the train line planning problem of the intercity railway considering the flexible composition mode and transfer of the resources is studied to meet the fluctuating demand. Considering the influence of fluctuating demand on the train running structure and the utilization efficiency of the train carriage resources, the optimization model of multi-period train line planning is established with the maximization of train line benefit as the optimization objective. Based on the constraints of the classical travel scheme, the resource turnover constraints of the carriages are added, and the passenger waiting situation is described in the form of the passenger service probability parameter, which ensures the practical feasibility of the operational plan. The example shows that the optimized line planning can improve the fitness of transportation supply and passenger flow demand to a certain extent and improve the operation efficiency of railway and passenger service level. The new approach proposes the consideration of multi-period line planning with flexible compositions which can increase line profit and service more passengers, especially when resources are limited.
The proposed method is more applicable to a single intercity railway, that is, there is only one train route. For intercity lines or networks with more than two terminals, a more generalized model framework needs to be developed. In practice, for real engineering railway development studies, more factors, such as train types and passenger travel time, should be considered; we plan to address these in the future. This also includes the development of a new efficient heuristic algorithm for solving very large instances of the model. After extending our work in these directions, the main limitations that still affect the model will have been overcome.
Author Contributions
Conceptualization, C.Z., P.W., X.Z. and J.C.; methodology, C.Z., X.Z. and Z.W.; software, C.Z. and Z.C.; validation, C.Z., Z.C., X.Z. and Z.W.; formal analysis, P.W., Z.C. and Z.W.; investigation, P.W., X.Z. and Z.C.; resources, J.C.; data curation, J.C.; writing—original draft preparation, C.Z. and P.W.; writing—review and editing, J.C., Z.C., X.Z. and Z.W.; visualization, C.Z. and X.Z.; supervision, C.Z., X.Z. and Z.W.; project administration, J.C. and Z.W.; funding acquisition, X.Z., J.C., and Z.W. All authors have read and agreed to the published version of the manuscript.
Funding
Research Supported by the Fundamental Research Funds for the Central Universities (Science and technology leading talent team project, No. 2022JBQY005).
Data Availability Statement
Not applicable.
Acknowledgments
Many thanks to Tan Liu and Zhou Zhou for their help and support on this paper.
Conflicts of Interest
The authors declare no conflict of interest.
References
- Alfieri, A.; Groot, R.; Kroon, L.G.; Schrijver, L. Efficient Circulation of Railway Rolling Stock. Transp. Sci. 2006, 40, 78–391. [Google Scholar] [CrossRef]
- Fioole, P.J.; Kroon, L.; Maroti, G.; Schrijver, A. A rolling stock circulation model for combining and splitting of passenger trains. Eur. J. Oper. Res. 2006, 174, 1281–1297. [Google Scholar] [CrossRef]
- Peeters, M.; Kroon, L. Circulation of railway rolling stock: A branch-and-price approach. Comput. Oper. Res. 2008, 35, 538–556. [Google Scholar] [CrossRef]
- Zhou, H.; Qi, J.; Yang, L.; Shi, J.; Pan, H.; Gao, Y. Joint optimization of train timetabling and rolling stock circulation planning: A novel flexible train composition mode. Transp. Res. Part B Methodol. 2022, 162, 352–385. [Google Scholar] [CrossRef]
- Marin, M.; Janene, P. Sustainable Rail Transport; Springer: Cham, Switzerland, 2020. [Google Scholar]
- Şahin, G.; Ahmadi Digehsara, A.; Borndörfer, R.; Schlechte, T. Multi-period line planning with resource transfers. Transp. Res. Part C Emerg. Technol. 2020, 119, 102726. [Google Scholar] [CrossRef]
- Zhou, W.L.; Liu, X.H.; Jiang, M. Optimization of Train Plan on Intercity Railway Based on Candidate Train Set and Elastic Demand. J. China Railw. Soc. 2020, 42, 1–10. [Google Scholar]
- Schöbel, A. Line planning in public transportation: Models and methods. OR Spectr. 2012, 34, 491–510. [Google Scholar] [CrossRef]
- Kim, H.Y.; Wunneburger, D.; Neuman, M.; An, S.Y. Optimizing high-speed rail routes using a Spatial Decision Support System (SDSS): The Texas Urban Triangle(TUT) case. J. Transp. Geogr. 2014, 34, 194–201. [Google Scholar] [CrossRef]
- Guan, J.; Yang, H.; Wirasinghe, S. Simultaneous optimization of transit line configuration and passenger line assignment. Transp. Res. Part B Methodol. Methodol. 2006, 40, 885–902. [Google Scholar] [CrossRef]
- Szeto, W.Y.; Jiang, Y. Transit route and frequency design: Bi-level modeling and hybrid artificial bee colony algorithm approach. Transp. Res. Part B Methodol. 2014, 67, 235–263. [Google Scholar] [CrossRef]
- Fu, H.; Nie, L.; Meng, L.; Sperry, B.; He, Z. Train stop scheduling in a highspeed rail network by utilizing a two-stage approach. Math. Probl. Eng. 2012, 2012, 579130. [Google Scholar] [CrossRef] [Green Version]
- Ulusoy, Y.; Chien, S.; Wei, C. Optimal all-stop, short-turn and express transit services under heterogeneous demand. Transp. Res. Rec. 2010, 2197, 8–18. [Google Scholar] [CrossRef]
- Fu, H.; Nie, L.; Meng, L.; Sperry, B.; He, Z. A hierarchical line planning approach for a large-scale high-speed rail network: The China case. Transp. Res. Part A Policy Pract. 2015, 75, 61–83. [Google Scholar] [CrossRef]
- Shi, F.; Zhou, W.; Chen, Y.; Deng, L. Optimization study on passenger train plans with elastic demands. J. China Railw. Soc. 2008, 30, 1–6. [Google Scholar]
- Anthony, R.N. Planning and Control Systems: A Framework for Analysis; Division of Research, Graduate School of Business Administration, Harvard University: Cambridge, MA, USA, 1965. [Google Scholar]
- Goerigk, M.; Schachtebeck, M.; Schöbel, A. Evaluating line concepts using travel times and robustness. Public Transp. 2013, 5, 267–284. [Google Scholar] [CrossRef]
- Fu, H.; Nie, L.; Yang, H.; Tong, L. Research on the Method for Optimization of Candiate-Train-set Based Train Operation Plans for High-speed Railways. J. China Railw. Soc. 2010, 32, 1–8. [Google Scholar]
- He, Y.Q.; Zhang, H.Z.; Mao, B.H.; Chen, T.S. Multiobjective Bi-level Programming Model of Making Train Working Plan for Passenger-only Line. J. China Railw. Soc. 2006, 28, 6–10. [Google Scholar]
- Borndrfer, R.; Arslan, O.; Elijazyfer, Z.; Güler, H.; Schlechte, T. Line Planning on Path Networks with Application to the Istanbul Metrobüs. In Operations Research Proceedings; Springer: Cham, Switzerland, 2018; pp. 235–241. [Google Scholar]
- Deng, L.; Zeng, Q.; Gao, W.; Zhou, W. Research on Train Plan of Urban Rail Transit with Elastic Demand. J. China Railw. Soc. 2012, 34, 16–25. [Google Scholar]
- Feng, S.; Deng, L.; Shan, X. Time-dependent Demand Oriented Line Planning Optimization for the High-speed Railway. J. Transp. Syst. Eng. Inf. Technol. 2016, 16, 110–116. [Google Scholar] [CrossRef]
- Qin, J.; Tan, Y.; Zhang, W.; Shen, C.; Zhao, C. Train Planning Optimization for intercity Railway Based on Space-time Network. J. China Railw. Soc. 2020, 42, 1–10. [Google Scholar]
- Long, P.; Shi, F.; Hu, X.; Xu, B. The collaborative optimization of multi-day line plannings for high-speed railway. J. Railw. Sci. Eng. 2019, 16, 310–318. [Google Scholar] [CrossRef]
- Zhao, S.; Wu, R.; Shi, F. A line planning approach for high-speed railway network with time-varying demand. Comput. Ind. Eng. 2021, 160, 107547. [Google Scholar] [CrossRef]
- Schrage, L. A Guide to Optimization-Based Multiperiod Planning. In Recent Advances in Optimization and Modeling of Contemporary Problems; INFORMS: Catonsville, MD, USA, 2018; pp. 50–63. [Google Scholar] [CrossRef]
- Caprara, A.; Kroon, L.G.; Monaci, M.; Peeters, M.; Toth, P. Passenger Railway Optimization. Handb. Oper. Res. Manag. Sci. 2007, 14, 129–187. [Google Scholar]
- Shi, F.; Li, Y.; Hu, X.; Xu, G.; Shan, X. Service Level Oriented Optimization of Train Operation Plan for High Speed Railway. China Railw. Sci. 2018, 39, 127–136. [Google Scholar]
- Goossens, J.-W.; Hoesel, S.V.; Kroon, L. A Branch-and-Cut Approach for Solving Railway Line-Planning Problems. Transp. Sci. 2004, 38, 379–393. [Google Scholar] [CrossRef]
- Lusby, R.M.; Larsen, J.; Ehrgott, M.; Ryan, D. Railway track allocation: Models and methods. OR Spectr. 2011, 33, 843–883. [Google Scholar] [CrossRef]
- Yang, L.; Qi, J.; Li, S.; Gao, Y. Collaborative optimization for train scheduling and train stop planning on high-speed railways. Omega 2016, 64, 57–76. [Google Scholar] [CrossRef]
- Zhou, H.; Qi, J.; Yang, L.; Shi, J.; Mo, P. Joint optimization of train scheduling and rolling stock circulation planning with passenger flow control on tidal overcrowded metro lines. Transp. Res. Part C Emerg. Technol. 2022, 140, 103708. [Google Scholar] [CrossRef]
- Zhao, P.; Li, Y.; Han, B.; Yang, R.; Liu, Z. Integrated Optimization of Rolling Stock Scheduling and Flexible Train Formation Based on Passenger Demand for an Intercity High-Speed Railway. Sustainability 2022, 14, 5650. [Google Scholar] [CrossRef]
- Pan, H.; Yang, L.; Liang, Z. Demand-oriented integration optimization of train timetabling and rolling stock circulation planning with flexible train compositions: A column-generation-based approach. Eur. J. Oper. Res. 2022, in press. [CrossRef]
- Meng, L.; Corman, F.; Zhou, X.; Tang, T. Special issue on Integrated optimization models and algorithms in rail planning and control. Transp. Res. Part C Emerg. Technol. 2018, 88, 87–90. [Google Scholar] [CrossRef]
- Bussieck, M.R.; Winter, T.; Zimmermann, U.T. Discrete optimization in public rail transport. Math. Program. 1997, 79, 415–444. [Google Scholar] [CrossRef]
- Repolho, H.M.; Church, R.L.; Antunes, A.P. Optimizing station location and fleet composition for a high-speed rail line. Transp. Res. Part E Logist. Transp. Rev. 2016, 93, 437–452. [Google Scholar] [CrossRef]
- Yu, D.; Han, B.; Zhang, Q.; Yao, X.; Liu, F. Optimization method for train plan of urban rail transit based on the flexible length of train formation. J. Beijing Jiaotong Univ. 2015, 39, 21–31. [Google Scholar]
- Ganguly, S. Multi-objective distributed generationpenetration planning with load model using particle swarmoptimization. Decis. Mak. Appl. Manag. Eng. 2020, 3, 30–42. [Google Scholar] [CrossRef]
- Negi, G.; Kumar, A.; Pant, S.; Ram, M. Optimization ofComplex System Reliability using Hybrid Grey Wolf Optimizer. Decis. Mak. Appl. Manag. Eng. 2021, 4, 241–256. [Google Scholar] [CrossRef]
- Berthold, T. Primal Heuristics for Mixed Integer Programs. Ph.D. Thesis, Zuse Institute Berlin (ZIB), Berlin, Germany, 2006. [Google Scholar]
- Karbstein, M. Line Planning and Connectivity; Technische Universitat Berlin: Berlin, Germany, 2013. [Google Scholar]

Publisher’s Note: MDPI stays neutral with regard to jurisdictional claims in published maps and institutional affiliations. |
© 2022 by the authors. Licensee MDPI, Basel, Switzerland. This article is an open access article distributed under the terms and conditions of the Creative Commons Attribution (CC BY) license (https://creativecommons.org/licenses/by/4.0/).