
A Study on the Calibrated Confidence of Text Classification Using a Variational Bayes


Abstract
1. Introduction
- Most technologies do not go through a TM, and data labels can become imbalanced [32].
- Since our method uses a generative model, various data representations can be obtained, and the confidence can be calibrated even when the quantity of data is small;
- Since a generative model can adjust the distribution of imbalanced labels, it can prevent the confidence of a specific label from becoming too large or too small;
- Since the proposed methodology can obtain a disentangled representation of the data through a generative model, the results of TM can be compared in a low-dimensional space;
- Since our method uses a large-scale, pre-trained language model, it can respond appropriately to patent terminology and new technologies;
- This study proposes a computationally scalable method that guarantees calibrated confidence in various tasks to drive sustainable management and technological innovation.
2. Theoretical Background
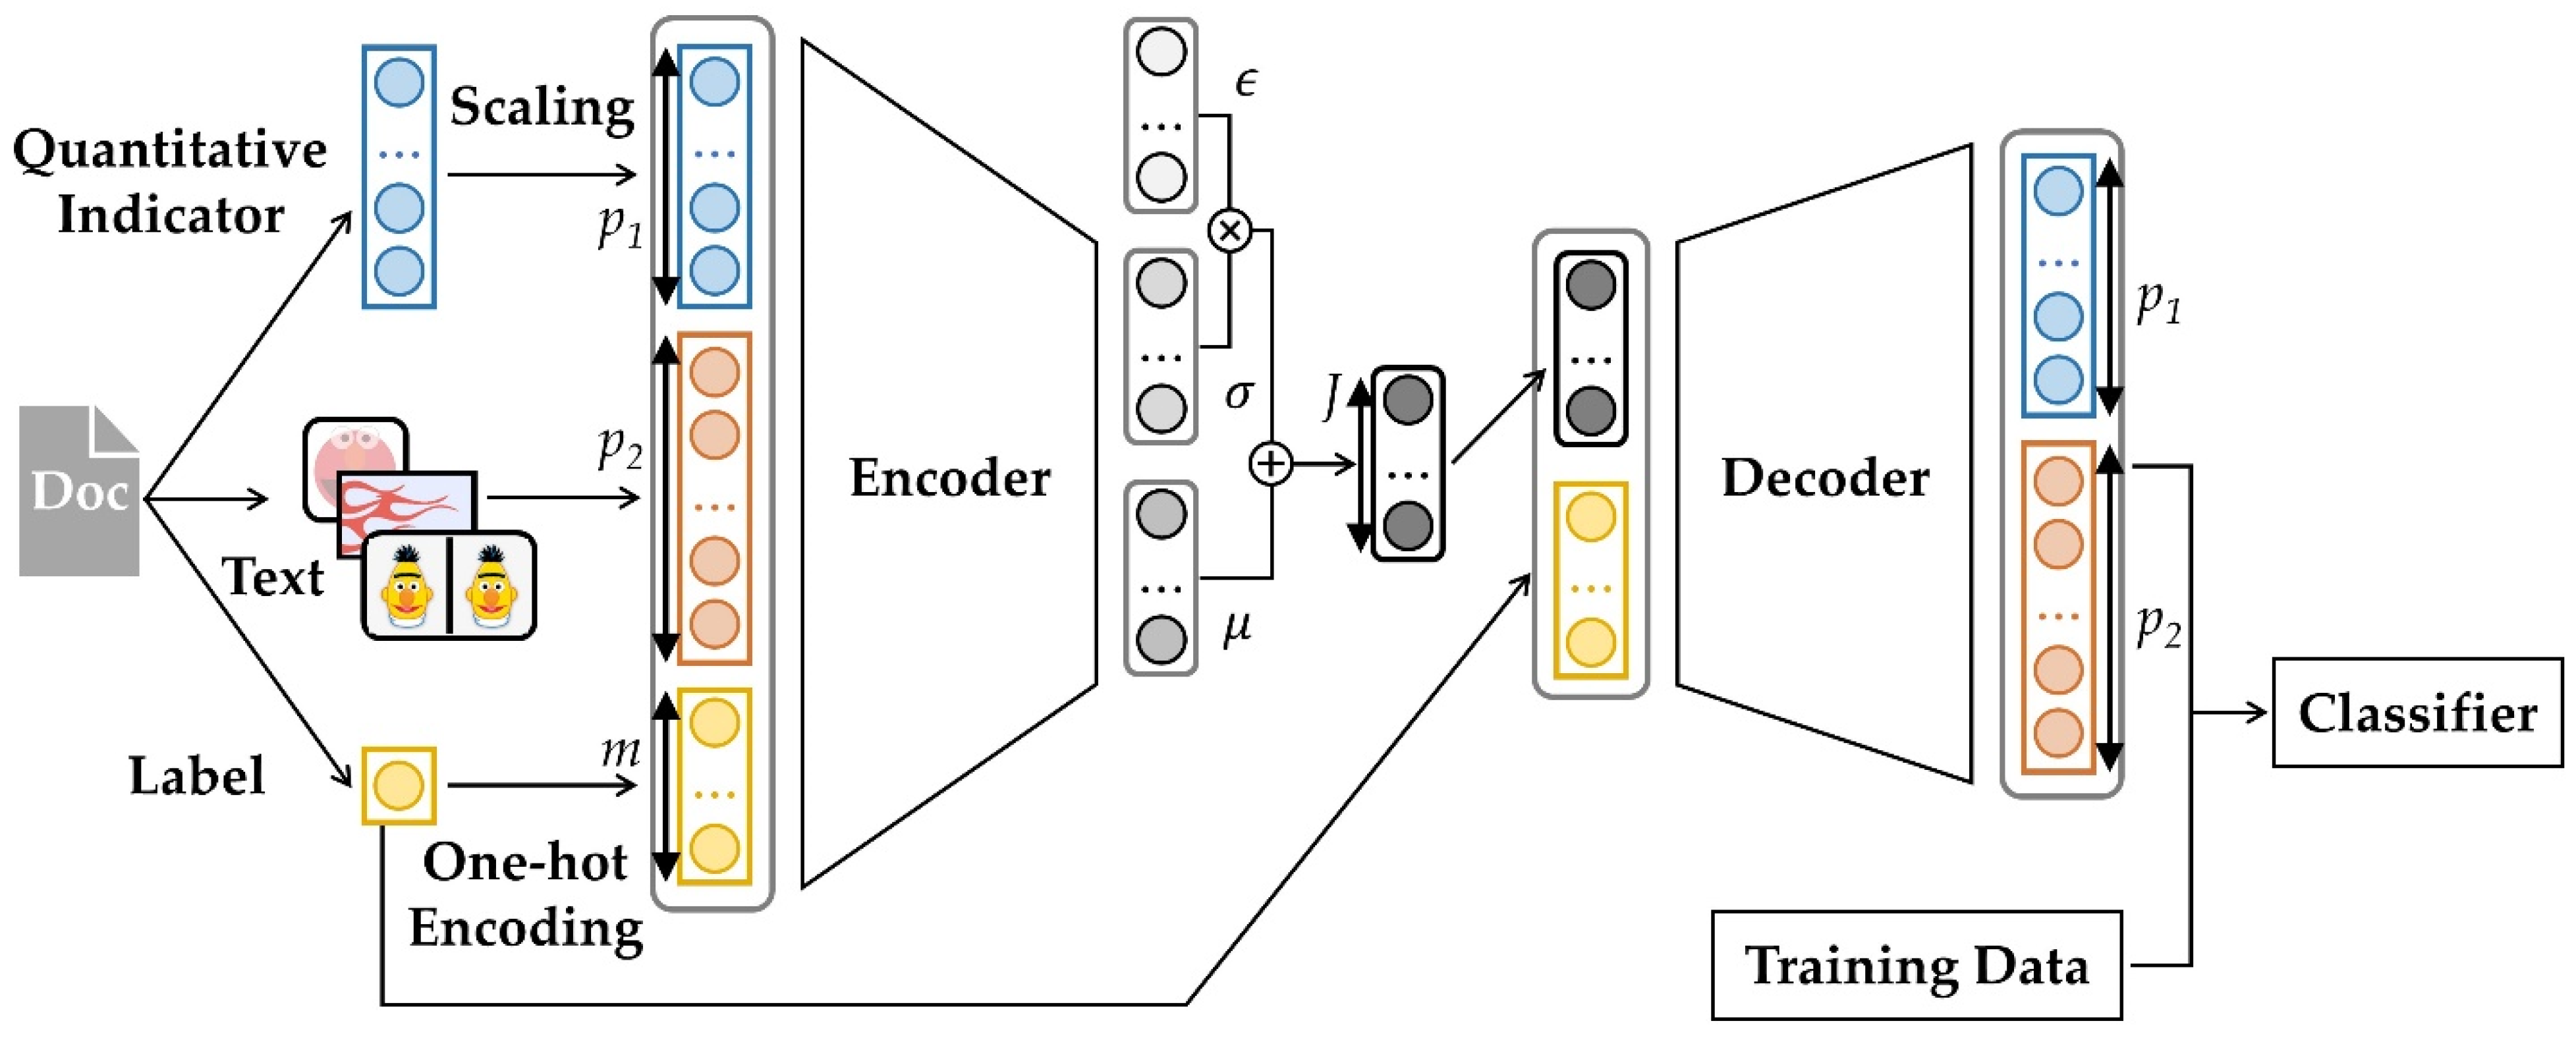
3. Proposed Method
4. Experimental Results
4.1. Dataset and Experimental Setup
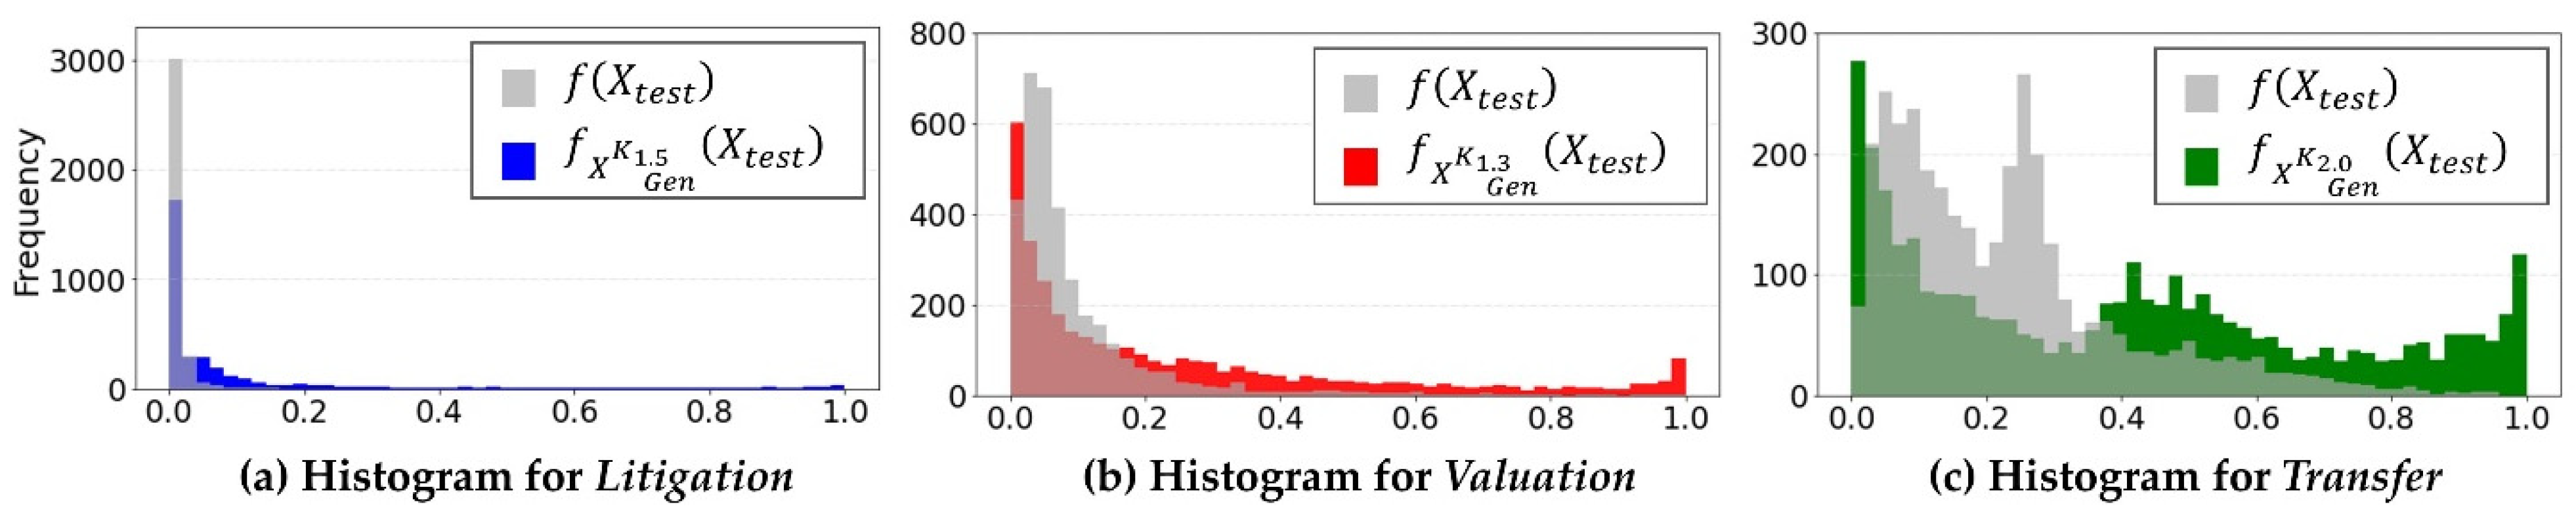
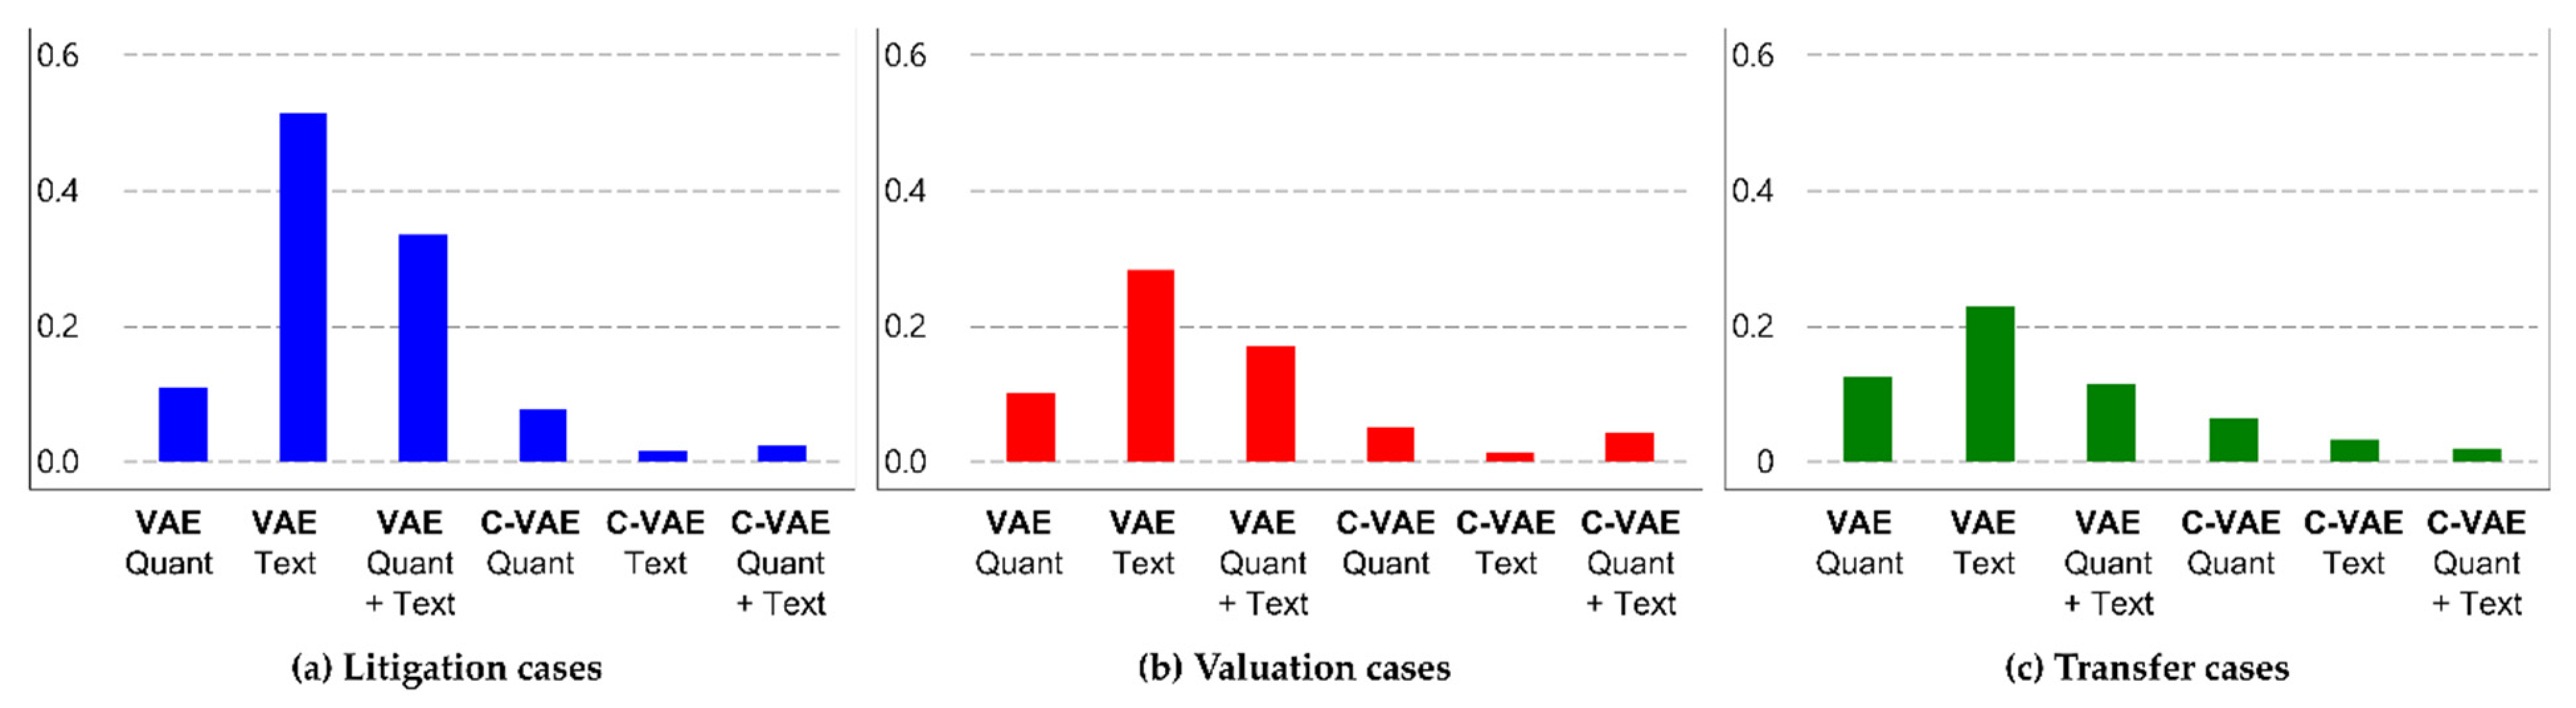
4.2. Comparison of Quantitative Variables Depending on the Purpose of Document Classification
4.3. Comparison of Representations in Latent Space Depending on Labels in Documents
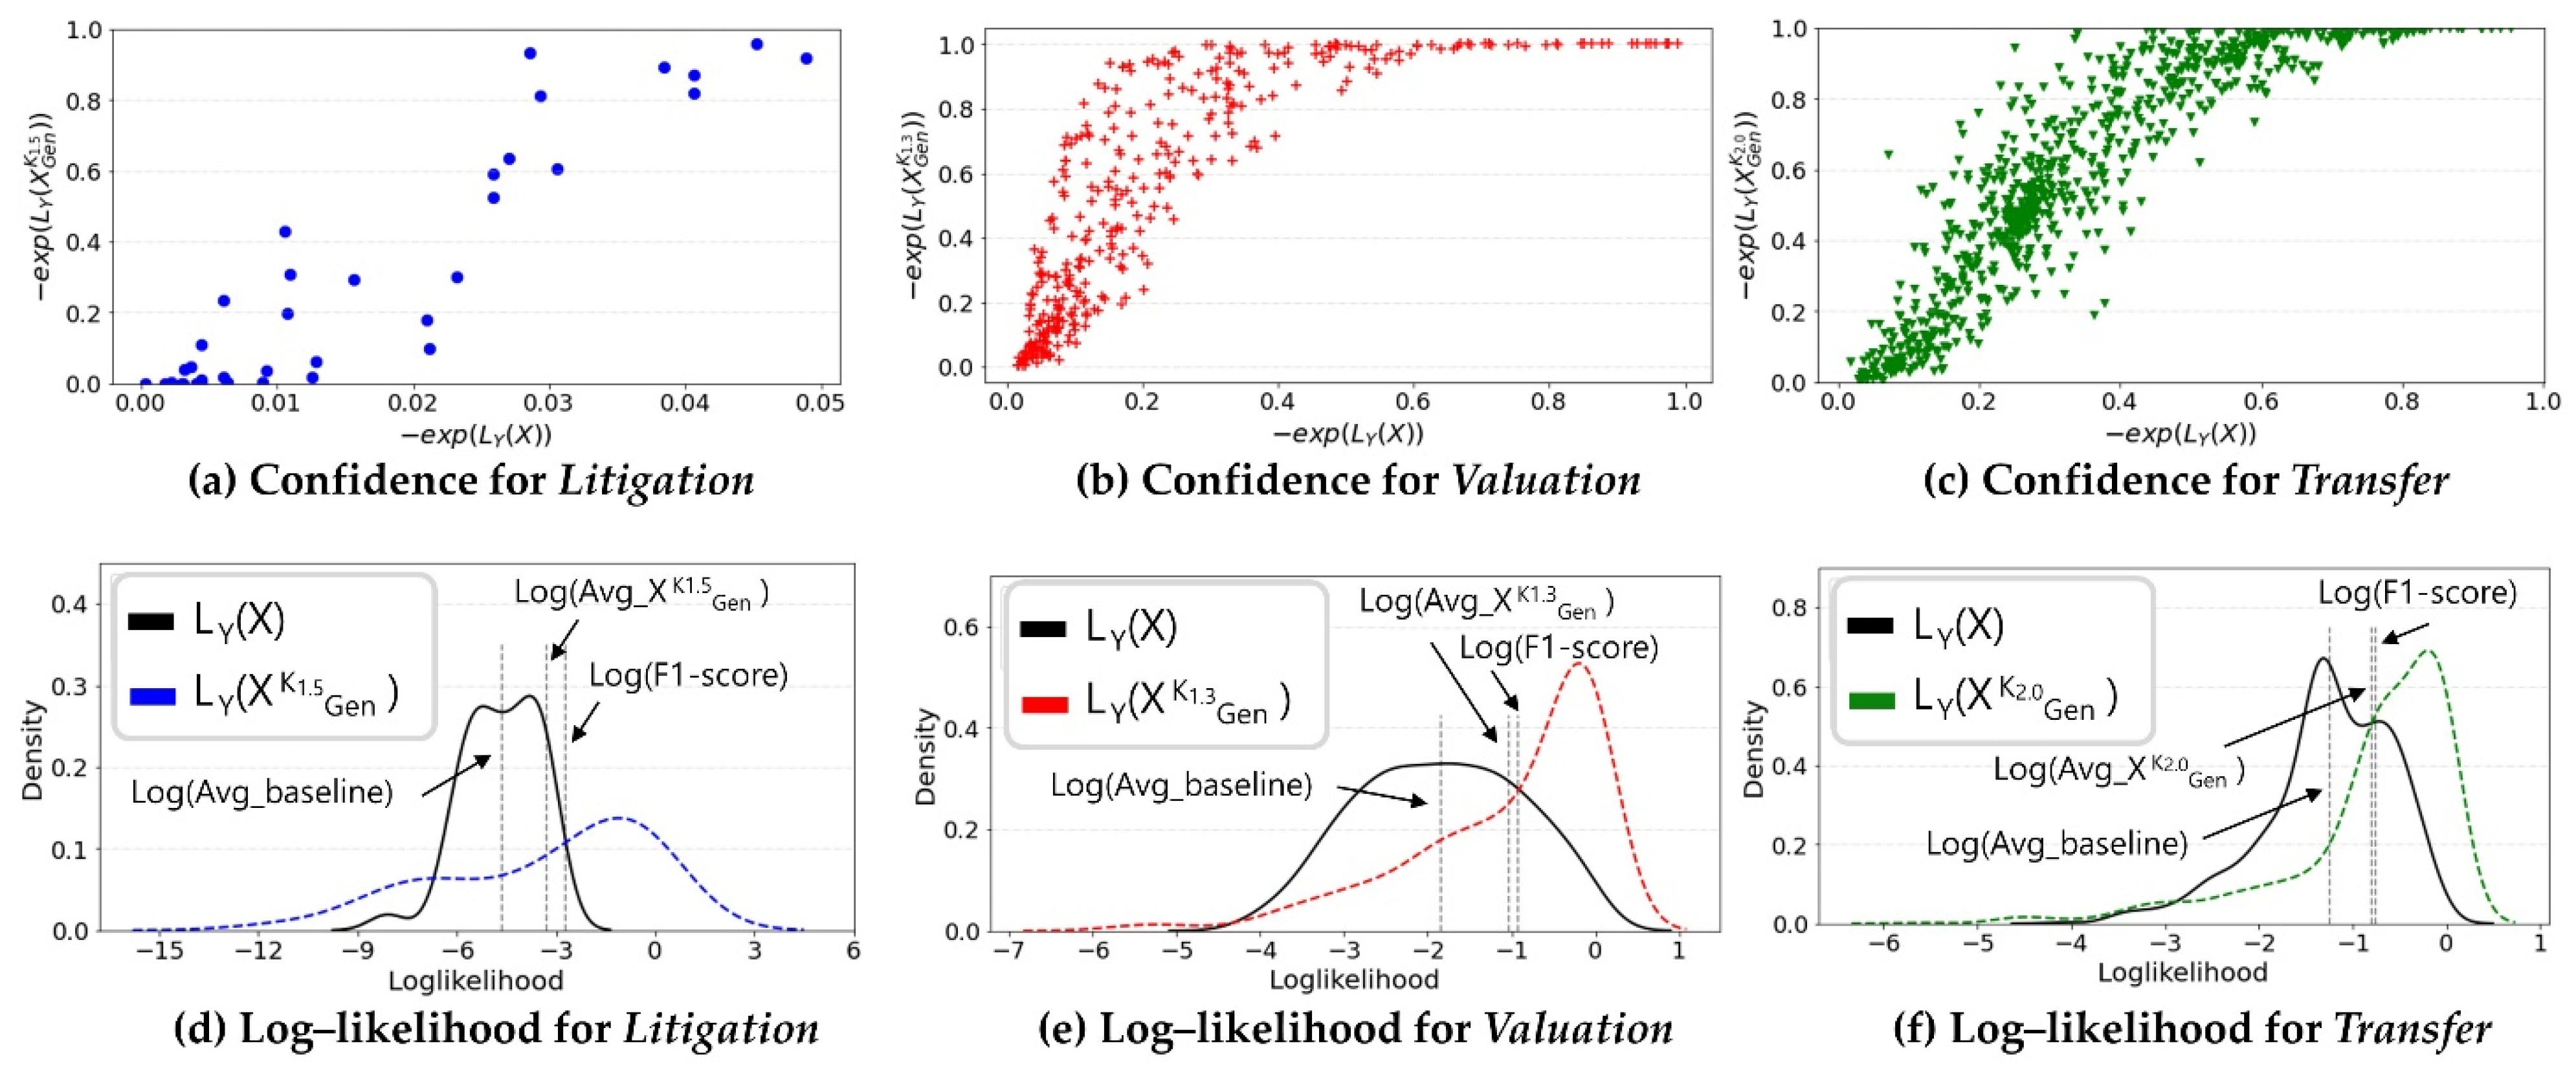
4.4. Comparison of Improvements in Calibrated Confidence in Document Classification
5. Discussion
- This paper did not present an optimization method to find the hyperparameter in the proposed methodology. The hyperparameter , which determines how much data are generated, is expected to be related to the precursors of the data. In the experiment, we determined the hyperparameters using a greedy search. However, methodologies or empirical guidelines for optimization should be proposed;
- The proposed method cannot easily guarantee calibrated confidence for multi-class classification. To examine the proposed methodology’s applicability, we conducted various statistical experiments. However, the experiments were conducted on binary-class classification. Future research should consider multi-class classifications to reduce uncertainty in various TM tasks.
6. Conclusions
Author Contributions
Funding
Institutional Review Board Statement
Informed Consent Statement
Data Availability Statement
Conflicts of Interest
Appendix A

Appendix B

| Results | Litigation | Valuation | Transfer | |||||||||
|---|---|---|---|---|---|---|---|---|---|---|---|---|
| F1-Score | GM | FPR | AUC | F1-Score | GM | FPR | AUC | F1-Score | GM | FPR | AUC | |
| Baseline | 0.000 | 0.000 | 0.000 | 0.500 | 0.229 | 0.372 | 0.009 | 0.565 | 0.336 | 0.473 | 0.051 | 0.593 |
| 0.066 | 0.493 | 0.075 | 0.594 | 0.404 | 0.675 | 0.118 | 0.699 | 0.452 | 0.621 | 0.188 | 0.644 | |
| 0.062 | 0.494 | 0.082 | 0.592 | 0.395 | 0.681 | 0.133 | 0.701 | 0.457 | 0.633 | 0.223 | 0.646 | |
| 0.065 | 0.515 | 0.085 | 0.602 | 0.385 | 0.681 | 0.144 | 0.699 | 0.458 | 0.637 | 0.243 | 0.647 | |
| 0.063 | 0.514 | 0.087 | 0.601 | 0.376 | 0.679 | 0.153 | 0.695 | 0.459 | 0.641 | 0.258 | 0.648 | |
| 0.062 | 0.513 | 0.090 | 0.600 | 0.372 | 0.679 | 0.159 | 0.695 | 0.463 | 0.646 | 0.272 | 0.651 | |
| 0.061 | 0.513 | 0.091 | 0.599 | 0.370 | 0.679 | 0.161 | 0.694 | 0.465 | 0.649 | 0.276 | 0.653 | |
References
- Johnson, J.M.; Khoshgoftaar, T.M. Survey on deep learning with class imbalance. J. Big Data 2019, 6, 27. [Google Scholar] [CrossRef]
- Jiawei, H.; Micheline, K.; Jian, P. Data Mining: Concepts and Techniques, 3rd ed.; Elsevier: New York, NY, USA, 2012; ISBN 9780123814791. [Google Scholar]
- Ivanović, M.; Radovanović, M. Modern Machine Learning Techniques and Their Applications. In Electronics, Communications and Networks IV: Proceedings of the International Conference on Electronics, Communications and Networks, Beijing, China, 12–15 December 2014; CRC Press: London, UK, 2015. [Google Scholar]
- LeCun, Y.; Bengio, Y.; Hinton, G. Deep learning. Nature 2015, 521, 436–444. [Google Scholar] [CrossRef] [PubMed]
- Bojarski, M.; Del Testa, D.; Dworakowski, D.; Firner, B.; Flepp, B.; Goyal, P.; Jackel, L.D.; Monfort, M.; Muller, U.; Zhang, J.; et al. End to End Learning for Self-Driving Cars. arXiv 2016, arXiv:1604.07316. [Google Scholar]
- Van den Oord, A.; Dieleman, S.; Zen, H.; Simonyan, K.; Vinyals, O.; Graves, A.; Kalchbrenner, N.; Senior, A.; Kavukcuoglu, K. Wavenet: A Generative Model for Raw Audio. arXiv 2016, arXiv:1609.03499. [Google Scholar]
- Isola, P.; Zhu, J.-Y.; Zhou, T.; Efros, A.A. Image-to-Image Translation with Conditional Adversarial Networks. In Proceedings of the IEEE Conference on Computer Vision and Pattern Recognition (CVPR), Honolulu, HI, USA, 21–26 July 2017; pp. 1125–1134. [Google Scholar]
- Esteva, A.; Kuprel, B.; Novoa, R.A.; Ko, J.; Swetter, S.M.; Blau, H.M.; Thrun, S. Dermatologist-level classification of skin cancer with deep neural networks. Nature 2017, 542, 115–118. [Google Scholar] [CrossRef]
- Jiang, H.; Kim, B.; Guan, M.Y.; Gupta, M. To Trust or Not to Trust a Classifier. In Proceedings of the Advances in Neural Information Processing System, Montréal, QC, Canada, 4 December 2018. [Google Scholar]
- Janet, J.P.; Duan, C.; Yang, T.; Nandy, A.; Kulik, H.J. A quantitative uncertainty metric controls error in neural network-driven chemical discovery. Chem. Sci. 2019, 10, 7913–7922. [Google Scholar] [CrossRef]
- Malinin, A. Uncertainty Estimation in Deep Learning with Application to Spoken Language Assessment. Doctoral Dissertation, University of Cambridge, Cambridge, UK, 2019. [Google Scholar]
- Abdar, M.; Pourpanah, F.; Hussain, S.; Rezazadegan, D.; Liu, L.; Ghavamzadeh, M.; Fieguth, P.; Cao, X.; Khosravi, A.; Acharya, U.R.; et al. A review of uncertainty quantification in deep learning: Techniques, applications and challenges. Inf. Fusion 2021, 76, 243–297. [Google Scholar] [CrossRef]
- Hora, S.C. Aleatory and epistemic uncertainty in probability elicitation with an example from hazardous waste management. Reliab. Eng. Syst. Saf. 1996, 54, 217–223. [Google Scholar] [CrossRef]
- Der Kiureghian, A.; Ditlevsen, O. Aleatory or epistemic? Does it matter? Struct. Saf. 2009, 31, 105–112. [Google Scholar] [CrossRef]
- Hüllermeier, E.; Waegeman, W. Aleatoric and epistemic uncertainty in machine learning: An introduction to concepts and methods. Mach. Learn. 2021, 110, 457–506. [Google Scholar] [CrossRef]
- Kendall, A.; Gal, Y. What Uncertainties Do We Need in Bayesian Deep Learning for Computer Vision? In Proceedings of the Advances in Neural Information Processing System, Long Beach, CA, USA, 24 January 2018. [Google Scholar]
- Gneiting, T.; Balabdaoui, F.; Raftery, A.E. Probabilistic forecasts, calibration and sharpness. J. R. Stat. Soc. Ser. B (Stat. Methodol.) 2007, 69, 243–268. [Google Scholar] [CrossRef]
- Kleiber, W.; Raftery, A.E.; Gneiting, T. Geostatistical Model Averaging for Locally Calibrated Probabilistic Quantitative Precipitation Forecasting. J. Am. Stat. Assoc. 2011, 106, 1291–1303. [Google Scholar] [CrossRef]
- Minderer, M.; Djolonga, J.; Romijnders, R.; Hubis, F.; Zhai, X.; Houlsby, N.; Tran, D.; Lucic, M. Revisiting the Calibration of Modern Neural Networks. In Proceedings of the Advances in Neural Information Processing System, Online, 12 July 2021; Volume 34, pp. 15682–15694. [Google Scholar]
- Jagannatha, A.; Yu, H. Calibrating Structured Output Predictors for Natural Language Processing. In Proceedings of the Conference Association for Computational Linguistics Meeting, Online, 5–10 July 2020; pp. 2078–2092. [Google Scholar]
- Jiang, Z.; Araki, J.; Ding, H.; Neubig, G. How Can We Know When Language Models Know? On the Calibration of Language Models for Question Answering. Trans. Assoc. Comput. Linguist. 2021, 9, 962–977. [Google Scholar] [CrossRef]
- Zhang, S.; Gong, C.; Choi, E. Knowing More About Questions Can Help: Improving Calibration in Question Answering. arXiv 2021, arXiv:2106.01494. [Google Scholar] [CrossRef]
- Tekic, Z.; Kukolj, D. Threat of Litigation and Patent Value: What Technology Managers Should Know. Res. Technol. Manag. 2013, 56, 18–25. [Google Scholar] [CrossRef]
- Lee, J.; Kang, J.; Park, S.; Jang, D.; Lee, J. A Multi-Class Classification Model for Technology Evaluation. Sustainability 2020, 12, 6153. [Google Scholar] [CrossRef]
- Chien, C.V. Predicting Patent Litigation. Tex. L. Rev. 2011, 90, 283–329. [Google Scholar]
- Cowart, T.W.; Lirely, R.; Avery, S. Two Methodologies for Predicting Patent Litigation Outcomes: Logistic Regression Versus Classification Trees. Am. Bus. Law J. 2014, 51, 843–877. [Google Scholar] [CrossRef]
- Sokhansanj, B.A.; Rosen, G.L. Predicting Institution Outcomes for Inter Partes Review (IPR) Proceedings at the United States Patent Trial & Appeal Board by Deep Learning of Patent Owner Preliminary Response Briefs. Appl. Sci. 2022, 12, 3656. [Google Scholar] [CrossRef]
- Chung, P.; Sohn, S.Y. Early detection of valuable patents using a deep learning model: Case of semiconductor industry. Technol. Forecast. Soc. Chang. 2020, 158, 120146. [Google Scholar] [CrossRef]
- Trappey, A.J.C.; Trappey, C.V.; Govindarajan, U.H.; Sun, J.J.H. Patent Value Analysis Using Deep Learning Models—The Case of IoT Technology Mining for the Manufacturing Industry. IEEE Trans. Eng. Manag. 2019, 68, 1334–1346. [Google Scholar] [CrossRef]
- Da Silva, V.L.; Kovaleski, J.L.; Pagani, R.N. Technology Analysis & Strategic Management Technology Transfer in the Supply Chain Oriented to Industry 4.0: A Literature Review. Technol. Anal. Strateg. Manag. 2018, 31, 546–562. [Google Scholar] [CrossRef]
- Lee, J.; Lee, J.; Kang, J.; Kim, Y.; Jang, D.; Park, S. Multimodal Deep Learning for Patent Classification. In Proceedings of 6th International Congress on Information and Communication Technology, ICICT 2021, London, UK, 25–26 February 2021; Springer Science and Business Media Deutschland GmbH: Berlin, Germany, 2022; Volume 217, pp. 281–289. [Google Scholar]
- Kong, Q.; Zhao, H.; Lu, B.-L. Adaptive Ensemble Learning Strategy Using an Assistant Classifier for Large-Scale Imbalanced Patent Categorization. In Proceedings of the International Conference on Neural Information Processing; Springer: Berlin/Heidelberg, Germany, 2010; Volume 6443, pp. 601–608. [Google Scholar] [CrossRef]
- Platt, J. Probabilistic Outputs for Support Vector Machines and Comparisons to Regularized Likelihood Methods. Adv. Large Margin Classif. 1999, 10, 61–74. [Google Scholar]
- Guo, C.; Pleiss, G.; Sun, Y.; Weinberger, K.Q. On Calibration of Modern Neural Networks. In Proceedings of the International Conference on Machine Learning, PMLR, Sydney, Australia, 6 August 2017; pp. 1321–1330. [Google Scholar]
- Zadrozny, B.; Elkan, C. Obtaining Calibrated Probability Estimates from Decision Trees and Naive Bayesian Classifiers. In Proceedings of the ICML, Online, 28 June–1 July 2001; pp. 609–616. [Google Scholar]
- Naeini, M.P.; Cooper, G.; Hauskrecht, M. Obtaining Well Calibrated Probabilities Using Bayesian Binning. In Proceedings of the Twenty-Ninth AAAI Conference on Artificial Intelligence, Austin, TX, USA, 25–30 January 2015. [Google Scholar]
- Nixon, J.; Dusenberry, M.W.; Zhang, L.; Jerfel, G.; Tran, D. Measuring Calibration in Deep Learning. In Proceedings of the CVPR Workshops, Long Beach, CA, USA, 15 June 2019; pp. 38–41. [Google Scholar]
- Thulasidasan, S.; Chennupati, G.; Bilmes, J.; Bhattacharya, T.; Michalak, S.E. On Mixup Training: Improved Calibration and Predictive Uncertainty for Deep Neural Networks. In Proceedings of the Advances in Neural Information Processing System, Vancouver, BC, Canada, 13 December 2019. [Google Scholar] [CrossRef]
- Zhang, L.; Deng, Z.; Kawaguchi, K.; Zou, J. When and How Mixup Improves Calibration. In Proceedings of the 39th International Conference on Machine Learning, PMLR, Baltimore, MD, USA, 17–23 July 2022; pp. 26135–26160. [Google Scholar]
- Ovadia, Y.; Fertig, E.; Ren, J.; Nado, Z.; Sculley, D.; Nowozin, S.; Dillon, J.V.; Lakshminarayanan, B.; Snoek, J. Can You Trust Your Model’s Uncertainty? Evaluating Predictive Uncertainty Under Dataset Shift. In Proceedings of the Advances in Neural Information Processing System, Vancouver, BC, Canada, 13 December 2019. [Google Scholar]
- Chan, A.J.; Alaa, A.M.; Qian, Z.; van der Schaar, M. Unlabelled Data Improves Bayesian Uncertainty Calibration under Covariate Shift. In Proceedings of the 37th International Conference on Machine Learning, PMLR, Online, 13–18 July 2020; pp. 1392–1402. [Google Scholar]
- Hendrycks, D.; Gimpel, K. A Baseline for Detecting Misclassified and out-of-Distribution Examples in Neural Networks. arXiv 2016, arXiv:1610.02136. [Google Scholar]
- Pereyra, G.; Tucker, G.; Chorowski, J.; Kaiser, Ł.; Hinton, G. Regularizing Neural Networks by Penalizing Confident Output Distributions. arXiv 2017, arXiv:1701.06548. [Google Scholar]
- Krishnan, R.; Tickoo, O. Improving Model Calibration with Accuracy versus Uncertainty Optimization. In Proceedings of the Advances in Neural Information Processing System, Vancouver, BC, Canada, 6 December 2020; pp. 18237–18248. [Google Scholar]
- Jiang, X.; Deng, X. Knowledge Reverse Distillation Based Confidence Calibration for Deep Neural Networks. Neural Process. Lett. 2022, 1–16. [Google Scholar] [CrossRef]
- Xenopoulos, P.; Rulff, J.; Nonato, L.G.; Barr, B.; Silva, C. Calibrate: Interactive Analysis of Probabilistic Model Output. arXiv 2022, arXiv:2207.13770. [Google Scholar]
- Mukdasai, K.; Sabir, Z.; Raja, M.A.Z.; Sadat, R.; Ali, M.R.; Singkibud, P. A numerical simulation of the fractional order Leptospirosis model using the supervise neural network. Alex. Eng. J. 2022, 61, 12431–12441. [Google Scholar] [CrossRef]
- Liu, Q.; Wu, H.; Ye, Y.; Zhao, H.; Liu, C.; Du, D. Patent Litigation Prediction: A Convolutional Tensor Factorization Approach. In Proceedings of the International Joint Conference on Artificial Intelligence, Stockholm, Sweden, 13 July 2017; pp. 5052–5059. [Google Scholar]
- Kwon, O. A new ensemble method for gold mining problems: Predicting technology transfer. Electron. Commer. Res. Appl. 2012, 11, 117–128. [Google Scholar] [CrossRef]
- Kwon, O.; Lee, J.S. Smarter Classification for Imbalanced Data Set and Its Application to Patent Evaluation. J. Intell. Inf. Syst. 2014, 20, 15–34. [Google Scholar] [CrossRef][Green Version]
- Setiawan, A.A.R.; Sulaswatty, A.; Haryono, A. Finding the Most Efficient Technology Transfer Route Using Dijkstra Algorithm to Foster Innovation: The Case of Essential Oil Developments in the Research Center for Chemistry at the Indonesian Institute of Sciences. STI Policy Manag. J. 2016, 1, 75–102. [Google Scholar] [CrossRef]
- Sohn, K.; Yan, X.; Lee, H. Learning Structured Output Representation Using Deep Conditional Generative Models. In Proceedings of the Advances in Neural Information Processing System, Montreal, QC, Canada, 7 December 2015. [Google Scholar]
- Lopez-Martin, M.; Carro, B.; Sanchez-Esguevillas, A.; Lloret, J. Conditional Variational Autoencoder for Prediction and Feature Recovery Applied to Intrusion Detection in IoT. Sensors 2017, 17, 1967. [Google Scholar] [CrossRef] [PubMed]
- Sweers, T. Autoencoding Credit Card Fraud. Bachelor’s Thesis, Radboud University, Nijmegen, The Netherlands, 2018. [Google Scholar]
- Andrei Fajardo, V.; Findlay, D.; Houmanfar, R.; Charu, C.; Jiaxi, L.; Xie, H. VOS: A Method for Variational Oversampling of Imbalanced Data Charu Jaiswal. arXiv 2018, arXiv:1809.02596. [Google Scholar]
- Xu, H.; Feng, Y.; Chen, J.; Wang, Z.; Qiao, H.; Chen, W.; Zhao, N.; Li, Z.; Bu, J.; Li, Z.; et al. Unsupervised Anomaly Detection via Variational Auto-Encoder for Seasonal KPIs in Web Applications. In Proceedings of the 2018 World Wide Web Conference, Lyon, France, 23–27 April 2018; pp. 187–196. [Google Scholar] [CrossRef]
- Lu, Y.; Xu, P. Anomaly Detection for Skin Disease Images Using Variational Autoencoder. arXiv 2018, arXiv:1807.01349. [Google Scholar]
- Urteaga, I.; Li, K.; Shea, A.; Vitzthum, V.J.; Wiggins, C.H.; Elhada, N. A Generative Modeling Approach to Calibrated Predictions: A Use Case on Menstrual Cycle Length Prediction Generative Modeling for Calibrated Predictions. In Proceedings of the Machine Learning for Healthcare Conference, Online, 6 August 2021; Volume 149, pp. 535–566. [Google Scholar]
- Han, P.K.J.; Klein, W.M.P.; Arora, N.K. Varieties of Uncertainty in Health Care: A Conceptual Taxonomy. Med. Decis. Mak. 2011, 31, 828–838. [Google Scholar] [CrossRef]
- Alba, A.C.; Agoritsas, T.; Walsh, M.; Hanna, S.; Iorio, A.; Devereaux, P.J.; McGinn, T.; Guyatt, G. Discrimination and Calibration of Clinical Prediction Models. JAMA 2017, 318, 1377–1384. [Google Scholar] [CrossRef] [PubMed]
- Rajkomar, A.; Oren, E.; Chen, K.; Dai, A.M.; Hajaj, N.; Hardt, M.; Liu, P.J.; Liu, X.; Marcus, J.; Sun, M.; et al. Scalable and accurate deep learning with electronic health records. NPJ Digit. Med. 2018, 1, 18. [Google Scholar] [CrossRef]
- Choi, J.; Moo Yi, K.; Kim, J.; Choo, J.; Kim, B.; Chang, J.; Gwon, Y.; Jin Chang, H. VaB-AL: Incorporating Class Imbalance and Difficulty with Variational Bayes for Active Learning. In Proceedings of the IEEE/CVF Conference on Computer Vision and Pattern Recognition, Nashville, TN, USA, 20–25 June 2021; pp. 6749–6758. [Google Scholar]
- Zhu, J.-Y.; Zhang, R.; Pathak, D.; Darrell, T.; Efros, A.A.; Wang, O.; Shechtman, E. Toward Multimodal Image-to-Image Translation. In Proceedings of the Advances in Neural Information Processing System, Long Beach, CA, USA, 4 December 2017. [Google Scholar]
- Tran, M.-N.; Nott, D.J.; Kohn, R. Variational Bayes with Intractable Likelihood. J. Comput. Graph. Stat. 2017, 26, 873–882. [Google Scholar] [CrossRef]
- Hwang, J.-T.; Kim, B.-K.; Jeong, E.-S. Patent Value and Survival of Patents. J. Open Innov. Technol. Mark. Complex. 2021, 7, 119. [Google Scholar] [CrossRef]
- Hoskins, J.D.; Carson, S.J. Industry conditions, market share, and the firm’s ability to derive business-line profitability from diverse technological portfolios. J. Bus. Res. 2022, 149, 178–192. [Google Scholar] [CrossRef]
- Ren, X.; Yang, T.; Wang, Y.; Zeng, W. Do generative models know disentanglement? contrastive learning is all you need. arXiv 2021, arXiv:2102.10543. [Google Scholar]
- Reimers, N.; Gurevych, I. Sentence-BERT: Sentence Embeddings using Siamese BERT-Networks. In Proceedings of the 2019 Conference on Empirical Methods in Natural Language Processing and the 9th International Joint Conference on Natural Language Processing (EMNLP-IJCNLP) 2019, Hong Kong, China, 3–7 November 2019; pp. 3973–3983. [Google Scholar]
- Menell, P.S. An Analysis of the Scope of Copyright Protection for Application Programs. Stanf. Law Rev. 1989, 41, 1045. [Google Scholar] [CrossRef]
- Cunningham, J.A.; O’Reilly, P. Macro, meso and micro perspectives of technology transfer. J. Technol. Transf. 2018, 43, 545–557. [Google Scholar] [CrossRef]
- Alexander, A.; Martin, D.P.; Manolchev, C.; Miller, K. University–industry collaboration: Using meta-rules to overcome barriers to knowledge transfer. J. Technol. Transf. 2018, 45, 371–392. [Google Scholar] [CrossRef]
- Xu, X.; Gui, M. Applying data mining techniques for technology prediction in new energy vehicle: A case study in China. Environ. Sci. Pollut. Res. 2021, 28, 68300–68317. [Google Scholar] [CrossRef] [PubMed]
- Peacock, J. Two-dimensional goodness-of-fit testing in astronomy. Mon. Not. R. Astron. Soc. 1983, 202, 615–627. [Google Scholar] [CrossRef]
- Fasano, G.; Franceschini, A. A multidimensional version of the Kolmogorov–Smirnov test. Mon. Not. R. Astron. Soc. 1987, 225, 155–170. [Google Scholar] [CrossRef]


| Variables | Description |
|---|---|
| claim | Number of claims |
| inventor | Number of inventors |
| ipc | Number of International Patent Classification (IPC) codes |
| cpc | Number of Cooperative Patent Classification (CPC) codes |
| citeP | Number of cited patents |
| citeC | Number of countries for cited patents |
| citeR | Number of cited non-patent documents |
| famP | Number of family patents |
| famC | Number of countries for family patents |
| famE | Number of European Patent Office family patents |
| Embp2 | Variables for text transformed into a pre-trained language model |
| Case | Statistics | Claim | Inventor | ipc | cpc | citeP | citeC | citeR | famP | famC | famE |
|---|---|---|---|---|---|---|---|---|---|---|---|
| Litigation | Avg. Y | 23.536 | 1.544 | 3.656 | 4.656 | 223.584 | 3.600 | 66.664 | 74.832 | 5.560 | 20.400 |
| Std. Y | 12.981 | 1.874 | 4.785 | 9.004 | 430.433 | 2.626 | 140.082 | 178.146 | 3.965 | 23.832 | |
| Avg. N | 18.168 | 1.680 | 3.128 | 3.880 | 69.560 | 2.408 | 8.288 | 3.960 | 32.928 | 8.216 | |
| Std. N | 10.662 | 1.831 | 2.558 | 4.705 | 390.268 | 2.113 | 34.262 | 3.275 | 150.234 | 9.228 | |
| Levene 1 | 0.204 | 0.747 | 0.114 | 0.396 | 0.007 | 0.001 | <0.001 | 0.090 | 0.002 | <0.001 | |
| t-test 2 | <0.001 | 0.564 | 0.280 | 0.396 | 0.003 | <0.001 | <0.001 | 0.046 | 0.001 | <0.001 | |
| Wilcoxon 3 | <0.001 | 0.360 | 0.784 | 0.405 | <0.001 | <0.001 | <0.001 | <0.001 | 0.001 | <0.001 | |
| KS-test 4 | 0.001 | 0.614 | 0.721 | 0.721 | <0.001 | <0.001 | <0.001 | <0.001 | <0.001 | <0.001 | |
| Valuation | Avg. Y | 23.442 | 2.280 | 3.892 | 5.738 | 239.252 | 4.127 | 52.799 | 169.694 | 7.078 | 23.140 |
| Std. Y | 16.621 | 2.847 | 5.096 | 11.006 | 562.636 | 3.048 | 117.259 | 415.457 | 4.455 | 29.686 | |
| Avg. N | 17.170 | 1.849 | 3.089 | 3.707 | 47.966 | 2.476 | 11.476 | 3.753 | 29.337 | 7.858 | |
| Std. N | 8.966 | 2.129 | 2.583 | 5.545 | 130.851 | 1.904 | 48.123 | 3.241 | 159.323 | 9.322 | |
| Levene | <0.001 | <0.001 | <0.001 | <0.001 | <0.001 | <0.001 | <0.001 | <0.001 | <0.001 | <0.001 | |
| t-test | <0.001 | <0.001 | <0.001 | <0.001 | <0.001 | <0.001 | <0.001 | <0.001 | <0.001 | <0.001 | |
| Wilcoxon | <0.001 | 0.292 | 0.337 | 0.812 | <0.001 | <0.001 | <0.001 | <0.001 | <0.001 | <0.001 | |
| KS-test | <0.001 | <0.001 | 0.053 | <0.001 | <0.001 | <0.001 | <0.001 | <0.001 | <0.001 | <0.001 | |
| Transfer | Avg. Y | 17.266 | 2.347 | 3.257 | 4.556 | 80.523 | 3.042 | 17.588 | 44.854 | 4.189 | 10.312 |
| Std. Y | 9.586 | 2.439 | 2.839 | 6.158 | 230.131 | 2.560 | 56.210 | 198.785 | 3.123 | 13.353 | |
| Avg. N | 18.190 | 1.819 | 3.139 | 3.727 | 61.215 | 2.519 | 13.444 | 3.870 | 38.910 | 8.814 | |
| Std. N | 11.348 | 2.184 | 2.937 | 5.484 | 225.695 | 1.917 | 56.539 | 3.493 | 197.317 | 12.343 | |
| Levene | 0.001 | <0.001 | 0.428 | <0.001 | 0.003 | <0.001 | 0.011 | 0.332 | 0.182 | 0.014 | |
| t-test | 0.001 | <0.001 | 0.140 | <0.001 | 0.002 | <0.001 | 0.008 | 0.276 | <0.001 | <0.001 | |
| Wilcoxon | 0.022 | <0.001 | 0.026 | <0.001 | 0.048 | <0.001 | <0.001 | <0.001 | <0.001 | <0.001 | |
| KS-test | 0.066 | <0.001 | 0.147 | <0.001 | 0.026 | <0.001 | <0.001 | <0.001 | <0.001 | <0.001 |
| Dataset | Litigation | Valuation | Transfer | ||||||
|---|---|---|---|---|---|---|---|---|---|
| Y | N | Ratio (%) | Y | N | Ratio (%) | Y | N | Ratio (%) | |
| Raw data | 125 | 11,319 | 1.092 | 1162 | 10,282 | 10.154 | 2642 | 8802 | 23.086 |
| Training data | 61 | 5520 | 1.093 | 566 | 5015 | 10.142 | 1289 | 4292 | 23.096 |
| Validation data | 26 | 2388 | 1.077 | 245 | 2169 | 10.149 | 557 | 1857 | 23.074 |
| Test data | 38 | 3411 | 1.102 | 351 | 3098 | 10.177 | 796 | 2653 | 23.079 |
| Generative Model | Predictors | Parameter | Litigation | Valuation | Transfer | |||
|---|---|---|---|---|---|---|---|---|
| Statistics | p-Value | Statistics | p-Value | Statistics | p-Value | |||
| VAE | Quant | 1 | 0.117 | 0.833 | 0.106 | 0.013 | 0.018 | >0.500 |
| 2 | 0.148 | >0.500 | 0.106 | 0.013 | 0.017 | >0.500 | ||
| 3 | 0.149 | >0.500 | 0.106 | 0.026 | 0.017 | >0.500 | ||
| Text | 0.141 | <0.001 | 0.071 | 0.210 | 0.045 | 0.339 | ||
| 0.141 | <0.001 | 0.075 | 0.157 | 0.038 | >0.500 | |||
| 0.141 | <0.001 | 0.114 | 0.010 | 0.056 | 0.321 | |||
| Quant + Text | 0.170 | 0.404 | 0.058 | 0.432 | 0.073 | 0.020 | ||
| 0.226 | 0.124 | 0.105 | 0.015 | 0.060 | 0.083 | |||
| 0.267 | 0.071 | 0.113 | 0.009 | 0.102 | 0.001 | |||
| C-VAE | Quant | 0.263 | 0.047 | 0.008 | >0.500 | 0.267 | <0.001 | |
| 0.308 | 0.012 | 0.012 | >0.500 | 0.259 | <0.001 | |||
| 0.308 | 0.018 | 0.014 | >0.500 | 0.277 | <0.001 | |||
| Text | 0.200 | 0.221 | 0.354 | <0.001 | 0.171 | <0.001 | ||
| 0.378 | 0.001 | 0.342 | <0.001 | 0.197 | <0.001 | |||
| 0.385 | 0.002 | 0.470 | <0.001 | 0.232 | <0.001 | |||
| Quant + Text | 0.646 | <0.001 | 0.421 | <0.001 | 0.156 | <0.001 | ||
| 0.588 | <0.001 | 0.177 | <0.001 | 0.155 | <0.001 | |||
| 0.635 | <0.001 | 0.428 | <0.001 | 0.156 | <0.001 | |||
| Case | Performance Measure | Statistical Test | ||||
|---|---|---|---|---|---|---|
| Avg_Baseline | F1-Score | KS-Test 1 | Paired t-Test 2 | Wilcoxon 3 | ||
| Litigation | 0.010 | 0.040 | 0.065 | <0.001 | <0.001 | <0.001 |
| Valuation | 0.157 | 0.353 | 0.395 | <0.001 | <0.001 | <0.001 |
| Transfer | 0.286 | 0.445 | 0.465 | <0.001 | <0.001 | <0.001 |
Publisher’s Note: MDPI stays neutral with regard to jurisdictional claims in published maps and institutional affiliations. |
© 2022 by the authors. Licensee MDPI, Basel, Switzerland. This article is an open access article distributed under the terms and conditions of the Creative Commons Attribution (CC BY) license (https://creativecommons.org/licenses/by/4.0/).
Share and Cite
Lee, J.; Park, S. A Study on the Calibrated Confidence of Text Classification Using a Variational Bayes. Appl. Sci. 2022, 12, 9007. https://doi.org/10.3390/app12189007
Lee J, Park S. A Study on the Calibrated Confidence of Text Classification Using a Variational Bayes. Applied Sciences. 2022; 12(18):9007. https://doi.org/10.3390/app12189007
Chicago/Turabian StyleLee, Juhyun, and Sangsung Park. 2022. "A Study on the Calibrated Confidence of Text Classification Using a Variational Bayes" Applied Sciences 12, no. 18: 9007. https://doi.org/10.3390/app12189007
APA StyleLee, J., & Park, S. (2022). A Study on the Calibrated Confidence of Text Classification Using a Variational Bayes. Applied Sciences, 12(18), 9007. https://doi.org/10.3390/app12189007