Abstract
Titanium alloy is a type of high-strength material that is difficult to process. In particular, in the aerospace field, the processing accuracy of titanium alloy is high. Recently, laser processing has emerged as a new technology with high processing precision. However, the laser processing methods have obvious differences in processing accuracy and effect. Among them, the laser spiral scanning method plays an important role in welding and drilling, but owing to the complexity of the laser molten pool behavior, there have been limited studies on the material removal mechanism based on laser spiral scanning. To understand the variable process of titanium alloy melt pool in laser spiral scanning processing, a light heat conduction model with mass transfer source term was simulated. The effects of laser power, scanning speed, and scanning path on the morphology were studied. The simulation results show that the unit energy density was the main factor for material removal, and the distribution of the material temperature affected the size of the recast layer. The experimental and simulation results were compared, and good agreement between them was observed. This study can provide a research foundation for the further application of laser spiral scanning technology.
1. Introduction
Titanium alloy has been a commonly used material in the aerospace field, but it often requires high-precision processing in the modern manufacturing industry [1,2]. Laser processing is a new special processing technology with high processing accuracy that has been developed in recent decades [3,4,5]. However, different laser processing methods achieve different processing accuracy and effect. Laser scanning methods mainly include doughnut beam mode [6], helical drilling methods [7], and laser trepanning drilling [8]. Laser trepanning drilling has the advantage of high machining efficiency but a drawback of insufficient machining quality. The doughnut beam mode can easily lead to the formation of a recast layer and cause repeated thermal effects. The helical drilling methods have the advantages of controllable energy distribution and good machining quality but relatively poor processing efficiency. Owing to the advantage of helical drilling, laser helical drilling has been widely applied to welding [9] and drilling [10,11,12]. In Hongyu, Z et al. [13], the quality of a series of micropores, such as recast layer, microcracks, roundness and taper, produced on 304 stainless steel by a helical laser drilling system was discussed. The formation of a recast layer with thickness of about 25 µm was detected on the side wall, and the taper phenomenon was also observed. A laser spiral drilling technology was proposed, which can be used to effectively manufacture high-quality micropores. As for helical drilling methods, Shin et al. [7] reported an experimental investigation of shallow angle laser drilling of Inconel 718. Trials to improve drilling performance were conducted. They found that a higher laser power, lower speed, and closer focal position to the workpiece surface contributed to the further removal of material by the absorption of more laser energy and larger beam intensity.
However, in the simulation model of nanosecond laser drilling, deformation geometry is often used to track the interface change in micropores, and the change in recast layer is tracked by dividing the heat affected zone [14,15,16]. The deformation geometry model can not simulate the flow behavior of the molten pool. The simulation of molten pool behavior is mostly used for welding rather than drilling. For the simulation of phase explosion and other behaviors, the mathematical model has only recently been established and has not been applied to the actual processing [17,18,19,20]. There have been fewer simulation studies on nanosecond laser helical drilling. In the interaction between the laser and the material, the material first absorbs the laser energy and converts it into heat energy. In this process, the material melts and forms a molten pool to further absorb the laser energy. With the increase in material temperature, the material vaporizes, and the degree of vaporization increases. Under the action of the thermal stress field, the material is removed in the form of vaporization fly-out and a small amount of liquid splash. This process is the main process of nanosecond laser material removal. The influence range of a nanosecond laser is concentrated near the laser spot area. However, changes in the laser scanning path affect the accumulation of laser energy in a material, resulting in different removal effects. Spiral scanning has often been used in actual processing, but it is time consuming. In the nanosecond laser processing process, the main processing mechanism is the evaporation of the processed material and the re-condensation of the material after melting. Therefore, analyzing the interaction between laser spiral scanning and materials is crucial to explore and master further improvements in laser processing technology.
Owing to the fact that a solid heat transfer simulation model can not accurately reflect the interface separation generated, there have been fewer simulation studies on laser spiral scanning. Therefore, in order to analyze the morphology forming process with the spiral path in actual long-time processing, this paper conducted a simulation through two-phase flow and level set method. This approach can track the separated interface. Then, the influence of general parameters on the width and depth of morphology molding was analyzed. The simulation model was compared with actual processing results, and good consistency was obtained.
2. Theory and Two-Phase Flow Heat Transfer Simulation Model
The interaction between a laser and a titanium alloy during nanosecond laser processing represents a complex coupling process. Owing to the short action time between the laser and material, the solid–liquid phase transition process is ignored in this work, and only the influence of the material’s evaporation and removal on processed morphology is considered. Therefore, the two-phase flow heat transfer simulation model analyzed the material removal mechanism considering the two-phase flow and temperature and adopting the following hypotheses:
- The processing environment is uniform and isotropic in a metal material node.
- The metallic phase is transferred to the processing environment by evaporation.
- The thermodynamic parameters of the solid–liquid mixing zone in the melt change linearly with temperature.
- Heat transfer and radiation in laser movement are considered.
- The solid metal is used as a fluid with great dynamic viscosity.
The horizontal set heat transfer model of a two-phase flow with the evaporative transfer source term was adopted. The material phase states in the two-phase flow heat transfer simulation model were distinguished based on two parameters, level set function and node temperature. The metal phase and environment were distinguished by the level set coefficient from one to zero. In the metallic phase, those below melting temperature denote the solid phase, those above evaporation temperatures denote the gas phase, and those in the middle represent the liquid phase. The energy conservation, mass conservation, and momentum conservation equations of the two-phase flow heat transfer simulation model are as follows:
where is the mixing density of the metal phase; is the gas phase density; is the liquid phase density; k is the thermal conductivity coefficient; is the laser heat source; is the heat loss term; is the mass loss; represents the velocity of fluid; P is the pressure matrix; and is the evaporation pressure.
The laser heat source S, heat loss , and evaporation pressure are respectively given by
In the type, is laser power, is the laser absorption rate of the material, is the effective radius of the laser beam, z is defocus quantity, is the path function of laser scanning, is the level set function, which indicates that the energy occurs at the interface, is latent heat of evaporation, is the Stefan–Boltzmann constant, is radiation coefficient, is convective heat transfer coefficient, stands for latent heat of melting, is the universal gas constant, is the gas–liquid transition temperature, represents heat loss caused by evaporation of metal materials, and respectively represent energy loss caused by thermal radiation and thermal convection, and stands for heat loss caused by melting of metal materials. refers to the term of heat loss, mainly including thermal radiation and thermal convection loss, material evaporation loss and material melting heat loss. The evaporation loss and thermal convection loss of materials only occur on the surface directly affected by the laser, so the level set function is used to control the loss at the gas–liquid interface of materials, and the melting loss and thermal radiation loss of materials affected by heat play a role on the whole surface.
3. Results and Discussion
3.1. Simulation Parameter Setting
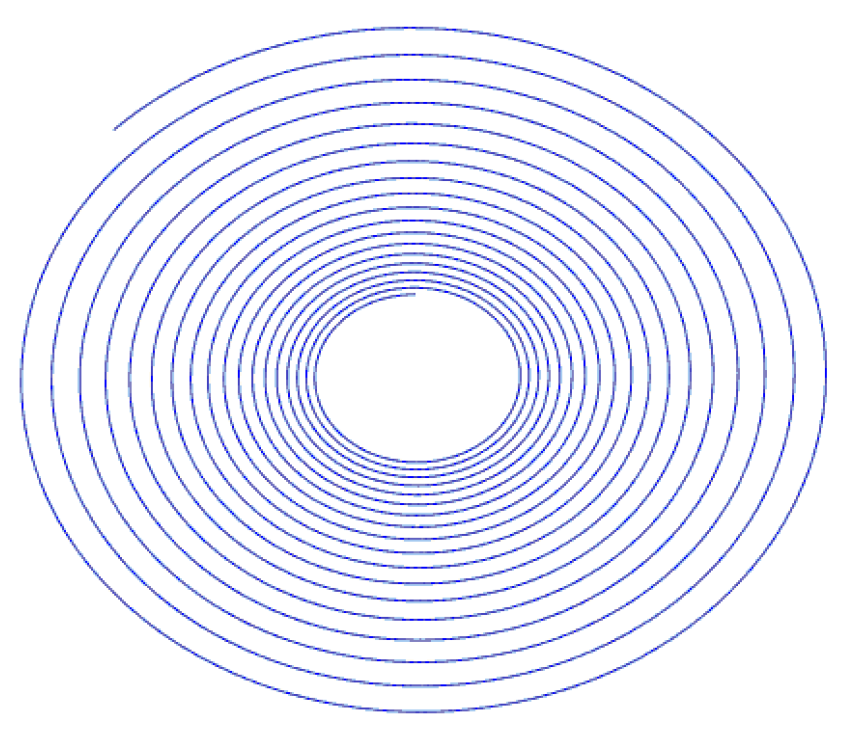
The schematic diagram of the laser scanning path for a nanosecond laser to process titanium alloy is shown in Figure 1. A nanosecond laser beam moves along the spiral scanning. The default laser parameters in the simulation were as follows. The laser power was 18 W, the pulse energy 1.8 mJ, the laser spot-size 27 μm, the repetition rate 10 kHz, the scan speed 2.4 m/s, and the number of iterations 20. The laser spot center moved spirally along a spiral path with an increasing radius ranging from 14 μm to 60 μm.
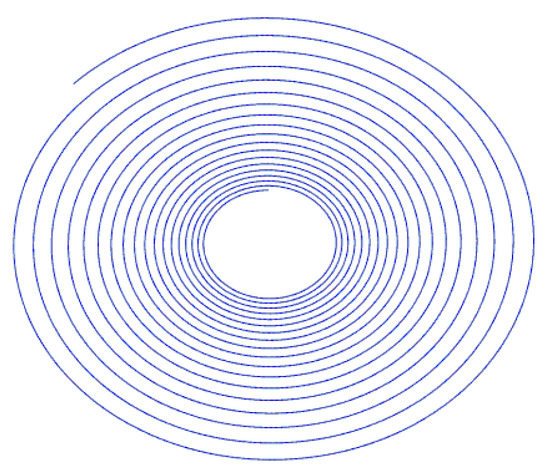
Figure 1.
Scanning path of nanosecond laser processing.
The numerical model of micropore ablation was established by COMSOL simulation software. The thermodynamic parameters of TC4 used in the simulation are shown in Table 1.

Table 1.
Thermodynamic parameters of TC4.
3.2. Simulation Results
3.2.1. Titanium Alloy Micro Hole Interface Evolution Process Simulation
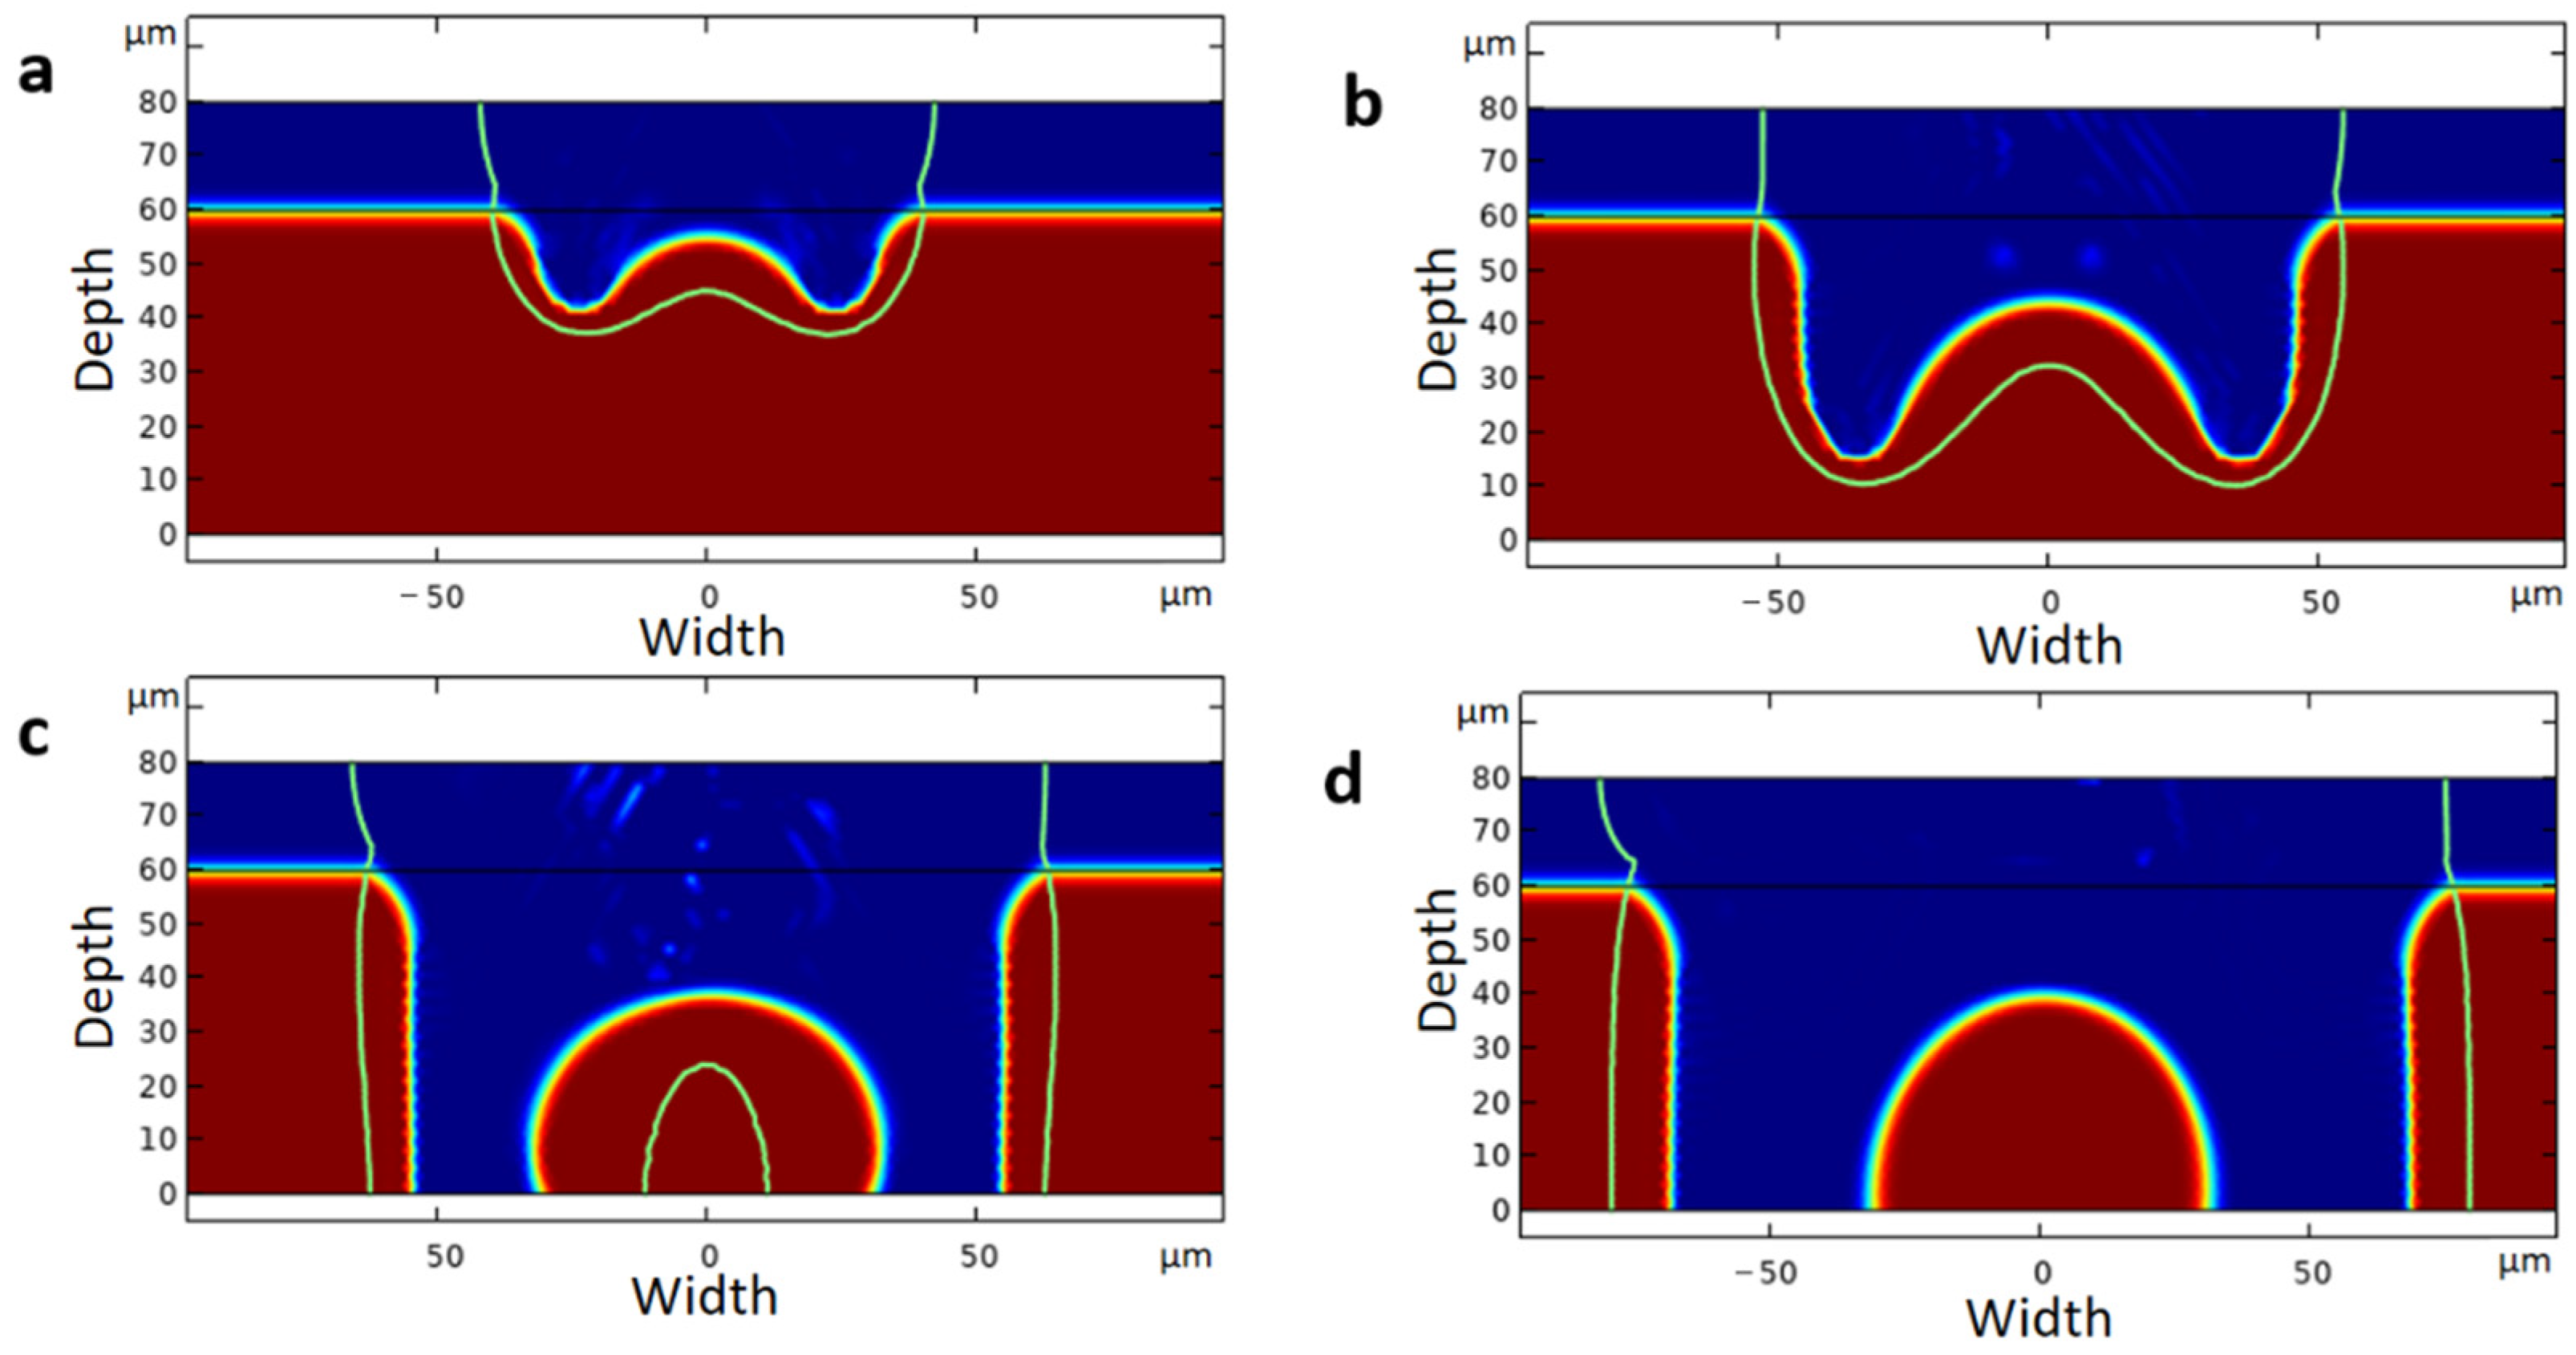
The changing process of the titanium alloy phase transition interface with time is presented in Figure 2, where the blue and red areas represent the gas phase and metal phase, respectively. The color interface between the red and blue areas denotes a two-phase mixing interface. The green line shows the isotherm of the melting temperature (1670 K).
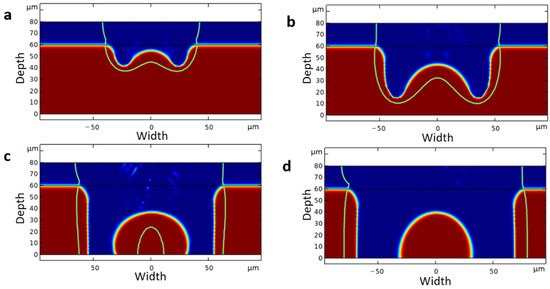
Figure 2.
Phase transition process of the free interface of the titanium alloy micro hole with the laser processing time t. (a) t = 0.058755 ms; (b) t = 0.11994 ms; (c) t = 0.16412 ms; (d) t = 0.23016 ms.
When the laser started processing (Figure 2a), a small pit appeared in the center of the material. With the laser processing time and laser position shift, the material gasified, and the depth of the micro hole increased rapidly. At the same time, the pit gradually moved to the left and right ends. In addition, changes in the pit’s width and depth were inconsistent, which could be observed from the energy distribution of the Gaussian light. The laser energy decreased exponentially from the center of the beam to the boundary of the spot. Since the Gaussian energy distribution characteristics of the light source on the spot point produced high temperature, which led to fast gasification of the near point of material and produced much heat, the effect of thermal radiation was not obvious. Moreover, it could be seen in the isotherm distribution that the heat change was concentrated near the light source point, and the generated heat radiation did not reach the phase transition temperature of the material after a few microns.
3.2.2. Variation Trend Analysis of Titanium Alloy Micro Hole
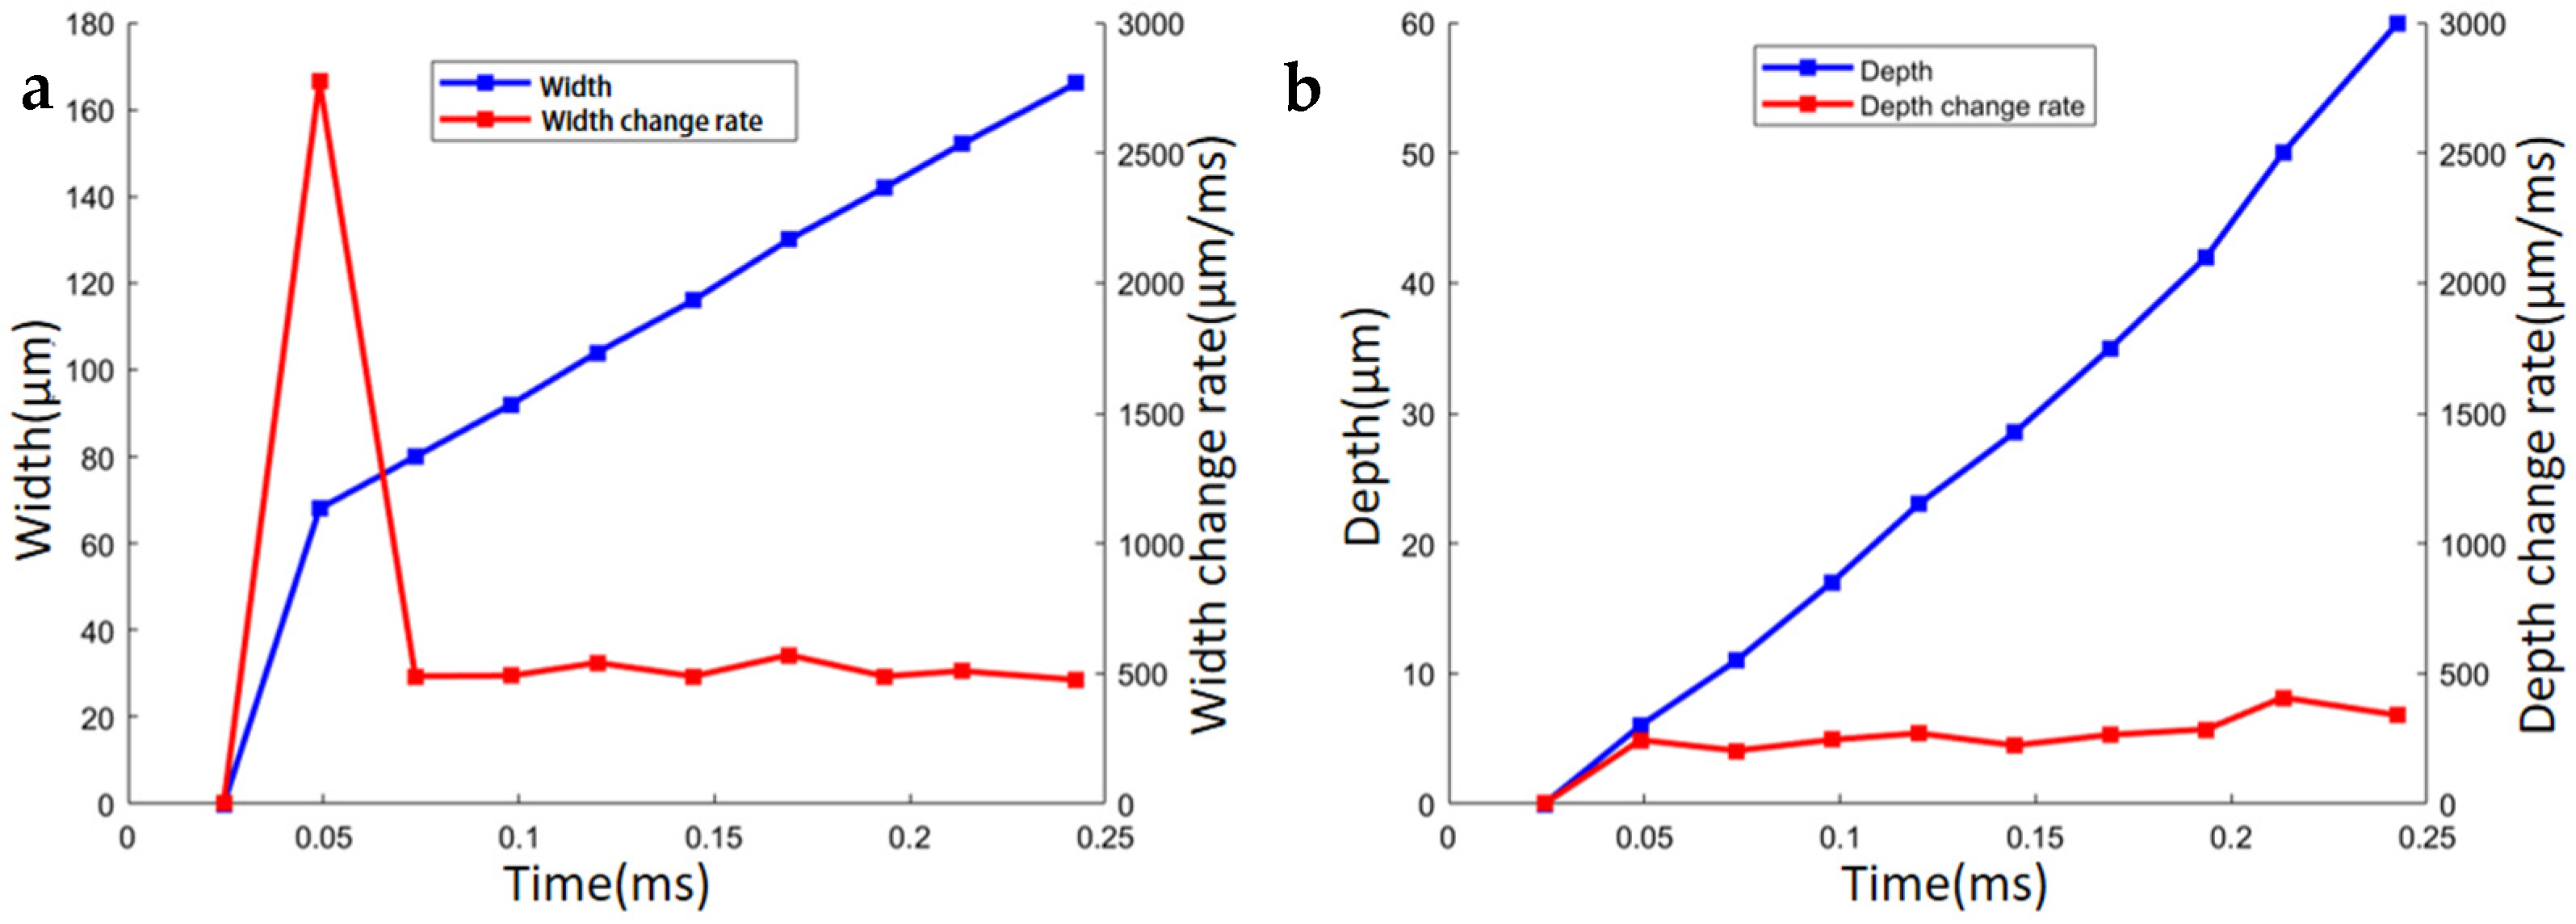
The variations in the micro hole’s width and depth with the laser processing time are shown in Figure 3. As shown in Figure 3a, the micro hole’s width first increased quickly, and then the increase slowed down rapidly. This could be due to the high energy in the center of the laser beam that could easily cause the material to reach the gasification temperature. Therefore, in the initial stage, the laser could easily remove the material. However, it took a longer time for the temperature of the material far from the center of the laser spot to reach the gasification temperature. As a result, with laser processing, the width of the micro hole increased gradually, but the width change rate decreased gradually. In contrast, the depth change rate of the micro hole did not change significantly during the entire process, as shown in Figure 3b. This could be attributed to the Rayleigh range of the Gaussian beam that was larger than the simulated thickness of 60 μm, while the energy loss of the laser along the optical axis was lower. In addition, the reason for the slow change in the depth change rate of the micro hole was that the processing heat residue caused a rapid increase in the downward speed.

Figure 3.
Micro hole variations with processing time: (a) width; (b) depth.
3.2.3. Fluid Velocity Analysis
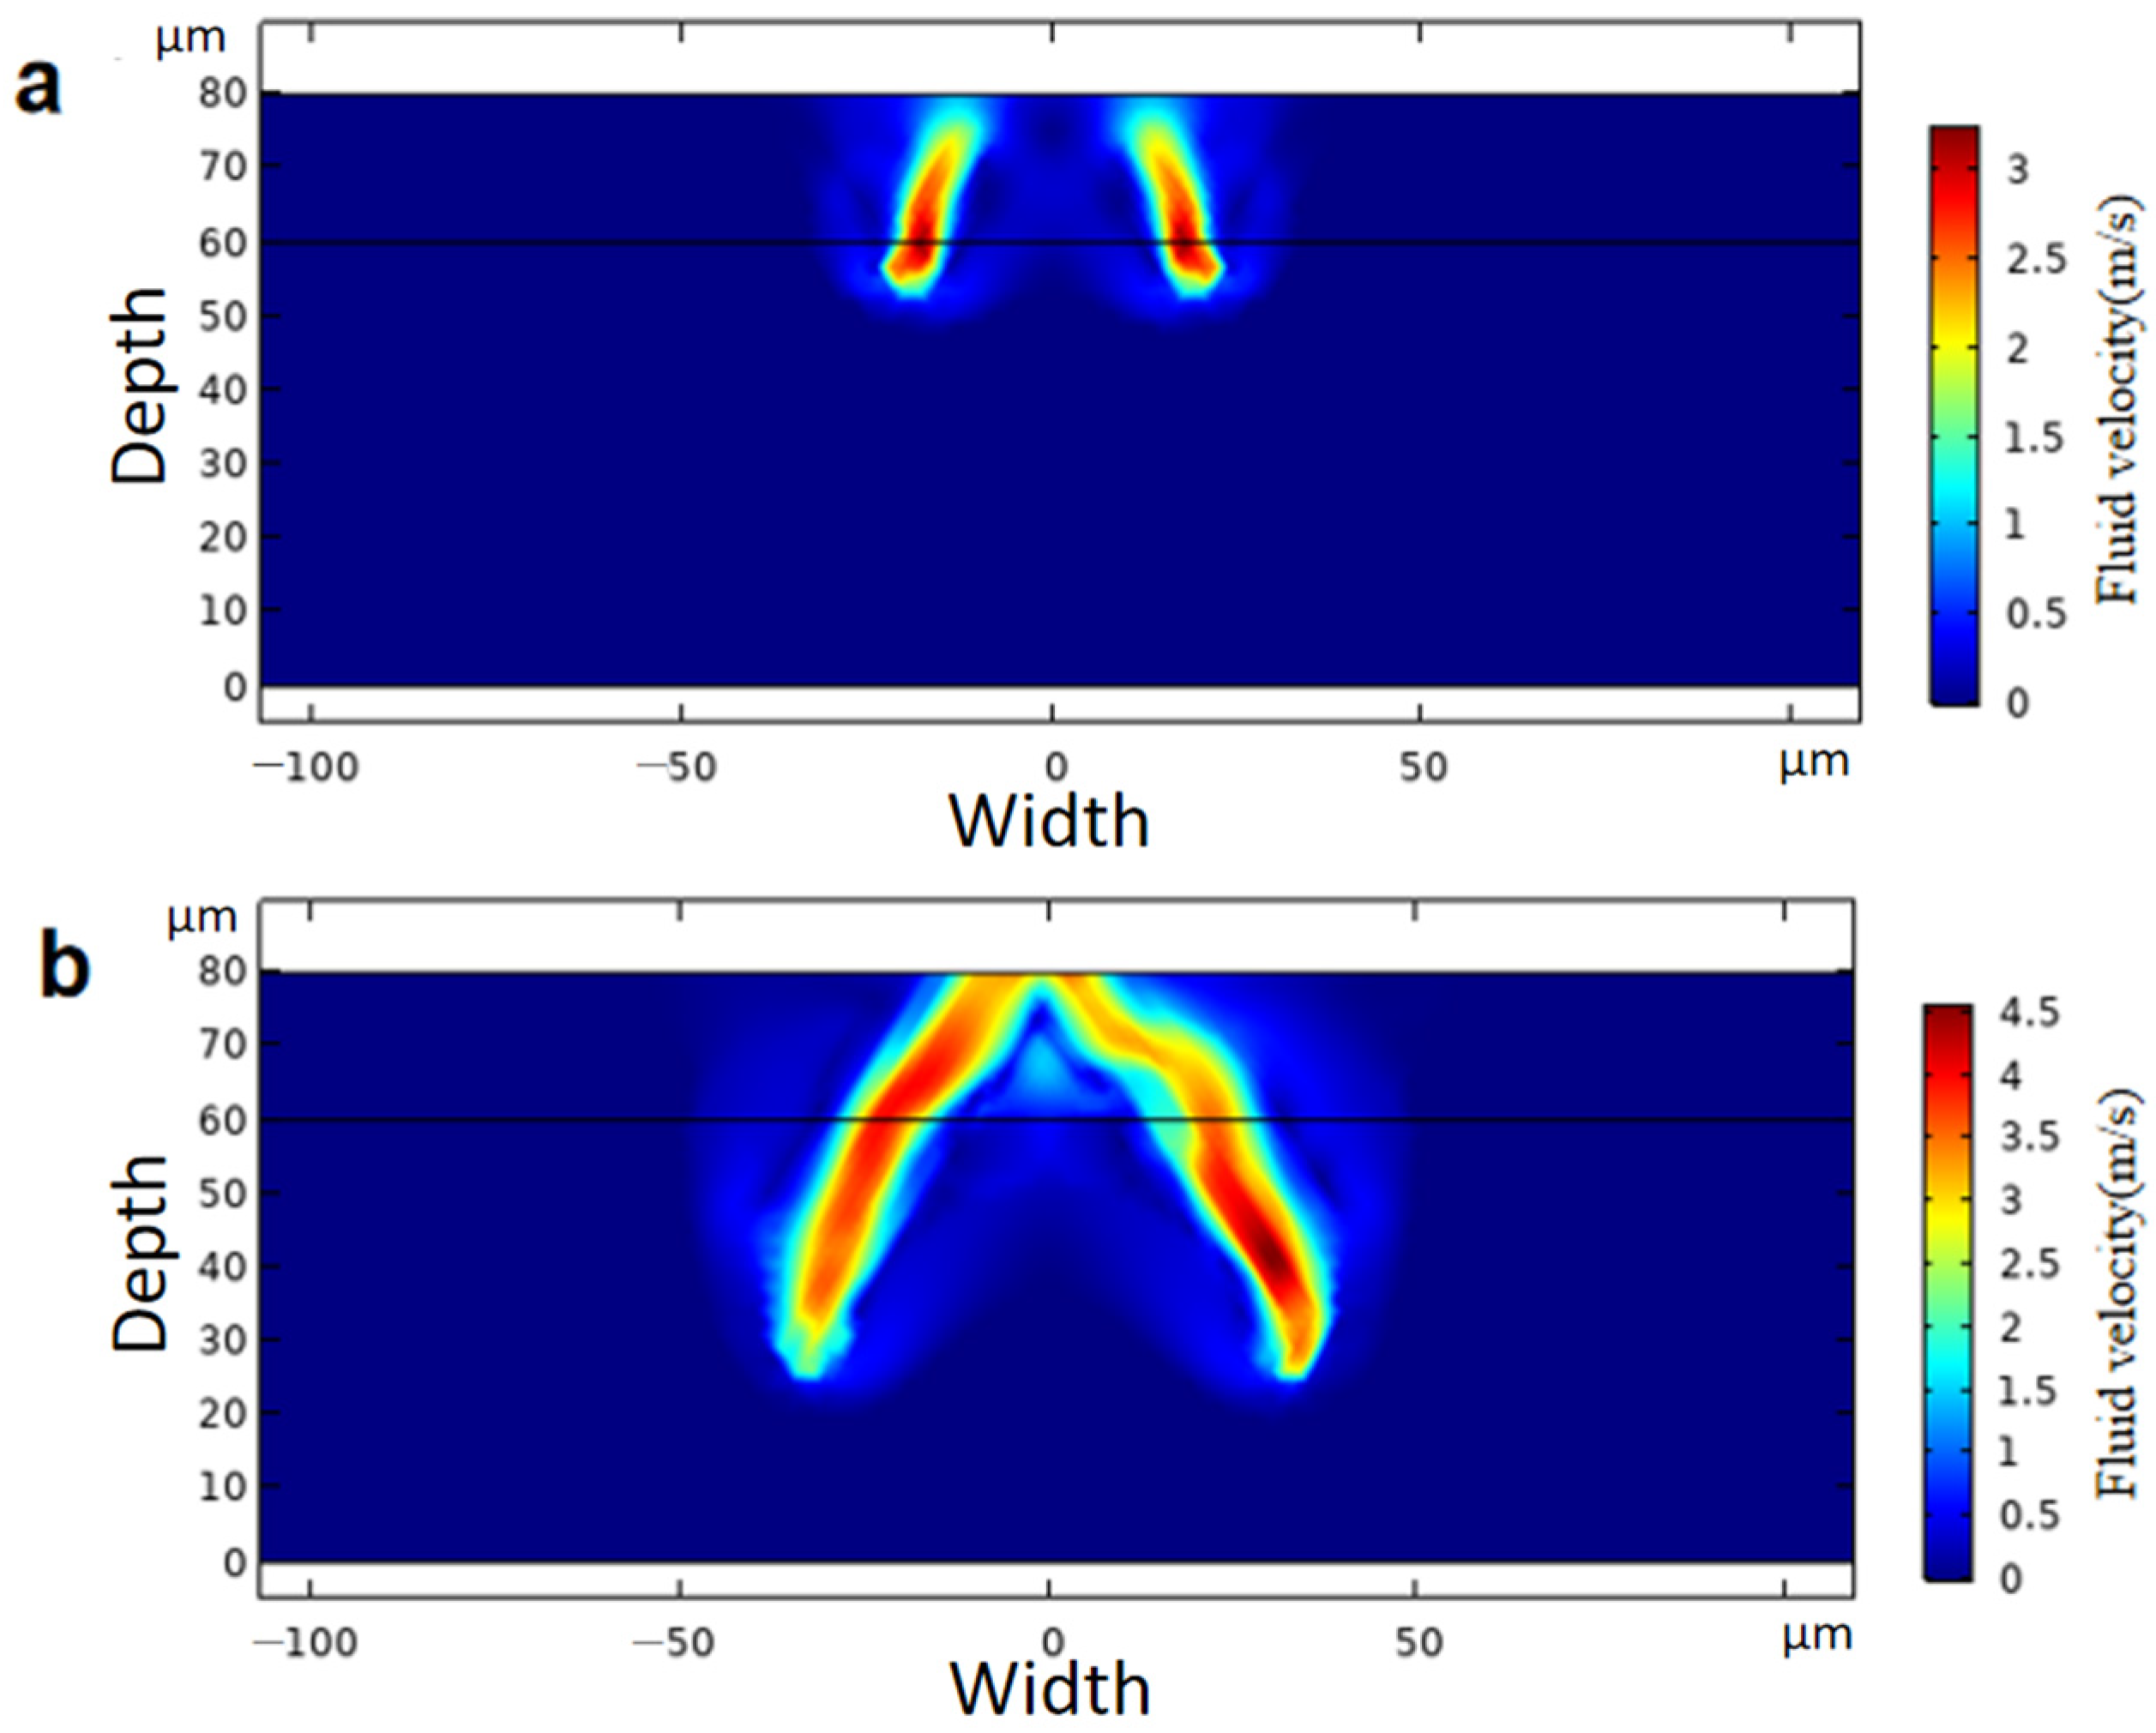
To study the movement process of the metal vapor further, the fluid velocity of the metal vapor was analyzed at different times, as shown in Figure 4, where the color indicates the velocity value in m/s. The results of the temperature simulation showed that the metal material evaporates under the action of the laser to generate metal vapor, which is sprayed from the bottom of the small hole to the outside of the small hole under the pressure difference and diffuses into the surrounding air. The velocity field simulation results show that the metal wall of the hole shaft is much higher in the steam velocity or other areas. This may be related to the Gaussian distribution of laser energy. Because the laser energy in the center of the laser beam is high, the central part of the material is easy to gasify. The metal vapor in this part is dense, and the generated vapor pressure is also the largest. Therefore, the metal vapor diffusion rate in the center of the spot is the largest and, the material removal rate is the highest. In actual laser processing, the metal vapor velocity might be larger than the simulation result due to the expansion effect of plasma.

Figure 4.
Fluid velocity change with laser processing time: (a) t = 0.034961 ms; (b) t = 0.10367 ms.
3.2.4. Effects of Processing Parameters on Micro Hole
Laser Power Effect
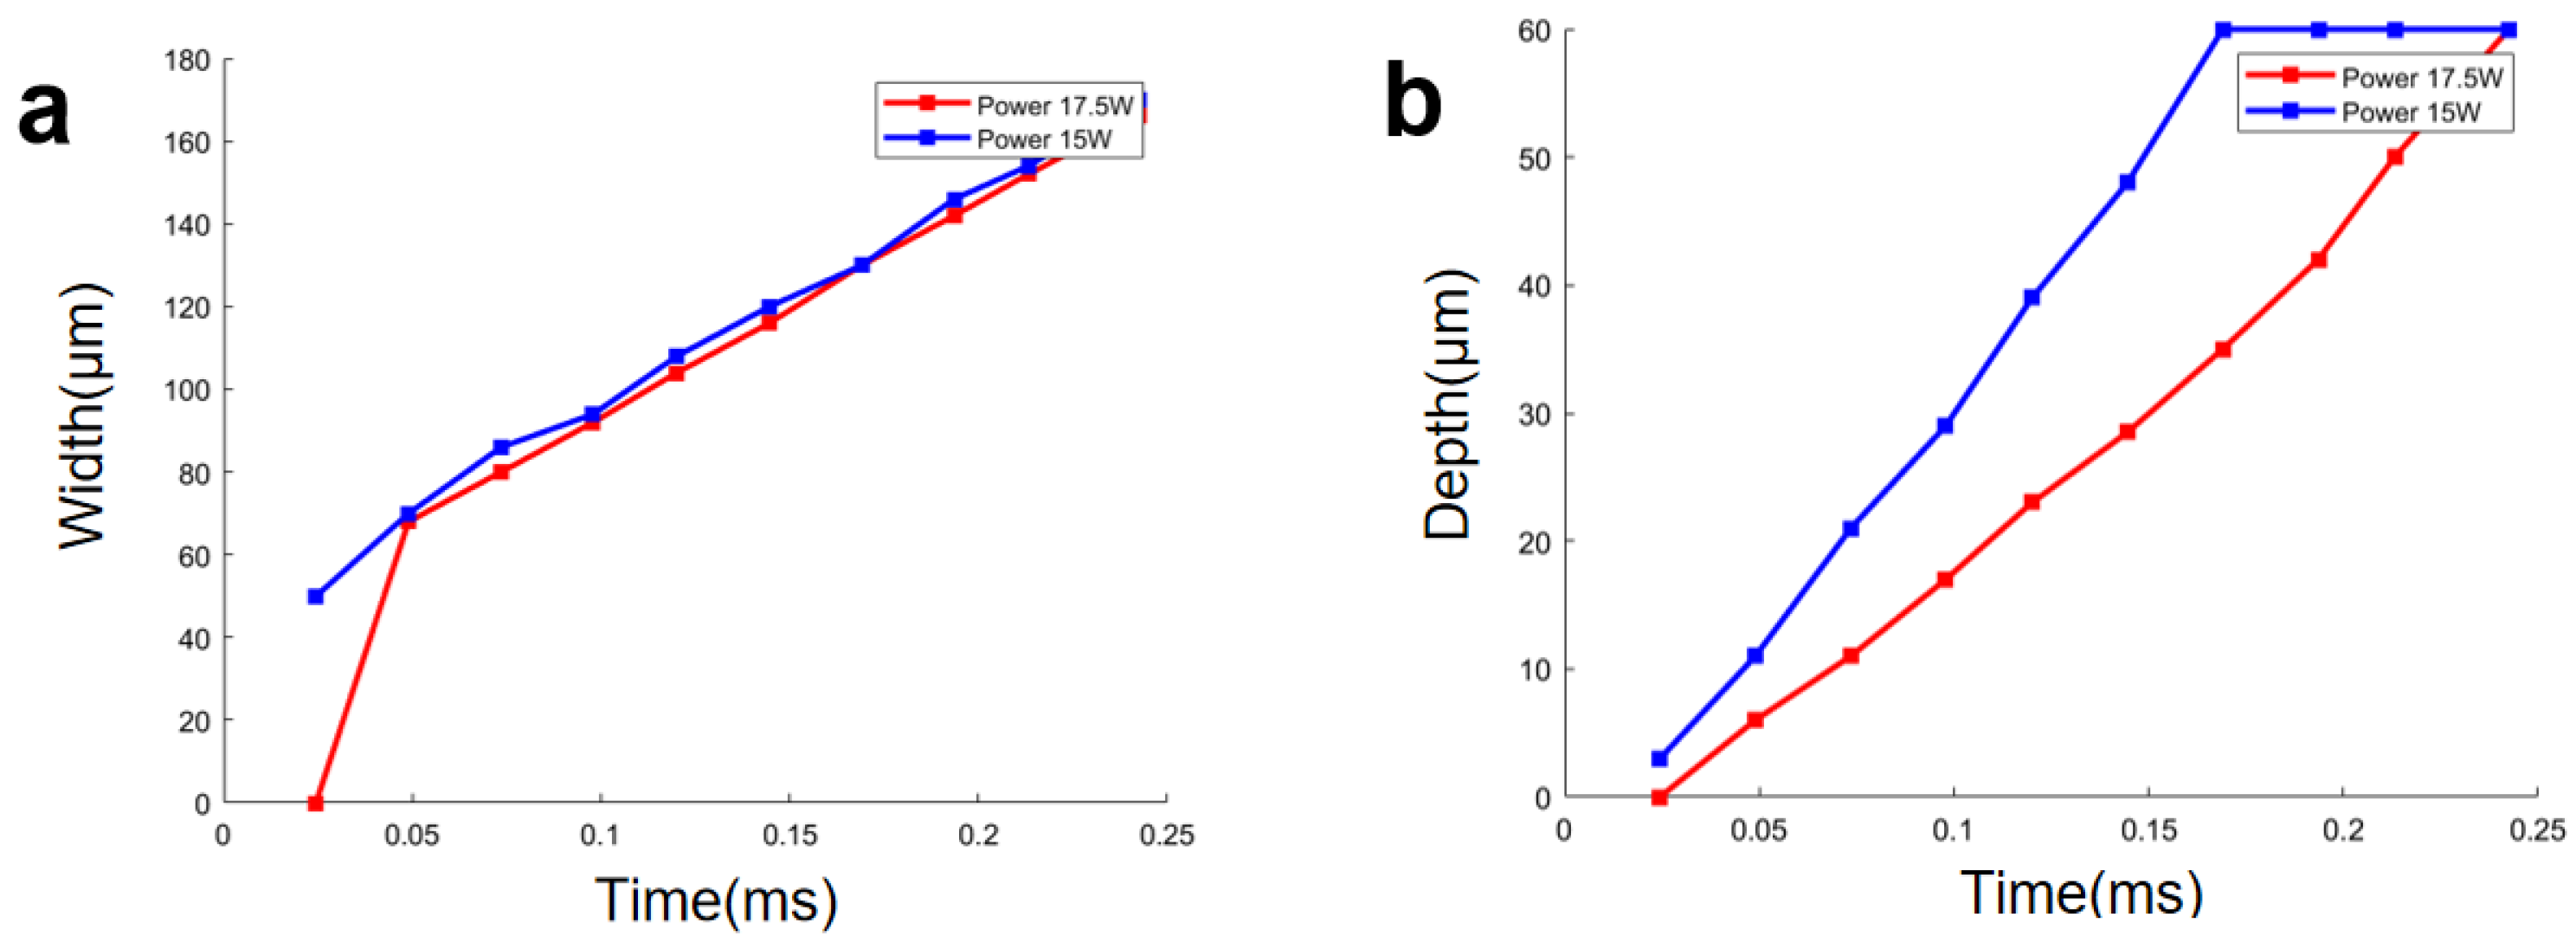
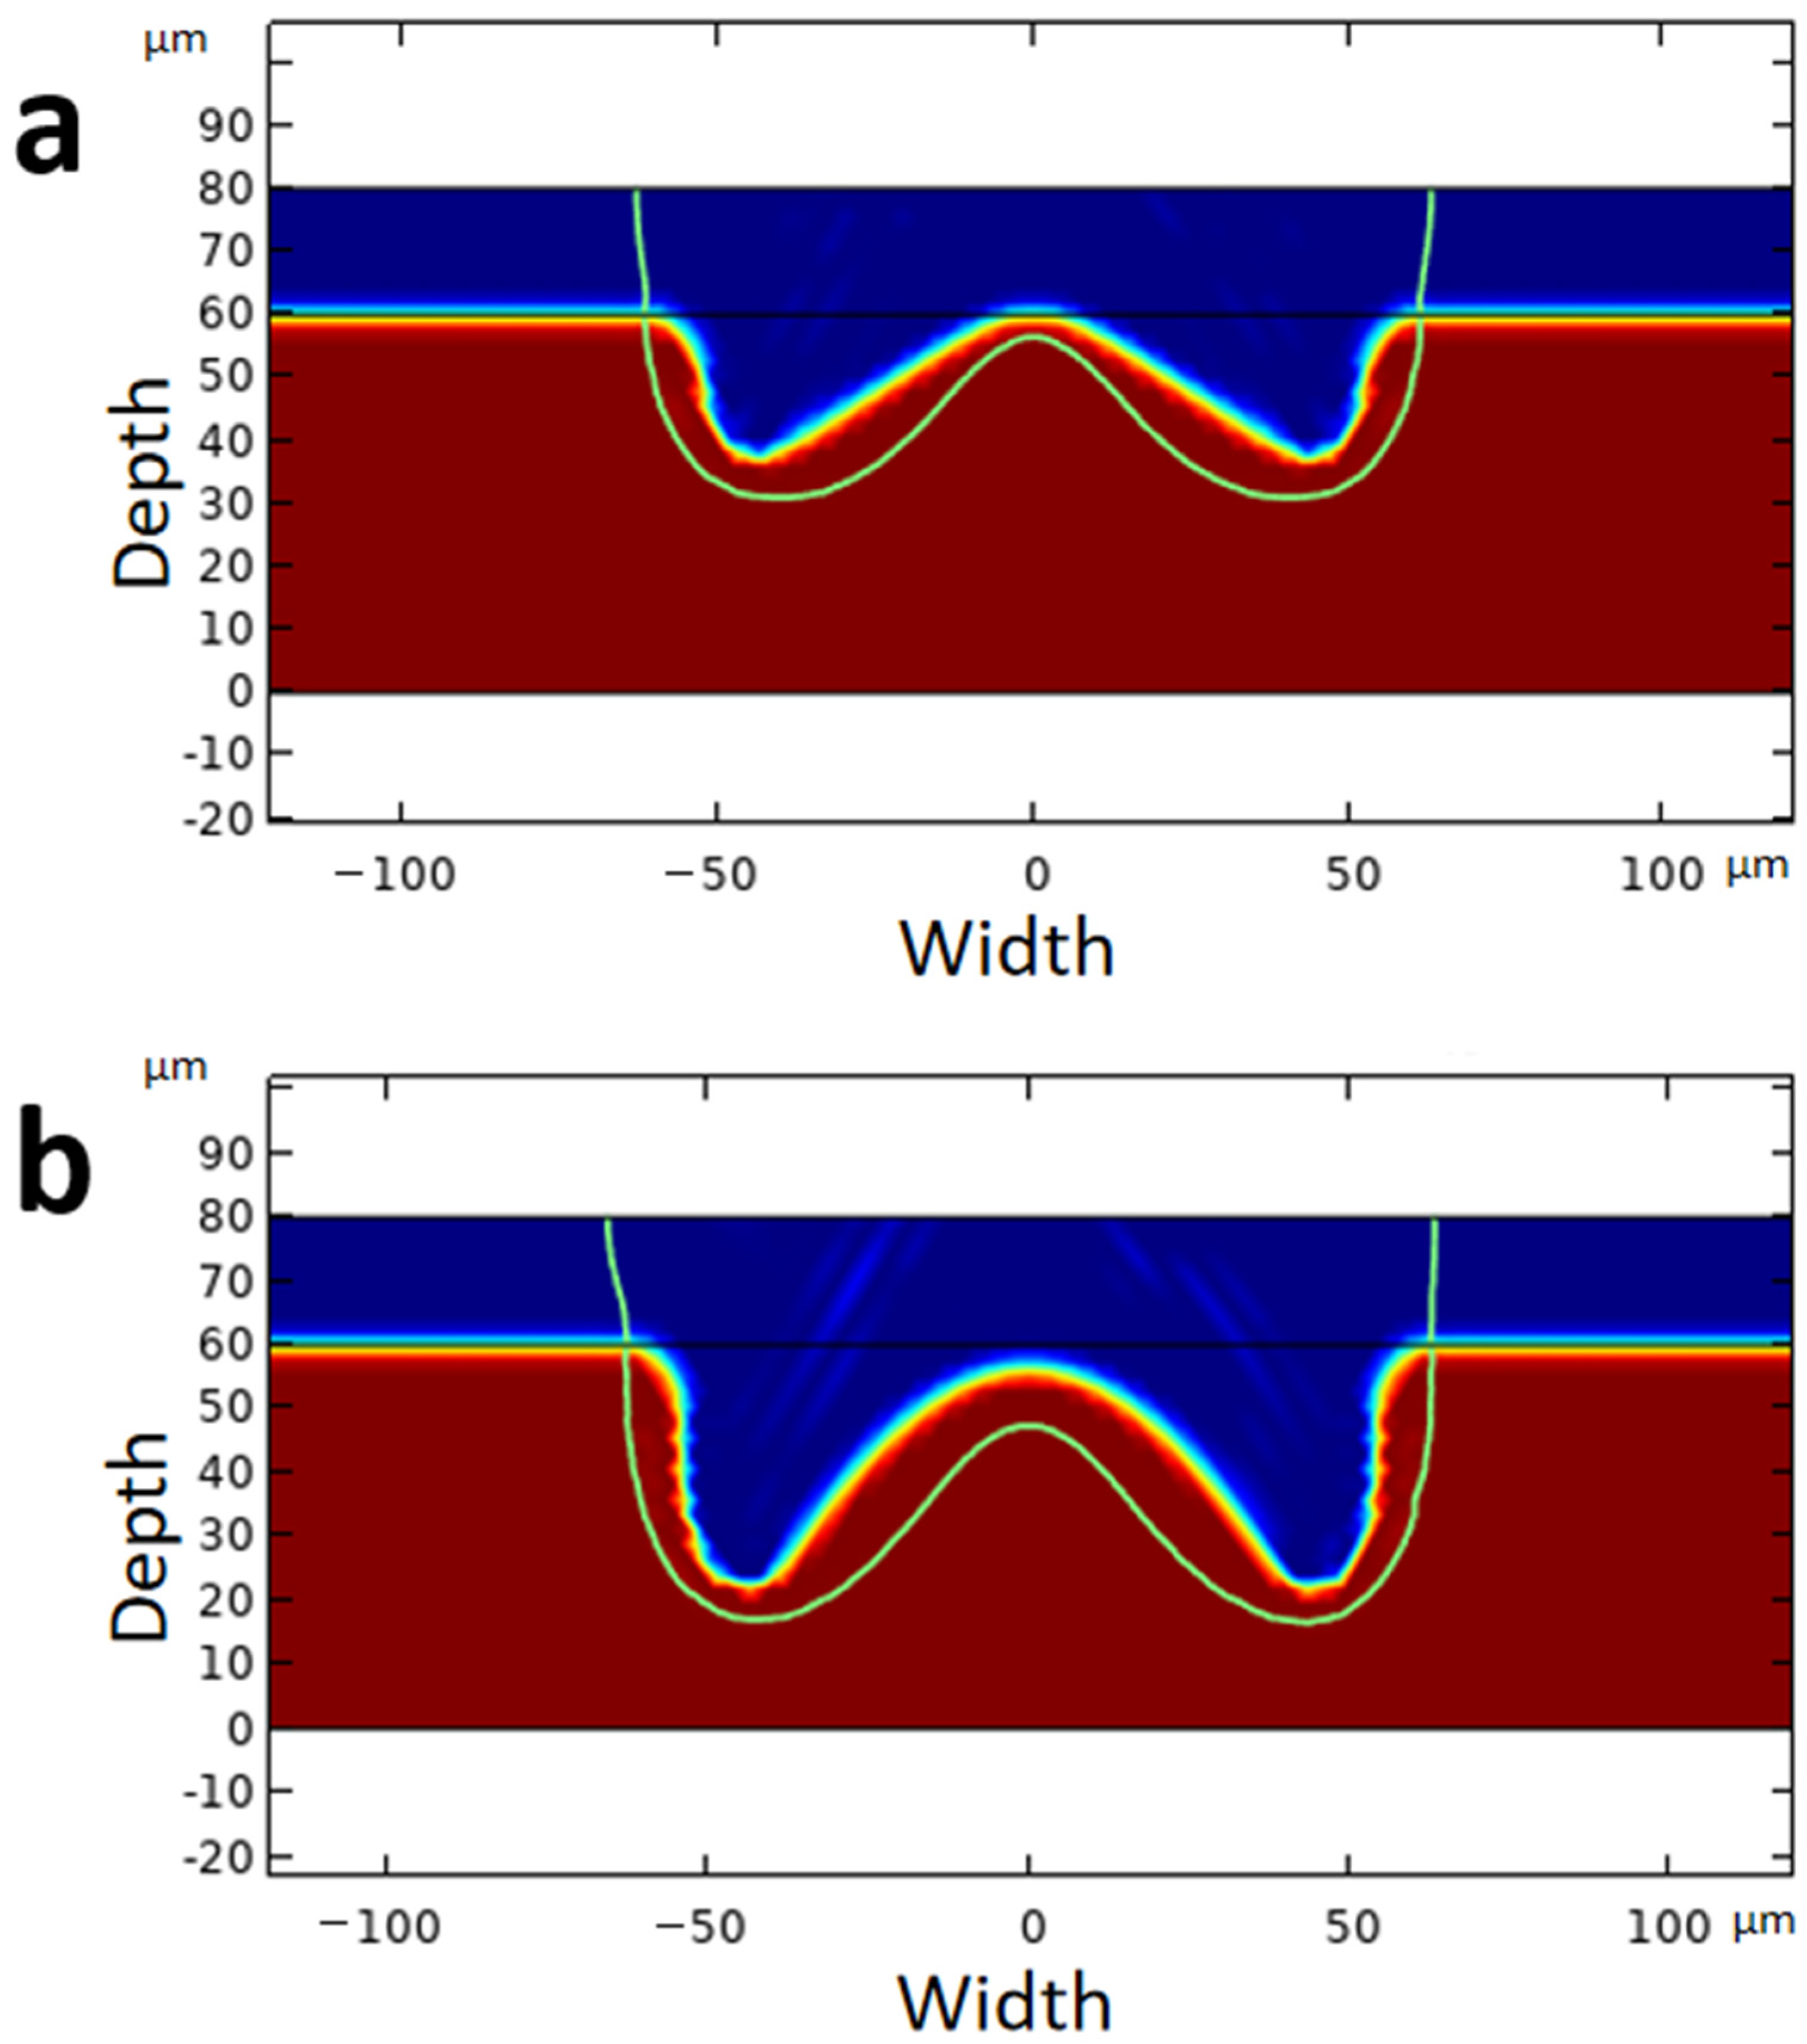
The effect of the laser power on the micro hole was analyzed by changing the laser power from 15 W to 17.5 W while keeping the other parameters unchanged. The time-varying curves of the micro hole depth and width at different laser powers are presented in Figure 5. As shown in Figure 5, when the laser power reached the ablation threshold, the depth of the micro hole increased with the laser power, but its width increased only slightly. This shows that increasing the laser power can increase the material removal speed in the depth direction and only slightly affect the width direction. This is because the energy of the Gaussian beam is concentrated in the center of the laser spot, and changing the energy will have a greater impact on the energy peak of the center of the laser spot and a smaller impact on the energy of the spot boundary. The influence of different laser powers on the material temperature distribution at the same laser processing time is shown in Figure 6. The green line indicates the isotherm of the melting temperature (1670 k) of the material, and the material between the isotherm and the dark blue (air) is the material still in the molten state at the current time. It can be seen from Figure 6 that the thickness of the molten pool near the center of the spot at 17.5 W laser power was slightly thinner than that at 15 W laser power. This happens because the laser power at 17.5 W makes the removal speed of the material in the center of the spot greater than that at 15 W. There is not much difference in the thermal diffusion rate between the two because the center temperature is close to the evaporation temperature of the material.
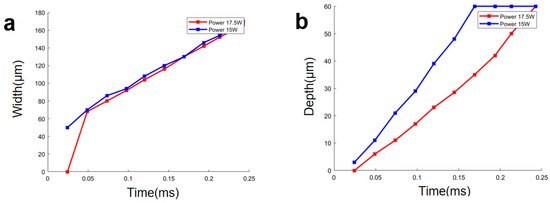
Figure 5.
Effect of laser power on the micro hole: (a) width; (b) depth.
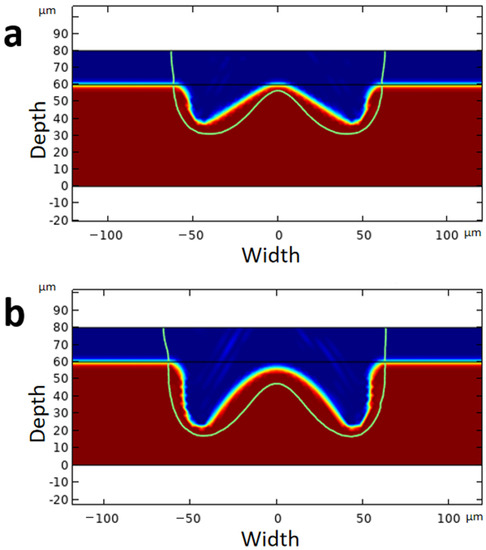
Figure 6.
Simulation results for the temperature and micro hole shape at t = 0.12 ms under different laser powers: (a) 15 W; (b) 17.5 W.
Scanning Speed Effect
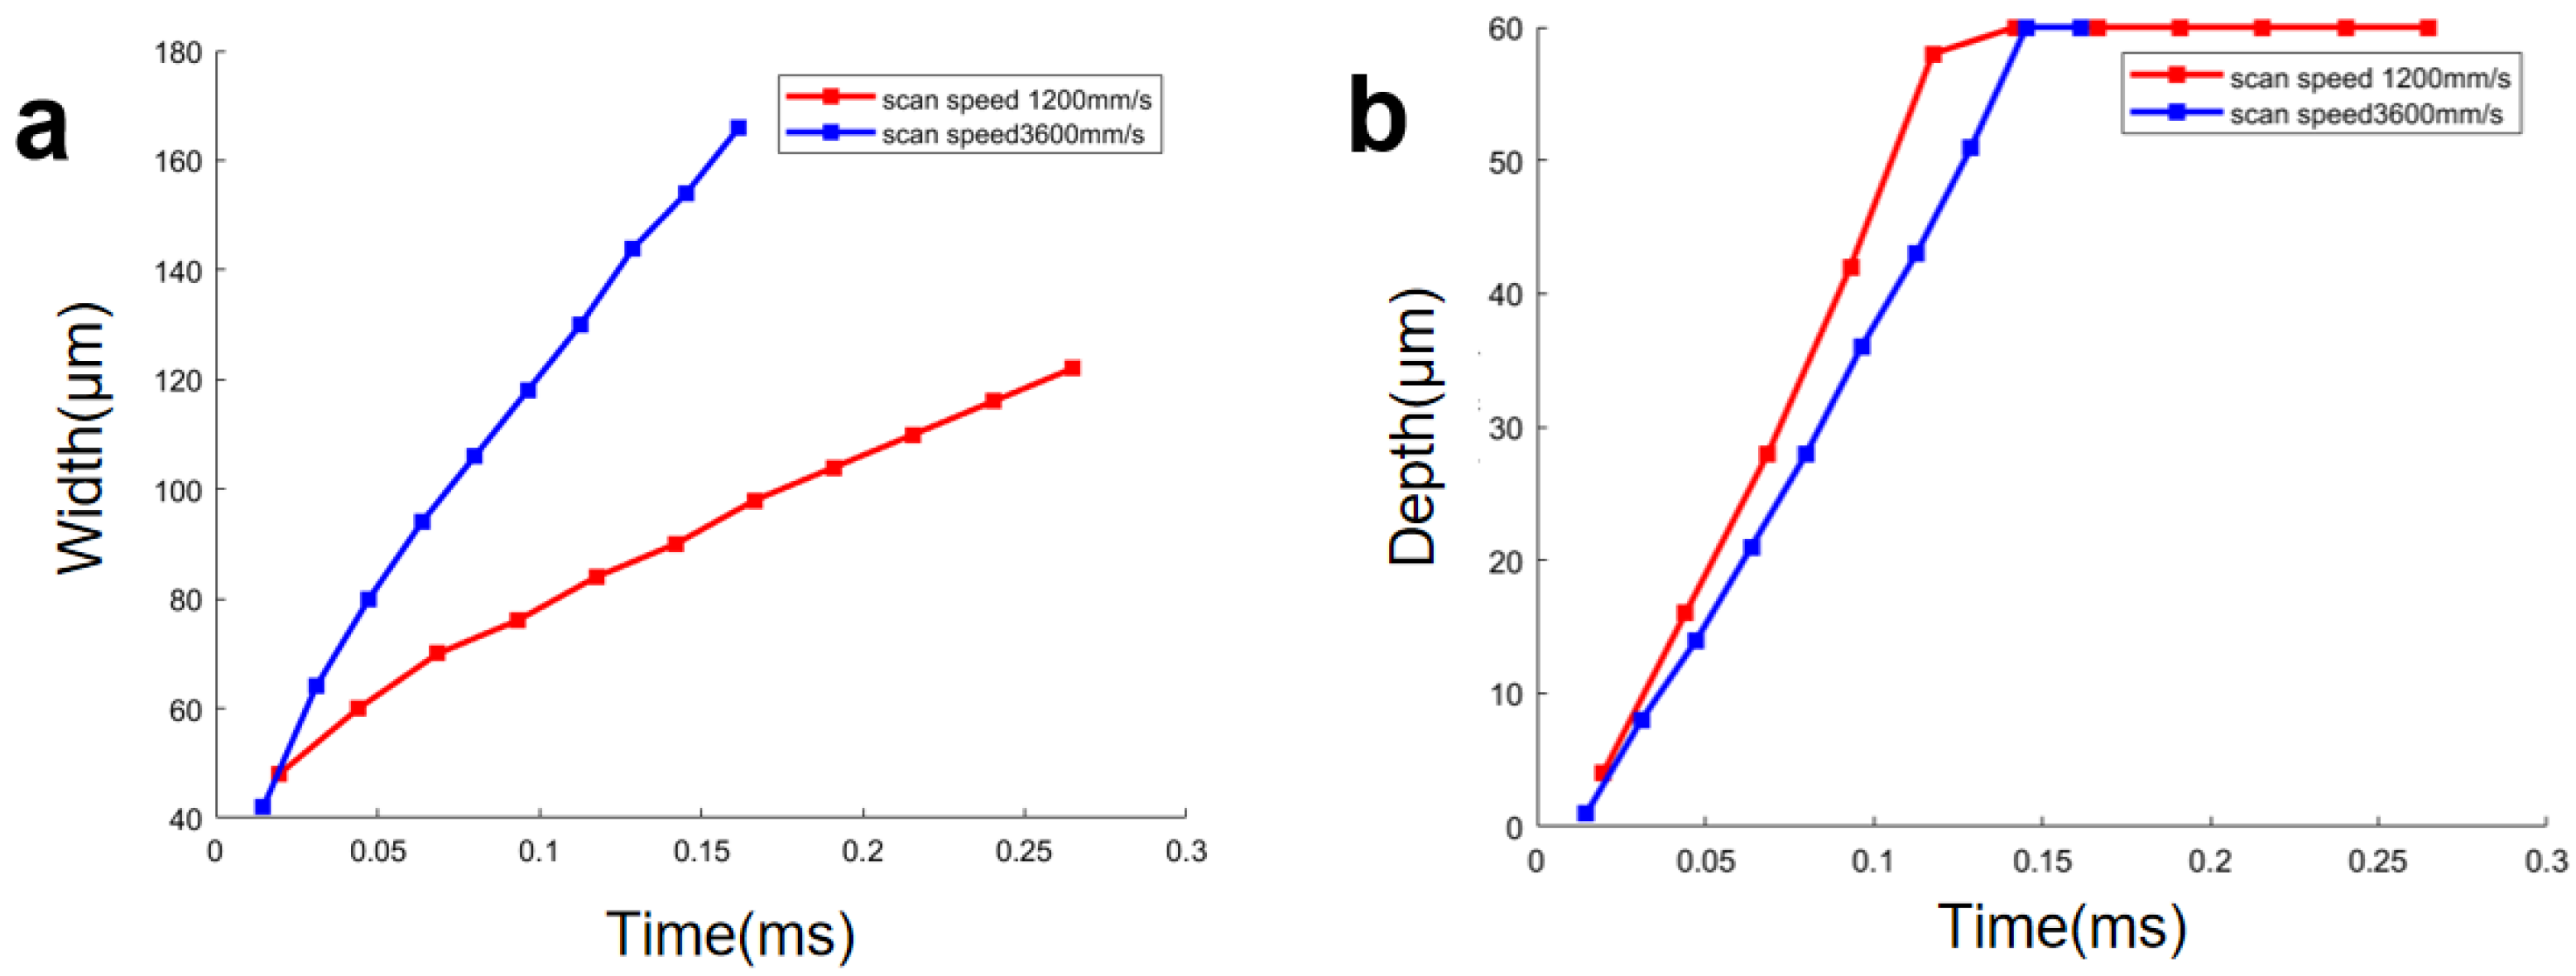
The laser scanning speed effect was examined by changing the scanning speed from 1200 mm/s to 3600 mm/s while keeping the remaining parameters unchanged. Figure 7 shows the time-varying curves of the depth and width at different scanning speeds. As shown in Figure 7, with the increase in the scanning speed, the width of the micro hole increased, but the depth of the micro hole decreased slightly. This was because when other conditions remained the same, the increase in the scanning speed reduced the beam overlapping of the laser on the material surface and the removal rate. At the same time, the decrease in the laser energy density on the micro hole wall reduced the increase in width caused by the thermal effect.
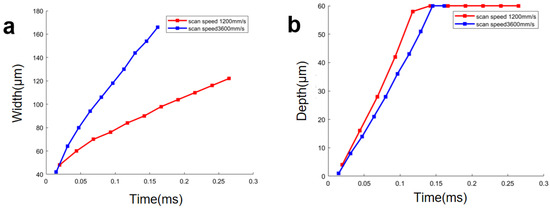
Figure 7.
Effect of scanning speed on micro hole shape: (a) width; (b) depth.
Scanning Path Effect
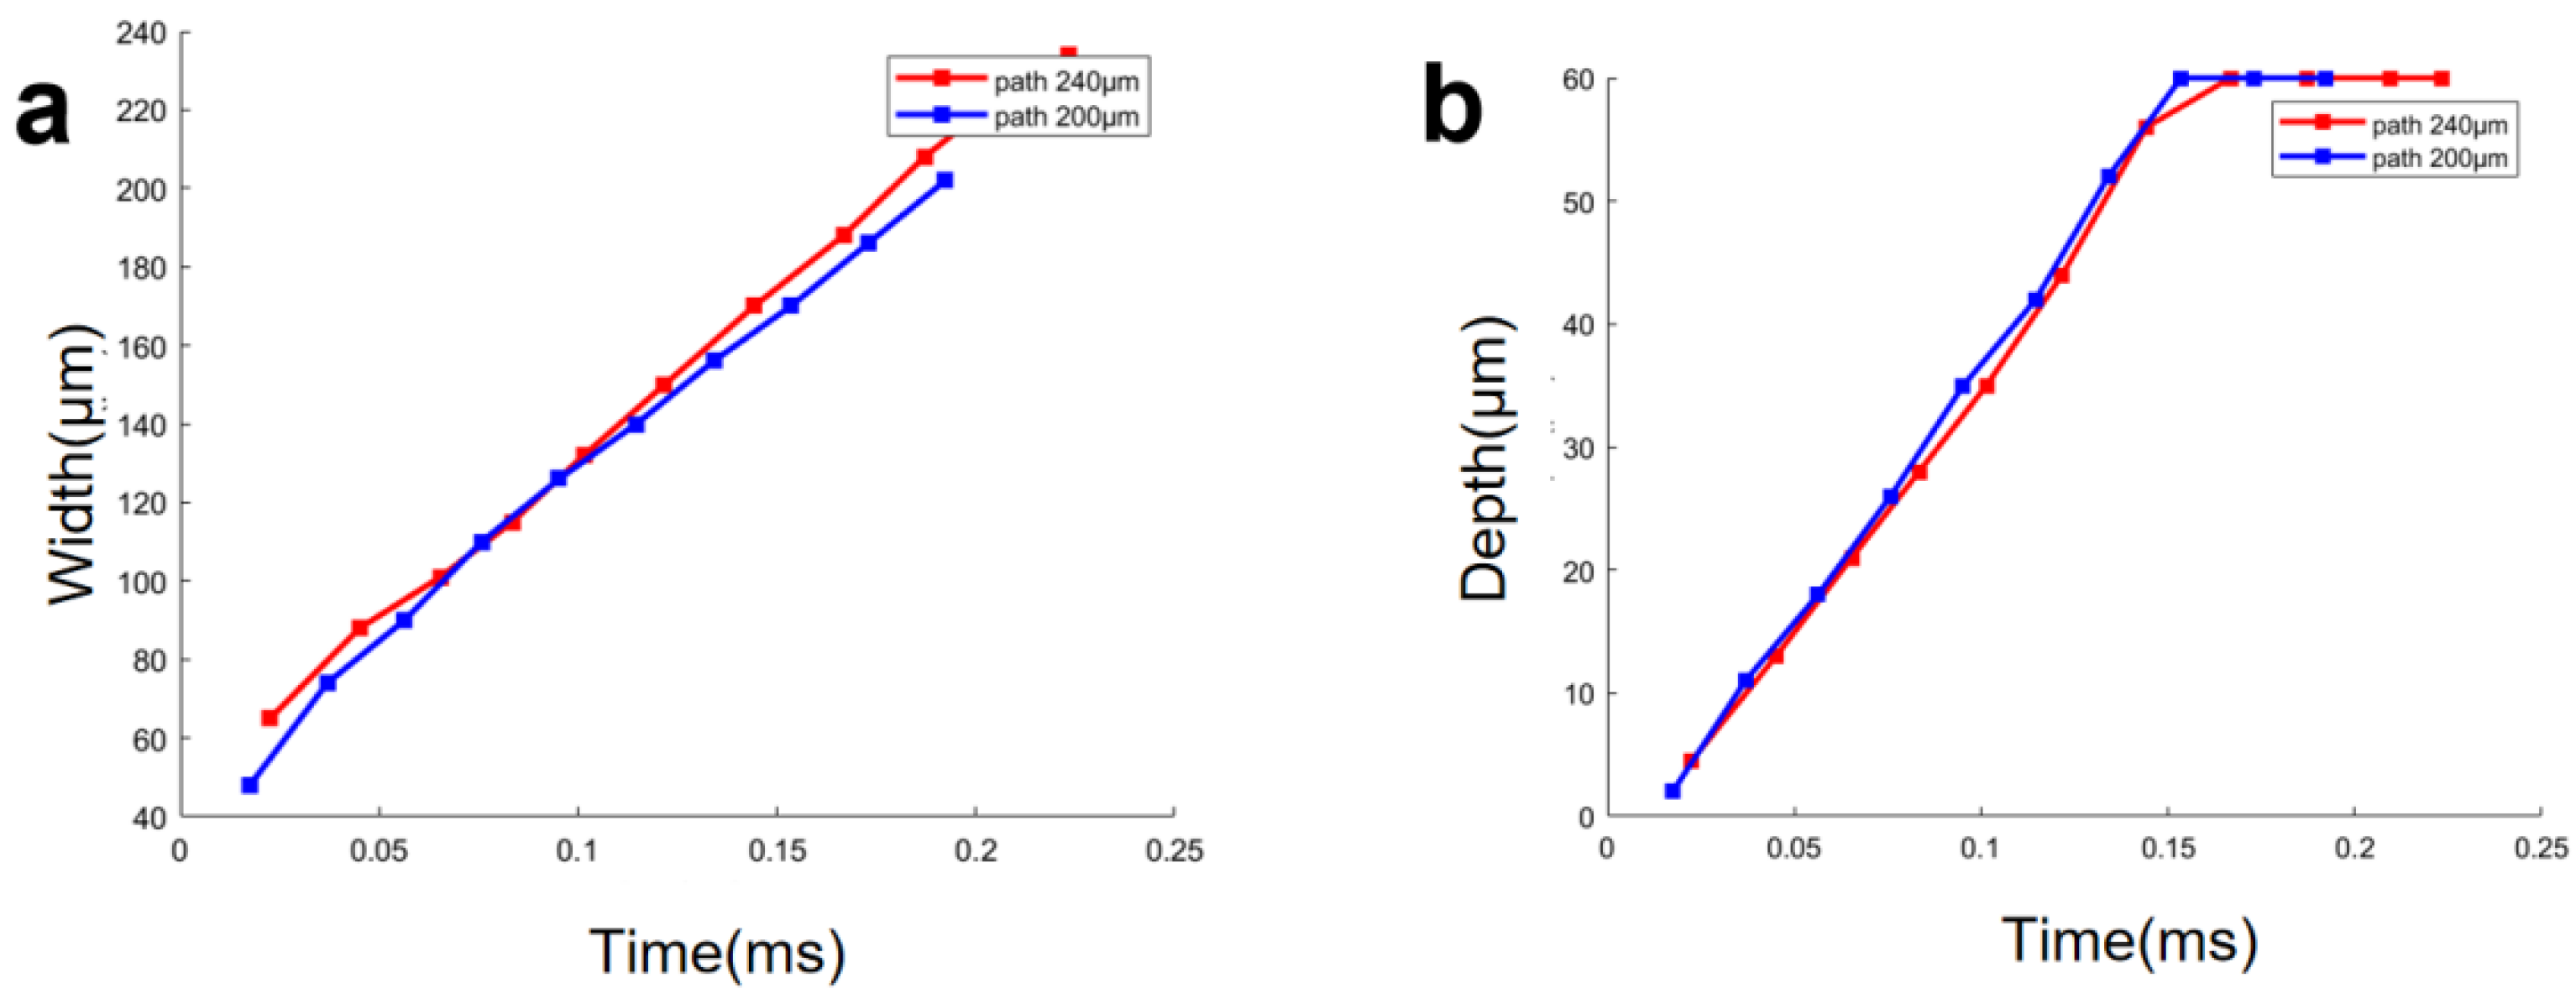
The effect of the scanning path was investigated through simulations under the same simulation conditions, and the same initial position of the scanning path, by changing the end path position from 70 µm to 110 µm of the scanning radius. Figure 8 shows the time-varying curves of the depth and width for different scanning path ends. The results indicated that with the increase in the path length, the final width of the micro hole’s shape increased, while the depth of the increasing speed of the micro hole’s shape decreased. This was because, with the change in the end position of the path, the final position of the laser processing also changed, which increased the final forming width. As the path became sparse, the laser energy density acting on the material decreased, which reduced the removal speed in the depth direction.
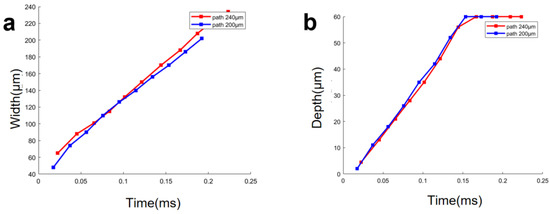
Figure 8.
Effect of scanning path on micro hole shape: (a) depth; (b) width.
According to the above simulation data, the formulas related to the increase in speed of micropore width and depth, power and scanning speed were fitted. The specific formulas are as follows:
3.3. Experimental Results
To verify the validity of the simulation model, a nanosecond laser (Light Conversion l17771) was used to process titanium alloy samples of 60 µm under three sets of laser processing parameters. The three-dimensional micro hole’s shape was measured by a confocal laser microscope (OLS4100, Olympus Corporation, Wenzhou, China). The measured results were compared with the simulation results obtained under the same parameters. The parameters of the three simulation cases are shown in Table 2.
Table 2.
Experimental sample and the corresponding processing parameters.
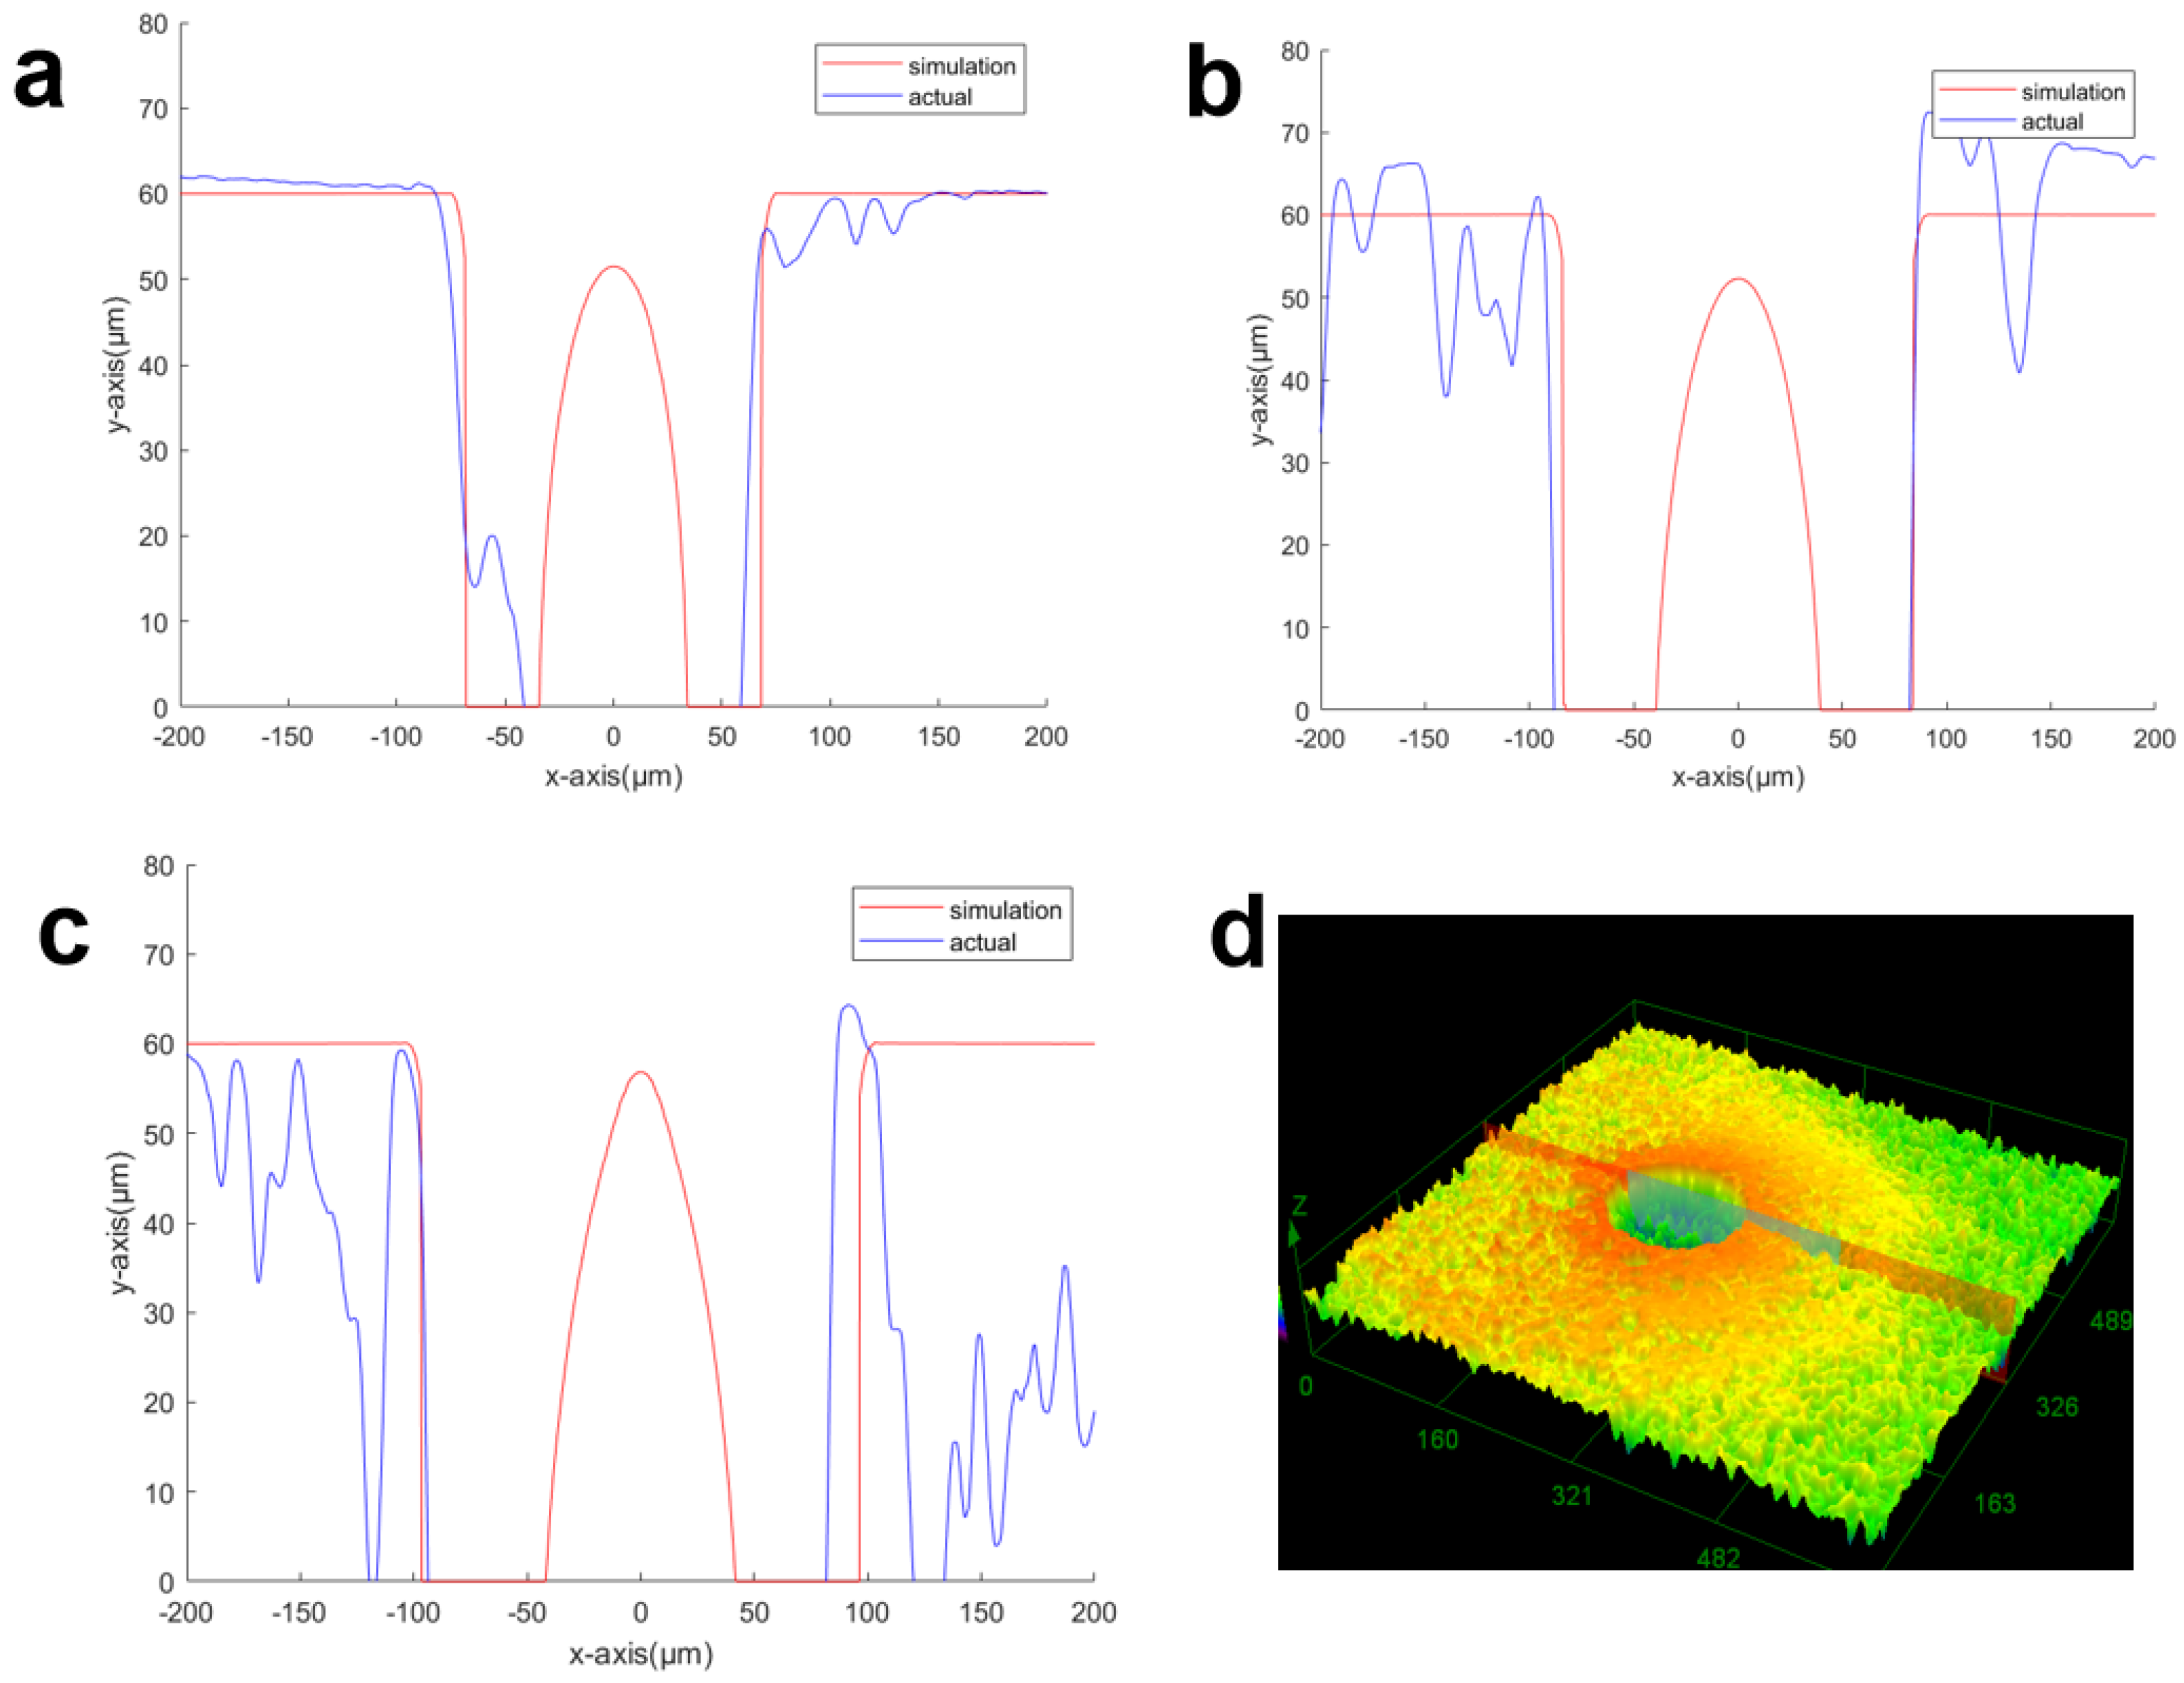
The comparison diagram of actual processing results, simulation results and the three-dimensional scanning graph are shown in Figure 9. The simulation results showed that there was a bulge in the center of the micro hole’s shape, which denoted the residual materials after laser processing. In actual processing, these residual materials will remain on the substrate due to the lack of support. There was an error of approximately 25% in the width direction, but the wall of the micro hole’s shape and the radian at the laser inlet were similar, which could be caused by a machining mechanical error. For case c (Table 2), the radius of the outermost scanning path reached 116 µm, but the actual diameter was only 96 µm. This could be attributed to the scanning path deviation caused by an installation error of the machining platform. By comparing the combination of the simulated phase transition interface and the temperature gradient map with the actual machined 3D topography, it was found that the taper of the actual micro hole’s shape was related to the thickness of the region from the solid–liquid transition line to the gas–liquid transition line in the simulated temperature gradient. This indicated that the taper of the micro hole’s shape was caused by the flow of the molten metal that was not cooled down after the laser processing. This conclusion is consistent with the conclusion of Andrius et al. [21] obtained on the basis of experimental results of picosecond single-line repeated processing. They found that when the repeated time number reached a certain value, the increase in the processing times or energy density could lead to a rapid increase in the width, but the depth of the micro hole’s shape would decrease gradually.

Figure 9.
Comparison of the simulation and actual results under three laser parameter setups shown in Table 2. (a) No. a; (b) No. b; (c) No. c; (d) experimental results for the 3D micro hole’s shape.
4. Conclusions
In this study, the application of a nanosecond laser in practical engineering processing was numerically simulated. The long-time simulation results for the phase transition after nanosecond laser processing were discussed. Four states of material passing through two phases and temperature gradients were defined, and fluid dynamics were applied to the model. After a long-time simulation, the complex molten pool fluid behavior of a nanosecond laser was explained based on the interaction between the metal fluid and the steam. The simulation results were consistent with the actual data, and the effectiveness of the simulation model was verified. Based on the fact that solids are regarded as fluids with great viscosity coefficients, the complex nanosecond laser long-term processing model could be transformed into a time-domain thermodynamic fluid motion model to simulate materials. The characteristics of the micro hole’s shape predicted by the simulation model were compared with the experimental results, and the following conclusions were derived:
- A two-phase flow heat transfer model for nanosecond laser processing of titanium thin plate was established. The simulation model of microporous perforation was provided, which made up for the deficiency of deformation geometry simulation for perforation simulation.
- The model described the change in micropore shape under a spiral path and simulated the temperature distribution in the plate. By analyzing the isotherm and the shape of micropores, the movement behavior of molten pool was explained, and the thickness of the recast layer was displayed intuitively.
- The shape of the morphology depended on the distribution of laser energy. The shape obtained in the actual machining was consistent with the shape predicted by the simulation model. The flow change in the molten pool in the model explained the formation principle for a small number of fillets at the entrance of the material and the micro hole taper in the micro hole machining.
- With the increase in laser energy, the material removal rate, the depth and diameter of the morphology increased. The effect of laser energy on the morphology was more significant than other process variables. The relationship between laser power and scanning speed and the depth and width of micropores was established.
- The simulation model can be used as a prediction tool to select the best optical parameters to ensure the product quality and lowest cost of laser processing. In order to ensure the high efficiency and quality of laser processing, we should first select the appropriate laser energy parameters (such as the type and power of the laser), and then control the scanning speed, scanning path and other parameters to optimize the processing process.
Author Contributions
Conceptualization, K.Z. and F.L.; methodology, X.L., H.S. and W.X.; writing—original draft, Y.L.; writing—review and editing, Y.L. and G.F. All authors have read and agreed to the published version of the manuscript.
Funding
This work is financially supported by Key Research and Development Program of Zhejiang Province (2022C01058); Key Projects of Natural Science Foundation of Zhejiang Province (LD22E050001).
Conflicts of Interest
The authors declare no conflict of interest.
References
- Abbasi, N.; Razfar, M.R.; Rezaei, S.M.; Madanipour, K.; Khajehzadeh, M. Experimental investigation of deep-hole micro-drilling of glass using LIPAA process. Mater. Manuf. Process. 2022, 37, 701–711. [Google Scholar] [CrossRef]
- Yue, L.Y.; Wang, Z.B.; Lin, L. Material morphological characteristics in laser ablation of alpha case from titanium alloy. Appl. Surf. Sci. 2012, 258, 8065–8071. [Google Scholar] [CrossRef]
- Nikolidakis, E.; Antoniadis, A. Modeling and simulation of the nanosecond pulsed laser engraving process. MATEC Web Conf. 2020, 318, 1044. [Google Scholar] [CrossRef]
- Lin, Z.Y.; Liu, H.G.; Ji, L.F.; Lin, W.X.; Hong, M.H. Realization of 10 nm Features on Semiconductor Surfaces via Femtosecond Laser Direct Patterning in Far Field and in Ambient Air. Nano Lett. 2020, 20, 4947–4952. [Google Scholar] [CrossRef]
- Lin, Z.Y.; Ji, L.F.; Lin, W.X.; Hong, M.H. Enhancement of femtosecond laser-induced surface ablation via temporal overlapping double-pulse irradiation. Photonics Res. 2020, 8, 271–278. [Google Scholar] [CrossRef]
- Stokes, M.; Ranjbar, O.A.; Lin, Z.; Volkov, A.N. Expansion dynamics and radiation absorption in plumes induced by irradiation of a copper target by single and multiple nanosecond laser pulses in the doughnut beam mode. Spectrochim. Acta Part B At. Spectrosc. 2021, 177, 106046. [Google Scholar] [CrossRef]
- Shin, J.; Mazumder, J. Shallow Angle Drilling of Inconel 718 Using a Helical Laser Drilling Technique. J. Manuf. Sci. Eng. 2017, 139, 031004. [Google Scholar] [CrossRef]
- Morar, N.I.; Roy, R.; Mehnen, J.; Marithumu, S.; Gray, S.; Roberts, T.; Nicholls, J. Investigation of recast and crack formation in laser trepanning drilling of CMSX-4 angled holes. Int. J. Adv. Manuf. Technol. 2018, 95, 4059–4070. [Google Scholar] [CrossRef]
- Xiong, W.; Zhang, P.; Yu, Z.; Yan, H.; Wu, D.; Lu, Q.; Tian, Y. Weld zone porosity elimination process of galvanized steel zero-gap lap joints in remote laser spiral welding. Mater. Res. Express 2021, 8, 66502. [Google Scholar] [CrossRef]
- Zhao, W.; Mei, X. Optimization of Trepanning Patterns for Holes Ablated Using Nanosecond Pulse Laser in Al2O3 Ceramics Substrate. Materials 2021, 14, 3834. [Google Scholar] [CrossRef]
- Li, F.P.; Feng, G.; Yang, X.J.; Li, X.G.; Ma, G.; Lu, C.J. Research on Microhole Processing Technology Based on the Femtosecond-Laser Spiral Trepanning Method. Appl. Sci. 2020, 10, 7508. [Google Scholar] [CrossRef]
- He, C.; Weber, M.; Gillner, A. Recast-Free Helical Drilling of Fused Silica Using SHG Picosecond Laser Pulses. J. Laser Micro Nanoeng. 2020, 15, 158–163. [Google Scholar] [CrossRef]
- Hongyu, Z.; Jianke, D.I.; Ming, Z.; Yu, Y.A.N. A Comparison in Laser Precision Drilling of Stainless Steel 304 with Nanosecond and Picosecond Laser Pulses. Chin. J. Mech. Eng. 2014, 27, 972–977. [Google Scholar] [CrossRef]
- Wang, X.; Jia, Z.; Ma, J.; Liu, W.; Han, D.; Gui, C.; Qi, X. Research on simulation of nanosecond pulsed laser processing for TC4 titanium alloy: A novel model simplification and correction method. Opt. Laser Technol. 2022, 147, 107635. [Google Scholar] [CrossRef]
- Wang, X.; Jia, Z.; Ma, J.; Han, D.; Qi, X.; Gui, C.; Liu, W. Prediction method of radial heat-affected zone width in nanosecond pulsed laser ablation of TC4 titanium alloy. Int. J. Adv. Manuf. Technol. 2022, 121, 2663–2670. [Google Scholar] [CrossRef]
- Paramasivan, K.; Das, S.; Marimuthu, S.; Misra, D. Experimental and Numerical Investigation on Micro-Bending of AISI 304 Sheet Metal Using a Low Power Nanosecond Laser. Lasers Manuf. Mater. Process. 2018, 5, 95–112. [Google Scholar] [CrossRef]
- Mazhukin, V.I.; Mazhukin, A.V.; Demin, M.M.; Shapranov, A.V. Nanosecond laser ablation of target Al in a gaseous medium: Explosive boiling. Appl. Physics. A Mater. Sci. Processing 2018, 124, 237. [Google Scholar] [CrossRef]
- Xiang, Z.; Yin, M.; Dong, G.; Mei, X.; Yin, G. Modeling of the thermal physical process and study on the reliability of linear energy density for selective laser melting. Results Phys. 2018, 9, 939–946. [Google Scholar] [CrossRef]
- Tan, C.; Zhao, L.; Chen, M.; Cheng, J.; Yang, H.; Liu, Q.; Yin, Z.; Liao, W. Formation mechanism of surface morphology in the process of CO2 pulsed laser processing of fused silica optics. Opt. Laser Technol. 2021, 138, 106838. [Google Scholar] [CrossRef]
- Meng, X.; Qin, G.; Su, Y.; Fu, B.; Ji, Y. Numerical simulation of large spot laser + MIG arc brazing–fusion welding of Al alloy to galvanized steel. J. Mater. Processing Technol. 2015, 222, 307–314. [Google Scholar] [CrossRef]
- Andrius, Ž.; Paulius, G.; Gediminas, R.; Mindaugas, G. Efficient ablation by ultra-short pulse lasers. Procedia CIRP 2020, 94, 962–965. [Google Scholar]
Publisher’s Note: MDPI stays neutral with regard to jurisdictional claims in published maps and institutional affiliations. |
© 2022 by the authors. Licensee MDPI, Basel, Switzerland. This article is an open access article distributed under the terms and conditions of the Creative Commons Attribution (CC BY) license (https://creativecommons.org/licenses/by/4.0/).