Article

A Machine Learning Approach to Support Treatment Identification for Chiari I Malformation

1
Mathematical Biology and Physiology, Department Electronics and Telecommunications, Politecnico di Torino, 10129 Turin, Italy
2
Department of Regional and Urban Studies and Planning, Politecnico di Torino, 10129 Turin, Italy
3
Neurosurgery Unit, San Giovanni Bosco Hospital, 10154 Turin, Italy
4
Innovation Center, Meyer Children’s Research Institute, Meyer Children’s Hospital, University of Florence, 50139 Florence, Italy
5
Neurosurgery Department, Meyer Children’s Hospital, University of Florence, 50139 Florence, Italy
6
Clinical Research and Study Design Office, Meyer Children’s Research Institute, Meyer Children’s Hospital, University of Florence, 50139 Florence, Italy
7
Meyer Children’s Research Institute, Meyer Children’s Hospital, University of Florence, 50139 Florence, Italy
8
Neurosurgery Unit, Neuroscience Department, University of Torino, 10124 Turin, Italy
*
Author to whom correspondence should be addressed.
Appl. Sci. 2022, 12(18), 9039; https://doi.org/10.3390/app12189039
Submission received: 22 August 2022 / Revised: 5 September 2022 / Accepted: 6 September 2022 / Published: 8 September 2022
(This article belongs to the Section Applied Biosciences and Bioengineering)

Abstract

:
Chiari I malformation is characterized by the herniation of cerebellar tonsils below the foramen magnum. It is often accompanied by syringomyelia and neurosurgical management is still controversial. In fact, it is frequent that some symptomatic patients initially undergo bony decompression of the posterior fossa and need in a short time more invasive surgery with higher morbility (e.g., decompression of posterior fossa with dural plastic, with or without tonsillar coarctation) because of unsatisfactory results at MRI controls. This study proposes a machine learning approach (based on SVM classifier), applied to different morphometric indices estimated from sagittal MRI and some information on the patient (i.e., age and symptoms at diagnosis), to recognize patients with higher risk of syringomyelia and clinical deterioration. Our database includes 58 pediatric patients who underwent surgery treatment. A negative outcome at 1 year from the intervention was observed in 38% of them (accuracy of 62%). Our algorithm allows us to increase the accuracy to about 71%, showing it to be a valid support to neurosurgeons in refining the clinical picture.

1. Introduction

Chiari malformation (CM) is characterized by the descent of one or both cerebellar tonsils by at least 5 mm beyond the McRae’s line at magnetic resonance imaging (MRI) scan, that runs from the anterior (basion) to posterior (opisthion) border of the foramen magnum [1]. A descent of less than 3 mm is considered a physiological variant, while a herniation between 3–5 mm is borderline and needs for radiological follow-up in symptomatic cases, associated with syringomyelia (defined below), a pointed tonsillar profile or crowding of the subarachnoid space at the craniocervical junction (CVJ).
On the other hand, Chiari syndrome corresponds to the clinical findings associated with a radiologically defined CM. They include: headache, usually occipital provoked/worsened by coughing or other Valsalva-like maneuvers; brainstem complaints (nystagmus, dysphagia, sleep apnoea); cerebellar (ataxia) and/or cervical cord complaints (muscular hypotrophy, motor and sensory deficits); and oto-neurological symptoms (dizziness, loss of balance, hearing loss and hyperacusis, nystagmus, oscillopsia). CM is often associated with syringomyelia, which is a neurological condition characterized by the presence of a fluid-filled cavity within the parenchyma of the spinal cord or central canal, due to an alteration of cerebro-spinal fluid (CSF) circulation [2,3,4,5]. CM is currently classified according to its anatomical features.
  • CM type I (CM-I): herniation of one or both cerebellar tonsils at least 5 mm below the foramen magnum, often asymptomatic. Hydrocephalus and anterior flattening of the midbrain, pons and medulla oblongata may occur. It is further sub-classified into CM I-A, when associated with syringomyelia, and CM I-B, when no syringomyelic cavity is present [6].
  • CM type II (CM-II): caudal migration of the brainstem, cerebellum and fourth ventricle through the foramen magnum together with downward displacement of the cervical spinal cord. It is always associated with open spinal dysraphism or cystic spina bifida (myelomeningocele or myelocele) and also with syringomyelia and hydrocephalus.
  • CM type 0 (CM-0): syringomyelia with no associated tonsilla rhombencephalic herniation or minimal (less than 3 mm long).
  • CM type 1.5 or “Chiari Complex” (CM 1.5): tonsillar prolapse and brainstem kinking in the context of CVJ malformation. Although CM-I and CM 1.5 share morphological and anatomical similarities, an accurate radiological distinction needs to be made because patients with CM 1.5 have more probability to undergo initial decompressive surgery failure and there is usually persistence of syringomyelia [4].
  • Acquired Chiari malformation (ACM) (also referred to as acquired tonsillar ectopy): herniation of the cerebellar tonsils secondary to posterior fossa trauma (85%) and space-occupying lesions, such as hydrocephalus, brain tumours (meningioma, 36%) and arachnoid cysts (32%) [2,7].
CM-I is a rare disease, but the spread of neuroimaging in the area has increased the number of cases, often asymptomatic or paucisymptomatic: the incidental diagnosis today is between 1% and 4% in individuals undergoing MRI of the brain and cervical spine, with a range between 1.9 and 8.4/100,000 [6]. In the pediatric population, European studies have estimated CM-I to be relatively common, with an incidence of 0.24–3.6%; out of them, almost a quarter have syringomyelia at diagnosis, with a slight prevalence in females [3].
The exact etiopathogenesis of CM-I is not entirely clear. A lot of hypotheses have been proposed. Besides the association with craniosynostosis, spinal cord disorders, CSF hypotension, endocranial hypertension and skeletal abnormalities in CVJ [7,8,9], the most accredited theory is the alteration of the paraxial mesoderm after neural tube closure. This condition leads to underdevelopment of the occipital somites, resulting finally in a disproportion between cerebellum and a smaller posterior fossa [2]. From a genetic point of view, a series of mutations have been described involving gene CDX1, FLT1, and RARG [9], especially in syndromic patients [9,10], but any specific mutation has not yet been identified.
According to the “International Consensus Document in the Diagnosis and Treatment of Chiari Malformation I in Children”, surgery is indicated for symptomatic patients or asymptomatic patients with syringomyelia larger than 5-8 mm and/or progressively enlarging. Asymptomatic pediatric patients with an incidental diagnosis of CM-I should have periodic clinical and radiological follow-up until the end of their growth because progression is possible despite rare [11].
The aim of the surgery for CM-I is to increase the volume of posterior fossa to restore the CSF circulation [12]. The technique consists either in a simple bony decompression by suboccipital craniectomy and C1 laminectomy, or duraplasty with or without arachnoidolysis and resection of cerebellar tonsils by opening of the dura mater finally closed with autologous or not-autologous graft [7].
Regarding the post-surgical outcome, bone decompression alone has a lower complication rate, but a lower probability to reduce the syringomyelia; on the other hand, duraplasty provides better reduction of syringomyelia, but has higher rate of complications [13,14,15,16]. Consequently, the first is suggested in children without syringomyelia and without severe symptoms, taking into account a possible risk of recurrence of symptoms, while decompression with duraplasty is to be reserved for those patients with concomitant syringomyelia and marked symptoms. However, no robust consensus exists about the ideal surgical technique and there are controversies in the scientific literature on the choice of the optimal surgical treatment [17,18].
Some studies have investigated new parameters alternative to the dimension of the hernia which correlate with CM-I and can provide information on the optimal intervention [19]. Promising parameters have been proposed based on morphometric skull analysis from MRI [20,21,22,23]. However, manual measurements of morphometrics were usually taken, introducing possible bias due to subjectivity and a dependence on the expertise of the operator. In order to remove this subjectivity, automatic methods for the segmentation of MRIs of the brain can be used [24,25]. Machine learning algorithms have recently been applied also to diagnose CM-I [26,27,28]. However, manual measurements of morphometrics have been used in [26,28]; a fully automated approach (based on deep learning) is instead discussed in [27], but it focuses only on discriminating controls and CM-I patients.
Recent works from our group proposed fully automated methods, registering the sagittal MRI and extracting the morphometrics of interest, among which the ratios of the areas of brain regions accounting for possible overcrowding of posterior fossa [29,30]. Associated to a machine learning algorithm, a prediction of the optimal surgery could be obtained [30], thus not only discriminating healthy controls and patients, but also identifying the severity of the pathology (useful to select the optimal treatment). However, only few patients were available to the mentioned study, so that limited performances in discriminating their severity were achieved. Moreover, both adults and pediatric patients were included to enlarge the database.
Hence, this study aims at deepening the previous approach proposed in [30] by optimizing and testing a machine learning method on a larger database of pediatric patients requiring surgery, that after one year from the intervention either improved or not. The objective of our algorithm is to predict the outcome, by identifying the patients with higher risk of syringomyelia, thus recommending a more aggressive surgery (i.e., bony decompression plus duraplasty and resection of cerebellar tonsils) only for them. This algorithm could support the surgeon in refining the clinical picture pre-intervention, in order to choose the most efficacious treatment.

2. Methods

2.1. Database

Paediatric and adolescent patients with diagnosis of Arnold-Chiari Malformation I (CM-I) were recruited in a retrospective double-blind study.
Data were collected and managed using REDCap (Research Electronic Data Capture) tools hosted at Meyer Children’s Hospital. REDCap is a secure, web-based software platform designed to support data capture for research studies, providing (1) an intuitive interface for validated data capture; (2) audit trails for tracking data manipulation and export procedures; (3) automated export procedures for seamless data downloads to common statistical packages; and (4) procedures for data integration and interoperability with external sources [31,32].
Inclusion criteria, properties of selected patients and measurements are described below.

2.1.1. Inclusion Criteria

Patients were enrolled considering the following inclusion criteria:
  • CM-I patients with or without syringomyelia and undergoing posterior cranial fossa decompression surgery;
  • cerebellar tonsil ≥5 mm below McRae’s line (basion-to-opisthion) on T1-weighted sagittal image and at least one of the following symptoms: posterior headache worsened with the Valsalva manoeuvre, mixed cranial nerve disorders (dysphagia, dysphonia, hiccups), cranial oto-vestibular disorders (dizziness, tinnitus), long way disorders (motor and sensory problems), cerebellar signs (ataxia, dysmetria, tremors), sphincter disorders and scoliosis;
  • patients undergoing osteo-ligamentous decompression surgery or posterior fossa decompression with dural plastic with or without tonsillar coarctation;
  • period of surgery between January 2010 and December 2020;
  • presence of clinical and instrumental follow-up data at 1 year;
  • signature of informed consent to the surgery and use of clinical data for research purposes.
Patients who developed syringomyelia before the surgery unrelated to CM-I and those who underwent other types of surgery (e.g., filum section, endoscopic third ventriculostomy, etc.) were not enrolled in the study.
For each patient, specific clinical parameters were evaluated, such as gender, age at diagnosis and at the first CM-I correction surgery, the possible presence of syringomyelia at diagnosis, the most characteristic symptoms, the number and types of surgery each patient underwent, the occurrence of post-surgical complications (liquor fistula, hydrocephalus, infections, etc.) and finally the follow-up at the first year.
With regard to the characterization of syringomyelia, it was classified according to the site, extent and antero-posterior diameter of the syringomyelic cavity, expressed in mm.
Based on the site, syringomyelia has been subdivided into cervical, cervico-dorsal, dorsal, dorso-lumbar and panmedullary, while 24 levels corresponding to the height of the vertebral bodies along the course of the spinal canal have been defined to accurately identify the extension. The projection of the cranial and caudal margin of the syringomyelia on the vertebral bodies reflects the real dimensions of the cavity.

2.1.2. Clinical and Radiological Data

For each patient, electronic or paper medical records were consulted in order to establish the clinical-radiological course. Moreover, pre-surgery encephalic MRI was recorded: the sagittal section was used to measure morphological parameters, both manually and automatically. Specifically, manual segmentation was performed by two experienced neurosurgeons, who delineated precisely the contours of the cerebral and cerebellar regions on the patient’s sagittal MRI and approximated the borders of the posterior cranial fossa with a pentagon (as in Figure 1). Each MRI was delineated twice and the average values of morphometrics were considered. The accuracy of the segmentation was measured in terms of percentage common pixels included in the segmented regions: it was 96.3 ± 1.5% (mean ± std), 90.3 ± 3.8% and 95.2 ± 1.1%, for brain, posterior fossa and cerebellum, respectively. The segmentation was also performed by the automated method detailed below.
The following morphometric variables were chosen as potentially influential on the clinical-radiological outcome of the selected patients [19,28,30]. They were estimated either from the manual or the automated segmentation (except for the last three, measured only manually).
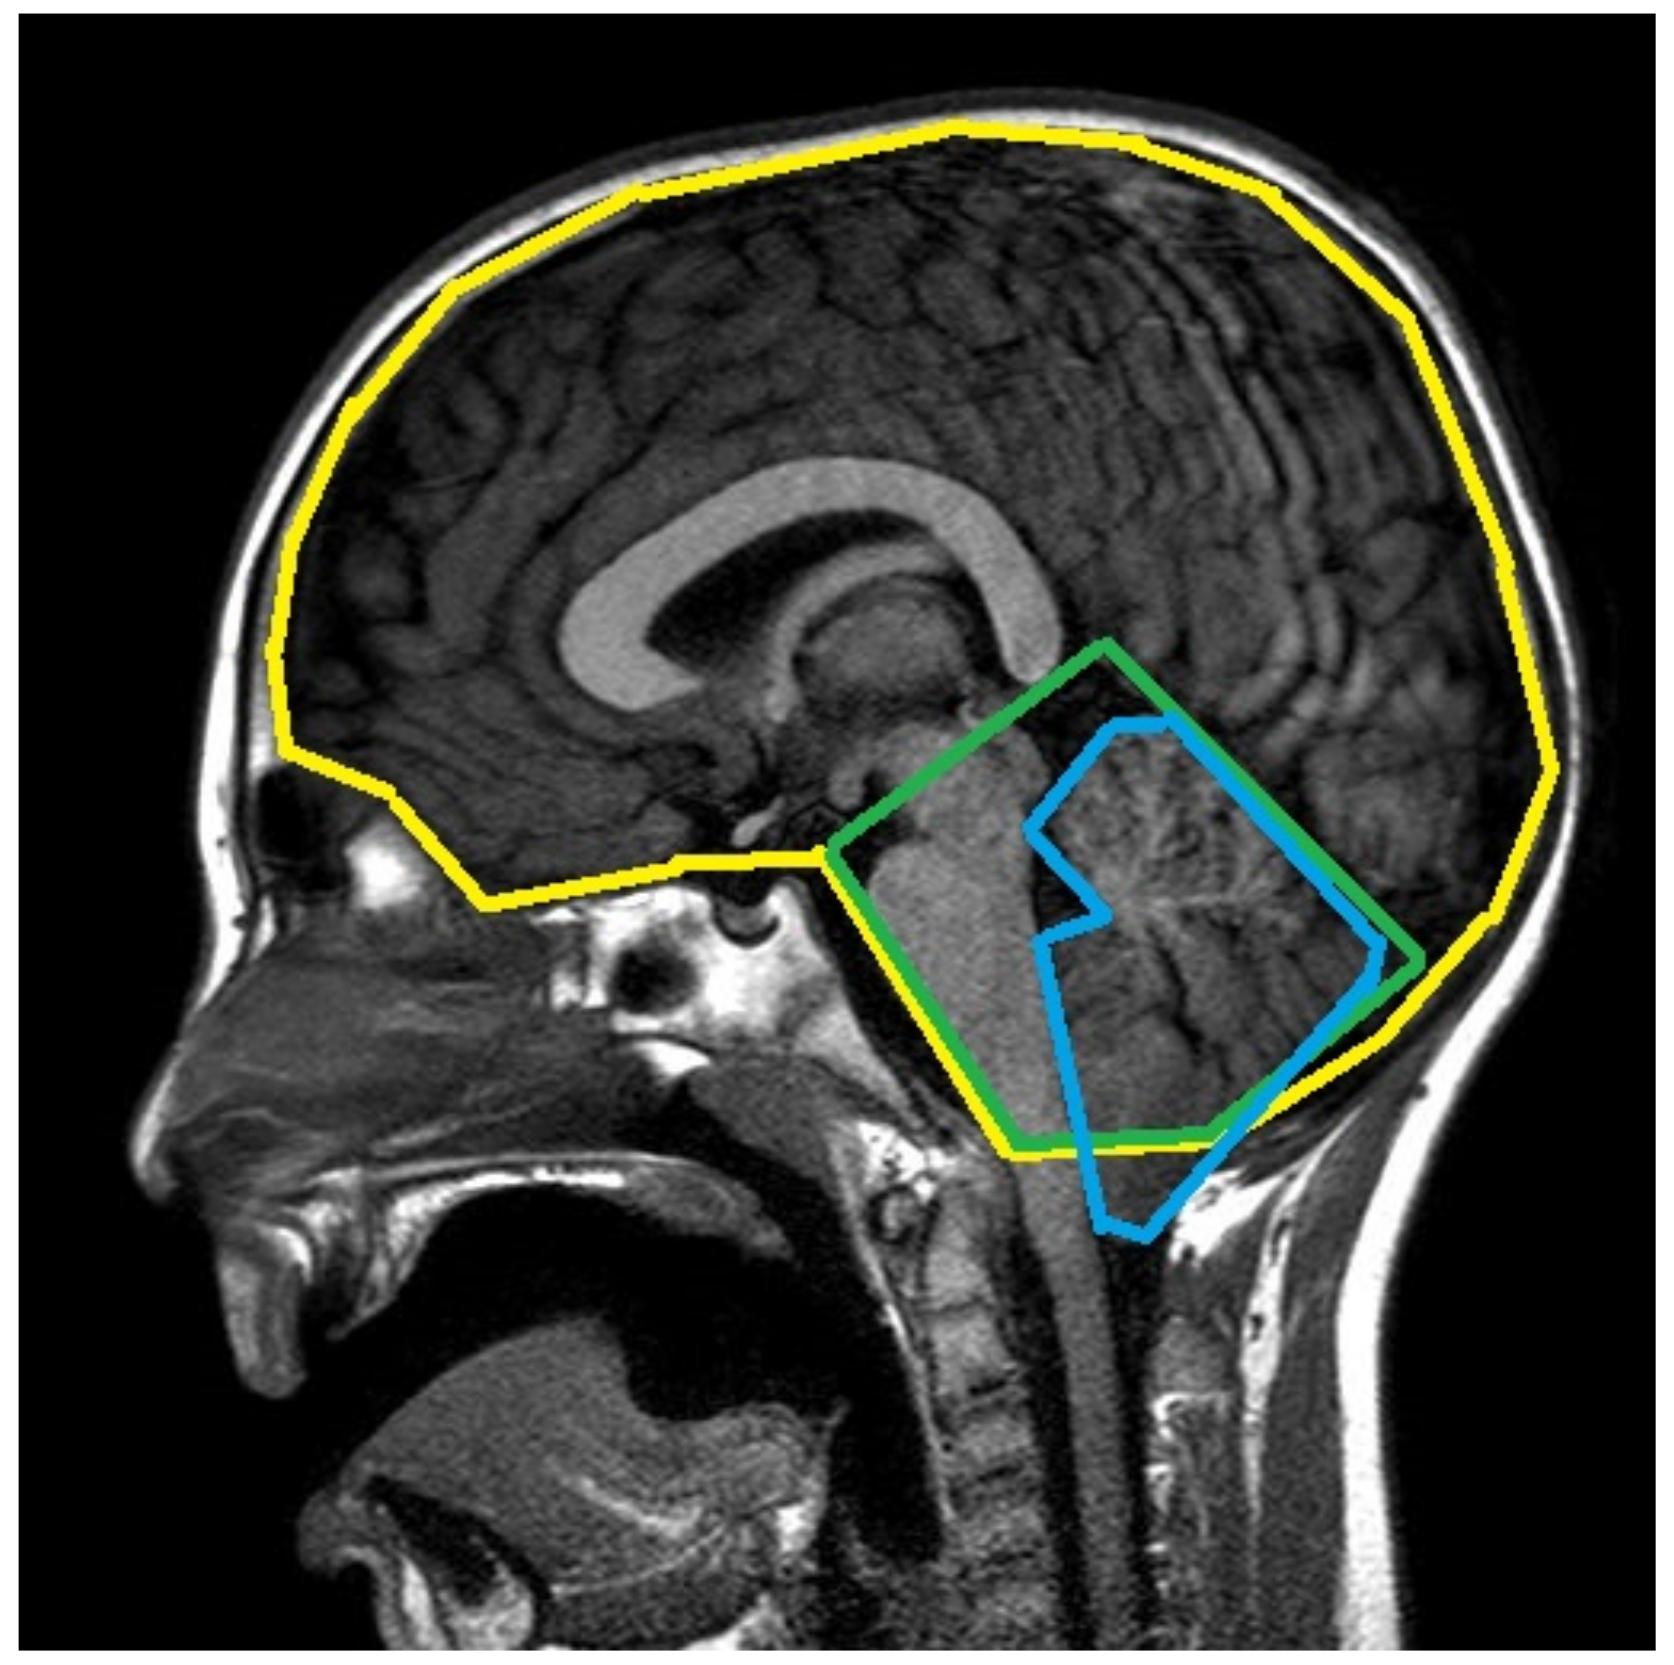
  • cerebellar tonsil descent (length of hernia—LenH);
  • length of the tentorium (LenT);
  • angle of the tentorium (AngT);
  • ratio of cerebellum area to posterior cranial fossa area (C/PF);
  • ratio of posterior cranial fossa area to brain area (PF/B);
  • antero-posterior diameter of posterior fossa (DiaAntP);
  • height of posterior cranial fossa (H_PF);
  • length of the clivus (LenC);
  • length of the foramen magnum (LenFM);
  • distance between corpus callosum and foramen magnum (DCCFM—only measured manually);
  • distance between pons and foramen magnum (DPoFM—only measured manually);
  • distance between fastigium and foramen magnum (DFFM—only measured manually).

2.1.3. Properties of Recruited Patients

In total, 58 patients were recruited, of whom 26 were female, representing 44.8% of the sample, and 32 were male, constituting the remaining 55.2% of candidates. In addiction, 26 patients had already syringomyelia at diagnosis.
Syringomyelia was found in the cervical region in 13.8% of cases, in the cervico-dorsal region in the 15.5%, in the dorsal region or in the entire length of the spinal canal in the 6.9% and in the dorsal-lumbar region only in the 1.7% of patients. The mean antero-posterior diameter of the cavity was 8.5 mm while the mean extension was 8 levels. The mean age at diagnosis was 9.17 years (with 6.03 of standard deviation (std)), while the mean age at first intervention was 9.57 years (std 6).
Considering the clinical characteristics of the patients recruited into the study, headache was the most frequent symptom (72.4%), followed by long tract disorders (44.8%), mixed cranial nerve disorders (31%), oto-vestibular disorders and scoliosis (19%), cerebellar signs (13.8%) and finally sphincter disorders (5.2%).
All the patients underwent surgery, i.e., a simple osteo-dural decompression in 52 of them (89.7%) and decompression surgery with dural plastic in 8 patients (13.8%). Finally, 13 patients (equal to 22.4% of the entire sample), even had to undergo tonsillar coarctation. Fifteen patients were submitted to two operations in the same year (the first less invasive and the second more invasive).
Most patients (i.e., 93.1% of the candidates) did not suffer any post-surgical complications; one candidate (amount 1.7% of our sample) developed an infection in the post-operative period; the remaining 3 patients (equal to 5.2%) experienced other complications.
One year after surgery, 28 patients (48.3%) had syringomyelia, while the remaining 30 candidates (51.7%) were disease-free. Whereas at the time of the diagnosis of CM-I, the predominant site of the syringomyelic cavity was the cervico-dorsal (15.5%), after one year the situation changed: 25% of patients showed cervical syringomyelia while the number of subjects with cervico-dorsal syringomyelia decreased to 10.3%. The percentages of dorsal, dorso-lumbar and panmedullary syringomyelia, on the other hand, remained unchanged.

2.1.4. Different Groups of Patients Considered

The patients were divided into four groups based on the clinical-radiological course.
  • Group 0 includes symptomatic patients without syringomyelia at diagnosis who, following surgery, had a clinical and radiological improvement within the first year, characterized by a reduction in symptoms and tonsillar hernia (19 patients, 32.7%).
  • Group 1 is constituted by symptomatic patients with syringomyelia at diagnosis who, following surgery, had clinical and radiological improvement within the first year, with a reduction of the syringomyelic cavity (17 patients, 29.3%).
  • Group 2 is formed by symptomatic patients with syringomyelia at diagnosis who, after surgery, had a clinical and radiological worsening, either with an increase in the size of the syringomyelic cavity or with persistence of symptoms (13 patients, 22.4%).
  • Group 3 is the group of symptomatic patients without syringomyelia at diagnosis who, following decompression surgery, developed syringomyelia within the first year (9 patients, 15.6%).
Subsequently, the morphological parameters for each group were analyzed individually, in order to show whether there was a statistically significant association between them and the clinical outcome one year after surgical treatment (Kruskal-Wallis test).

2.2. Registration

In order to identify the target regions (i.e., brain, posterior fossa and cerebellum) in the sagittal MRIs of our database, the method described in [30,33] was used, with a few variations. In the following, we briefly review the registration method, focusing on the variations with respect to previous works.

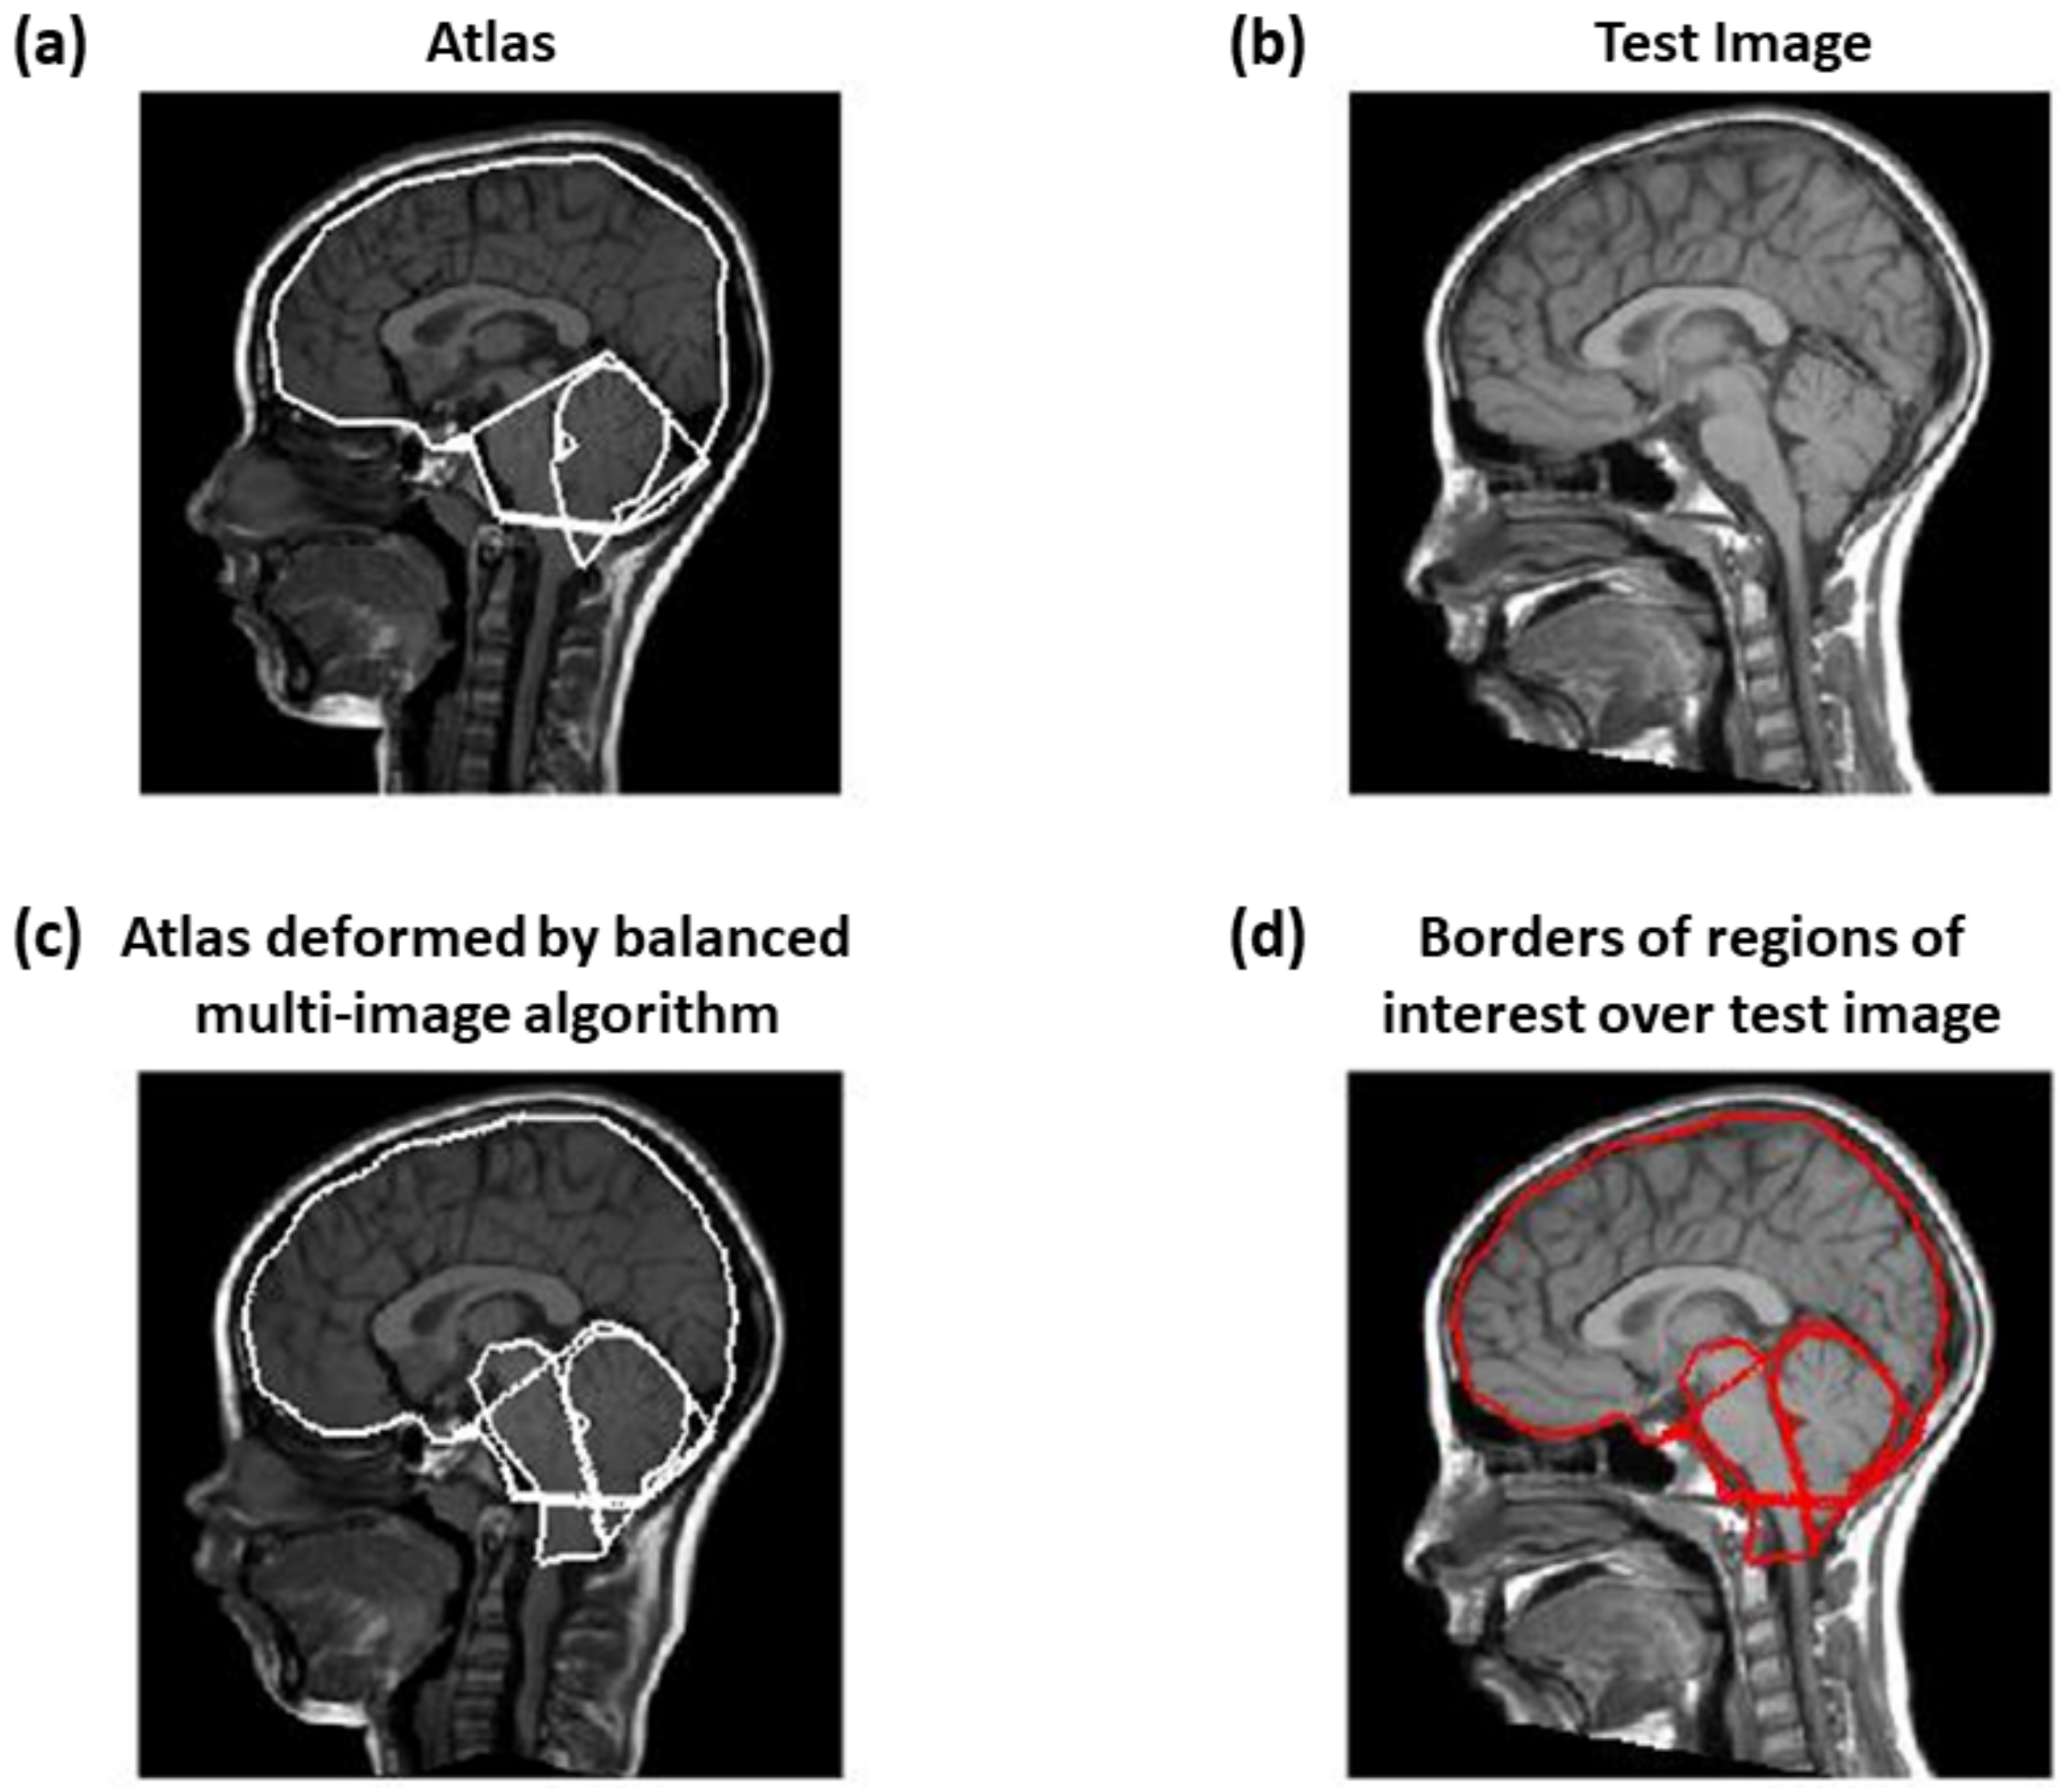
2.2.1. Balanced Multi-Image Demons

Demons method is a non-parametric, non-rigid image registration that matches an atlas image M ( p ) (for which target regions are known) and a test MRI F ( p ) (where p indicates the pixel location). In practice, a deformable model s : p s ( p ) is pushed in the direction normal to the MRI intensity gradient so that M s ( p ) fits the reference image F ( p ) in terms of the minimization of their squared error [34,35]. A regularization term is also added to stabilize the solution and a hidden variable c (of correspondences) is introduced to improve computational efficiency [36] (accommodating possible errors in the estimation of the transformation s), finally obtaining the following functional to be minimized with respect to s and c
F ( p ) M c ( p ) 2 σ i 2 + c ( p ) s ( p ) 2 σ x 2 + s ( p ) 2 σ T 2
where σ i , σ x and σ T are parameters accounting for image noise, spatial uncertainty in the correspondences and regularization, respectively.
This problem is solved iteratively, minimizing the sum of the first two terms with respect to c with s fixed and then computing a Gaussian smoothing of c (with standard deviation σ T =1.5 pixels), which corresponds to minimizing the sum of the last two terms with respect to s with c fixed. For each iteration, a local linearization of the first step was solved, thus writing c = s ( 1 + u ) ( 1 being the identify map and u a small deformation).
Moreover, two innovations have been included in [33] with respect to the standard demons approach described above.
  • Different images from the atlas and the test MRI were matched by a single optimal deformation, found using the following update for the linearized problem mentioned above
    u = i = 1 N ( F i M i s ) J i T i = 1 N J i 2 + Σ i 2
    where { M i } and { F i } are N images obtained from the atlas and test image (as detailed below), J i is the Jacobian matrix of M i and Σ i 2 = σ i 2 / σ x 2 = | F i M i s | 2 .
  • The iterations were performed in alternation to the atlas and to the test sets of images ( { M i } and { F i } , respectively).
Five images were included in the sets, which are the same as those considered in [30,33] with the exception of one of them: the following procedure involving a bilateral filter [37] was used instead of the median filter considered in [30,33] (both filters allow smoothing, preserving edges; preliminary tests showed that bilateral filter provided better performances than median filter). Specifically, Gaussian kernels were used to smooth the noise on neighbors with similar amplitude (with a geometric spread σ d = 5 ) and to weight the smoothing as a function of image intensity difference (photometric spread σ r = 1 ), so that the smoothing was reduced in case of high variations (as when an edge is present). After a first application of the bilateral filter, a second step of image enhancement was applied following the method proposed in [38]. Specifically, the image was decomposed with Daubechies wavelets of order 30, separating low and high frequency components along rows, columns and diagonals. Then, a bilateral filter was applied only to low frequency components (with σ d = 30 and σ r = 100 ) and the high frequencies details were summed unchanged (see an example application in Figure 2).
Thus, finally, the following 5 images were used in our registration algorithm (example shown in Figure 3): original image and then the same MRI processed by adaptive histogram equalization, smoothing procedure just detailed using bilateral filter, entropy and phase symmetry [39].

2.2.2. Correction by Active Contour

As noticed in [30], registration can provide only a preliminary identification of the main brain regions of interest, but it is not able to fit the details of the contours, as the regions in the atlas and in the test image could be even topologically different. Thus, the boundaries of the regions estimated by the balanced multi-image algorithm were corrected using an active contour (or snake) [40], i.e., a curve (with parametric representation v ( s ) = [ v x ( s ) , v y ( s ) ] , where s is the curvilinear abscissa and bold format is used to indicate a vector) approaching iteratively the borders of interest minimizing a functional accounting for different constraints
E ( v ) = 0 1 E i n t ( v ( s ) ) + E i m a g e ( v ( s ) ) + E e x t ( v ( s ) ) d s
The three contributions on the right hand side are defined as follows.
  • E i n t is the internal energy, defined as
    E i n t ( v ( s ) ) = ( α v s ( s ) 2 + β v s s ( s ) 2 ) / 2
    where v s and v s s are the first and second derivatives of v ( s ) , respectively; α = 0.05 controls the tension and β = 0.5 is related to the rigidity of the active contour.
  • E i m a g e is the energy due to the image and is the weighted sum of 3 terms, allowing the snake to be attracted on dark regions, edges and termination points, respectively
    E i m a g e = w l i n e E l i n e + w e d g e E e d g e + w t e r m E t e r m
    where E l i n e is defined by a Gaussian smoothing of the original image (with standard deviation 3 pixels), E e d g e is the norm of the image (again with Gaussian smoothing on the derivatives) and E t e r m depends on the curvature of level lines [40] and w l i n e = 5, w e d g e = 20, w t e r m = 10.
    Then we included also the Gradient Vector Flow (GVF) [41], which is the vector field W ( x , y ) = [ U ( x , y ) , V ( x , y ) ] minimizing the energy functional
    E = 0 1 0 1 μ ( U x 2 + U y 2 + V x 2 + V y 2 ) + | f | 2 | W f | 2 d x d y
    where f = E i m a g e is the edge map and μ = 0.2; notice that it is close to the gradient of f (and thus it forces the snake to go in the direction opposite to the gradient of the MRI) when such a gradient is large, otherwise a smooth field is obtained. This contribution allows us to help the snake to follow the borders of concave regions [41].
  • E e x t are external forces, pushing the snake toward low intensity edge points in the image. It is defined as the sum of two terms: the distance transform from low intensity points (identified by image binarization with a two-class k-means clustering, as in [30]) and the balloon force, in direction normal to the snake and allowing it to contract when the other contributions are small [42]; the two contributions had weights 0.1 and 0.05 , respectively.
In conclusion, the method is based on the one used in [30]: the inclusion of GVF and balloon force are the main variations. Figure 4 shows an example of application. The deformation allowing to match the atlas and the test image is estimated; then, it is applied on the regions delineated on the atlas to estimate the same regions of interest on the test image; finally, active contour is applied to improve the estimation of the borders. Notice that a region including the brainstem of the atlas is also considered (shown in Figure 4c), in order to refine the estimation of the left portion of cerebellum (as the boundary separating it from the brainstem is not easy to identify from MRI; see [30] for details).

2.3. Patients’ Group Identification

The features extracted from the MRIs of the patients were used to identify if there was an improvement related to the treatment by a machine learning technique. Specifically, the relevance of the features for identifying the outcome of the treatment was investigated. The accuracies of different binary classification problems (aiming at identifying those who benefited from the treatment) were investigated: patients were either split into those with or without syringomyelia or were kept all together; manual or automatic measurements were considered.

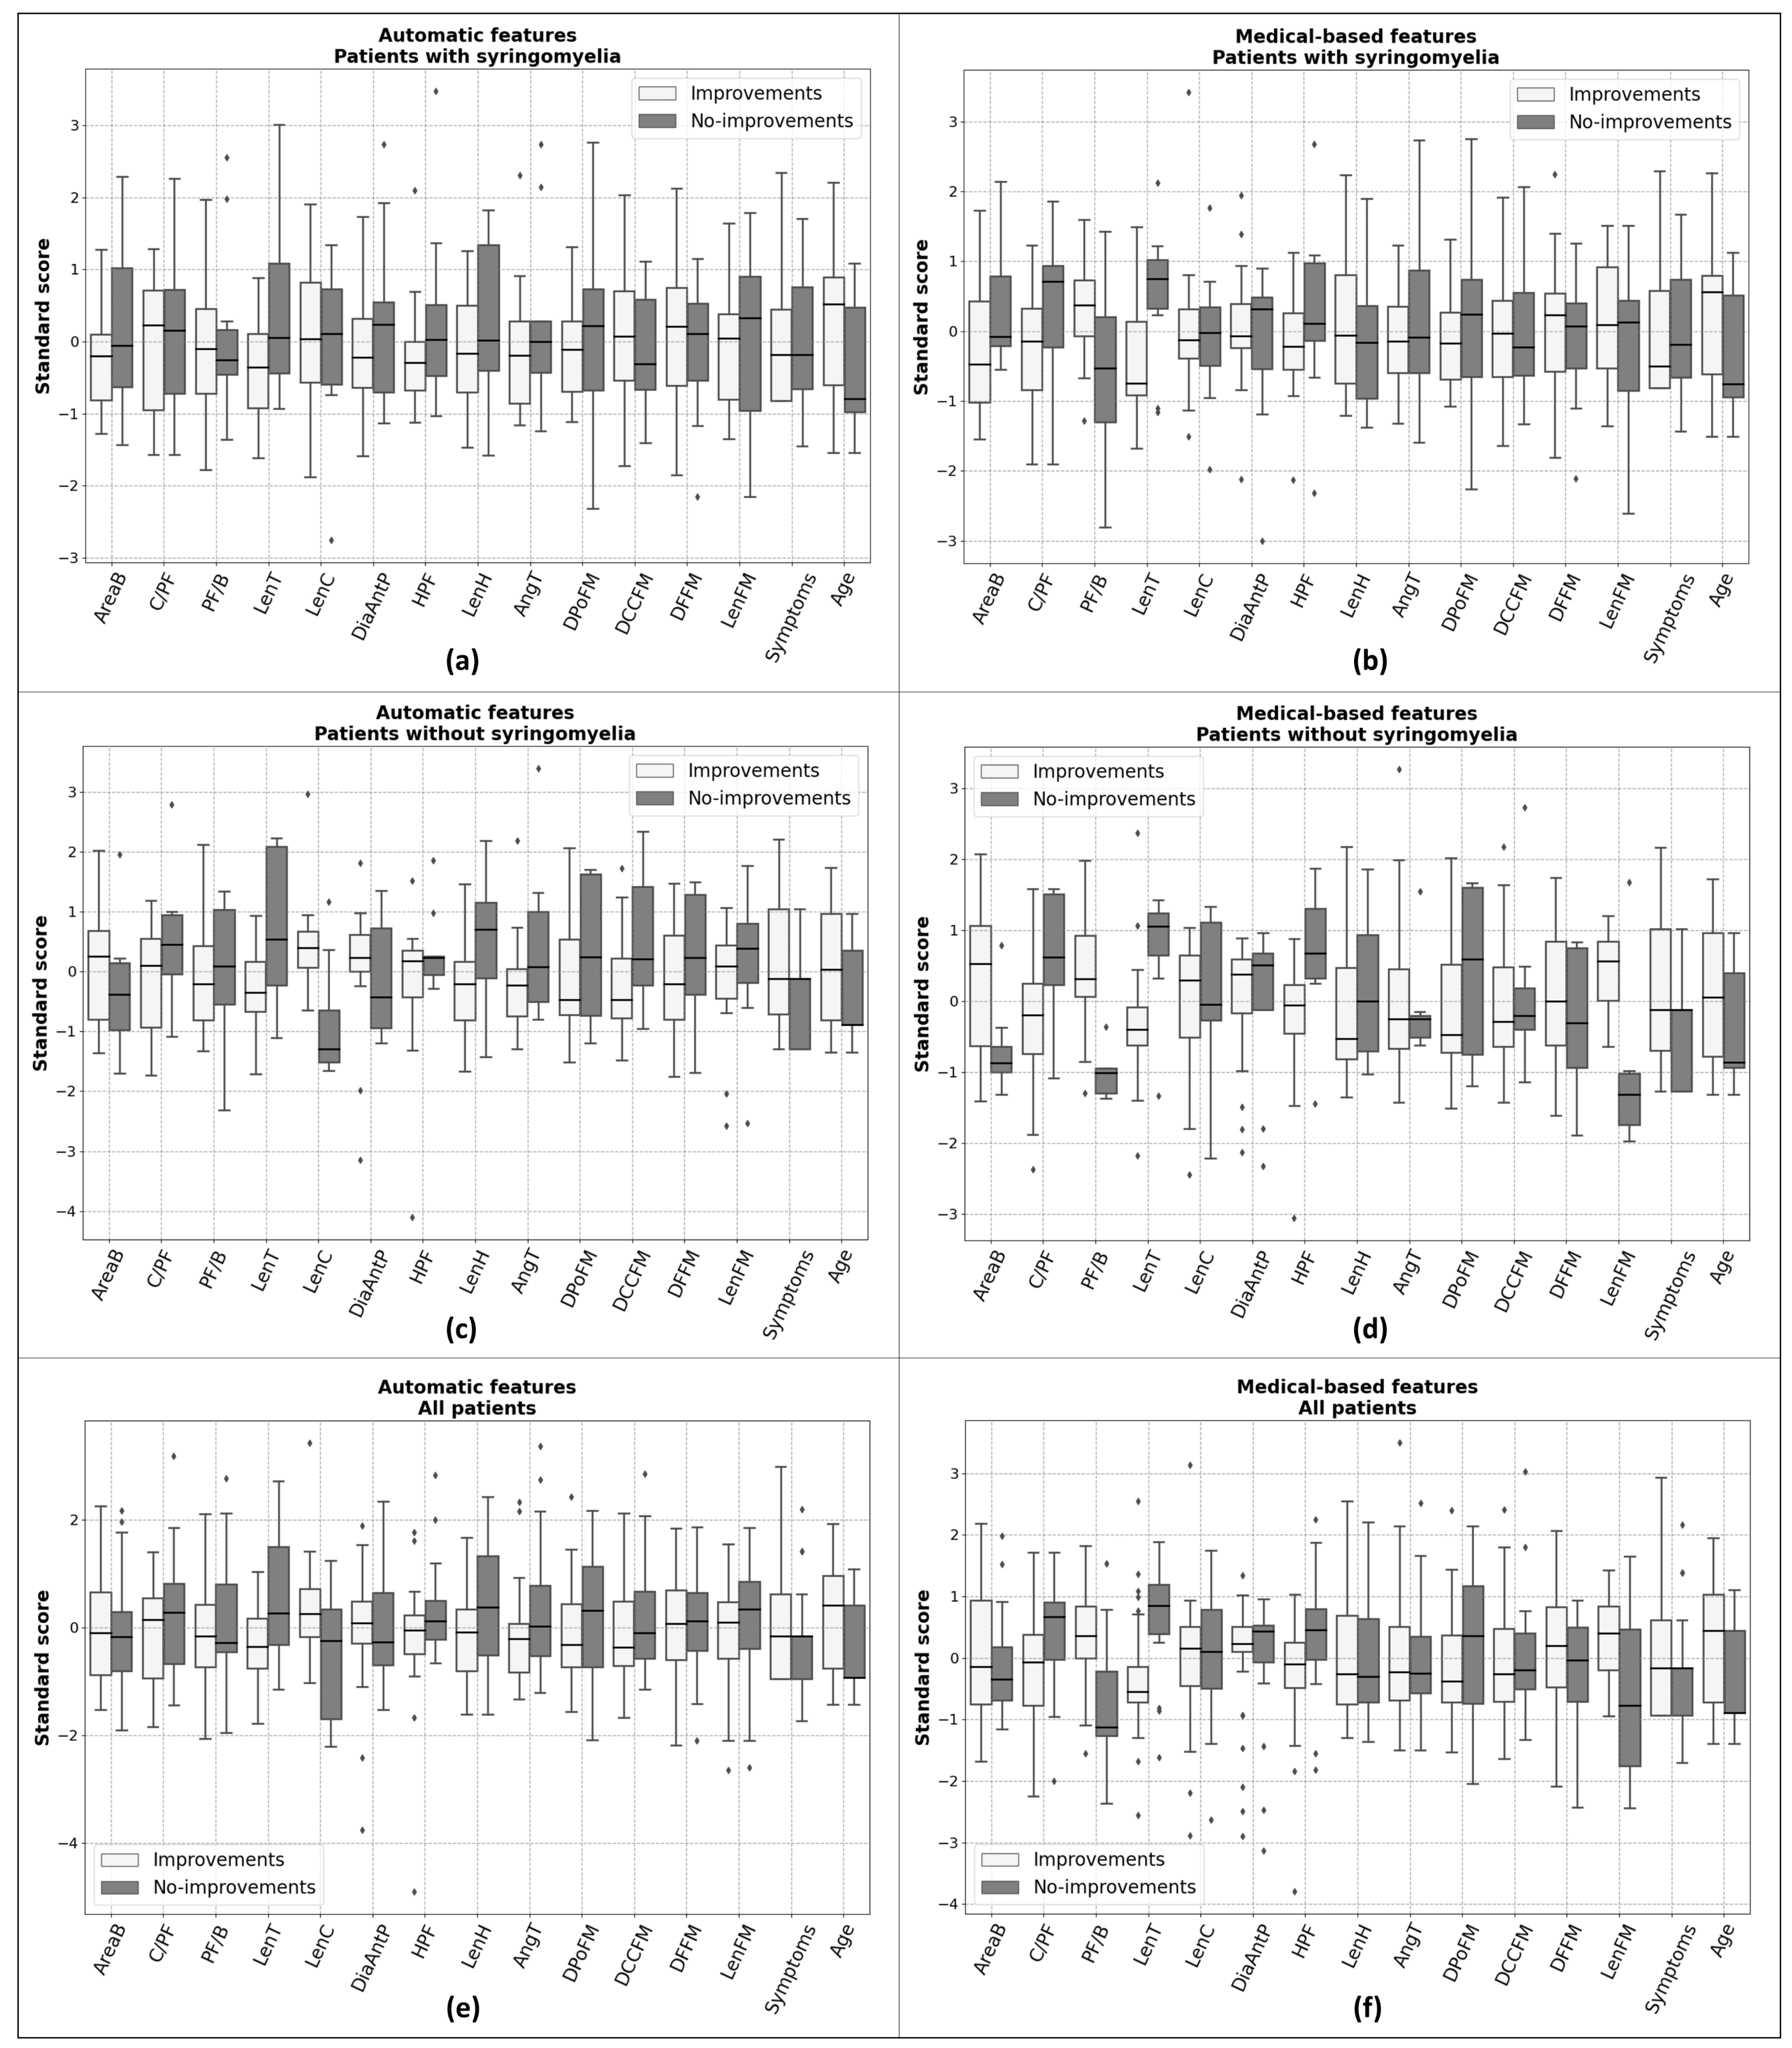
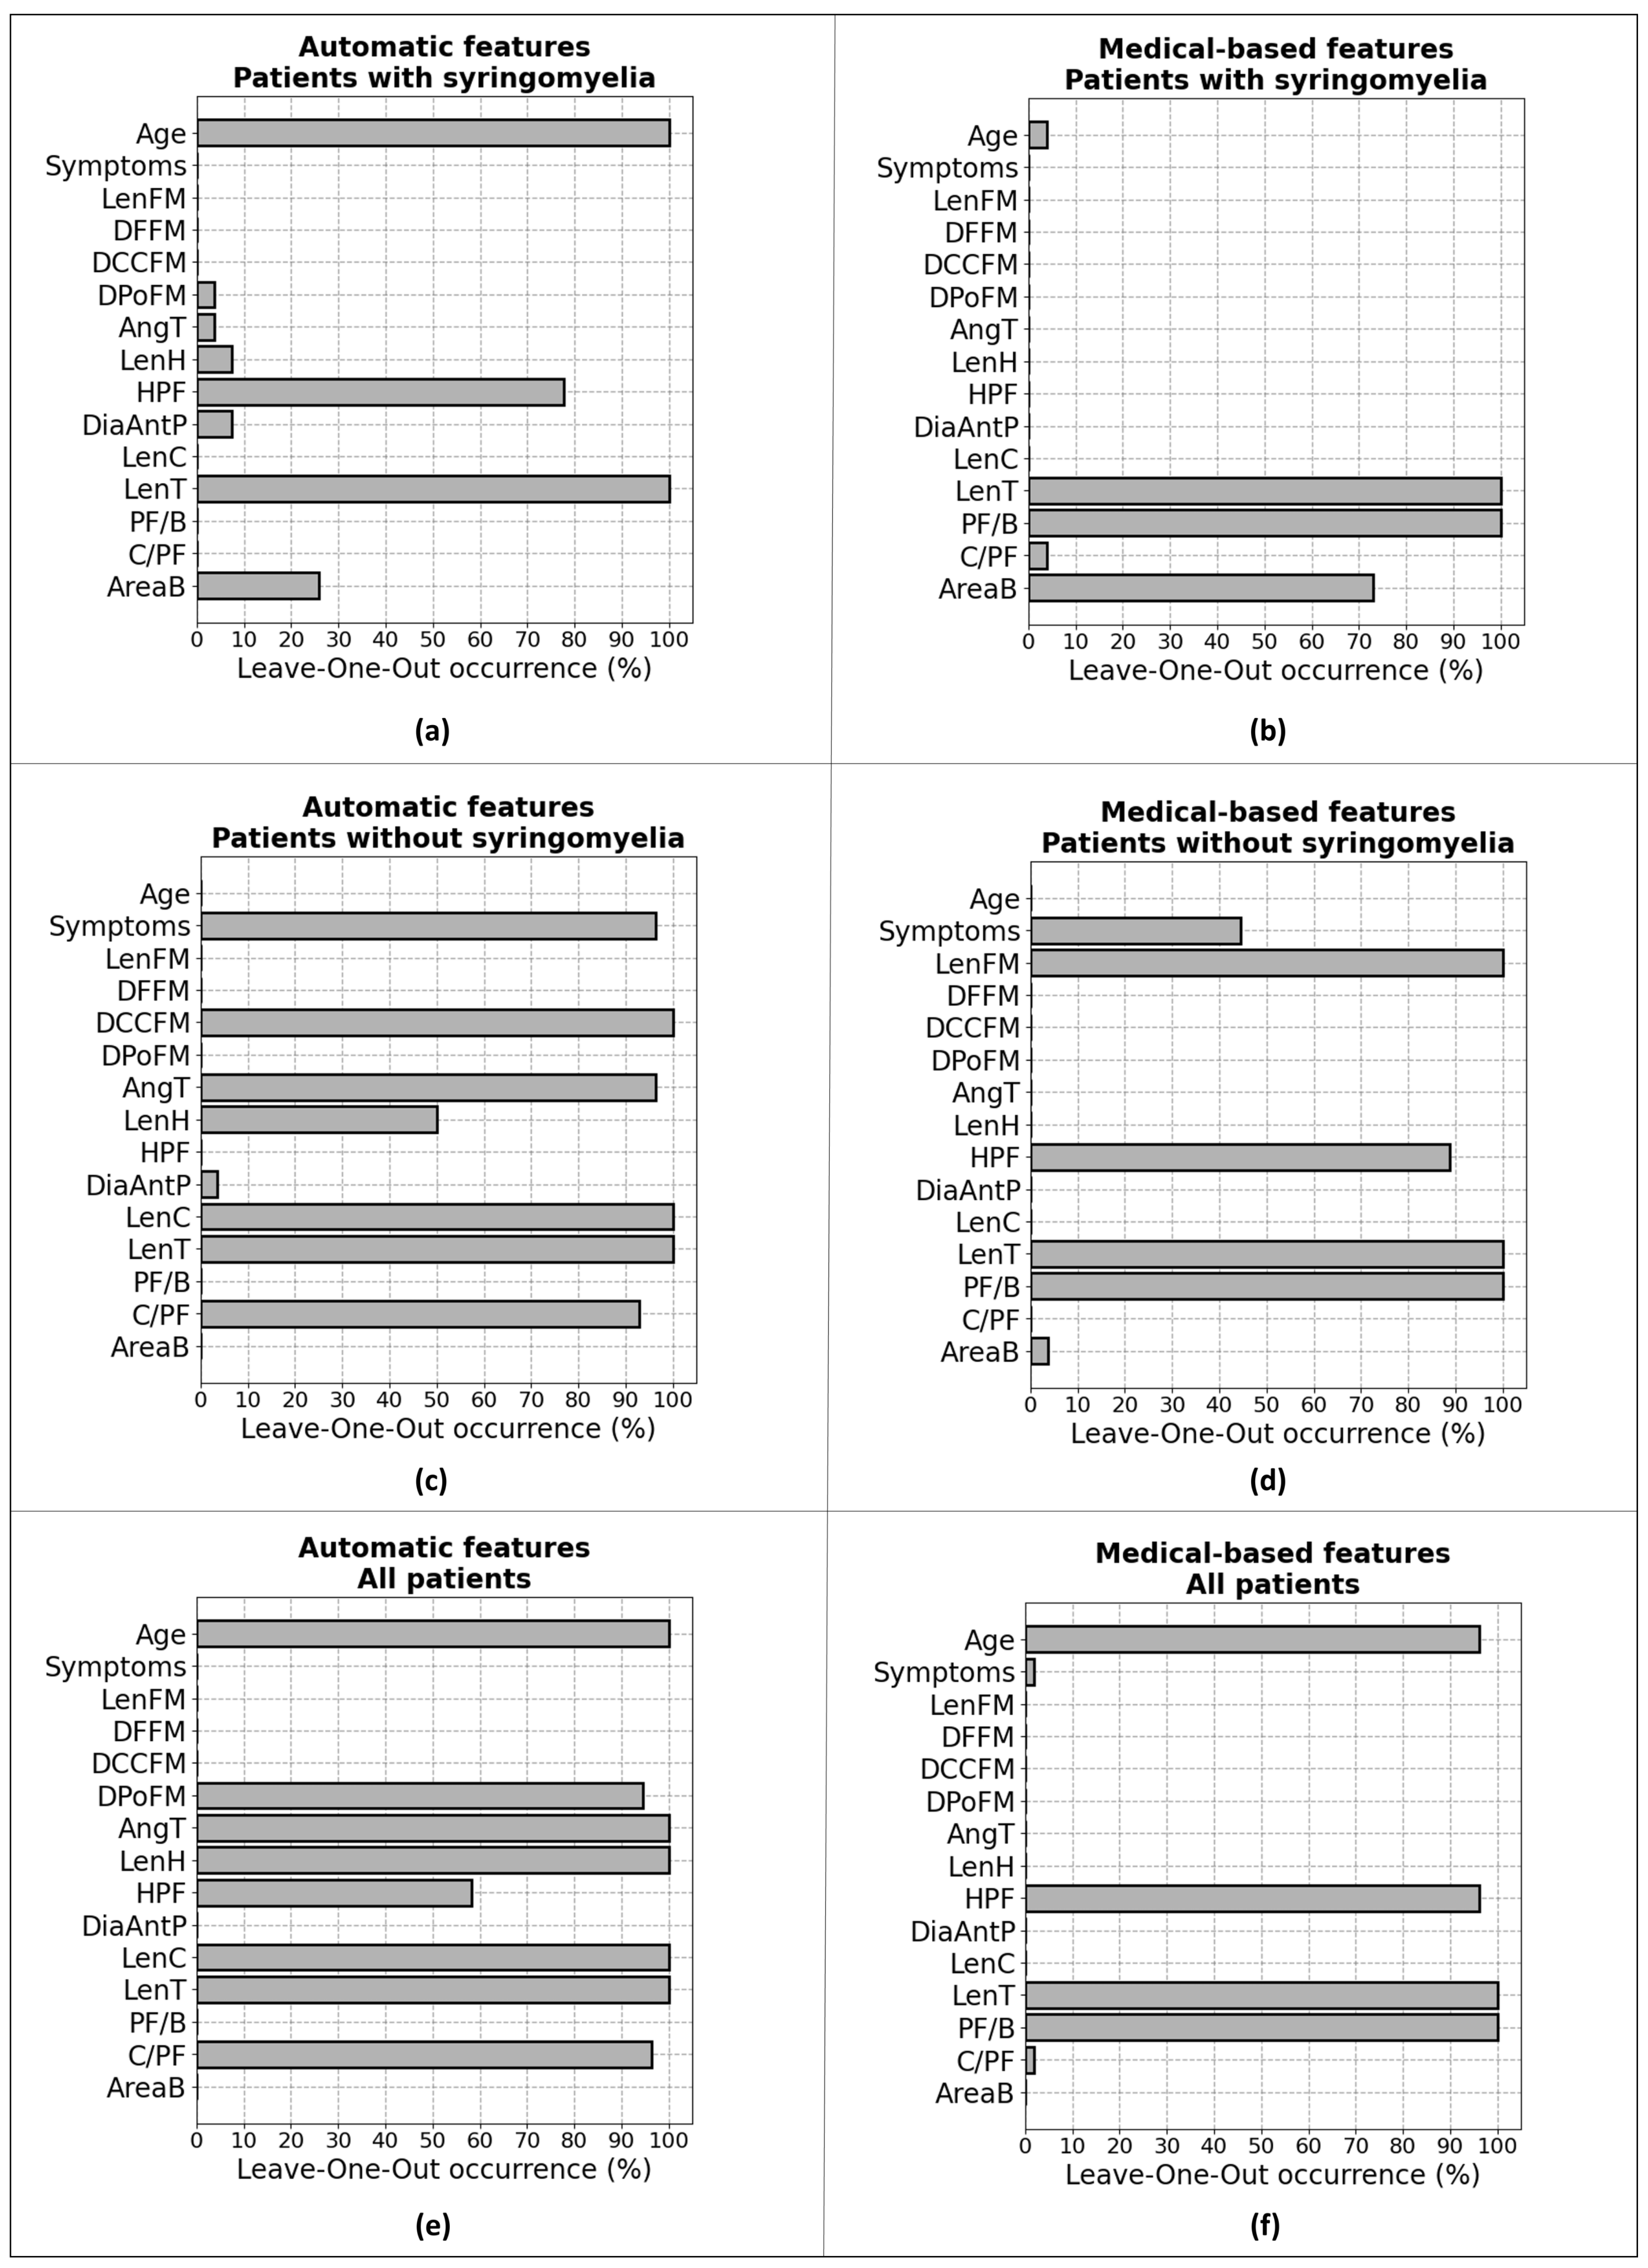
2.3.1. Investigation of the Relevance of Features

Each patient was characterized by morphometric indexes (either measured or automatically estimated from the sagittal MRI), the age and a cumulative variable called “symptoms” gathering the following clinical information:
  • nuchal headache;
  • mixed cranial nerve disorders (dysphagia, dysphonia, hiccups);
  • disorders of the oto-vestibular cranial nerves (vertigo, tinnitus);
  • motor/sensory problems;
  • cerebellar signs (ataxia, dysmetria, tremors);
  • sphincter disorders;
  • scoliosis;
  • other symptoms.
Specifically, all clinical problems, each encoded as a Boolean variable (namely, 1 if the given symptom occurs, 0 otherwise) were grouped by patients and summed.
Notice that the gender was not included, as it was not significantly related to the outcome. Moreover, the area of posterior fossa and cerebellum where not considered, as the information on the dimensions of the target regions was already included by using the following three indexes: area of the brain, C/PF ratio and PF/B ratio.
We standardized features by removing the mean and scaling to unit variance. As features selection technique, we exploit the so-called Least Absolute Shrinkage and Selection Operator (LASSO) [43] or “L1-based” solution [44]. LASSO allows the both regularization and selection of the features (as the weights of the less important features are put to zero).
As explainable technique to investigate the most important features for the different experimental settings, we counted the occurrence of each feature among the different Leave-One-Out (LOO) cross-validation folds (used to test the accuracy of classifiers, see below). This means that if the given feature f 1 was picked up by the LASSO selector at LOO iteration j, the corresponding occurrence O f 1 was increased by 1. Conversely, O f 1 is not increased if f 1 is not picked up by the LASSO.

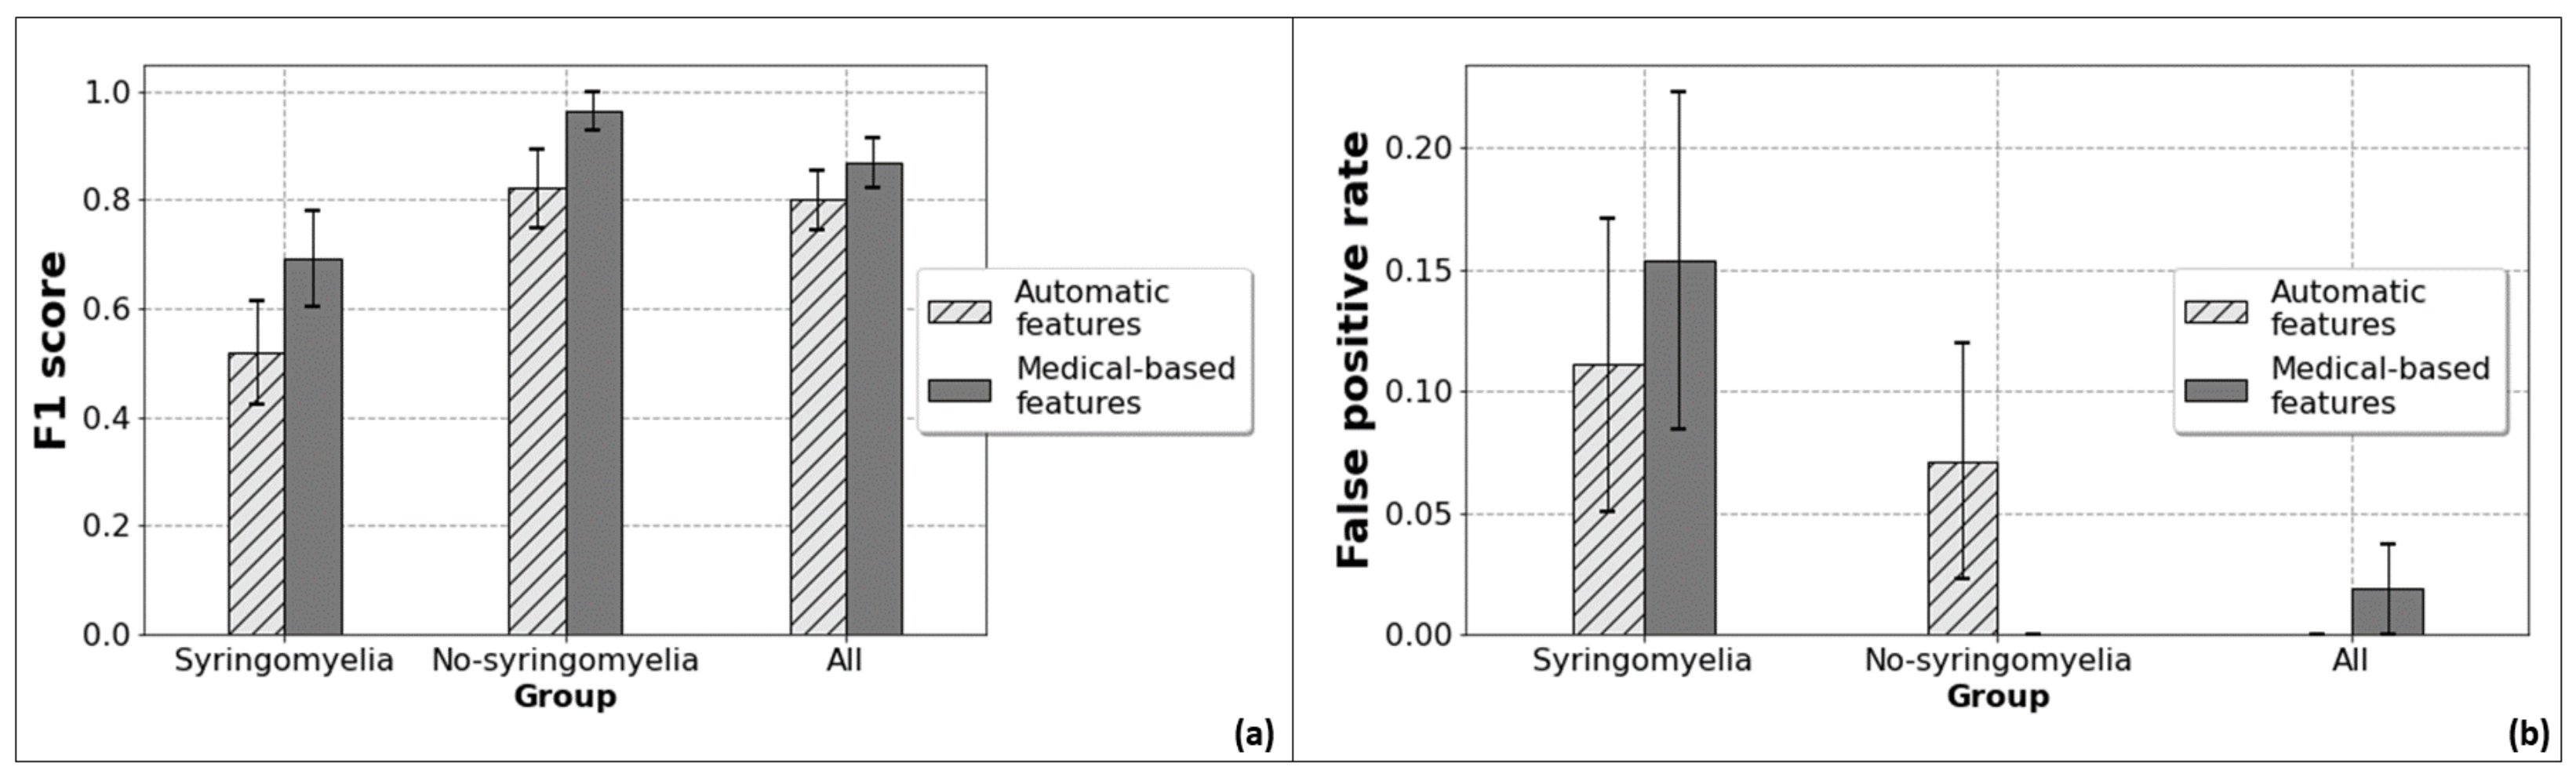
2.3.2. Binary Classification

To differentiate among the two classes of interest (namely patients showing improvement after the surgical operation versus no improvement), we trained six different soft-margin Support-Vector Machines (SVM) [45] on the following conditions:
  • features automatically obtained from the patients who have syringomyelia before treatment;
  • features measured automatically from the patients who did not show syringomyelia;
  • features estimated automatically, including all the patients;
  • manual measurements from patients with syringomyelia;
  • features measured manually on patients without syringomyelia;
  • manual measurements of all patients.
All the SVMs were trained in a LOO cross-validation fashion, i.e., taking out one different patient as test set at each iteration. At each cross-validation iteration, the SVMs were optimized on the training set (i.e., all data except one) with a grid search on the following hyper-parameters: the regularization factor (i.e., the width of the margin), the kernel and the corresponding coefficient. Thus, the optimal model was picked up and exploited on the test set.

3. Results

Table 1 lists morphometrics either measured manually or estimated by our algorithm, starting from images rigidly registered by an affine transformation fixing the positions of nasion and inion and rescaled on 256 × 256 pixels. Many measurements are statistically different when taken by either of the two methods; however, they are quite similar, with errors in paired data rarely larger than 15% (consider that also manual delineation has some uncertainty: for example, median errors in estimating brain, posterior fossa and cerebellum were about 3%, 7% and 7% in [33]; in our database, considering the two manual delineations, the average errors are about 5% for brain and cerebellum and 10% for the posterior fossa). Indeed, reasonable delineation was obtained by the automatic method for all images, as shown in the example in Figure 4.
Considering manual measurements, a better discrimination among groups was obtained. In fact, statistical differences among groups were found (by Kruskal-Wallis test) for posterior fossa area, ratio between areas of cerebellum and posterior fossa, ratio between areas of posterior fossa and brain, length of tentorium, height of posterior fossa and length of the foramen magnum. On the other hand, statistical differences among groups were found only for length of tentorium and length of clivus when considering automatic measurements.
Figure 5 shows the standard scores of the features. Notice that similar behavior is usually found (e.g., larger C/PF ratio and smaller PF/B ratio for patients showing no improvements), but indexes measured manually allow better discrimination among groups (and they are always in line with our expectation, whereas the automatic measurements show sometimes opposite behavior).
Figure 6 indicates the occurrence of features in the best classifiers. Most of selected features are those showing good linear discrimination in Figure 5, with some exceptions, as the classifier is non-linear; moreover, the integration of information of different features benefits of removing redundancy. Notice that some classifiers using features measured automatically select also indexes measured only manually in this study (i.e., DCCFM and DPoFM).
The results of classification are shown in Figure 7. Notice that the false positive rate in our database (i.e., the patients which were treated and had negative outcome) was 32% for patients without syringomyelia pre-treatment (comparing Group 0 and Group 3), 43% for patients with syringomyelia at first diagnosis (comparing Group 1 and Group 2) and about 38% pooling all patients together. The overall accuracy in selecting a useful intervention was 62% in our database (22 patients out of 58 worsened after the intervention); our machine learning methods obtained about 71% and 82% of accuracy when using features measured automatically and manually, respectively. Thus, our classifiers have important improvements, indicating some potential benefit in supporting the decision of the surgeon (discussed in the following section, together with possible biases and limitations).

4. Discussion

According to the preliminary results of our study, a decisional machine learning-based algorithm may be useful to select the most efficacious surgery for patients harboring CM-I with and without syringomyelia.
The proper selection of surgical technique for CM-I patients is very difficult since there are not current guidelines, but only recommendations and multicentric series [1,2,5,13,46]. Good and similar surgical outcomes have been reported both by simple bony decompression of posterior fossa [13,14] and duraplasty [1,18]. However, after surgery about 35% of patients’ clinical complaints may relapse [46]. Moreover, despite the applied type of surgery, the development of new syringomyelia and its worsening if pre-existent may occur [47].
Given the significant incidence of long-term patients’ deterioration, many literature reviews and case series have tried to select the “best” surgery procedure focusing on the opening of the dura mater with cerebellar tonsils coagulation as compared to simple bony decompression [1,48]. Thus, developing an objective and precise method to support the surgeon in selecting the surgery treatment of CM-I patients could be a great asset for neurosurgeons.
Both clinical and radiological information could be useful to select the most efficacious surgical technique in term of lower risk of post-operative syringomyelia [19,20,21]. On this basis, we proposed an automatic method to delineate important brain regions [33], from which morphometric measurements can be extracted to predict the right surgical approach [30]. Preliminary results have been obtained for the discrimination of healthy controls and patients and for the identification of the severity of the pathology [30]. However, only few patients (i.e., 10 mild and 8 severe) were available in our previous study. Based on a new database of 58 pediatric patients, in this work, the processing method was optimized: the bilateral filter was used instead of the median filter; the active contour method was improved adding more terms in the functional to be minimized. Different classifiers were then implemented to predict the outcome of the intervention, either considering patients with/without syringomyelia at first diagnosis or grouping all patients together.
Both general patients properties (i.e., age and clinical symptoms) and morphometrics were used as possible predictors. The morphometrics were measured either manually by expert neurosurgeons or automatically by our algorithm. The single features allow a better linear discrimination of different patient groups when measured manually (Figure 5). Two important parameters which show quite a large difference between manual and automatic measurement are the area of posterior fossa and the length of the hernia (Table 1). Notice that the estimation of posterior fossa shows also the largest variability when considering two different manual delineations. An error in a measurement can also have negative impact on the estimation of other parameters. For example, ratios of region areas are affected by errors in each of the two areas involved, as even small mistakes at the numerator and at the denominator could result in a large inaccuracy in the ratio (e.g., if the numerator is estimated larger and the denominator smaller). Indeed, the ratio PF/B shows a large difference between manual and automatic measurement and it is one of the most discriminating manual feature (whereas it is not, when computed automatically). About the length of the hernia, the role of active contour is mostly that of improving the estimation of this important parameter: indeed, demons imposes a continuous transformation, which requires preserving topology in the atlas and in the test image; thus, the hernia found in the test image is biased by that of the atlas [30]. Moreover, the length of the hernia depends on the correct identification of the lower border of the posterior fossa: thus, a mistake in identifying posterior fossa has an immediate impact on the estimation of the length of hernia.
The results of classification obtained through the manual or the automatic segmentations show good predictive values through the employed classifiers, especially if some morphological parameters of the posterior fossa are included. In particular, patients with a high C/PF ratio and low PF/B ratio could benefit more after aggressive surgery (i.e., duraplasty with tonsillar resection), in line with our previous observations [29,30]. On the other side, even symptomatic patients without these features have a good chance to improve clinically with low risk of syringomyelia after less invasive surgery too (i.e., simple bony decompression of the posterior fossa). Although the classifier using manual measurements achieved a better discrimination between the different patient groups, the fully automatic method still provides good prediction of possible negative outcomes. Moreover, it obtained a reasonable delineation for all images, with errors in parameter estimation rarely exceeding 15% (with some exceptions, mentioned above). This is certainly a good result considering that even the manual delineation shows some measurement uncertainty, especially when estimating areas of the brain, posterior fossa and cerebellum. Thus, further improvement of the automatic delineation method is needed, in order to remove subjective measurements, but still achieving good precision. Possibly, a multi-atlas approach or a completely different technique (e.g., based on deep learning processing of MRIs [27]) could allow for better estimations in the future.
The limitations of the study are mainly related to the short follow-up and to the small and heterogeneous patients’ series limited to a single centre. The small dataset could possibly induce some bias related to an overfitting of the limited number of cases on which the classifier was trained. A great range of ages was considered, thus including patients which could have different morphologies: this could obscure the selection of features that are discriminant only in specific stages of growth. Moreover, generalization of our algorithm to patients from other hospitals could be limited, as the considered MRIs were obtained by the same machine, managed by the same operators. However, the final results encourage to proceed with a prospective study recruiting more candidates in order to improve the automatic delineation method and the performance of the classification. Moreover, a larger (possibly multicentre) database could allow for better patient stratification, e.g., devising specific classifiers focused on short ranges of patients’ age, which is important in pediatrics.

5. Conclusions and Further Work

This preliminary study demonstrates how a machine learning algorithm based on Demons registration, active contour correction and SVM classification can be helpful in the neurosurgical management of symptomatic patients with Chiari I malformation with or without syringomyelia. It can provide predictive information about post-surgical outcome and guide the choice of the most appropriate type of surgery, based on clinical and radiological features present at diagnosis, in order to reduce the risk of symptoms recurrence and syringomielia development. Prospective studies and larger patients’ series are necessary to further validate and optimize this method.

Author Contributions

Conceptualization, L.M., C.F.C. and F.G.; methodology, L.M. and F.P.; software, L.M. and F.P.; validation, L.M.; data preparation, E.L.A.F., M.L., M.C.L., M.S. and K.M.; investigation, All; writing—original draft preparation, L.M., F.G., A.N. and E.L.A.F.; writing—review and editing, All; visualization, L.M. and F.P.; supervision, L.M., C.F.C. and F.G. All authors have read and agreed to the published version of the manuscript.

Funding

This research is supported by AISMAC—Associazione Italiana Siringomielia e Arnold Chiari.

Institutional Review Board Statement

The study protocol, run in line with the World Medical Association Declaration of Helsinki, was approved by the Institutional Review Board of Meyer Children’s Hospital, Florence, Italy (protocol code: CHIARI-AI).

Informed Consent Statement

Informed consent was obtained from all subjects involved in the study.

Data Availability Statement

Data are available from the corresponding author upon reasonable request.

Acknowledgments

A contribution to data processing and visualization was provided by Antonella Falcicchio, Viola Briccarello and Andrea Pasotti.

Conflicts of Interest

The authors declare no conflict of interest.

Abbreviations

The following abbreviations are used in this manuscript:
AngTangle of the tentorium
C/PFratio of cerebellum area to posterior cranial fossa area
CVJcraniocervical junction
CM-IChiari Malformation Type I
CSFcerebro-spinal fluid
DiaAntPantero-posterior diameter of posterior fossa
DCCFMdistance between corpus callosum and foramen magnum
DFFMdistance between fastigium and foramen magnum
DPoFMdistance between pons and foramen magnum
GVFGradient Vector Flow
H_PFheight of posterior cranial fossa
LASSOleast absolute shrinkage and selection operator
LenClength of the clivus
LenFMlength of the foramen magnum
LenHlength of hernia
LenTlength of tentorium
LOOleave-one-out
MRImagnetic resonance imaging
PF/BRatio of posterior cranial fossa area to brain area
REDCapResearch Electronic Data Capture

References

  1. Massimi, L.; Peretta, P.; Erbetta, A.; Solari, A.; Farinotti, M.; Ciaramitaro, P.; Saletti, V.; Caldarelli, M.; Canheu, A.C.; Celada, C.; et al. Diagnosis and treatment of Chiari malformation type 1 in children: The International Consensus Document. Neurol. Sci. 2022, 43, 1311–1326. [Google Scholar] [CrossRef] [PubMed]
  2. Shah, A.H.; Dhar, A.; Elsanafiry, M.S.M.; Goel, A. Chiari malformation: Has the dilemma ended? J. Craniovertebr. Junction Spine 2017, 8, 297–304. [Google Scholar] [CrossRef] [PubMed]
  3. Gad, K.A.; Yousem, D.M. Syringohydromyelia in Patients with Chiari I Malformation: A Retrospective Analysis. Am. J. Neuroradiol. 2017, 38, 1833–1838. [Google Scholar] [CrossRef] [PubMed]
  4. Bordes, S.; Jenkins, S.; Tubbs, R.S. Defining, diagnosing, clarifying, and classifying the Chiari I malformations. Child’s Nerv. Syst. 2019, 35, 1785–1792. [Google Scholar] [CrossRef]
  5. Curone, M.; Valentini, L.G.; Vetrano, I.; Beretta, E.; Furlanetto, M.; Chiapparini, L.; Erbetta, A.; Bussone, G. Chiari malformation type 1-related headache: The importance of a multidisciplinary study. Neurol. Sci. 2017, 38, 91–93. [Google Scholar] [CrossRef]
  6. Hiremath, S.B.; Fitsiori, A.; Boto, J.; Torres, C.; Zakhari, N.; Dietemann, J.L.; Meling, T.R.; Vargas, M.I. The Perplexity Surrounding Chiari Malformations—Are We Any Wiser Now? AJNR Am. J. Neuroradiol. 2020, 41, 1975–1981. [Google Scholar] [CrossRef]
  7. Fric, R.; Ringstad, G.; Eide, P.K. Chiari-malformasjon type 1—Diagnostikk og behandling. Tidsskr. Den Nor. Legeforening 2019, 139. [Google Scholar] [CrossRef]
  8. Hansberry, D.; Agarwal, N.; Tomei, K.; Goldstein, I. Posterior reversible encephalopathy syndrome in a patient with a Chiari I malformation. Surg. Neurol. Int. 2013, 4, 130. [Google Scholar]
  9. Markunas, C.A.; Tubbs, R.S.; Moftakhar, R.; Ashley-Koch, A.E.; Gregory, S.G.; Oakes, W.J.; Speer, M.C.; Iskandar, B.J. Clinical, radiological, and genetic similarities between patients with Chiari Type I and Type 0 malformations. J. Neurosurg. Pediatr. 2012, 9, 372–378. [Google Scholar] [CrossRef]
  10. Urbizu, A.; Toma, C.; Poca, M.A.; Sahuquillo, J.; Cuenca-León, E.; Cormand, B.; Macaya, A. Chiari Malformation Type I: A Case-Control Association Study of 58 Developmental Genes. PLoS ONE 2013, 8, e57241. [Google Scholar] [CrossRef]
  11. Chatrath, A.; Marino, A.; Taylor, D.; Elsarrag, M.; Soldozy, S.; Jane, J.A. Chiari I malformation in children-the natural history. Child’s Nerv. Syst. 2019, 35, 1793–1799. [Google Scholar] [CrossRef]
  12. Balasa, A.; Kunert, P.; Dziedzic, T.; Bieleci, M.; Kujawski, S.; Marchel, A. Comparison of dural grafts and methods of graft fixation in Chiari malformation type I decompression surgery. Sci. Rep. 2021, 11, 14801. [Google Scholar] [CrossRef]
  13. Genitori, L.; Peretta, P.; Nurisso, C. Chiari type I anomalies in children and adolescents: Minimally invasive management in a series of 53 cases. Child’s Nerv. Syst. 2000, 16, 707–718. [Google Scholar] [CrossRef]
  14. Caldarelli, M.; Novegno, F.; Vassimi, L. The role of limited posterior fossa craniectomy in the surgical treatment of Chiari malformation type I: Experience with a pediatric series. J. Neurosurg. 2007, 106, 187–195. [Google Scholar] [CrossRef]
  15. Kennedy, B.C.; Kelly, K.M.; Phan, M.Q. Outcomes after suboccipital decompression without dural opening in children with Chiari malformation type I. J. Neurosurg. Ped. 2015, 16, 150–158. [Google Scholar] [CrossRef]
  16. Limonadi, F.M.; Selden, N.R. Dura-splitting of the craniocervical junction: Reduced operative time, hospital stay, and cost with equivalent early outcome. J. Neurosurg. 2004, 101 (Suppl. 2), 184–188. [Google Scholar] [CrossRef]
  17. Siasios, J.; Kapsalaki, E.Z.; Fountas, K.N. Surgical management of patients with Chiari I malformation. Int. J. Ped. 2012, 2012, 640127. [Google Scholar] [CrossRef]
  18. Baisden, J. Controversies in Chiari I malformations. Surg Neurol. Int. 2012, 3 (Suppl. 3), S232–S237. [Google Scholar] [CrossRef]
  19. Urbizu, A.; Poca, M.A.; Vidal, X.; Rovira, A.; Sahuquillo, J.; Macaya, A. MRI-based morphometric analysis of posterior cranial fossa in the diagnosis of Chiari malformation type I. J. Neuroimaging 2014, 24, 250–256. [Google Scholar] [CrossRef]
  20. Bagci, A.M.; Lee, S.H.; Nagornaya, N. Automated posterior cranial fossa volumetry by MRI: Applications to Chiari malformation type I. AJNR Am. J. Neuroradiol. 2013, 34, 1758–1763. [Google Scholar] [CrossRef]
  21. Furtado, S.V.; Reddy, K.; Hedge, A.S. Posterior fossa morphometry in symptomatic pediatric and adult Chiari I malformation. J. Clin. Neurosci. 2009, 16, 1449–1454. [Google Scholar] [CrossRef]
  22. Nishikawa, M.; Sakamoto, H.; Hakuba, A. Pathogenesis of Chiari malformation: A morphometric study of the posterior cranial fossa. J. Neurosurg. 1997, 86, 40–47. [Google Scholar] [CrossRef]
  23. Trigylidas, T.; Baronia, B.; Vassilyadi, M. Posterior fossa dimension and volume estimates in pediatric patients with Chiari I malformation. Child’s Nerv. Syst. 2008, 24, 329–336. [Google Scholar] [CrossRef]
  24. Despotovic, I.; Goossens, B.; Philips, W. MRI Segmentation of the Human Brain: Challenges, Methods, and Applications. Comput. Math. Methods Med. 2015, 2015, 450341. [Google Scholar] [CrossRef]
  25. Fang, L.; Zhang, L.; Nie, D.; Cao, X.; Rekik, I.; Lee, S.; He, H.; Shen, D. Automatic brain labeling via multi-atlas guided fully convolutional networks. Med. Image Anal. 2019, 51, 157–168. [Google Scholar] [CrossRef]
  26. Tetik, B.; Mert Doğan, G.; Paşahan, R.; Durak, M.A.; Güldoğan, E.; Saraç, K.; Önal, Ç.; Yıldırım, İ.O. Multi-parameter-based radiological diagnosis of Chiari Malformation using Machine Learning Technology. Int. J. Clin. Pract. 2021, 75, e14746. [Google Scholar] [CrossRef]
  27. Tanaka, K.W.; Russo, C.; Liu, S.; Stoodley, M.A.; Di Ieva, A. Use of deep learning in the MRI diagnosis of Chiari malformation type I. Neuroradiology 2022, 64, 1585–1592. [Google Scholar] [CrossRef] [PubMed]
  28. Urbizu, A.; Martin, B.A.; Moncho, D.; Rovira, A.; Poca, M.A.; Sahuquillo, J.; Macaya, A.; Español, M.I. Machine learning applied to neuroimaging for diagnosis of adult classic Chiari malformation: Role of the basion as a key morphometric indicator. J. Neurosurg. 2018, 129, 779–791. [Google Scholar] [CrossRef]
  29. Mesin, L.; Mokabberi, F.; Carlino, C.F. Identification of optimal surgical intervention for Chiari I malformation. In Proceedings of the IEEE Conference on Computational Intelligence in Bioinformatics and Computational Biology (CIBCB), Siena, Italy, 9–11 July 2019; pp. 1–5. [Google Scholar]
  30. Mesin, L.; Mokabberi, F.; Carlino, C.F. Automated Morphological Measurements of Brain Structures and Identification of Optimal Surgical Intervention for Chiari I Malformation. IEEE J. Biomed. Health Inform. 2020, 24, 3144–3153. [Google Scholar] [CrossRef]
  31. Harris, P.A.; Taylor, R.; Thielke, R.; Payne, J.; Gonzalez, N.; Conde, J.G. Research electronic data capture (REDCap)—A metadata-driven methodology and workflow process for providing translational research informatics support. J. Biomed. Inform. 2009, 42, 377–381. [Google Scholar] [CrossRef]
  32. Harris, P.A.; Taylor, R.; Minor, B.L.; Elliott, V.; Fernandez, M.; O’Neal, L.; McLeod, L.; Delacqua, G.; Delacqua, F.; Kirby, J.; et al. REDCap Consortium, The REDCap consortium: Building an international community of software partners. J. Biomed. Inform. 2019, 95, 103208. [Google Scholar] [CrossRef] [PubMed]
  33. Mesin, L. Balanced multi-image demons for non-rigid registration of magnetic resonance images. Magn. Reson. Imaging 2020, 74, 128–138. [Google Scholar] [CrossRef] [PubMed]
  34. Sotiras, A.; Davatzikos, C.; Paragios, N. Deformable medical image registration: A survey. IEEE Trans. Med. Imaging 2013, 32, 1153–1190. [Google Scholar] [CrossRef] [PubMed]
  35. Thirion, J.P. Image matching as a diffusion process: An analogy with Maxwell’s demons. Med. Image Anal. 1998, 2, 243–260. [Google Scholar] [CrossRef]
  36. Vercauteren, T.; Pennec, X.; Perchant, A.; Ayache, N. Diffeomorphic demons: Efficient non-parametric image registration. NeuroImage 2009, 45, 61–72. [Google Scholar] [CrossRef]
  37. Tomasi, C.; Manduchi, R. Bilateral filtering for gray and color images. In Proceedings of the Sixth International Conference on Computer Vision (IEEE Cat. No.98CH36271), Bombay, India, 7 January 1998; pp. 839–846. [Google Scholar]
  38. Mishro, P.K.; Agrawal, S.; Panda, R.; Hansdah, K.T. MR Image Enhancement using Stationary Wavelet Transform based Approach. In Proceedings of the 11th International Conference on Computing, Communication and Networking Technologies (ICCCNT), Kharagpur, India, 1–3 July 2020; pp. 1–6. [Google Scholar]
  39. Kovesi, P. Symmetry and Asymmetry from Local Phase. In Proceedings of the Tenth Australian Joint Converence on Artificial Intelligence, Perth, Australia, 30 November–4 December 1997; pp. 2–4. [Google Scholar]
  40. Kass, M.; Witkin, A.; Terzopoulos, D. Snakes: Active contour models. Int. J. Comput. Vis. 1988, 1, 321–331. [Google Scholar] [CrossRef]
  41. Xu, C.; Prince, J.L. Gradient vector flow: A new external force for snakes. In Proceedings of the IEEE Computer Society Conference on Computer Vision and Pattern Recognition, San Juan, Puerto Rico, 17–19 June 1997; pp. 66–71. [Google Scholar]
  42. Cohen, L.D. Note: On active contour models and balloons. CVGIP (Image Underst.) 1991, 53, 211–218. [Google Scholar] [CrossRef]
  43. Tibshirani, R. Regression Shrinkage and Selection via the lasso. J. R. Stat. Soc. Ser. B (Methodol.) 1996, 58, 267–288. [Google Scholar] [CrossRef]
  44. Baraniuk, R.G. Compressive sensing [lecture notes]. IEEE Signal Process. Mag. 2007, 24, 118–121. [Google Scholar] [CrossRef]
  45. Cortes, C.; Vapnik, V.N. Support-Vector Networks. Mach. Learn. 1995, 20, 273–297. [Google Scholar] [CrossRef]
  46. Kalb, S.; Perez-Orribo, L.; Mahan, M.; Theodore, N.; Nakaji, P.; Bristol, R.E. Evaluation of operative procedures for symptomatic outcome after decompression surgery for Chiari type I malformation. J. Clin. Neur. 2012, 19, 1268–1272. [Google Scholar] [CrossRef]
  47. Shenoy, V.S.; Sampath, R. Syringomyelia. In StatPearls [Internet]; StatPearls Publishing: Treasure Island, FL, USA, 2022. [Google Scholar]
  48. Massimi, L.; Frassanito, P.; Bianchi, F.; Tamburrini, G.; Caldarelli, M. Bony decompression vs duraplasty for Chiari I malformation: Does the eternal dilemma matter? Child’s Nerv. Syst. 2019, 35, 1827–1838. [Google Scholar] [CrossRef]
Figure 1. Manual segmentation of a sagittal MRI: brain region (yellow), posterior cranial fossa (green), cerebellum area (blue).
Applsci 12 09039 g001
Figure 2. Pre-processing by bilateral filter and wavelet.
Applsci 12 09039 g002
Figure 3. The five images used for the multi-image demons registration of an example sagittal MRI.
Applsci 12 09039 g003
Figure 4. Example of test image registration. The atlas (a) and the test (b) images are deformed so as to be similar. In the balanced method, both images are iteratively deformed, each by a transformation: by composing the transformation of the atlas and the inverse of the transformation of the test image, the total deformation of the atlas (c) needed to make it match the test image is obtained. The deformation is then applied to the regions delineated on the atlas to estimate the corresponding regions for the test MRI (d).
Applsci 12 09039 g004
Figure 5. Boxplots of the standard scores (median, quartiles, range and outliers indicated with diamonds) of the features grouped by the two classes of interest: patients showing improvements due to the surgical operation vs. no improvements. Each row stems from a different group of patients: (i) patients with syringomyelia at diagnosis, considering the automatic (a) and manual (b) delineation; (ii) patients without syringomyelia, using automatic (c) and clinical (d) measurements; (iii) all subjects together (with and without syringomyelia), using automatic features (e) and manual measurements (f).
Applsci 12 09039 g005
Figure 6. Bars providing the occurrence of features among the Leave-One-Out cross-validation strategy. Each row indicates a different group of patients: (i) patients with syringomyelia at diagnosis, considering the automatic (a) and manual (b) delineation; (ii) patients without syringomyelia, using automatic (c) and clinical (d) measurements; (iii) all subjects together (with and without syringomyelia), using automatic features (e) and manual measurements (f).
Applsci 12 09039 g006
Figure 7. F1-score (a) and false positive rate (b) of SVM classifier. For both (a,b) we can observe from left to right patients with syringomyelia, without syringomyelia and all together. The corresponding side-by-side bars, differentiated by textures and colors, provide the two metrics respectively for the SVM fed with features automatically obtained from our methodology (light gray, dashed bar) and with medical-based features (dark gray, solid). The error bars provide the standard error among the Leave-One-Out cross-validation folds. Both the metrics are “macro-weighted”, namely averaged among the two classes.
Applsci 12 09039 g007
Table 1. Morphological measurements obtained manually or automatically (mean ± std) and percentage difference of medians (either not paired or paired, with significance inspected respectively with Wilcoxon rank sum and signed rank tests). Areas are measured in pixels covered by the region, lengths in pixels and the angle in radiants. The number of processed MRIs is 58.
MeasurementManualAutomaticDifferencePaired Difference
Brain Area15,990 ± 152315,632 ± 12510.4% (p = 0.27)6.5% (p < 0.05)
PF Area3343 ± 7023003 ± 41516.6% (p < 0.05)20.7% (p < 0.05)
Cerebellum Area2043 ± 3921895 ± 3637.0% (p < 0.05)16.4% (p < 0.05)
C/PF0.62 ± 0.110.63 ± 0.06−0.7% (p = 0.92)12.9% (p = 0.49)
PF/B0.21 ± 0.030.19 ± 0.0212.4% (p < 0.05)16.7% (p < 0.05)
LenT42.1 ± 15.740.5 ± 6.1−0.5% (p = 0.82)23.1% (p = 0.47)
LenC46.6 ± 12.646.3 ± 8.50.8% (p = 0.52)13.3% (p = 0.46)
LenFM42.7 ± 10.440.7 ± 9.95.9% (p = 0.30)25.5% (p = 0.18)
DiaAntP74.8 ± 20.375.5 ± 6.57.2% (p < 0.05)12.1% (p < 0.05)
H_PF56.6 ± 12.452.3 ± 7.96.9% (p < 0.05)14.1% (p < 0.05)
LenH15.9 ± 7.711.8 ± 4.314.4% (p < 0.05)31.9% (p < 0.05)
AngT1.13 ± 0.231.08 ± 0.161.3% (p = 0.24)15.1% (p = 0.18)
DPoFM38.3 ± 6.5
DCCFM62.3 ± 6.6
DFFM27.9 ± 4.7
Publisher’s Note: MDPI stays neutral with regard to jurisdictional claims in published maps and institutional affiliations.

