Abstract
Mental health issues are a growing problem worldwide, and their detection can be complicated. Assessments such as the Patient Health Questionnaire (PHQ-9) and Generalized Anxiety Disorder (GAD-7) questionnaire can be useful tools for detecting depression and anxiety, however, due to being self-reported, patients may underestimate their own risk. To address this problem, two new assessments are introduced, i.e., the PHQ-V and GAD-V, that utilize open-ended video questions adapted from the PHQ-9 and GAD-7 assessments. These video-based assessments analyze language, audio, and facial features by applying recent work in machine learning, namely pre-trained transformer networks, to provide an additional source of information for detecting risk of illness. The PHQ-V and GAD-V are adept at predicting the original PHQ-9 and GAD-7 scores. Analysis of their errors shows that they can detect depression and anxiety in even cases where the self-reported assessments fail to do so. These assessments provide a valuable new set of tools to help detect risk of depression and anxiety.
1. Introduction
Mental health issues, such as depression and anxiety, are a major problem and are increasing worldwide [1]. Mental illness creates significant burdens for individuals and service providers alike. Even with its growing importance, mental illness often goes undiagnosed due to the complex nature and variety of symptoms associated with its different types [2]. This complexity demonstrates the importance of improving the tools available for detecting depression and anxiety, to increase the likelihood that these illnesses can be identified and diagnosed.
A common method for detecting depression and anxiety uses self-reported questionnaires such as the Patient Health Questionnaire (PHQ-9) or the General Anxiety Disorder (GAD-7) questionnaire [3,4]. The strengths of these questionnaires are their simplicity and ease of administration while retaining good reliability and validity. Remote-care versions of these questionnaires further increase the ease and frequency of administering the tests, while keeping the burden to a minimum for both provider and patient. The downside of these methods is that they are self-reported, which can cause misalignment of risk as a patient over- or underestimates the severity of their own condition. Also, the method does not use other potentially valuable information about the patient beyond what the patient knows about themselves; this information may include language, emotion, tone, and movement.
Recent research has shown that individuals struggling with mental illness have distinctive patterns of speech [5,6], word choice [7], and facial expressions [8]. This provides reason to believe that there exist rich verbal and non-verbal features which can be captured by video and used to detect mental illness. Video is rapidly becoming accessible via video-based remote monitoring systems, providing a new source of valuable data about patients. Using remote monitoring keeps the burden on both provider and patient at a minimum and allows consistent follow up, while also providing information regarding the patient’s speech, word choice, and facial expressions.
In recent years, there has been an increase of successful research using new machine-learning methods, largely due to the advent of transformer-based architectures [9] and large self-supervised models [10]. These models are pre-trained using large quantities of unlabeled data to predict masked-out portions of the data and to learn generalizable information that can then be finely tuned for downstream tasks. These methods have been successfully applied in natural language processing [11], audio processing [12], and facial analysis [13], and provide a way of producing insights from video that previously did not exist.
The main goal of this research is to introduce two new assessments, the PHQ-V and GAD-V, named for their use of open-ended video questions to predict PHQ-9 and GAD-7 scores; and to show that these new assessments are a reasonable replacement for the traditional surveys in cases where asynchronous video is available and is more convenient. These assessments are built on transformer-based machine-learning methods that detect depression and anxiety from verbal and non-verbal features found in video responses, including language, audio, and facial markers. These new assessments showed high correlation with PHQ-9 and GAD-7 scores, and analysis showed potential benefits of these new assessments for detecting signs of depression and anxiety in cases where the PHQ-9 and GAD-7 assessments were not able to do so. Overall, these assessments provide a new set of tools for detecting signs of mental illness by using asynchronous video in place of the multiple-choice PHQ-9 and GAD-7 surveys.
2. Related Work
2.1. Markers for Mental Illness
Markers detecting the prevalence of mental illness have been found in language, audio, and facial expressions that have been shown to be correlated with mental illness. The following sections review separately the related work in each of these domains.
2.1.1. Linguistic Analysis
Linguistic analysis has shown to be an effective marker for various types of mental illness including depression [14], anxiety [15], schizophrenia [16], and bi-polar disorder [17]. A variety of libraries and tools are commonly used, including Linguistic Inquiry and Word Count (LIWC), spaCy, and the Natural Language Toolkit (NLTK) that generate various language features. It has been shown there is predictive value in analyzing parts of speech including personal pronouns [18], absolutist language [19], and negative emotional words [20].
2.1.2. Audio Markers
Audio has also been shown to be effective for detecting mental disorders such as depression, schizophrenia, hypomania, and anxiety, with varying degrees of success [21]. For detecting depression and anxiety, measuring monotonous speech using f0 has repeatedly been found effective, as have other acoustic features such as jitter and shimmer [22,23,24].
2.1.3. Facial Markers
Facial features have further shown success in predicting depression [25]. This has primarily been achieved using machine learning on raw videos in supervised and unsupervised training regimes, as well as proxy metrics such as facial landmarks and emotional cues [26]. Affectiva [27] has been shown to be effective for detecting facial action units and emotions from video that can then be used as features for detecting depression and emotional cues.
2.2. Transformer Models
Vaswani et al. [9] introduced transformer models in their seminal paper ‘Attention Is All You Need’. Transformer models have since been applied to language [11], speech [12], and video [28]. The success of transformer models can be largely attributed to their ability to attend to an entire sequence of data simultaneously. Devlin et al. [11] showed the strength of transformer models for natural language processing, using their Bidirectional Encoder Representations (BERT) model that introduced a new training objective to predict masked words in text. For multiple natural language processing (NLP) benchmark tasks, BERT successfully obtained results which at the time were state-of-the-art. Sentence BERT [29] further improved on BERT, and learned a better understanding of longer sentences and paragraphs. Many BERT variants have since been built for a variety of purposes.
The success of BERT and other transformer networks can largely be attributed to the power of training large self-supervised models, a process often referred to as pre-training. This pre-training process learns generalizable features from large corpuses of data by training using unlabeled datasets that can be substantially larger than labeled datasets. These self-supervised models can then be finely tuned using transfer learning [30] with a smaller dataset of labeled data. This approach has been extended to audio [12,31] and video [32], and has been shown to be effective in a variety of tasks such as emotion recognition, speaker verification, and spoken language understanding [33].
2.3. Mental Illness Models
Recent work has shown the effectiveness of using BERT-based transformers for social media texts [34,35,36] as well as transformers on audio text transcripts [37,38], for detecting mental illnesses such as depression and anxiety. These methods show the promising potential of transformer-based methods for detecting signs of mental illness. Methods based on social media texts have the advantage of data being readily available and easy to acquire, but have the limitation of not being very useful in a clinical setting for two main reasons; (1) the lack of direct specific prompts may discourage participants from expressing their underlying feelings; (2) the nature of text in social media differs substantially from natural speech.
Datasets such as the Distress Analysis Interview Corpus (DAIC) for English [39] and Emotional Audio-Textual Depression Corpus (EATD-Corpus) for Chinese [38] address these issues by providing transcripts from clinical interviews. As a result, these datasets are more clinically useful than their social media counterparts. Both corpuses utilize a virtual interviewer that asks questions. In the case of DAIC some combination of 170 questions is asked, while the EATD-Corpus simplifies the interview into three questions.
There are four main advantages of the PHQ-V and GAD-V assessments over these datasets. First, the dataset size for the PHQ-V/GAD-V assessments is roughly an order of magnitude larger, which can improve generalizability; the validation study described below shows that an increase of 20% in the number of samples improved the model scores significantly. Second, the standardization of five questions provides a simplified and repeatable experience compared to the 170 possible questions from DAIC. Third, the removal of the need for a virtual interviewer further simplifies the practical application of these assessments. Lastly, the asynchronous nature of the PHQ-V/GAD-V assessments provides a convenient way for patients to provide this information in their own time from their home computer or mobile device, providing consistent feedback to the reviewer.
Multimodel Models
Various research studies have shown the potential value of fusing multiple modalities such as audio and text [40], including when using transformer models [41]. We hypothesized that similar gains would be observed by adding audio and video modalities to text, but this result did not materialize during this research. The observed result came as a big surprise; we discuss this result in further detail in the results section, and provide some possible explanations for these results, as well as discussing potential further work that should be undertaken.
3. Materials and Methods
3.1. Dataset and Preprocessing
The dataset used for this research was obtained from participants that took part in an online digital survey powered by Videra Health. The survey contained a total of 22 questions including a combination of traditional self-assessed measures of anxiety and depression, PHQ-9 and GAD-7, mixed with video recordings of participants responding to open-ended questions. Participants were given up to 3 min to respond to each question.
Participants’ videos were manually reviewed, and were approved if their videos met a minimum quality standard. For approval, a participant video needed to clearly show the participant’s face, contain discernible speech, and contain a minimum of 50 spoken words throughout their entire session.
The questions for the video-based sections of the survey were modeled on the PHQ-2 and GAD-2 questionnaires. The questions were modified to encourage open-ended responses, prompting participants to tell descriptive stories about their experiences over the course of the past two weeks. A general question that did not specifically ask about anxiety or depression was also included, with the intent to predict both depression and anxiety from a single question.
The questions were given in the following order:
- - One general video question
- - Nine multiple choice questions (PHQ-9)
- - Two open-ended video responses related to depression
- - Seven multiple choice questions (GAD-7)
- - Two open-ended video responses related to anxiety
The initial dataset included a total of 1149 participants that responded. The total number of participants after manual review was 955, with 194 participants being rejected for not meeting the minimum quality standards described above. A total of 4775 videos were used in the final dataset. This included a total of 61.1 h of video with 533,403 words (an average of 579 words per participant).
Models were trained with five-fold cross validation stratified by the maximum severity bucket of each participant, to ensure that each fold had an equal balance of all severity levels of scores. The survey was re-administered 7 months later to generate a validation set that was temporally distinct from the initial survey; this dataset included a total of 337 participants, 1685 videos and 308,243 words. Videos were then transcribed, audio was extracted into waveforms, and images of facial features were processed.
3.1.1. Score Distribution
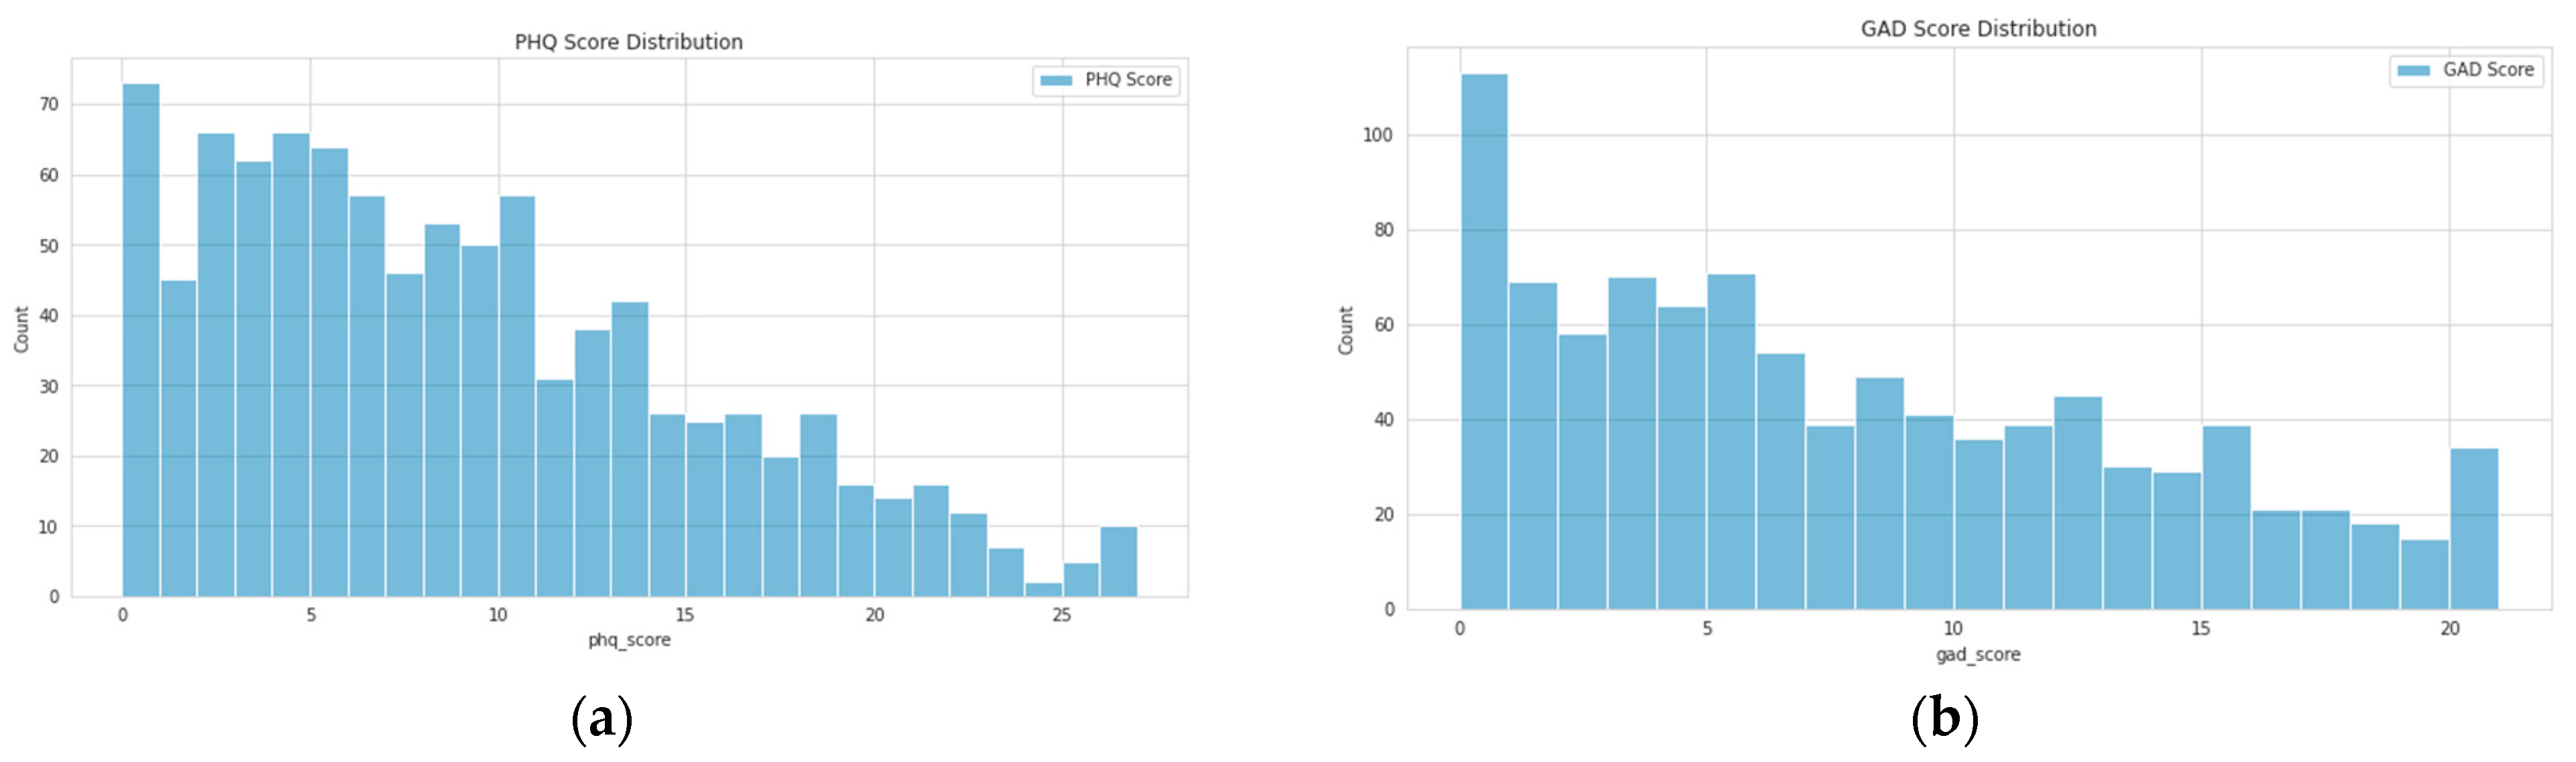
As is common in depression and anxiety datasets, a strong class imbalance was evident as we can see in the score distributions shown in Figure 1. A variety of approaches were used to address the imbalance, such as label weighting, oversampling, etc. However, the most effective approach was simply to ensure that folds were carefully split to contain an equal distribution of all scores.
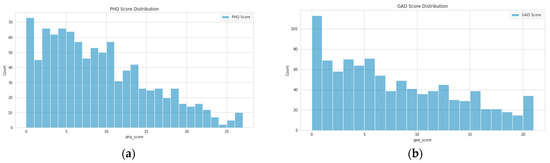
Figure 1.
Distribution of scores for all participants included in the analysis: (a) PHQ-9 scores; (b) GAD-7 scores.
3.1.2. Demographics Distribution
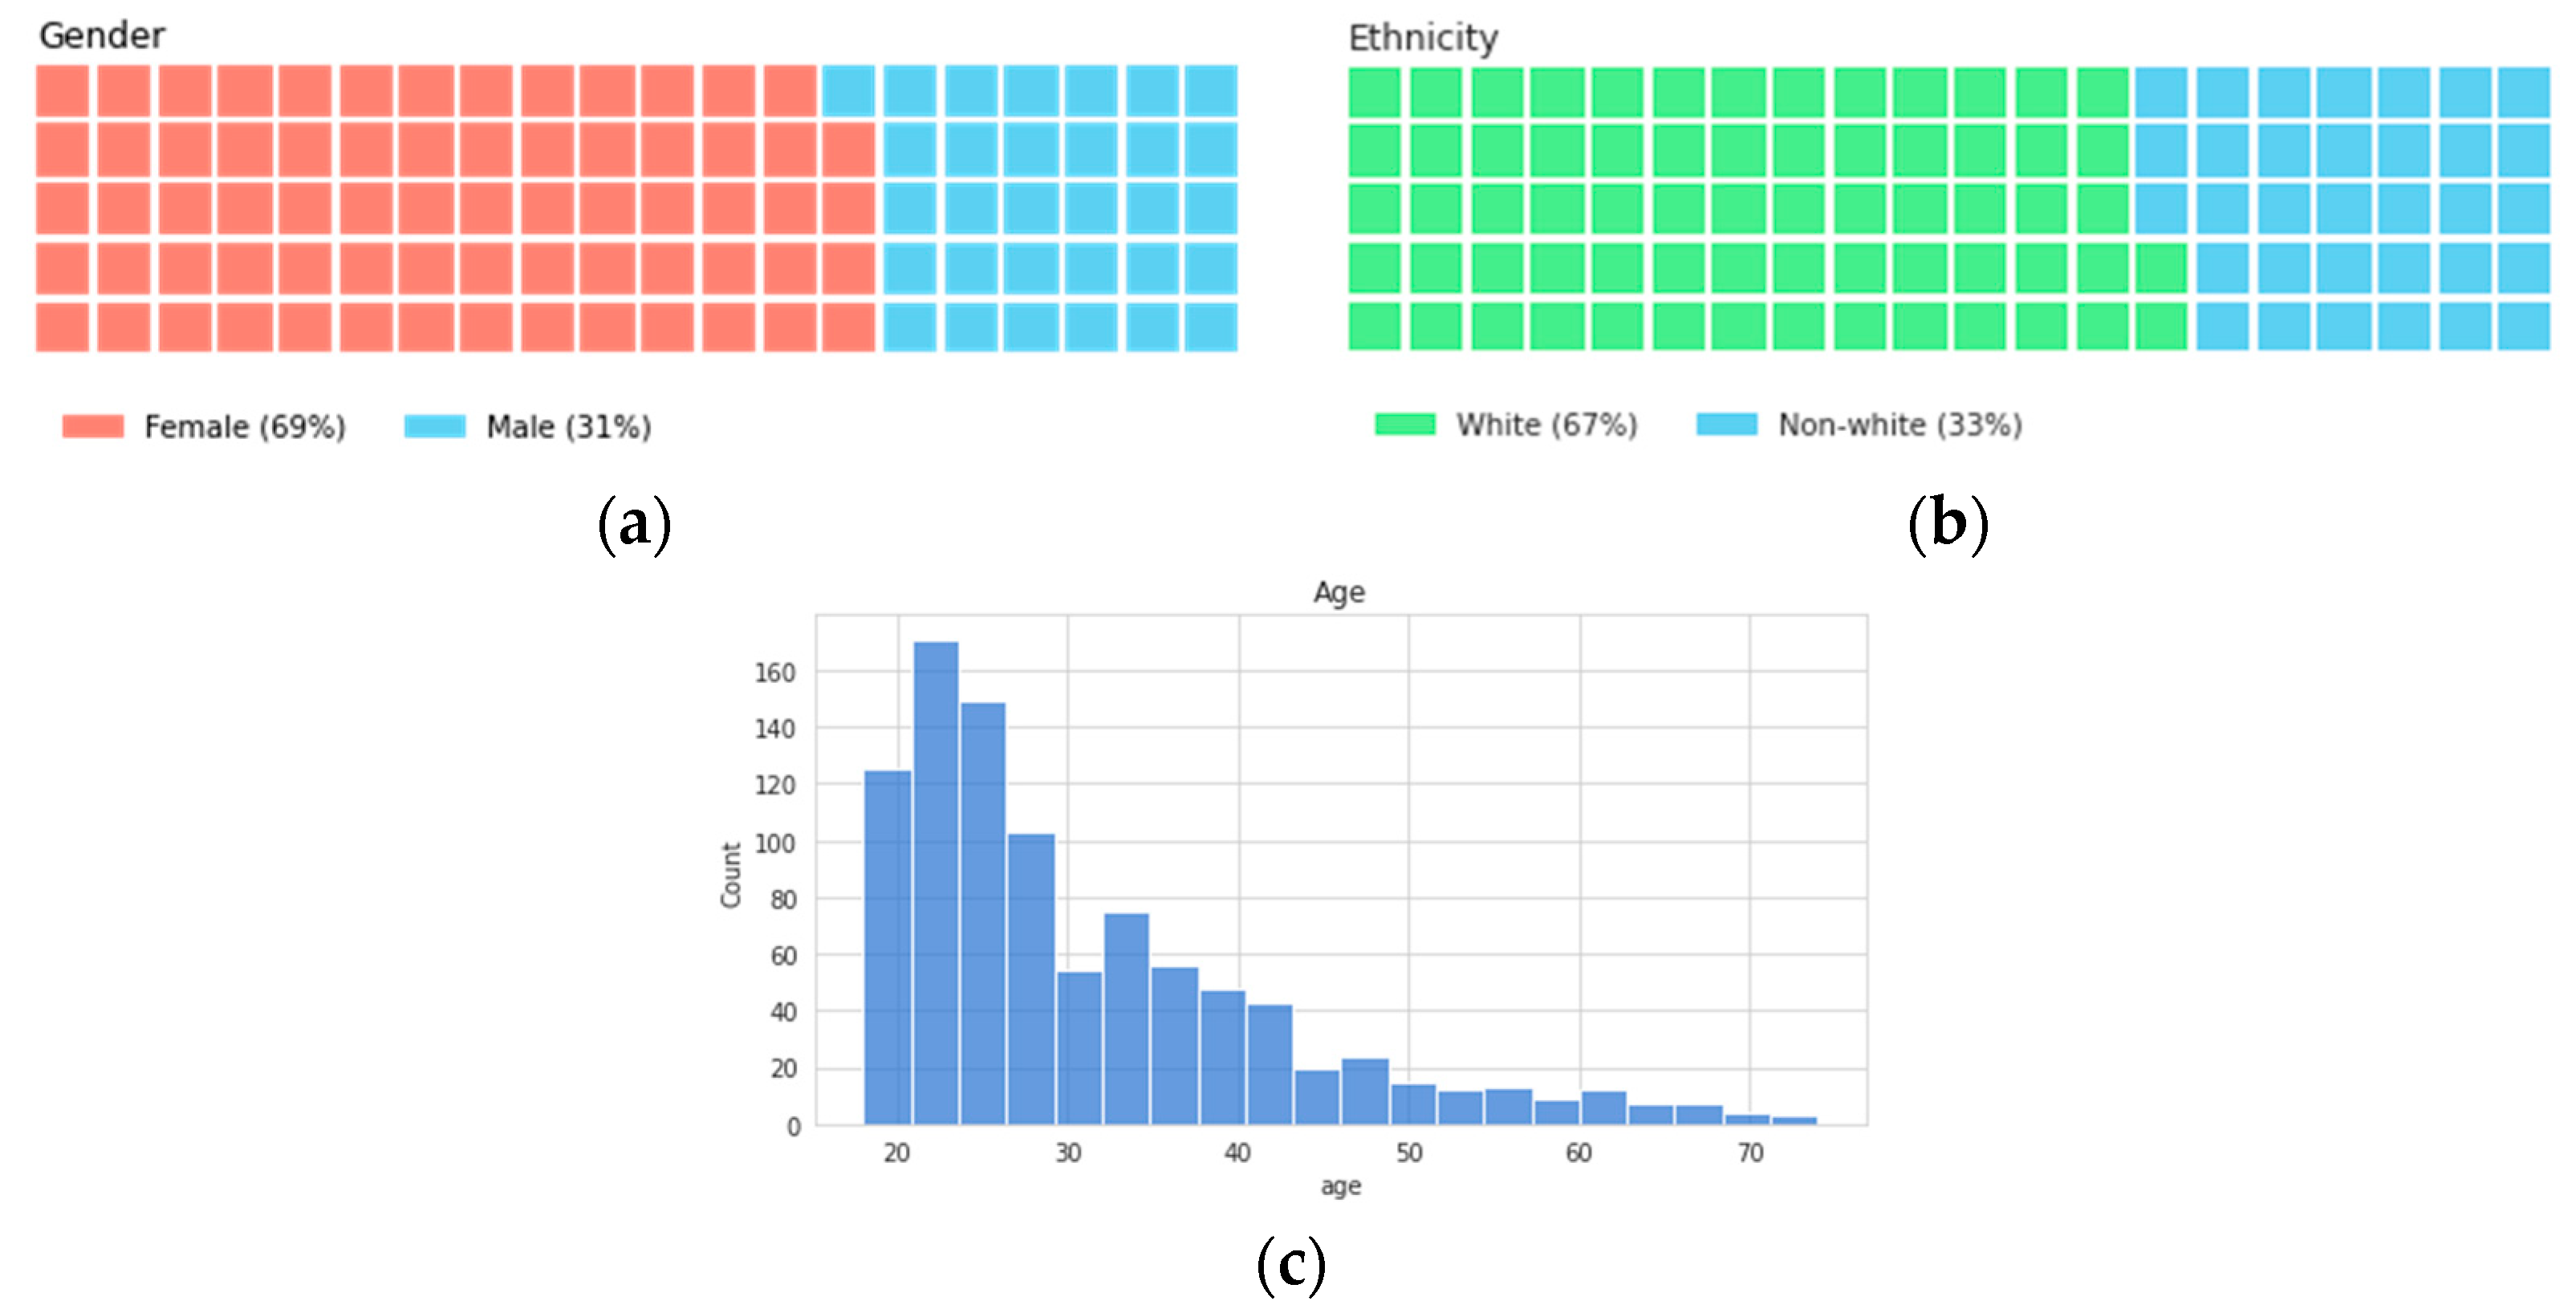
The diversity of the dataset was evaluated using self-reported measures. The final distribution of participants by gender was 69% female, 31% male, and by ethnicity 67% white, 33% non-white. It can be seen below that the age distribution was skewed toward 20 year-olds, but contained participants up to 75 years of age. These distributions can be seen in Figure 2. The models were also evaluated to determine any adverse impact towards each group, as described in Section 4 below.

Figure 2.
Distribution of participants by (a) gender, (b) ethnicity, and (c) age.
3.2. Model Architecture
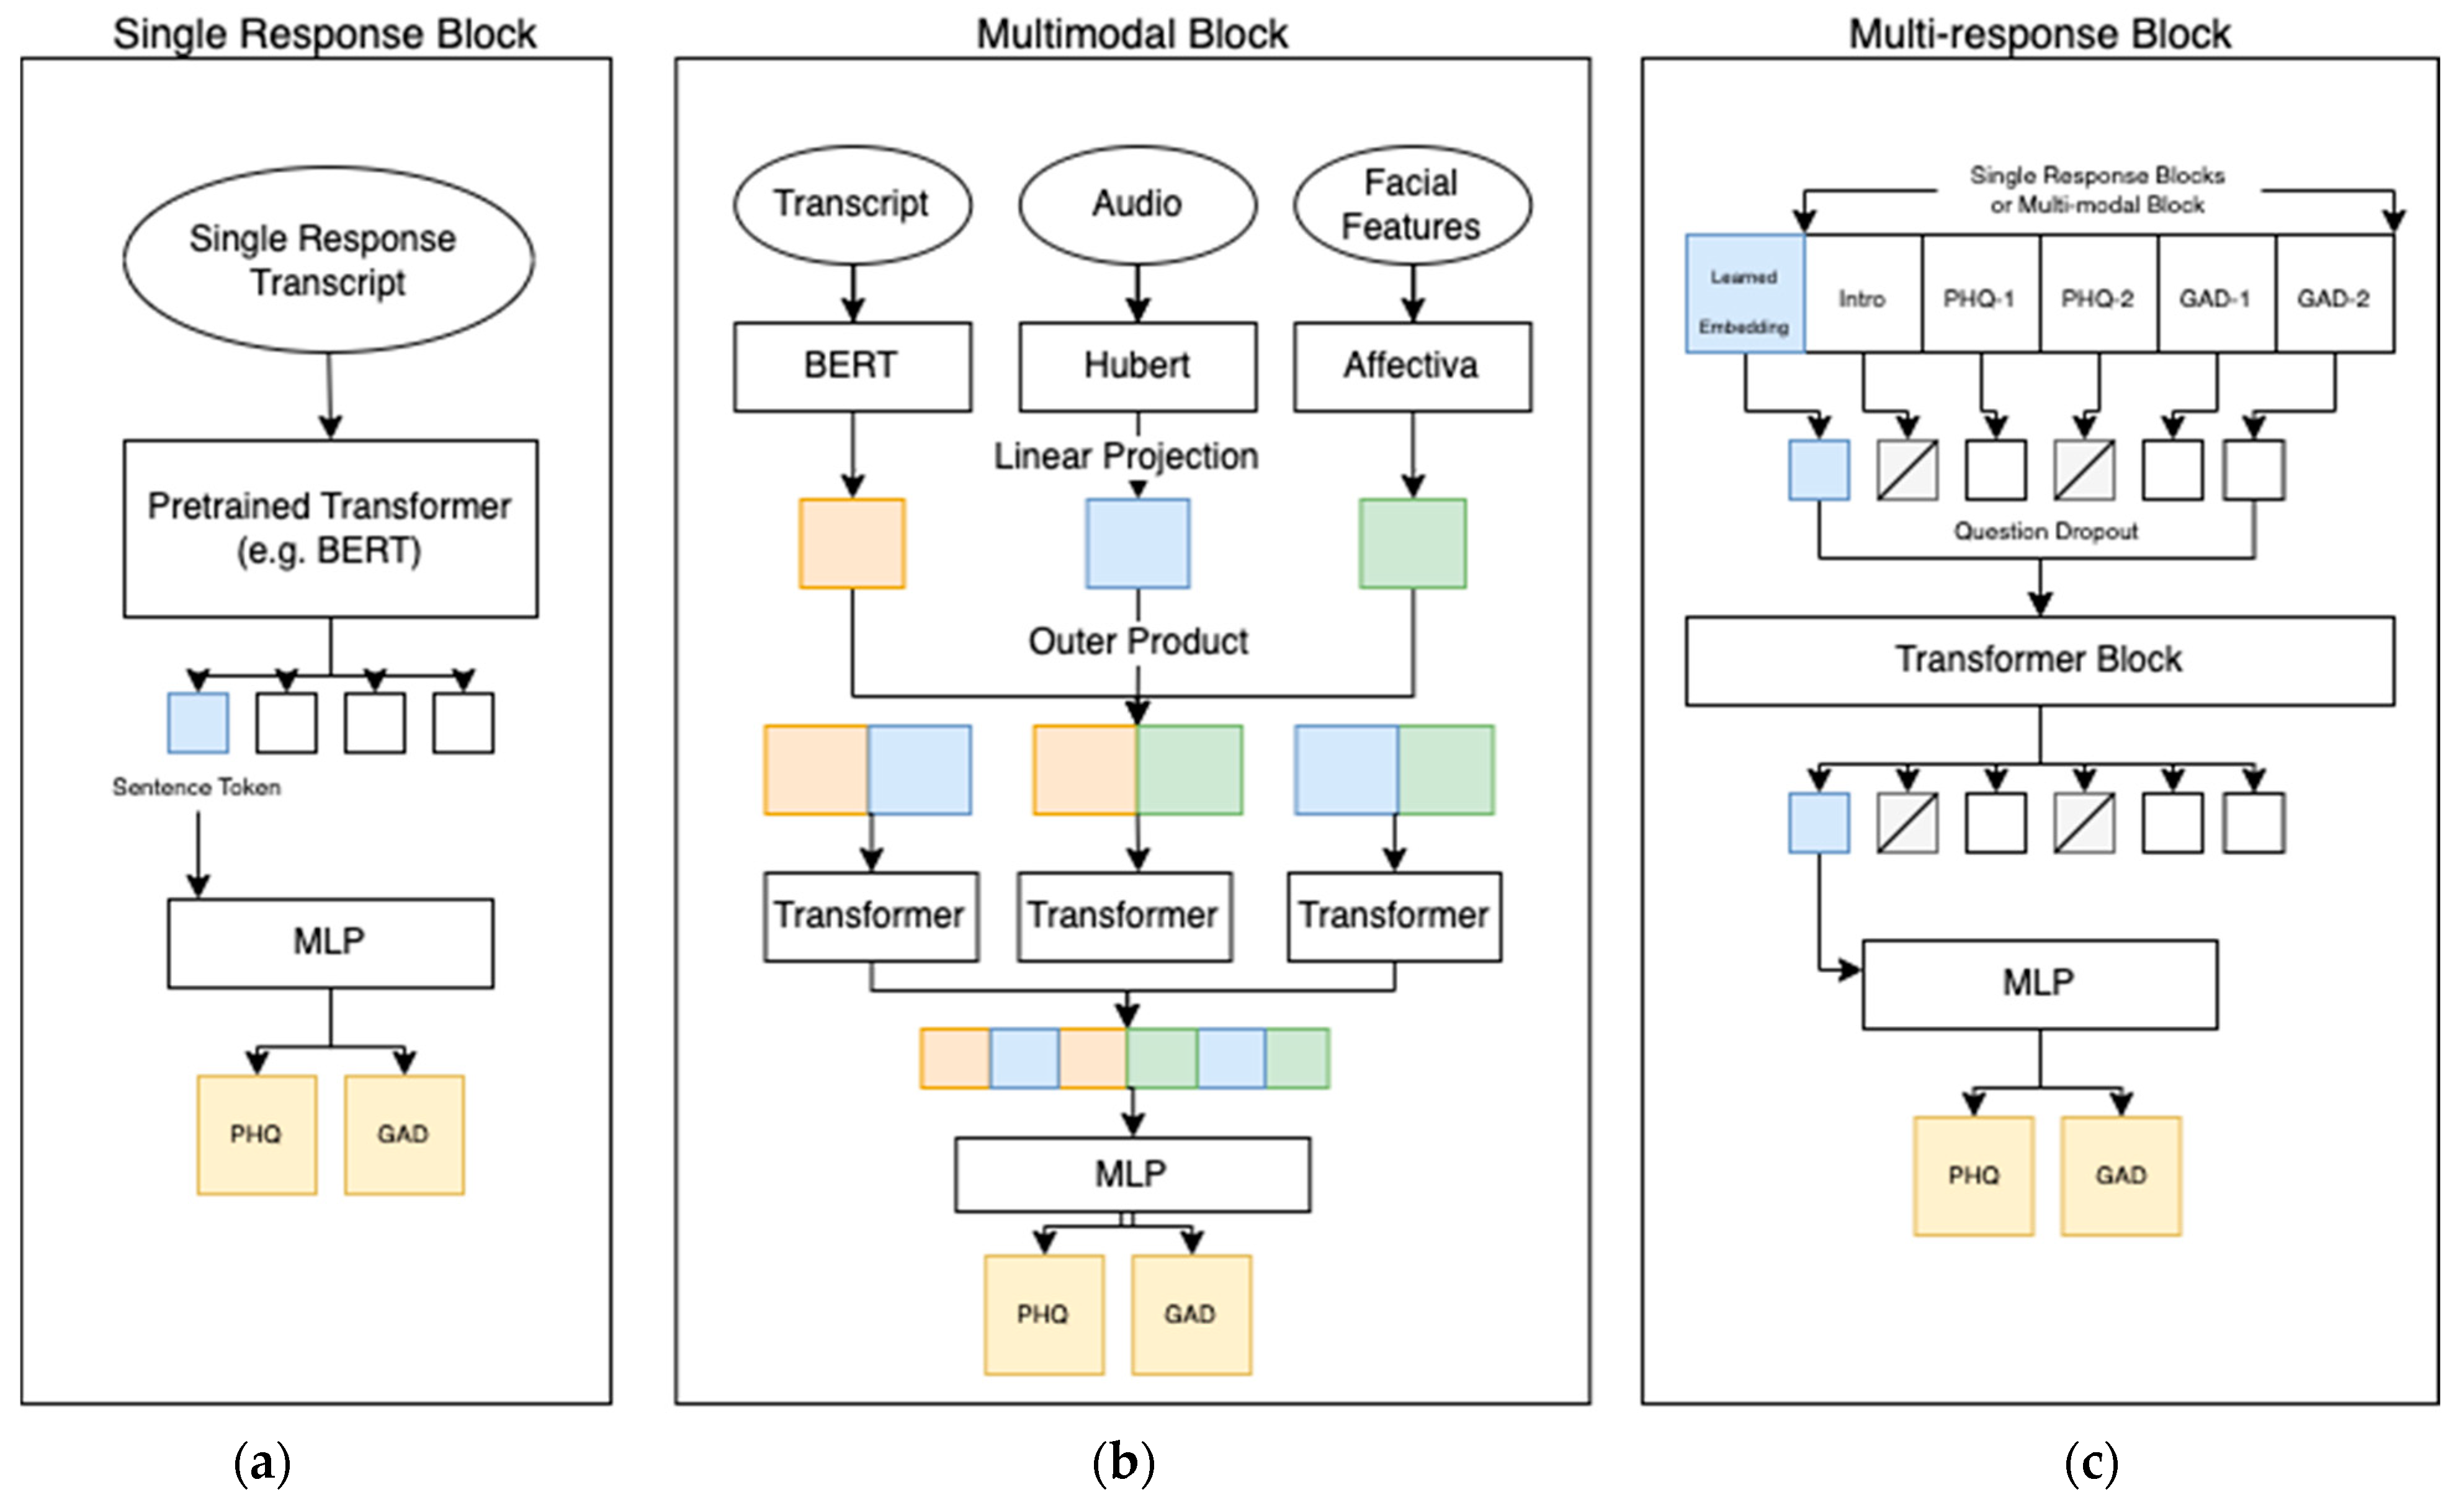
The PHQ-V and GAD-V models consisted of a single response block, a multimodal block, and a multi-response block, as can be seen in Figure 3. These three blocks were established to address the problem of combining five different video questions over three different modalities to provide two scores per participant. The single response block was responsible for scoring a single question, the multimodal block for combining modalities, and the multi-response block for combining multiple questions. Section 4 compares the scores from a few experiments that used slightly different architectures; the differences were as follows:

Figure 3.
Model architecture of the final PHQ-V and GAD-V model consisting of three different parts: (a) A single response block which finely tuned a pre-trained transformer; (b) a multimodal block which combines multiple single response blocks using a self-attention transformer block; and (c) a multi-response block which combines multiple questions and uses a self-attention transformer combined with question dropout. The final PHQ/GAD layer shows that scores can be assessed at any of the three blocks, or the embeddings can be passed down to further blocks allowing comparison of scores at different levels of abstraction.
- Single Question/Single Modality. A modality-specific input is passed to the single response block, and scores are returned directly from it.
- Single Question/All Combined. All three modality inputs are passed to the multimodal block, the scores are returned directly.
- Multiple Question/Single Modality. A modality specific input is passed to the single response block, and output embeddings are then used as the input to the multi-response block (one per question). Scores are returned from the multi-response block.
- Multiple Questions/All Combined. All three modalities are passed to the multimodal block and the output embeddings are then used as input to the multi-response block (one per question). Scores are returned from the multi-response block.
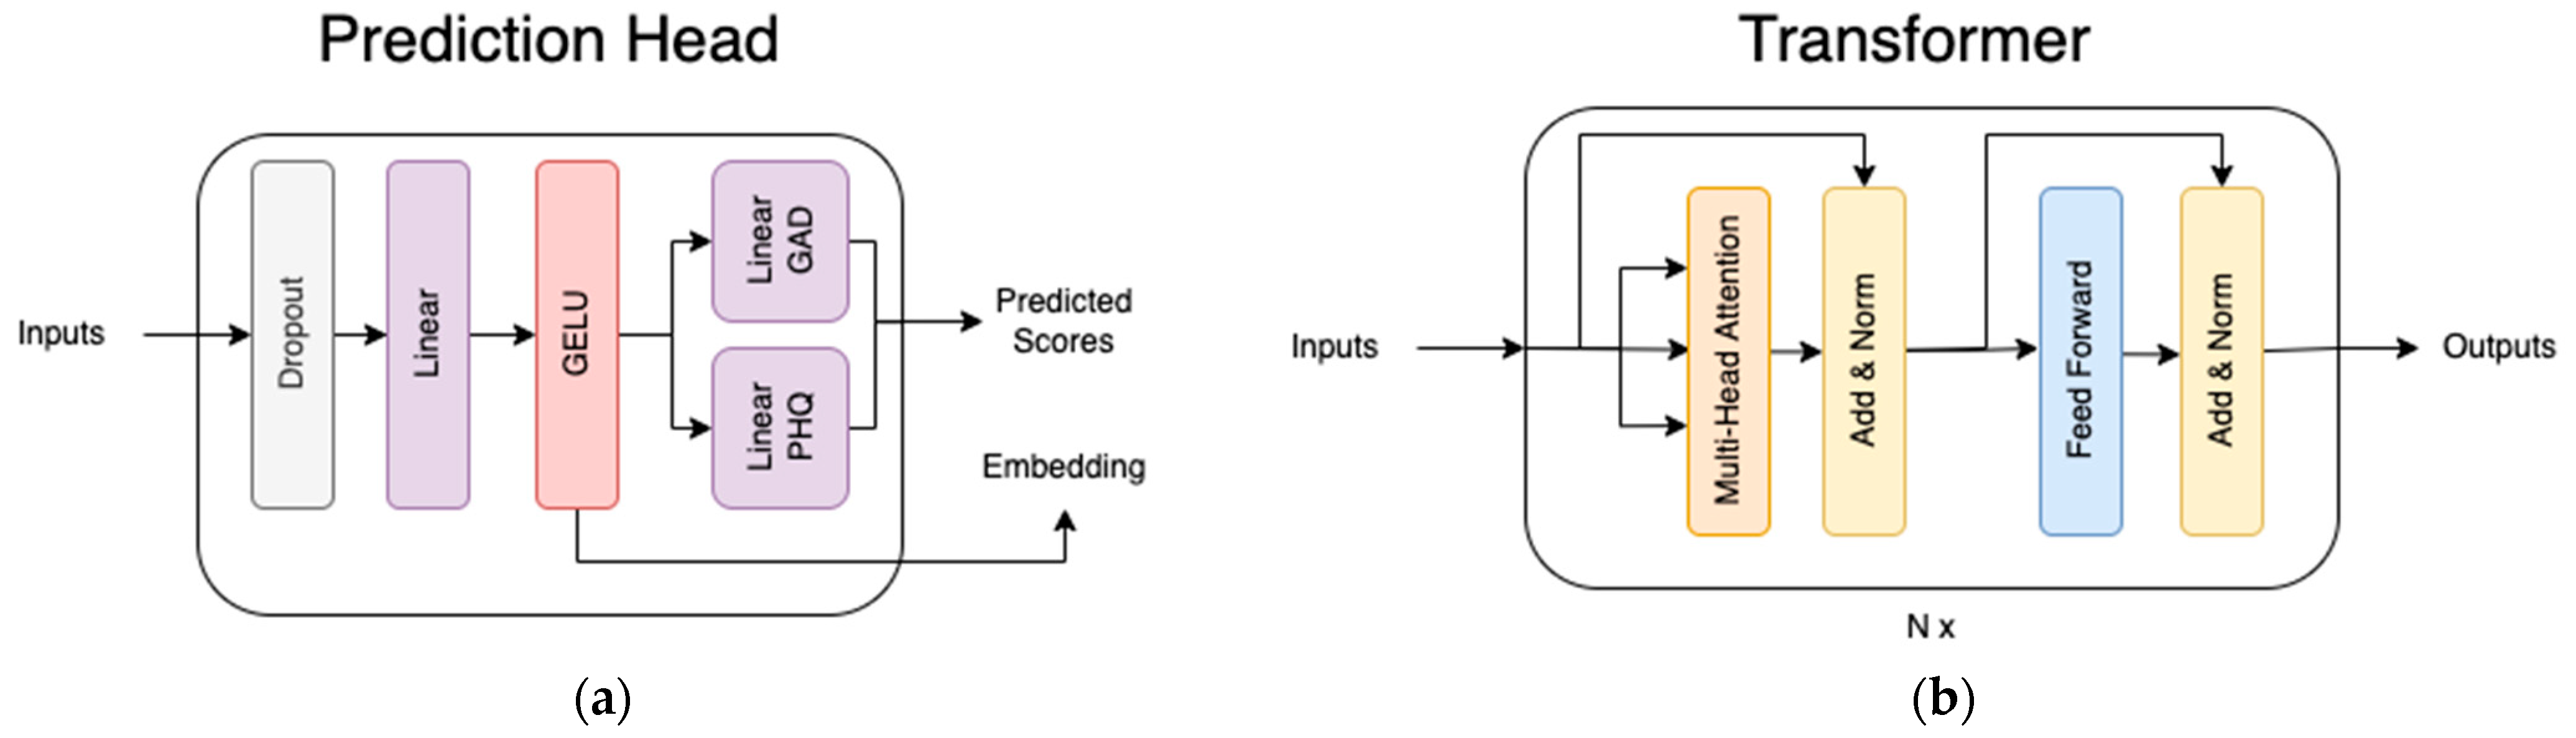
The use of a transformer block is referenced; in all cases where this is mentioned it refers to the encoder half of the transformer as described previously [9] and shown in Figure 4. In general, pre-trained transformers were utilized for the first module in this research because they have been shown to be highly effective for transfer learning [11], and indeed they returned strong results for this dataset. The downstream transformer encoder blocks were not pre-trained and were found to be more effective than concatenating class embeddings, especially where full questions were omitted. This is likely due to the attention mechanism’s ability to mask certain tokens. Also shown in Figure 4 is the prediction head block, which is a simple feed-forward network that takes the final class embeddings to predict the PHQ-9 and GAD-7 scores. Below, the three main blocks are discussed in further detail.
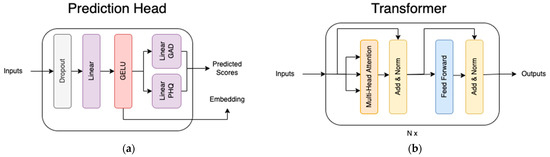
Figure 4.
The structure of the two blocks used in the model: (a) The prediction head, which takes embeddings from upstream models and produces scores; (b) the transformer encoder block described in [9].
3.2.1. Single Response Block
The single response block takes a single modality from a single response and passes it through a transformer network. The inputs to this network include tokenized text, raw audio, or pre-processed Affectiva features, depending on the modality being trained. We utilized Affectiva in our model to provide a set of 44 features that tracked facial position, emotional response, and facial action units. For text, the transformer network was the pre-trained “paraphrase-distilroberta-base-v2” model [29] from huggingface, for audio it was the pre-trained “facebook/hubert-large-ll60 k” model [12] from huggingface, and for video it was a previously untrained model consisting of a simple network: a linear projection -> relu -> layer norm -> two transformer blocks. For audio and video, a learned embedding was concatenated to the beginning of the sequence (before being passed through any transformer blocks), while for text the sentence token was used. These tokens are referred to as class tokens in Figure 4 and throughout this research.
The class token of the result was then run through the prediction head (see Figure 4), for the purpose of learning to predict survey scores. All pre-trained models remained unfrozen, so that they could be changed throughout the training process. The model predicts both the actual score (i.e., total score) as well as the classification bucket (i.e., depressed, not-depressed) for both PHQ-9 & GAD-7. A joint loss technique was used to optimize the mean absolute error (MAE) for regression logits and the cross-entropy loss for classification logits, by using a weighted sum of all sub-losses. Losses were scaled to give approximately equal weight to each loss even though they have different scales. Weights were as follows: phq mae = 0.11, gad mae = 0.15, phq cross entropy = 0.62, gad cross entropy = 0.72.
The main advantage of predicting scores straight from a single question is that the final model can predict scores for any individual question by itself, or can provide a rich embedding that can be combined downstream with other questions and modalities. This allows the use of the assessment with a single question or in combination with multiple questions, as in the multi-response block.
3.2.2. Multimodal Block
The multimodal block combines multiple different types of modalities. It takes transcripts, audio, and Affectiva facial features, and passes each of them through a separate single response block specific to that modality. A linear projection is applied to the output embeddings of each, in order to match embedding sizes. The embeddings from each of these are then concatenated and combined using a transformer block. Similar to the single response block, the class embeddings are then passed into the prediction head. One of the difficulties in combining features is that different modalities have different levels of predictive accuracy. Text features were found to be more valuable than audio and facial features by a significant margin, and audio features were more valuable than facial features. A few different fusion methods were investigated; more details are provided in Section 4. Ultimately, the choice was made to apply concatenation followed by a transformer block, which was the simplest, most effective approach.
3.2.3. Multi-Response Block
The multi-response block combines responses to the five questions. As input it can take embeddings either from five single response blocks or five multi-response blocks, depending on whether it is a single modality model or multimodal model. The multi-response block takes the embeddings produced by each of the upstream blocks and combines them using a transformer block. A learned embedding is prepended to the upstream embeddings, and is treated as a class token for prediction in the prediction head.
To enable the net to learn on any combination of questions, this work introduces a technique we call question dropout. Similar to a traditional dropout layer where some fraction of the neurons are ignored, question dropout randomly masks out an average of 50% of the responses at training time, while always ensuring at least one response is kept. This makes the model robust in cases where any number of the specified questions may be asked (even down to a single question). The multi-response block uses the same prediction head as both of the above blocks.
3.3. Hyperparameters & Compute
Hyperparameters were chosen by running cross-validation sweeps with five folds. The following parameters were selected as a result: Dropout of 0.1 for all dropout layers, a learning rate of 5 × 10⁻⁵, a batch size of 32 for single questions (16 for combined questions), and a question dropout rate of 0.5. The model was run for a total of eight epochs (for text) and 15 epochs (for audio/video/multimodal). All embedding sizes were maintained at 768 values throughout the model. The audio embedding size started at 1024, but was projected down to 768 to match text and video. The hidden size for intermediate layers in the prediction head and transformer were also kept at 768.
The models were trained on 2xA6000 GPUs. A single training fold took between 3 min and 12 min, depending on the number of questions and modalities included in the training process.
4. Results
4.1. Experiments
The model was trained multiple times to compare the values of single questions, multiple questions, and multiple modalities. Each modality was trained once on a single question, and included in a combined model with all modalities. The language-only model trained on all questions using a multi-response block was compared with a combined model.
Scores were measured on five folds, with care taken to ensure the same proportion of severity levels in each fold. The model was validated using two separate metrics, i.e., the area under the receiver operating characteristics curve (AUROC) for predicting a binary classification (depressed or not depressed), and the Pearson’s correlation coefficient (R Score) for detecting exact survey scores. All AUROC scores were binary measures where any score 10 or greater was labeled as a positive identification of depression or anxiety symptomatology.
Results are shown in Table 1, and show that language provided substantial predictive value. This aligns with expectations, since the language modality can most easily take advantage of the responses to the questions adapted from the PHQ-2 and GAD-2. Predictive value was also found in audio and facial expressions, with audio results less predictive than text, and facial expressions less than audio. It is hypothesized that some fraction of the value in text comes from the chosen questions, and future work is needed to determine how well text would perform when answering more general questions.

Table 1.
Experimental results for each modality for a single question (top rows) as well as all questions (bottom rows). Models are scored on the area under the receiver operating characteristics curve (AUC) when the model was scored as a classifier (positive cases when PHQ-9/GAD-7 scored ≥ 10), and Pearson correlation (R) when the model was scored as a regressor. Bold values show the best score in each column.
It is evident that moving from a single question to multiple questions also improved the accuracy of the model. This was expected, although the amount by which things were improved was less than anticipated. Nonetheless, the result implies that with even a single, well-worded open-ended question, reasonable predictions can be made.
Combining multiple modalities did not improve the performance of the model. Even though each modality itself showed predictive value, the combination was no better than the language-only version. This result is counterintuitive to expectations and is discussed further in the next section.
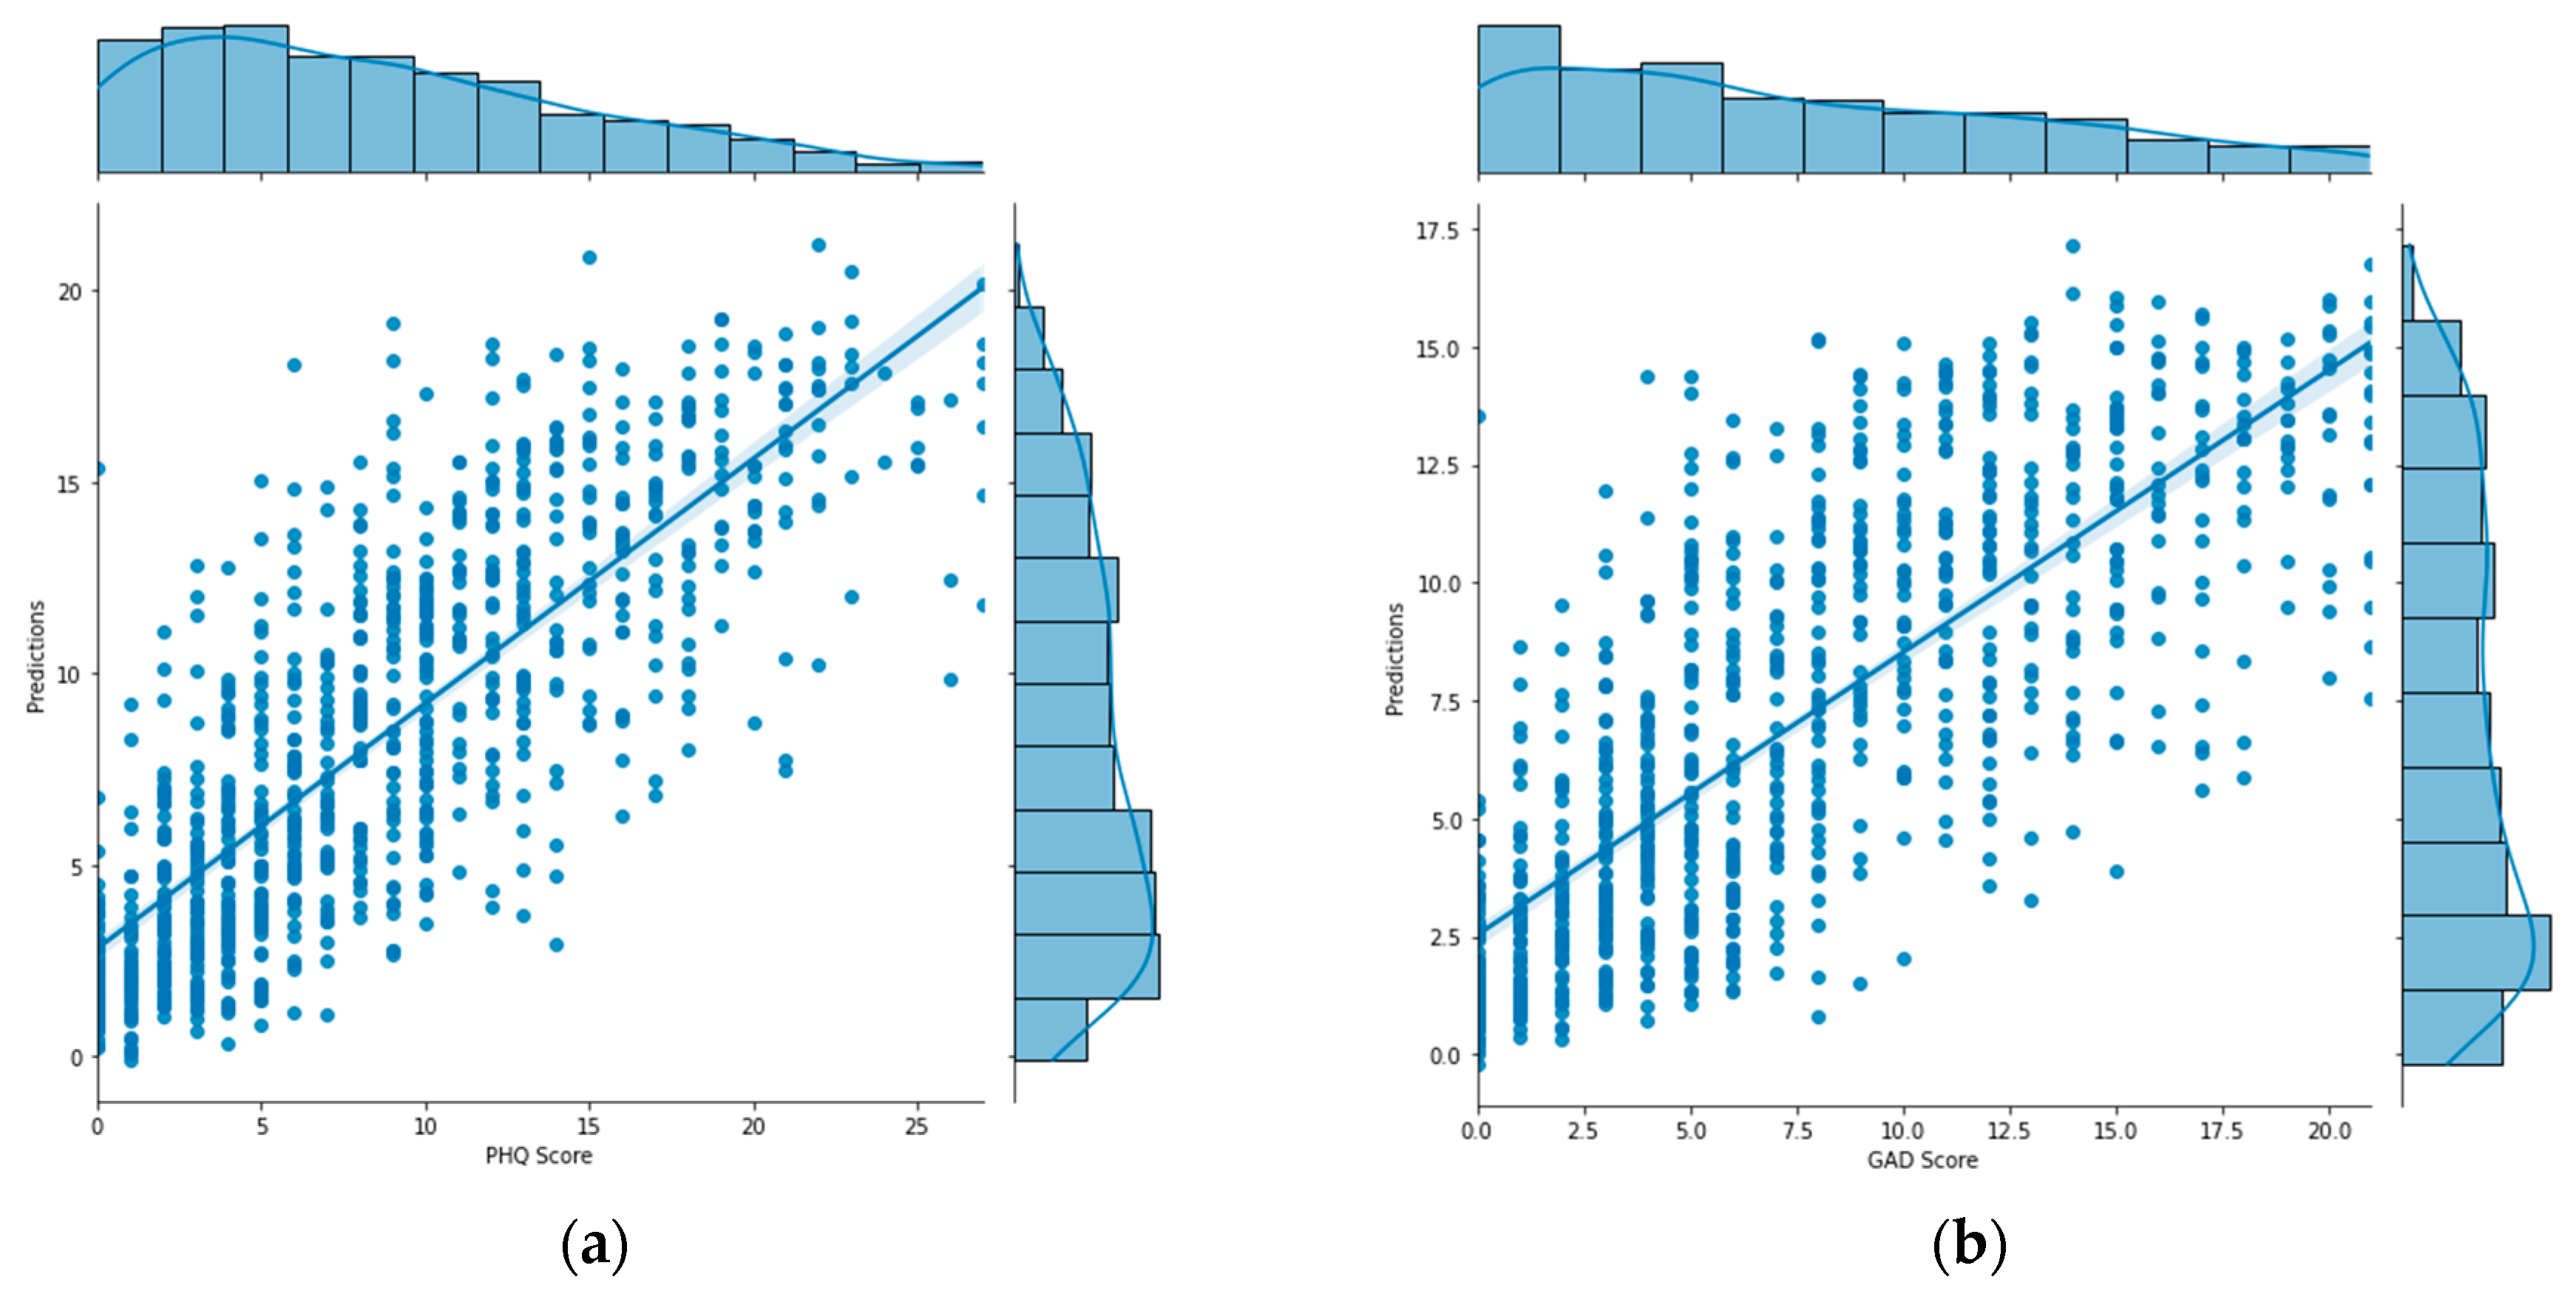
The final PHQ-V and GAD-V models use language alone because it provided similar value to the combined, but resulted in models being simpler to use and deploy. With an AUC score above a 0.90 for both PHQ-V and GAD-V and correlations above 0.80, these models were shown to strongly predict the traditional PHQ-9 and GAD-7 assessments. They offer a good replacement in cases where an asynchronous video assessment is more convenient than traditional multiple choice assessments. The Receiver Operating Characteristic (ROC) curve of the language only model is shown in Figure 5, demonstrating its strong performance as a classifier. And the distribution of scores plotted against their predictions are shown in Figure 6, showing its strong performance as a regressor.
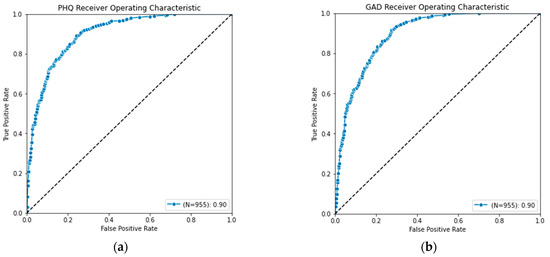
Figure 5.
Receiver operating characteristics curve for (a) PHQ-V predictions and (b) GAD-V predictions.

Figure 6.
Graph of (a) PHQ-V predictions and (b) GAD-V predictions (right) compared with values calculated from the PHQ-9 and GAD-7 assessments.
Multimodal
One of the most surprising results was that combining different modalities did not improve the model scores compared with using text alone. Previous research [34,38] has shown success with multimodal approaches, so similar results here may have been expected. Due to the surprising nature of that finding, several further experiments were run in an attempt to extract value from multimodal features. These experiments included:
- -
- Removing the transformer blocks and using simple concatenated embedding followed by the prediction head.
- -
- Using an outer product to combine features as suggested by [7].
- -
- Adding dropout at the concatenation layer as suggested by [42].
- -
- Using multiple pre-trained audio network variants including versions of wav2vec, wav2vec 2.0, and Hubert.
- -
- Weighting modalities with different learning rates and loss scales.
None of the above approaches provided additional value when combining modalities. One possible explanation for this discrepancy is the difference in datasets used. The dataset introduced in this research used questions adapted from the PHQ-9, which has been shown to be highly effective at detecting depression [43]. It is possible that the highly specific nature of these questions increases the value from text to the point where audio provides no additional value. That said, it is also possible that multimodal solutions are by nature difficult [38,42] and require finely crafted solutions that have not yet been found for this dataset. Further research is planned to investigate proposed solutions from [42], as well as using deep spectrum features instead of Hubert, as in [41].
One interesting note is that adding audio and video did increase the capacity of the network. The training loss of the multimodal model dropped quicker and stayed lower compared to text alone. Unfortunately, this added capacity does not appear to have generalized to the validation losses which remained nearly identical with or without the extra features. This agrees with findings [38] that adding extra modalities may make networks more prone to overfit. While the above approaches attempted to mitigate that overfitting, additional research is planned that will investigate other approaches to the problem.
4.2. Follow up Study
As mentioned above, follow-up investigation was performed 7 months after the initial study. The objective of this follow-up study was to identify a temporally distinct set of data to be used as a validation data set. One concern with the original dataset was that the study would not generalize over time; since the entire study was conducted during a single summer month, it was possible that seasonal topics would dominate the conversations. The follow up results, administered during the winter months, are shown in Table 2, and show the model did not overfit to a temporal component of the data. These models not only matched the previous cross-validated scores, but improved upon them. This was likely due to the fact that the follow-up study used a model trained on all the initial data, effectively giving it 20% more data to learn from (not needing to set aside 20% for each of the for folds). This 20% increase in data explains the moderate jump in quality between the initial study and the follow-up.
Table 2.
AUC and R scores for language modality comparing initial cross-validated scores with the follow up study.
4.3. Performance by Demographic
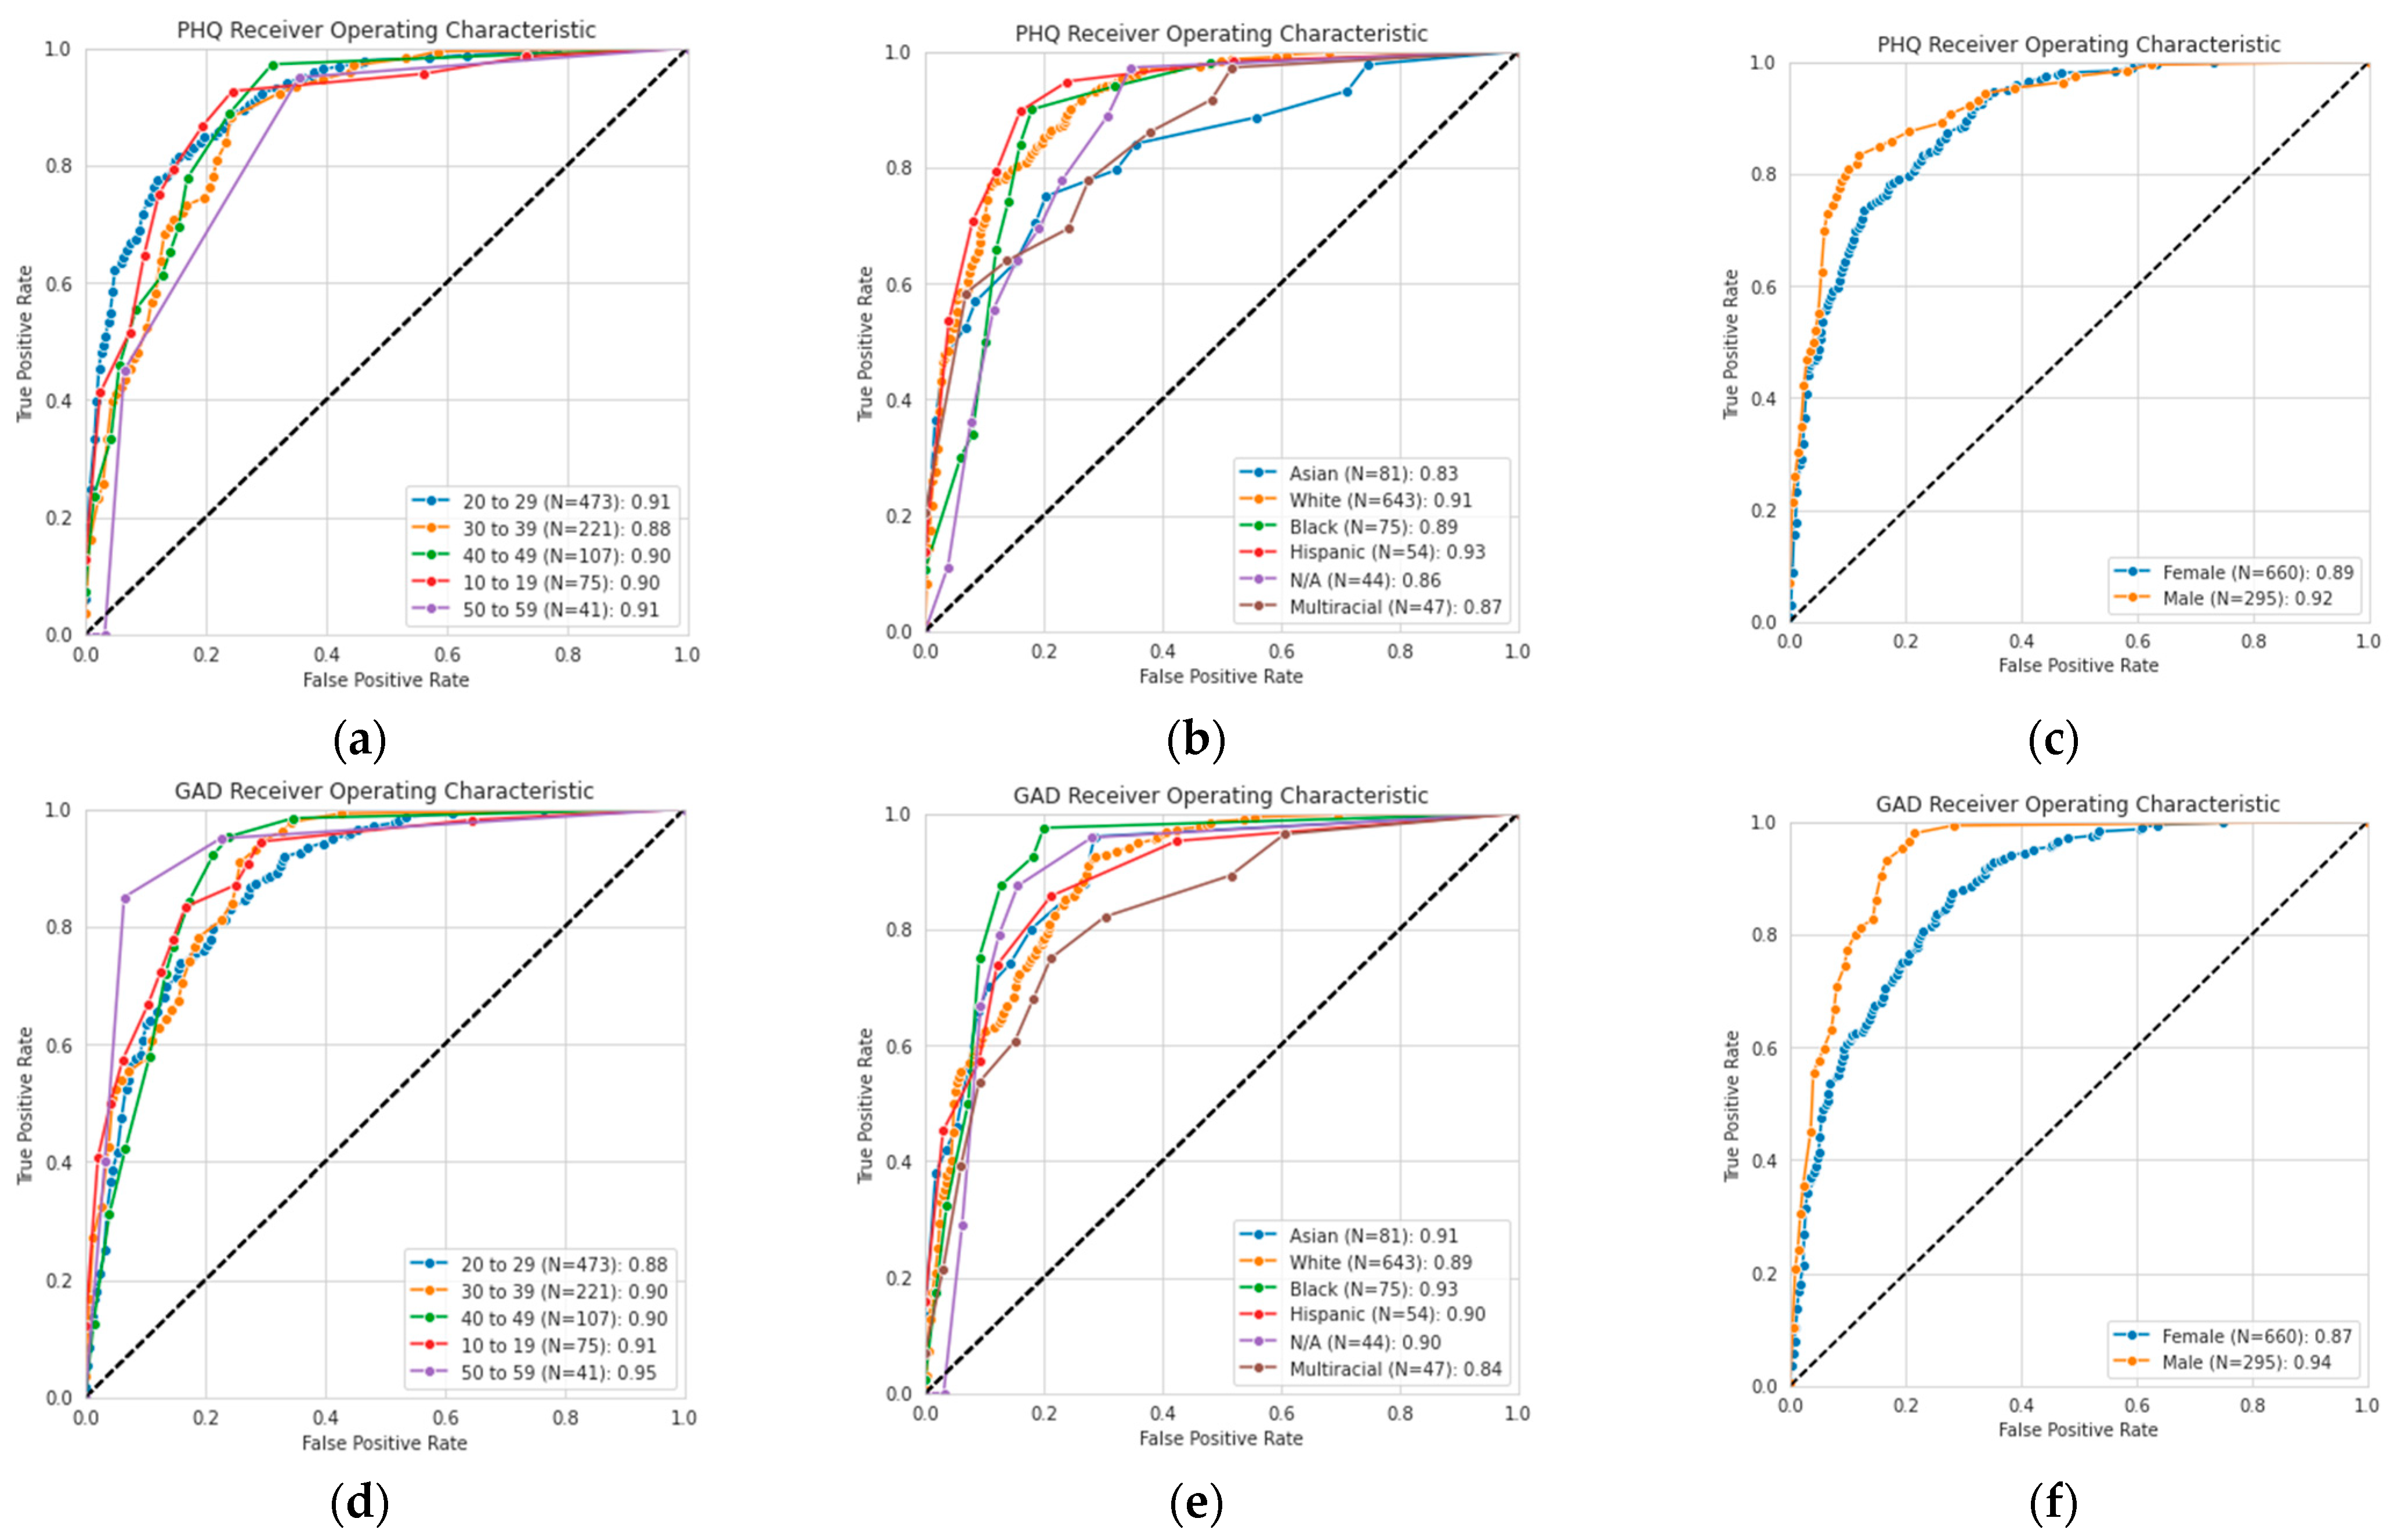
Research has shown that biases in the DAIC-WOZ dataset can cause skewed classification performance [44]. In an effort to ensure an unbiased dataset and reliable assessments, we considered the performance of the PHQ-V/GAD-V assessments, as shown in demographic slices in Figure 7. This figure shows AUROC curves for each of the demographic categories across age, ethnicity, and gender. The curves show that high performance was maintained across all different demographic slices of the data, likely due to the diversity of the input dataset.
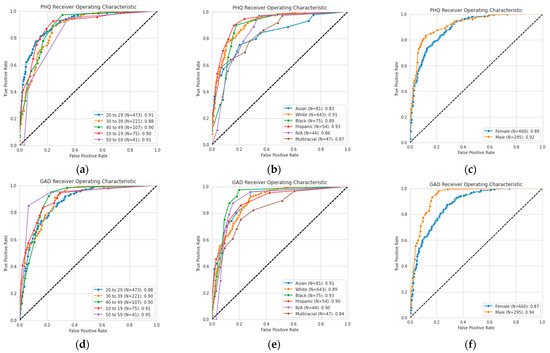
Figure 7.
Receiver operating characteristic (ROC) curves for self-reported (a) age, (b) ethnicity, and (c) gender for PHQ-V predictions, and (d) age, (e) ethnicity, and (f) gender for GAD-V predictions.
4.4. Error Cases
Videos were manually evaluated from the participants whose self-reported score differed most from their predicted score, and explanations for the error were labeled. In total, 31 participants were manually reviewed. Each manually evaluated case had errors of at least 7.5 points and all participants ended up falling into one of the four categories below.
4.4.1. Self-Labeling Mistakes (N = 16)
The most common category of error, accounting for over half of the errors analyzed, was for responses where the participant scored low on a traditional measure of depression or anxiety, but high on the PHQ-V and GAD-V measures. Upon review by an expert it was generally evident that the participant was indeed showing elevated levels of depression or anxiety, but they may not have noticed those signs within themselves. This is an advantage of the PHQ-V and GAD-V screenings, being able to pick up on risk signals that traditional methods may miss. One participant even noticed that their self-reported evaluation was probably underestimated when they stated: “It really does impact my life. Probably more than I realized, now sitting here thinking about it.”
4.4.2. Low Data Errors (N = 6)
The second error category was when participants did not elaborate sufficiently. These are cases where the model underestimated the severity, as the participant initially started to talk about problems in their life but in an effort to quickly finish the survey did not provide enough follow-up detail. While we included only participants with at least 50 total words spoken, more accurate results may require more spoken words. It awaits to be seen whether the model could determine its own confidence in the response and prompt participants to continue speaking when its confidence is insufficient.
4.4.3. Not Severe Enough (N = 6)
A small handful of errors were observed where the model labeled the participant with a moderate or moderately severe amount of anxiety or depression but the self-reported method labeled it as severe. In these cases, the participants gave plenty of details but the model underestimated the severity. These cases were not complete failures, as they were accurately labeled as showing signs of illness, but not severely enough. Our hypothesis is that this was due to the small numbers of participants in the severe brackets. Further research should be undertaken to investigate this further.
4.4.4. Unexplained Errors (N = 3)
Upon investigation, a small set of answers revealed no obvious cause for their failure. These were rare, and possibly could have been improved by increasing the dataset size. This hypothesis is strengthened by the fact that the model scores all increased in the follow-up study which utilized 20% more data. This implies that gathering more data would likely further improve the model and reduce the number of unexplained errors.
5. Discussion
5.1. Limitations
The main goal of this research was to build a drop-in replacement for PHQ-9 and GAD-7 assessments, using asynchronous video responses. While the results indicate that the PHQ-V and GAD-V assessments are a reasonable replacement for the PHQ-9 and GAD-7 models, they are only as useful as the original assessments. One limitation of this approach is that any deficiencies in the PHQ-9 and GAD-7 assessments are likely also to be propagated into these models. Also, due to the structured nature of the dataset, these machine-learning models should only be used with the exact question set described above. The dataset did not include any minors, and it is recommended these assessments are used only for adults. While these assessments may still be valid for minors, and may generalize beyond the above question set, this remains to be demonstrated in future research.
5.2. Future Work
One of the exciting findings of this research was that reasonable predictions could be made with as little as a single question. A goal for future work is to investigate this further, and determine the minimum amount of data required to provide an accurate assessment, as reducing assessment lengths could reduce usage friction and create an ever more seamless experience.
As stated above, the most surprising result of the data was the model’s lack of improvement when combining multiple modalities. Future work is planned which will investigate this further by examining different audio media including spectrograms, implementing various fusion techniques, and/or determining whether this result was an outcome of the dataset itself.
6. Conclusions
In conclusion, this study has introduced two new assessments, PHQ-V and GAD-V, that use open-ended video-based questions and transformer-based machine-learning models to effectively predict depression and anxiety. These assessments are a promising approach for accurately detecting mental disorders, and they provide a new source of data that has been unavailable in traditional assessments. The assessments were validated with a follow-up study that included more participants than many comparable studies had included in their training sets, with results that were promising for utilization in a broader context.
It was also shown that predictive value may exist within audio, text, and visual features and be accessible by pre-trained transformer models, but that further research is needed to determine how to combine these in an effective way. With as little as a single question, performant models can successfully be built, and increasing the number of questions likewise increases the model’s predictive ability. This opens up interesting questions regarding the construction of models in data-constrained environments, as well as regarding the potential for dynamic survey sessions.
The model’s errors were analyzed and evidence was found that the PHQ-V and GAD-V models, utilizing a convenient asynchronous video experience, may be able to detect signs of depression and anxiety in cases where traditional measures are unable, providing a drop-in replacement for traditional PHQ-9 and GAD-7 assessment.
Author Contributions
Conceptualization, L.L., B.T. and B.G. Methodology, software, validation, analysis and visualization, B.G.; data curation, L.L. and B.G.; writing–original draft preparation, B.G.; writing–review and editing L.L. and B.T. All authors have read and agreed to the published version of the manuscript.
Funding
This research received no external funding.
Institutional Review Board Statement
This research was determined by Advarra to be exempt under category 4 of 45 CFR 46.104.
Informed Consent Statement
Informed consent was obtained from all subjects involved in the study.
Data Availability Statement
The data presented in this study are available on request from the corresponding author. The data are not publicly available due to them containing information that could compromise participants’ privacy.
Conflicts of Interest
The authors declare no conflict of interest.
References
- Whiteford, H.A.; Degenhardt, L.; Rehm, J.; Baxter, A.J.; Ferrari, A.J.; Erskine, H.E.; Charlson, F.J.; Norman, R.E.; Flaxman, A.D.; Johns, N.; et al. Global Burden of Disease Attributable to Mental and Substance Use Disorders: Findings from the Global Burden of Disease Study 2010. Lancet 2013, 382, 1575–1586. [Google Scholar] [CrossRef]
- Fried, E.I.; Robinaugh, D.J. Systems All the Way down: Embracing Complexity in Mental Health Research. BMC Med. 2020, 18, 205. [Google Scholar] [CrossRef] [PubMed]
- Kroenke, K.; Spitzer, R.L. The PHQ-9: A New Depression Diagnostic and Severity Measure. Psychiatr. Ann. 2002, 32, 509–515. [Google Scholar] [CrossRef]
- Spitzer, R.L.; Kroenke, K.; Williams, J.B.W.; Löwe, B. A Brief Measure for Assessing Generalized Anxiety Disorder: The GAD-7. Arch. Intern. Med. 2006, 166, 1092. [Google Scholar] [CrossRef]
- Wang, J.; Zhang, L.; Liu, T.; Pan, W.; Hu, B.; Zhu, T. Acoustic Differences between Healthy and Depressed People: A Cross-Situation Study. BMC Psychiatry 2019, 19, 300. [Google Scholar] [CrossRef]
- Mundt, J.C.; Vogel, A.P.; Feltner, D.E.; Lenderking, W.R. Vocal Acoustic Biomarkers of Depression Severity and Treatment Response. Biol. Psychiatry 2012, 72, 580–587. [Google Scholar] [CrossRef]
- Wu, T.; Peng, J.; Zhang, W.; Zhang, H.; Ma, C.; Huang, Y. Video Sentiment Analysis with Bimodal Information-Augmented Multi-Head Attention. Knowl.-Based Syst. 2022, 235, 107676. [Google Scholar] [CrossRef]
- Scott, N.J.; Kramer, R.S.S.; Jones, A.L.; Ward, R. Facial Cues to Depressive Symptoms and Their Associated Personality Attributions. Psychiatry Res. 2013, 208, 47–53. [Google Scholar] [CrossRef]
- Vaswani, A.; Shazeer, N.; Parmar, N.; Uszkoreit, J.; Jones, L.; Gomez, A.N.; Kaiser, L.; Polosukhin, I. Attention Is All You Need. 2017. In Proceedings of the 31st International Conference on Neural Information Processing Systems (NIPS’17), San Diego, CA, USA, 4–9 December 2017; pp. 6000–6010. [Google Scholar]
- Spathis, D.; Perez-Pozuelo, I.; Marques-Fernandez, L.; Mascolo, C. Breaking Away from Labels: The Promise of Self-Supervised Machine Learning in Intelligent Health. Patterns 2022, 3, 100410. [Google Scholar] [CrossRef]
- Devlin, J.; Chang, M.-W.; Lee, K.; Toutanova, K. BERT: Pre-Training of Deep Bidirectional Transformers for Language Understanding. arXiv 2019, arXiv:1810.04805. [Google Scholar]
- Hsu, W.-N.; Bolte, B.; Tsai, Y.-H.H.; Lakhotia, K.; Salakhutdinov, R.; Mohamed, A. HuBERT: Self-Supervised Speech Representation Learning by Masked Prediction of Hidden Units. IEEE/ACM Trans. Audio Speech Lang. Process. 2021, 29, 3451–3460. [Google Scholar] [CrossRef]
- Zhong, Y.; Deng, W. Face Transformer for Recognition. arXiv 2021, arXiv:2103.14803. [Google Scholar]
- Xezonaki, D.; Paraskevopoulos, G.; Potamianos, A.; Narayanan, S. Affective Conditioning on Hierarchical Networks Applied to Depression Detection from Transcribed Clinical Interviews. arXiv 2020, arXiv:2006.08336. [Google Scholar]
- Sonnenschein, A.R.; Hofmann, S.G.; Ziegelmayer, T.; Lutz, W. Linguistic Analysis of Patients with Mood and Anxiety Disorders during Cognitive Behavioral Therapy. Cogn. Behav. Ther. 2018, 47, 315–327. [Google Scholar] [CrossRef] [PubMed]
- Hinzen, W. The Linguistics of Schizophrenia: Thought Disturbance as Language Pathology across Positive Symptoms. Front. Psychol. 2015, 6, 971. [Google Scholar] [CrossRef]
- Voleti, R.; Woolridge, S.; Liss, J.M.; Milanovic, M.; Bowie, C.R.; Berisha, V. Objective Assessment of Social Skills Using Automated Language Analysis for Identification of Schizophrenia and Bipolar Disorder. arXiv 2019, arXiv:1904.10622. [Google Scholar]
- Spruit, M.; Verkleij, S.; de Schepper, K.; Scheepers, F. Exploring Language Markers of Mental Health in Psychiatric Stories. Appl. Sci. 2022, 12, 2179. [Google Scholar] [CrossRef]
- Al-Mosaiwi, M.; Johnstone, T. In an Absolute State: Elevated Use of Absolutist Words Is a Marker Specific to Anxiety, Depression, and Suicidal Ideation. Clin. Psychol. Sci. 2018, 6, 529–542. [Google Scholar] [CrossRef]
- Pennebaker, J.W.; Mehl, M.R.; Niederhoffer, K.G. Psychological Aspects of Natural Language Use: Our Words, Our Selves. Annu. Rev. Psychol. 2003, 54, 547–577. [Google Scholar] [CrossRef]
- Hansen, L.; Zhang, Y.; Wolf, D.; Sechidis, K.; Ladegaard, N.; Fusaroli, R. A Generalizable Speech Emotion Recognition Model Reveals Depression and Remission. Acta Psychiatr. Scand. 2022, 145, 186–199. [Google Scholar] [CrossRef]
- Low, L.-S.A.; Maddage, N.C.; Lech, M.; Sheeber, L.; Allen, N. Influence of Acoustic Low-Level Descriptors in the Detection of Clinical Depression in Adolescents. In Proceedings of the 2010 IEEE International Conference on Acoustics, Speech and Signal Processing, Dallas, TX, USA, 14–19 March 2010; pp. 5154–5157. [Google Scholar]
- Cummins, N.; Epps, J.; Breakspear, M.; Goecke, R. An Investigation of Depressed Speech Detection: Features and Normalization. In Proceedings of the 12th Annual Conference of the International Speech Communication Association, Florence, Italy, 27–31 August 2011; ISCA: Grenoble, France, 2011. [Google Scholar]
- Simantiraki, O.; Charonyktakis, P.; Pampouchidou, A.; Tsiknakis, M.; Cooke, M. Glottal Source Features for Automatic Speech-Based Depression Assessment. In Proceedings of the Interspeech 2017, Stockholm, Sweden, 20–24 August 2017; ISCA: Grenoble, France, 2017; pp. 2700–2704. [Google Scholar]
- Venkataraman, D.; Parameswaran, N.S. Extraction of Facial Features for Depression Detection among Students. Int. J. Pure Appl. Math. 2018, 118, 455–463. [Google Scholar]
- Harati, S.; Crowell, A.; Huang, Y.; Mayberg, H.; Nemati, S. Classifying Depression Severity in Recovery From Major Depressive Disorder via Dynamic Facial Features. IEEE J. Biomed. Health Inform. 2020, 24, 815–824. [Google Scholar] [CrossRef] [PubMed]
- Senechal, T.; McDuff, D.; Kaliouby, R. Facial Action Unit Detection Using Active Learning and an Efficient Non-Linear Kernel Approximation. In Proceedings of the 2015 IEEE International Conference on Computer Vision Workshop (ICCVW), Santiago, Chile, 7–13 December 2015; pp. 10–18. [Google Scholar]
- Arnab, A.; Dehghani, M.; Heigold, G.; Sun, C.; Lučić, M.; Schmid, C. ViViT: A Video Vision Transformer. In Proceedings of the IEEE/CVF International Conference on Computer Vision, Montreal, QC, Canada, 17 March 2021. [Google Scholar]
- Reimers, N.; Gurevych, I. Sentence-BERT: Sentence Embeddings Using Siamese BERT-Networks. arXiv 2019, arXiv:1908.10084. [Google Scholar]
- Zhuang, F.; Qi, Z.; Duan, K.; Xi, D.; Zhu, Y.; Zhu, H.; Xiong, H.; He, Q. A Comprehensive Survey on Transfer Learning. IEEE 2020, 109, 43–76. [Google Scholar] [CrossRef]
- Schneider, S.; Baevski, A.; Collobert, R.; Auli, M. Wav2vec: Unsupervised Pre-Training for Speech Recognition. arXiv 2019, arXiv:1904.05862. [Google Scholar]
- Dosovitskiy, A.; Beyer, L.; Kolesnikov, A.; Weissenborn, D.; Zhai, X.; Unterthiner, T.; Dehghani, M.; Minderer, M.; Heigold, G.; Gelly, S.; et al. An Image Is Worth 16x16 Words: Transformers for Image Recognition at Scale. arXiv 2021, arXiv:2010.11929. [Google Scholar]
- Wang, Y.; Boumadane, A.; Heba, A. A Fine-Tuned Wav2vec 2.0/HuBERT Benchmark For Speech Emotion Recognition, Speaker Verification and Spoken Language Understanding. arXiv 2022, arXiv:2111.02735. [Google Scholar]
- El-Ramly, M.; Abu-Elyazid, H.; Mo’men, Y.; Alshaer, G.; Adib, N.; Eldeen, K.A.; El-Shazly, M. CairoDep: Detecting Depression in Arabic Posts Using BERT Transformers. In Proceedings of the 2021 Tenth International Conference on Intelligent Computing and Information Systems (ICICIS), Cairo, Egypt, 5–7 December 2021; pp. 207–212. [Google Scholar]
- Zeberga, K.; Attique, M.; Shah, B.; Ali, F.; Jembre, Y.Z.; Chung, T.-S. A Novel Text Mining Approach for Mental Health Prediction Using Bi-LSTM and BERT Model. Comput. Intell. Neurosci. 2022, 2022, 7893775. [Google Scholar] [CrossRef]
- Malviya, K.; Roy, B.; Saritha, S. A Transformers Approach to Detect Depression in Social Media. In Proceedings of the 2021 International Conference on Artificial Intelligence and Smart Systems (ICAIS), Coimbatore, India, 25–27 March 2021; pp. 718–723. [Google Scholar]
- Al Hanai, T.; Ghassemi, M.; Glass, J. Detecting Depression with Audio/Text Sequence Modeling of Interviews. In Proceedings of the Interspeech 2018, Hyderabad, India, 2–6 September 2018; ISCA: Grenoble, France, 2018; pp. 1716–1720. [Google Scholar]
- Shen, Y.; Yang, H.; Lin, L. Automatic Depression Detection: An Emotional Audio-Textual Corpus and a GRU/BiLSTM-Based Model. In Proceedings of the ICASSP 2022—2022 IEEE International Conference on Acoustics, Speech and Signal Processing (ICASSP), Singapore, 23–27 May 2022. [Google Scholar]
- Gratch, J.; Artstein, R.; Lucas, G.M.; Stratou, G.; Scherer, S.; Nazarian, A.; Wood, R.; Boberg, J.; DeVault, D.; Marsella, S.; et al. The Distress Analysis Interview Corpus of Human and Computer Interviews; LREC: Baton Rouge, LA, USA, 2014. [Google Scholar]
- Alghowinem, S.; Goecke, R.; Wagner, M.; Epps, J.; Hyett, M.; Parker, G.; Breakspear, M. Multimodal Depression Detection: Fusion Analysis of Paralinguistic, Head Pose and Eye Gaze Behaviors. IEEE Trans. Affect. Comput. 2018, 9, 478–490. [Google Scholar] [CrossRef]
- Rodrigues Makiuchi, M.; Warnita, T.; Uto, K.; Shinoda, K. Multimodal Fusion of BERT-CNN and Gated CNN Representations for Depression Detection. In Proceedings of the 9th International on Audio/Visual Emotion Challenge and Workshop—AVEC ’19, Nice, France, 21 October 2019; ACM Press: Nice, France, 2019; pp. 55–63. [Google Scholar]
- Wang, W.; Tran, D.; Feiszli, M. What Makes Training Multi-Modal Classification Networks Hard? 2020. In Proceedings of the 2020 IEEE/CVF Conference on Computer Vision and Pattern Recognition (CVPR), Seattle, WA, USA, 13–19 June 2020; pp. 12692–12702. [Google Scholar] [CrossRef]
- Arroll, B.; Goodyear-Smith, F.; Crengle, S.; Gunn, J.; Kerse, N.; Fishman, T.; Falloon, K.; Hatcher, S. Validation of PHQ-2 and PHQ-9 to Screen for Major Depression in the Primary Care Population. Ann. Fam. Med. 2010, 8, 348–353. [Google Scholar] [CrossRef] [Green Version]
- Bailey, A.; Plumbley, M.D. Gender Bias in Depression Detection Using Audio Features. In Proceedings of the 2021 29th European Signal Processing Conference (EUSIPCO), Dublin, Ireland, 23–27 August 2021; pp. 596–600. [Google Scholar]

Publisher’s Note: MDPI stays neutral with regard to jurisdictional claims in published maps and institutional affiliations. |
© 2022 by the authors. Licensee MDPI, Basel, Switzerland. This article is an open access article distributed under the terms and conditions of the Creative Commons Attribution (CC BY) license (https://creativecommons.org/licenses/by/4.0/).