
Annotated-VocalSet: A Singing Voice Dataset


Department of Computer Science, Maynooth University, W23 F2H6 Maynooth, Co. Kildare, Ireland
*
Author to whom correspondence should be addressed.
Appl. Sci. 2022, 12(18), 9257; https://doi.org/10.3390/app12189257
Submission received: 5 August 2022
/
Revised: 2 September 2022
/
Accepted: 8 September 2022
/
Published: 15 September 2022
(This article belongs to the Special Issue Algorithmic Music and Sound Computing)
Abstract
:Featured Application
Some of the applications of this study are singing and notes alignment, singing and lyrics alignment, singing analysis, voice analysis, singing assessment, singing information retrieval, evaluating pitch detection algorithms, evaluating note extraction algorithms, evaluating onset detection algorithms, score following, and evaluating pitch contour smoother algorithms.
Abstract
There are insufficient datasets of singing files that are adequately annotated. One of the available datasets that includes a variety of vocal techniques (n = 17) and several singers (m = 20) with several WAV files (p = 3560) is the VocalSet dataset. However, although several categories, including techniques, singers, tempo, and loudness, are in the dataset, they are not annotated. Therefore, this study aims to annotate VocalSet to make it a more powerful dataset for researchers. The annotations generated for the VocalSet audio files include fundamental frequency contour, note onset, note offset, the transition between notes, note F0, note duration, Midi pitch, and lyrics. This paper describes the generated dataset and explains our approaches to creating and testing the annotations. Moreover, four different methods to define the onset/offset are compared.
1. Introduction
Datasets are fundamental for understanding data. Gathering an adequate store of data is the primary step before considering the development of signal processing or machine learning analytical tools for audio. Despite there being a shortage of singing datasets, recently, several singing datasets, such as [1,2,3,4,5], have been published. However, many more datasets are needed representing different categories, such as techniques, genres, countries, traditions, and languages.
One recently released dataset that covers a wide range of singing techniques and expressions is VocalSet [6]. This dataset consists of 3560 WAV files that altogether are more than 10 h long. Nine female and eleven male professional singers have been recorded singing arpeggios, scales, long tones, and melodic excerpts. The three music excerpts were 1—Row, Row, Row Your Boat, 2—Caro Mio Ben, and 3—Dona Nobis Pacem. Seventeen singing techniques, such as fast, articulated forte, and breathy voice, were used. In addition, all the singers recorded the “Row, Row, Row Your Boat” song by speaking the words rhythmically instead of singing it. The VocalSet dataset is available online, and a detailed explanation of the dataset is reported in the paper by Wilkins et al. [6].
However, although the VocalSet offers a variety of audio files of singing, the notes sung by the singers were not annotated. Therefore, the original VocalSet is a suitable resource for evaluating machine learning algorithms for problems, such as singer classification, vowel classification, singing technique classification, and melody classification. Nevertheless, to use the VocalSet for other purposes, such as pitch detection, pitch contour smoothing, onset/offset estimation, note extraction, lyric estimation, and automatic transcription, it would be necessary to annotate it. Therefore, this study aims to annotate the original VocalSet to render it appropriate for the possible additional studies mentioned above. The annotations added to the VocalSet include the fundamental frequencies (F0), amplitude, onset, offset, transition, MIDI pitch, average/median F0 of each note, each note’s duration, and the lyric.
The following section reviews the related work, and Section 3 explains the approaches used to calculate the annotations and describes the Annotated-VocalSet. After that, Section 4 introduces and compares four methods of selecting the onset, offset, and transition positions. Finally, the paper will be closed with a conclusion in Section 5.
1.1. A Review on Published Vocal Datasets
Several singing datasets have been published and made available to researchers. Table 1 lists these singing datasets with their properties, such as the number of files, total duration, and annotations. As shown in Table 1, the Annotated-VocalSet dataset includes a broader range of annotations and singers than the other datasets. However, some of the other datasets include properties, such as the singer’s amateur status or whether they are currently studying, which the Annotated-VocalSet does not have.
1.2. A Review on Annotating Methods
This subsection reviews the other researchers’ approaches to annotating vocal datasets. Generally, there are three main approaches that they use for annotations: manual, automated, and semi-automated, as described in the following.
1.2.1. Manual Annotation
Some datasets, such as MIR-1K [7], iKala [14], Dzhambazov [18], and Erkomaishvili (except for the F0 annotation) [5], were annotated manually. To reduce human errors in creating annotations, some researchers, such as TONAS [8], after generating annotations by the first person, asked some experts to double-check the initial annotations. In addition, other researchers, such as the providers of the SVNote1 dataset [11,12], asked more than one person to generate manual annotations. The Erkomaishvili dataset [5] used Sonic Visualiser [20] to include the onset annotations manually. In addition, they added the musical scores along with the lyrics by hand with the aid of the software tools of Finale [21] and Sibelius [22].
1.2.2. Automatic Annotation
The fundamental frequencies in the MedleyDB dataset [15,16] were annotated with the PYIN algorithm [23].
To annotate the Choral Singing dataset [3], they used the spectral autocorrelation (SAC) method proposed by Villavicencio et al. [24] to estimate F0, and they mentioned that the result of the SAC method contained some errors. Therefore, to calculate the mean of the notes’ pitch frequencies, they considered a threshold on the F0 values obtained for each note before computing the average. The threshold was set to 60 cents to reduce the effect of outliers. Moreover, they used a Python library, pretty_midi [25], to extract the note onsets and offsets from the synchronised MIDI files and segmented the F0 array.
The DALI dataset [19] was generated using the teacher-student machine learning paradigm. What they did was synchronise the audio files from karaoke games with lyrics and notes by applying machine learning techniques to assist them.
1.2.3. Semi-Automatic Annotation
The fundamental frequencies in the Erkomaishvili dataset [5] were automatically computed within the user-specified regions using an F0 estimation algorithm similar to Melodia [26]. Then, the annotator could guide the estimation process. Moreover, the tool’s audiovisual feedback mechanisms helped the annotator validate and correct the computed F0-trajectories.
For annotating F0 in the MASTmelody dataset [17], a software tool, Melodia [26], was used. Then, since the pitch contour was not error-free, they altered the pitch contours manually.
To manually annotate beats in the Dagstuhl ChoirSet dataset [2], the Sonic Visualiser tool [20] was employed. An expert annotator corrected the annotations that a non-professional musician had created. To synchronise notes with MIDI files, they employed the dynamic time warping approach presented by [27,28], using the beat annotations as anchor points for the alignment. Therefore, after the synchronisation, they had each note’s onset, offset, and MIDI pitch. Regarding F0 annotation, they applied the PYIN [23] and CREPE [29] to estimate them. In addition, they also used a tool, Tony [30], to edit pitch contours manually.
Similarly, the F0s in the Vocadito dataset [4] were estimated by Tony [30], which is based on the PYIN [23] algorithm, and then an expert edited the estimated pitch contours. They used a similar approach for extracting notes; Tony was used first to estimate the onset and offset of the notes. Then, two experts corrected any errors identified in these extracted notes. Finally, for the lyrics, they manually added the words that the singers sang without considering the timing of the words.
As can be seen from the related work in annotations, the current automatic tools are not error-free, and humans need to review their results and alter any incorrect annotations. Thus, we used the same approach; first, a tool automatically annotated the dataset and then manual intervention was used to alter any incorrect annotations, as explained in the following section.
2. Steps to Generate the Dataset
Generally, four steps were followed to add the annotations: 1—estimation of F0, 2—detection of onsets, offsets, and transitions, 3—extraction of notes’ features, and 4—adding the scores to the extracted notes. These steps are explained in the following.
2.1. Estimating Fundamental Frequencies
A state-of-the-art pitch detector algorithm, PYin [23], was employed to estimate the fundamental frequencies of each file. The implementation of the PYin in Librosa [31] was used as it is one of the well-known Python libraries. According to the studies by Faghih and Timoney [32,33], the PYin algorithm is a reliable pitch estimator for singing signals. However, it still returns incorrect estimates for some F0s. Therefore, the Smart-Median pitch smoother algorithm [34] was employed to smooth the pitch contours estimated by PYin. This smoother algorithm altered the wrongly estimated pitches, i.e., the outliers were edited by employing the median method. Figure 1 illustrates how the Smart-Median algorithm modifies a pitch contour to smooth sharp jumps.
However, after plotting all the pitch contours, the authors reviewed all pitch trajectories and realized that some of the pitch contours were incorrect. To find the incorrectly generated pitch contour, we looked at the plotted data. Where the plotted shape was not as expected, more investigations were done to find the reasons. There were two main reasons for incorrectly shaped pitch contours: 1—wrongly estimated F0, for example, octave-doubling, 2—singer mistakes, for example, in some cases, such as in the files f7_scales_c_fast_forte_i, m6_scales_c_fast_piano_a, and m11_scales_f_fast_forte_e.csv, the singers sang one note less than given in the musical scores, or they sang some extra notes, such as in the file m1_caro_straight.wav. Therefore, we removed these incorrect files from the Annotated-VocalSet to have a reliable set of pitch contours. In total, 24.5 per cent of files were discarded from the original dataset.
2.2. Detecting Onsets, Offsets, and Transitions
After preparing the pitch contours, a semi-automatic approach was used to annotate pitch contours with onset, offset, and transitions. First, the algorithm introduced by Faghih and Timoney [35] as a state-of-the-art algorithm and explicitly designed for singing signals was used to estimate the onset, offset, and transition between two consecutive notes.
The onset detection algorithm [35] looks for the trajectory changes in a pitch contour to calculate the onset, offset, and transition. First, the algorithm calculates the slopes of the points in a pitch contour to discover when a significant change happens in the contour. Then, these changes are considered as events, onset, offset, or a transition. The algorithm seeks onsets and offsets for both articulated sounds and rests. In other words, an onset point can be the start of a sound or rest; similarly, an offset can be the end of a sound or rest. As Faghih and Timoney [35] reported, their algorithm works better than other available onset detection algorithms for singing signals.
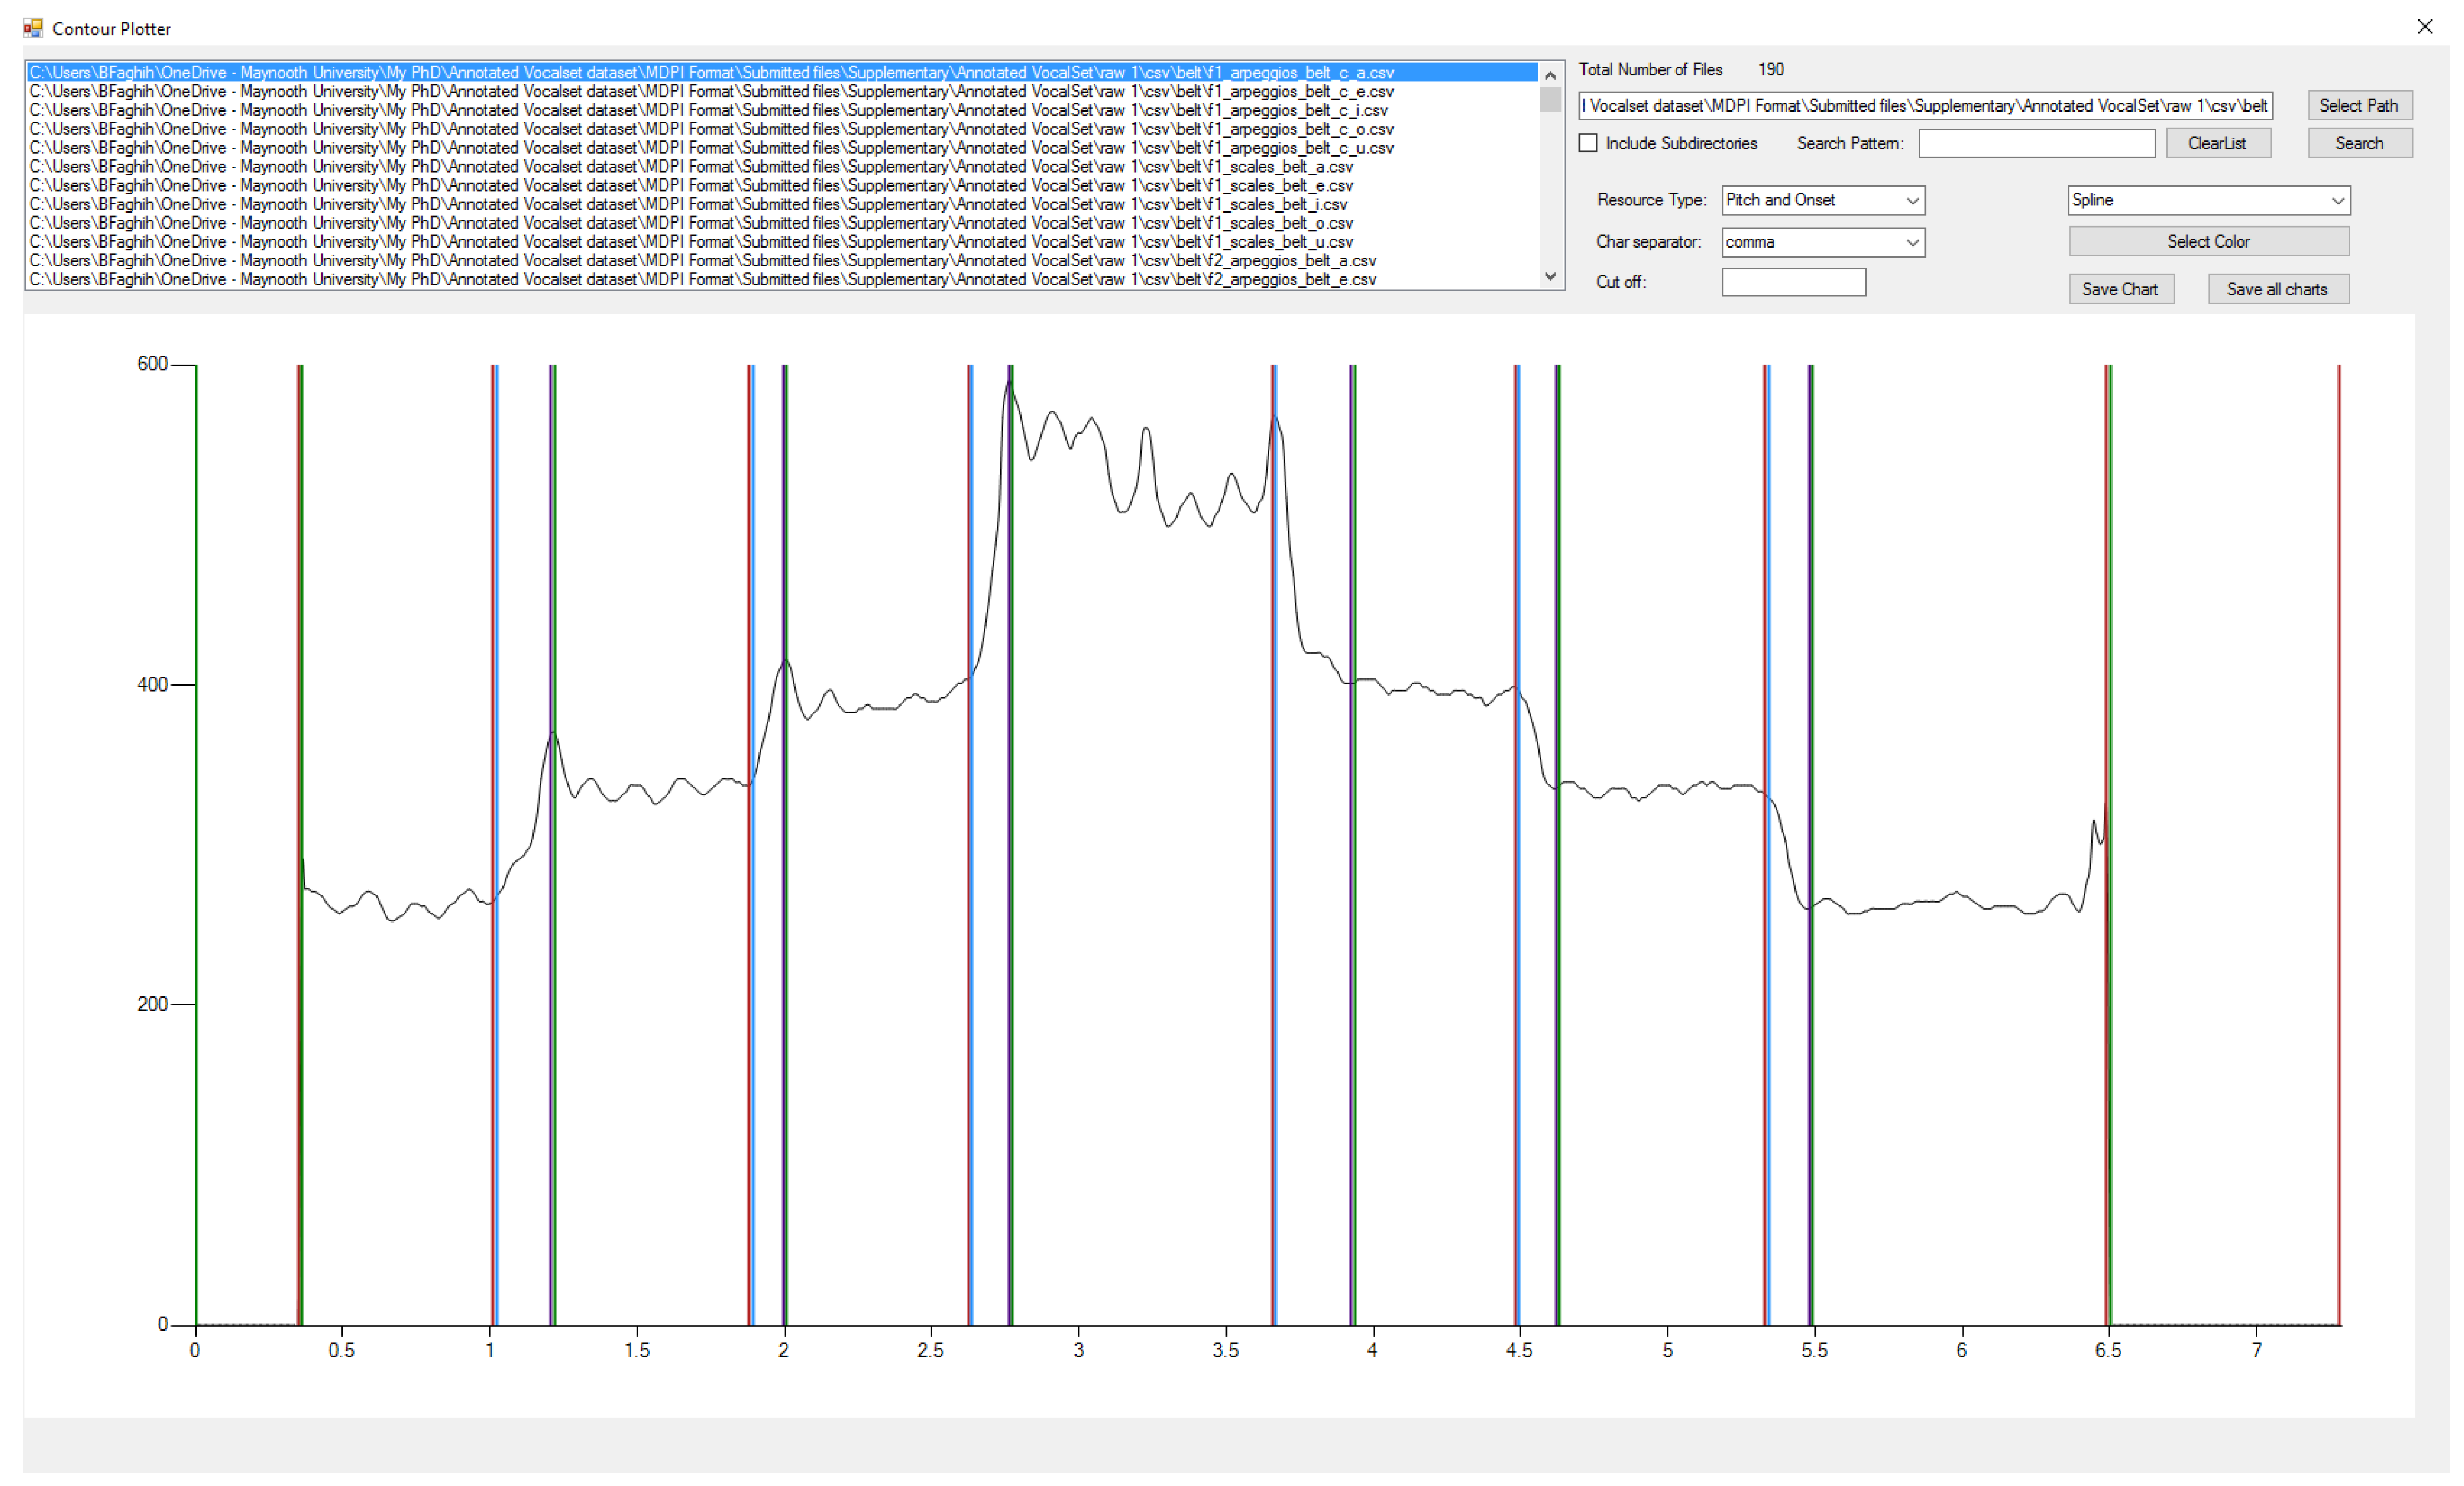
After labelling the events, all the detected events were graphed to double-check the accuracy of the annotations. Some errors observed among the estimated events were then corrected with a software tool developed by this paper’s authors; Figure 2 depicts the tool. The software uses different colours for each event. If the user finds an incorrect event, they should edit the CSV file containing the values that will be explained in Section 3.1. Therefore, its users can change the CSV files and immediately see the results on the screen to ensure the events are labelled correctly. This tool was developed using the language C# and is available at https://doi.org/10.5281/zenodo.7061507, accessed on 3 August 2022. It should be mentioned that this tool works on CSV files in the “raw” folders.
To adjust the estimated annotations, firstly, files were divided among five unexpert musicians (but they were trained how to interpret a pitch contour to find events) to correct the estimated events. Finally, an expert musician with more than 12 years of music training reviewed all the events and adjusted any incorrect ones.
Figure 3a depicts the onset, offset, and transition from a part of a pitch contour. The red line shows the offset, the green line is the onset, the blue line shows the start of the transition, and the purple line shows the end of the transition.
However, there is an acknowledgement among researchers [1,4,5,12] that there is not a universal agreement as to where to precisely select the onset/offset points in a pitch contour. Therefore, each annotator picks a point approximately between the red and green lines in Figure 3a.
Therefore, since several software libraries and associated studies do not include transitions but only onsets and/or offsets, we have proposed two approaches, considering and not considering the existence of a transition, for annotating onsets, offsets, and transitions.
2.3. Extracting Notes Features
After annotating the pitch contours with the onset, offset, and transitions, as explained above, the following formulas were used to calculate each note’s features.
- 1.
- Start time: is the onset time.
- 2.
- End time: the time of the offset.
- 3.
- Duration: calculated by subtracting the “Start time” from the “End time”.
- 4.
- Type: can be a rest, sound, or transition according to Equation (1).
- 5.
- Average F0: contains the average of the F0s of the note.
- 6.
- Median F0: includes the median of the estimated F0s for the current note.
- 7.
- Min F0: contains the minimum estimated F0 in the current note.
- 8.
- Max F0: shows the maximum estimated F0 in the current note.
- 9.
- The standard deviation of F0s (STD): this column shows the standard deviation of the estimated F0s of the current note.
- 10.
- Average F0s in the range of STD (AverageStd): This column includes the average of the only estimated F0s that satisfy the following condition:This metric calculates the average by omitting the pitches that were determined to be outliers. Since, in some cases, especially when the note’s duration was very short, none of the estimated pitches were within one standard deviation distance, and thus two standard deviation distances were considered instead.
- 11.
- Estimated MIDI code: includes the MIDI codes associated with the calculated AverageStd, as shown in Equation (3).
2.4. Combining Extracted Notes with Ground Truth Scores
After extracting the notes, they needed to be associated with the scores. The scores and lyrics of each file are available in the VocalSet dataset [6]. Therefore, the estimated notes and the scores were automatically combined by a software program created by this paper’s authors. For each musical score, an array that held the notes’ information, such as name and duration, were created in the code. Then the two lists, estimated notes and scores, were mixed. To mix them, the code iteratively walks through the lists, and when the notes are matched, that is notes on each list were either a rest or an articulated sound, they were combined. Finally, the following columns were added to the files in the “extended” directories.
- 12.
- Ground truth Note name: their format is a capital letter + [#/b] + octave number—for example, C4, D#5, or Bb4.
- 13.
- Ground Truth Frequency: It includes the frequency of the note based on A4 = 440 Hz.
- 14.
- Ground Truth MIDI code: the MIDI note number according to the ground truth note name.
- 15.
- Lyric: if the file comes from an arpeggio, scale, or long-tone, this column includes the sung vowel. Otherwise, the syllable corresponding to the note according to the scripts provided in VocalSet [6] is used in this column.
- 16.
- Ground Truth Note duration name: it includes the name of the note’s duration. Its value is one from this list: Whole_note, Half_note, Dotted_Quarter_note, Quarter_note, Dotted_Eighth_note, Eighth_note, Eighth_note_triplet, Sixteenth_note, or Grace_note.
- 17.
- Ground Truth note duration: the BPMs of two series of songs were indicated in VocalSet. The BPM of the songs marked as ‘fast’ is 330, and those marked ‘slow’ is 60. Therefore, the ground truth notes’ duration of these two categories only were annotated in this study.
- 18.
- Interval to the previous note: this shows the number of semitones between the current note and the immediate previous note.
- 19.
- Interval to the following note: this shows the number of semitones between the current note and the note immediately following it.
2.5. Checking Annotations Correctness
After creating the annotations, several evaluations were used as listed below to check their correctness.
- All the pitch contours and the events were plotted, similar to Figure 2, to double-check them manually. First, an unexpert but trained person checked and corrected the files. Then, another person with the same expertise double-checked them. Finally, an expert reviewed the annotations. As seen in Figure 2, it is possible to distinguish the played notes from a pitch contour. Therefore, when an event was not estimated correctly, the annotator could find and alter it.
- A piece of software code was developed to check if the sequences of the onset, offset, and transition were correct. For example, an onset should be followed by an offset. In addition, the start and end of a transition should be between an offset and its consecutive onset. The list of the incorrect files was saved in a text file. Then, an expert corrected the erroneous files. These processes were repeated until the software code could not find any more errors.
- In the process of combining the extracted notes with the scores as discussed in Section 2.4, if the number of extracted notes was not equal to the number of notes in the ground truth, the automatic tool listed the incorrect files to be investigated by the user. These steps were repeated until no error was reported by the tool.
- Finally, with a piece of code, the information in all the files, including the header in the “extended 4” directory, were combined to have all the information in one CSV file. This file is available in the Annotated-VocalSet root directory and named “all-files.csv”. Then rows were sorted based on the column, named Shifted_F0—Nominal_F0. The values in this column were expected to be between −1 and 1. Therefore, all the records that did not belong to this range were investigated manually to fix the inaccurate ones. Therefore, after this test, most of the notes were within the expected range, and this paper’s authors became convinced that the out-of-range values were not errors due to the erroneous actions of the authors but were due to errors in the notes produced by the singers.
After these checks, the correctness of the annotations satisfied the authors.
3. Dataset Description
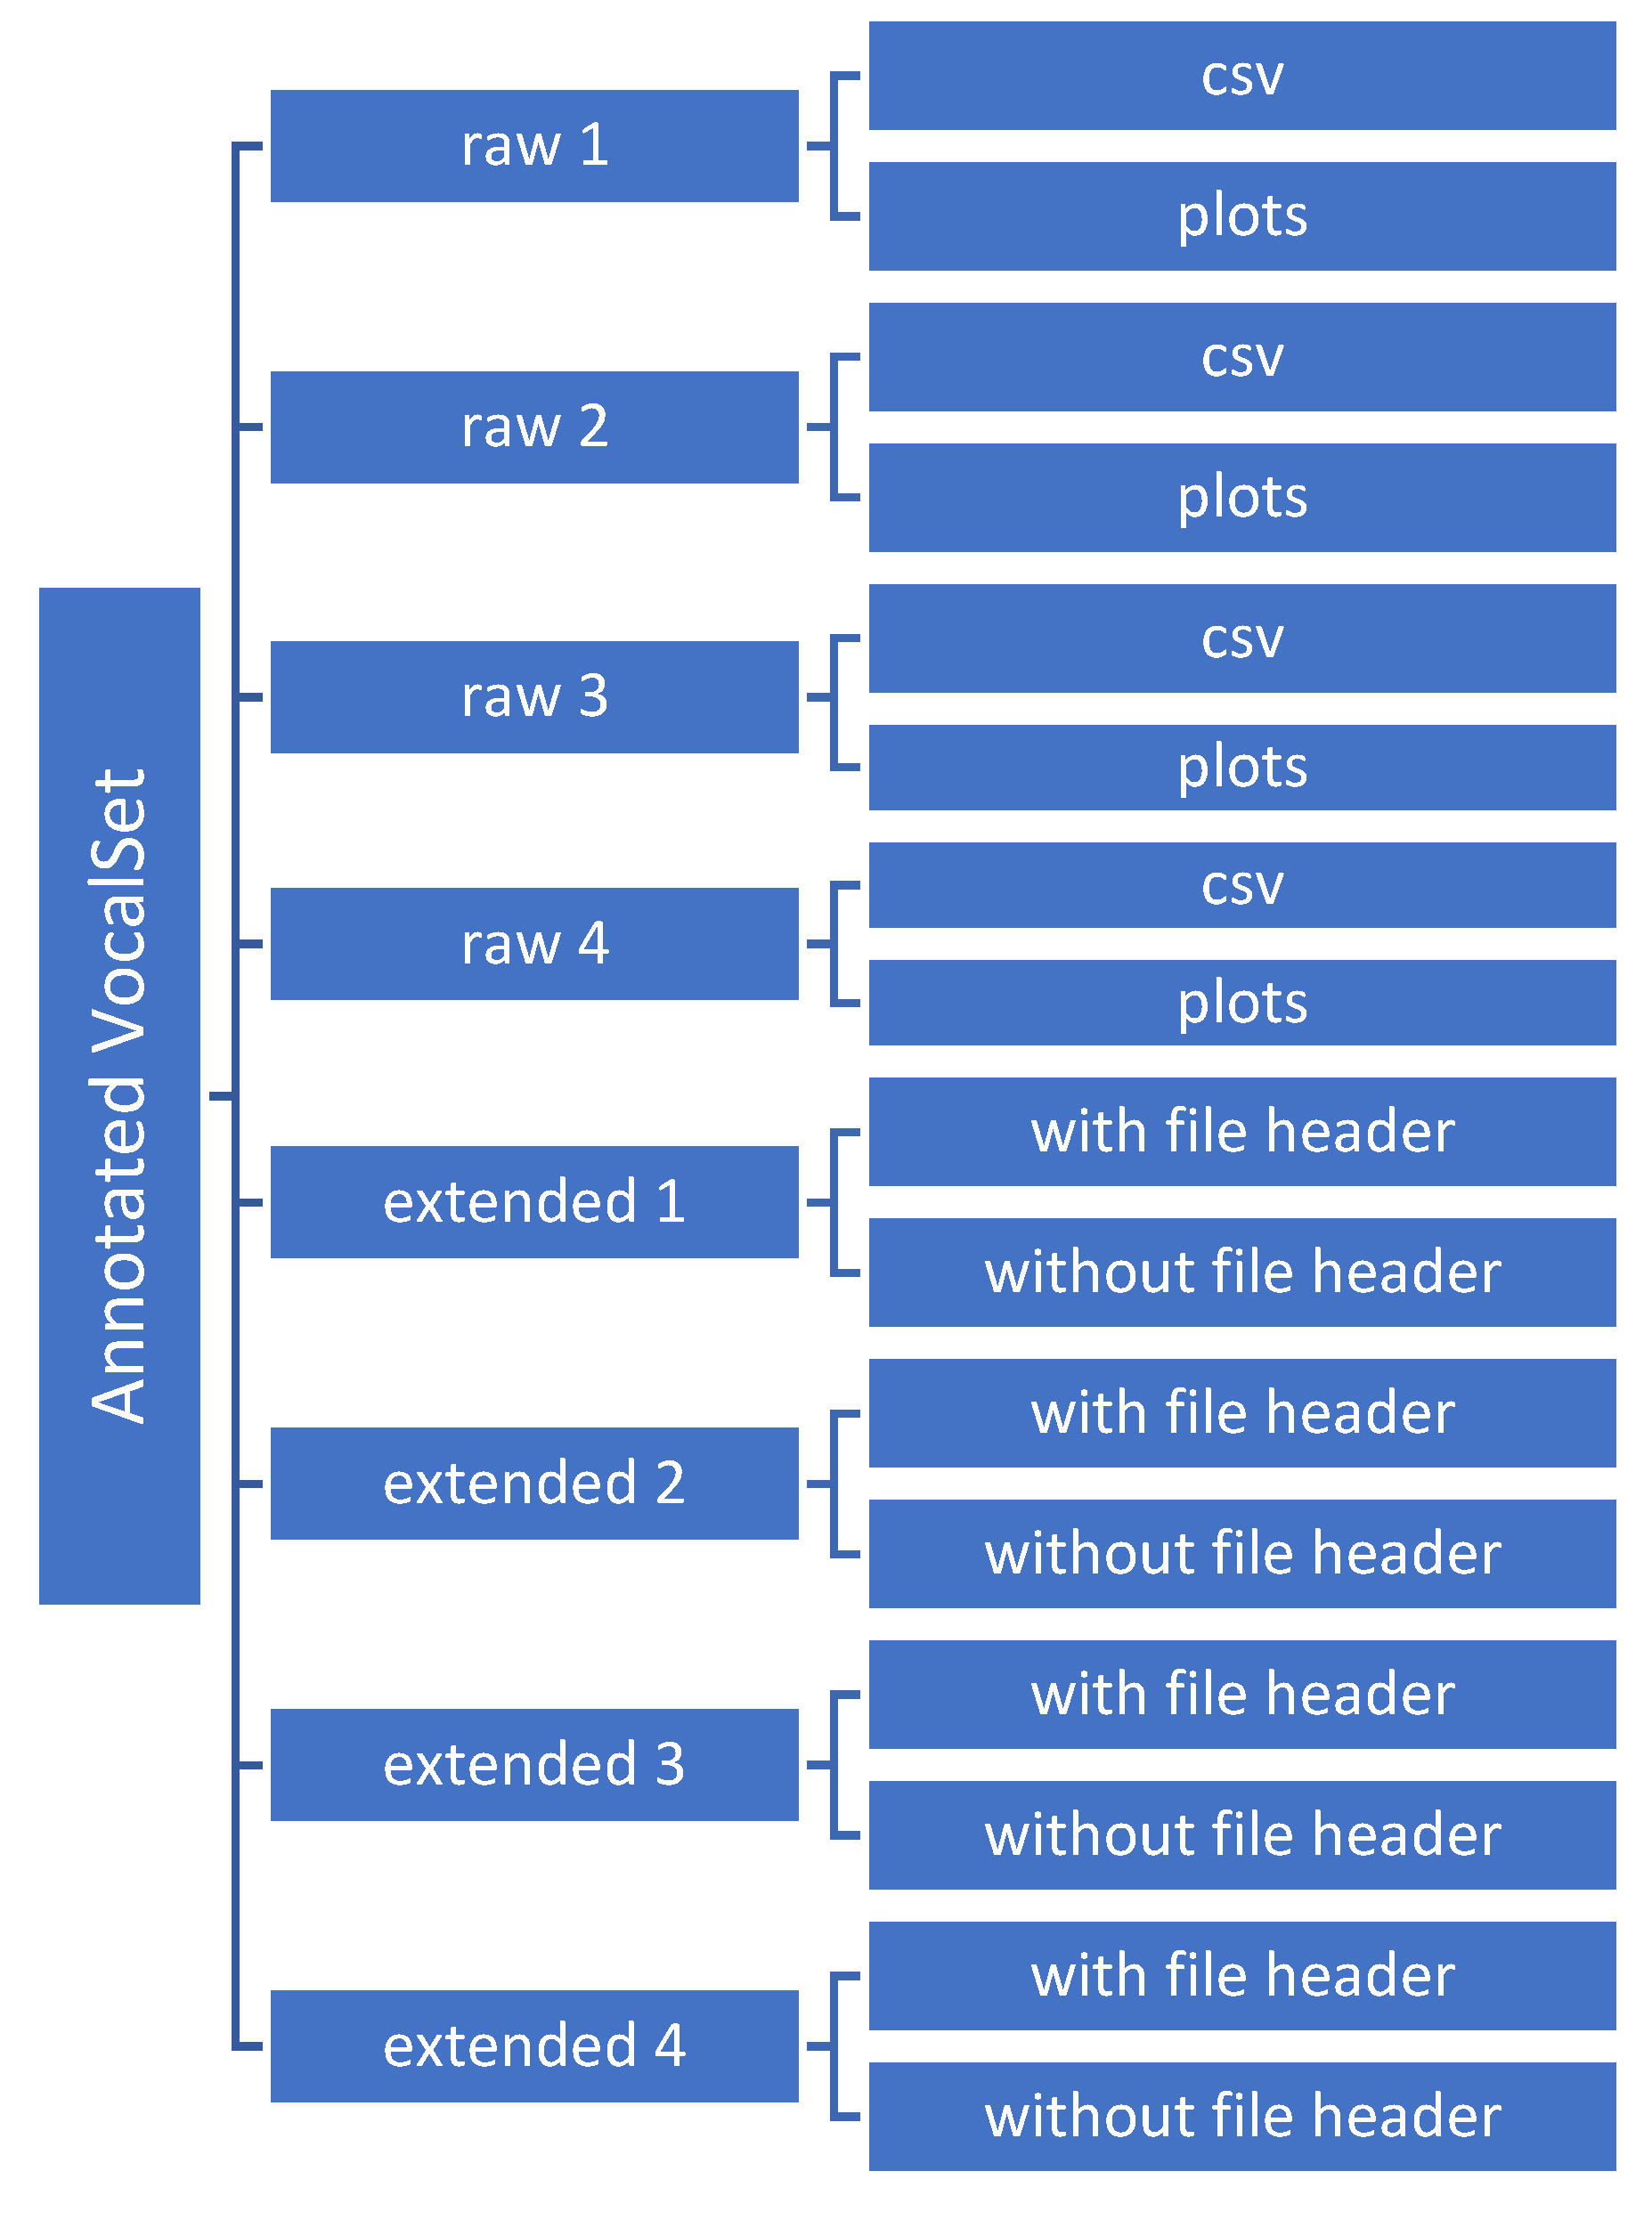
The directories’ hierarchy of the Annotated-VocalSet is depicted in Figure 4. The notes in the files in the “raw 1” and “extended 1” directories were calculated by considering a transition between notes, as depicted in Figure 3a. On the other hand, the notes in the other directories were estimated without considering a transition between notes. Therefore, for the estimated notes in the “raw 2” and “extended 2” directories, the onsets started immediately after the offsets, as shown in Figure 3b. Moreover, the files belonging to the “raw 3” and “extended 3” directories were calculated by considering the points before onsets as offsets, as illustrated in Figure 3c. In addition, the files in the “raw 4” and “extended 4” directories included the notes where their onset and offsets were estimated as the middle points between the offset and onset when a transition was considered between notes. As an illustration, the onset and offset points in Figure 3d are at the middle of the onset and offset points in Figure 3a.
3.1. Raw Directories
The “raw” directories shown in Figure 4 included each audio file’s CSV and JPEG (plotted) files.
The CSV file columns in order are Time (in second), F0 (in Hertz), Amplitude (between 0 and 1), onset (true or empty), offset (true or empty), and Transition (true or empty). The Transition column indicates whether or not the detected onset/offset is related to a transition from one note to another note. In other words, if the transition column is true and onset/offset is true, it means that this onset/offset shows the start/end of a transition.
The plot folders include the graphs of the pitch contours with the onset, offset, and transition events, similar to Figure 2.
3.2. Extended Directories
The files in these directories are created based on the “raw” files. The extended directories include two subdirectories: with file header and without file header. The difference between these two subdirectories is that the folders named “with file header” contains files having a header as described in the following.
The heading part is positioned at the top of the CSV files and has 15 lines, and the description of each line is as follows:
- Filename;
- Gender;
- Singer name (f1, f2, etc.);
- The technique (breathy, fast forte, fast piano, etc.);
- Type of music (Scale, Arpeggios, etc.);
- Vowel (a, e, I, o, u);
- BPM;
- File duration in milliseconds.
Lines 9 to 15 are reserved to allow the possibility of their use at some time in the future. In this case, the computer programming codes developed for processing the current version of the dataset will not need to be changed to work with future versions.
After the heading (or at the top of the files in the without file header directories), the list of the columns in order are Sequence, Start time, End time, Duration, Type, Average F0, Median F0, Min F0, Max F0, Standard deviation F0, Average F0 in range of STD, Estimated MIDI code, Ground truth Note name, Ground Truth Frequency, Ground Truth MIDI code, Lyric, Ground Truth Note duration name, Ground Truth note duration, Interval to the previous note, and Interval to the following note. All the columns have been explained in Section 2.3 and Section 2.4.
The original VocalSet dataset already provides the information in the heading section, but this study adds these details of the singing notes.
4. Comparing the Four Methods of Selecting the Positions of Onset, Offset, and Transition
Since this study provides four approaches for selecting the onset, offset, and transition discussed in Section 3, a comparison among them is provided to help the reader to select the appropriate one for their studies. To compare them, the theoretical pitch frequencies of notes in the MIDI pitch code are considered to be the ground truth. In addition, each note’s Average, AverageStd, and Median F0 values were converted to MIDI pitch codes. Therefore, each approach that can produce fewer differences from the ground truth is considered as a better approach. Finally, all possible pair permutations of approaches were compared. Table 2, Table 3 and Table 4. show the p-value for the t-test employed on each pair group to determine if the difference among the means of the distances between the estimated MIDI code and the theoretical MIDI code is meaningful. For example, the first row in Table 2 shows that there is no noticeable difference (p-value > 0.05) between the first approach (the files in the “extended 1” directory) and the second approach (the files in the “extended 2” directory).
As shown in Table 2 and Table 3, in some cases, there are statistically significant differences in the variation of the estimated pitch frequencies of notes when computed using the Average as compared to the AverageStd. However, the Median approach does not show a significant difference, as illustrated in Table 4. Nevertheless, according to Table 5, Table 6 and Table 7, since the maximum difference between the average difference of F0s calculated by each approach is less than 0.2 MIDI pitch code, these differences across their averages are not meaningful in a musical sense. For example, based on Table 2, the p-value for comparing “extended 1” and “extended 3” is <0.01, which means that a significant difference between “extended 1” and “extended 4” exists statistically. Nevertheless, Table 5 shows that the range of the observed differences for “extended 1” is MIDI pitch code and that the range for “extended 3” is MIDI pitch code. This is a 0.1159 MIDI pitch code difference between the means of “extended 1” and “extended 3” (i.e., 1.0386–0.9227); this number of 0.1159 could not be considered to be a significant difference in pitch value, particularly when the range for “extended 1” is from to MIDI pitch code and for “extended 3” is between and . Therefore, for estimating the fundamental pitch frequency of notes, there is no significant difference between selecting each point, as discussed in Section 3, to be the onset and offset. Similarly, by comparing Table 5, Table 6 and Table 7, it can be concluded that there is not a considerable difference between the methods of calculating F0 (Average, AverageStd, and Median).
On the other hand, points selected as onsets and offsets can affect the duration of the notes.
5. Conclusions
This paper introduced an extended set of annotations for the solo singing files in the VocalSet dataset [6]. The provided annotations include F0, onset, offset, transition, note F0, note duration, Midi pitch, lyric. In addition, four approaches for considering the onset and offset points in a pitch contour were compared, showing that the selected points for onset and offset cannot significantly affect the note’s estimated F0. Moreover, calculating a note’s F0 by average or median methods does not considerably affect the note’s estimated F0. The annotated dataset is available online at https://doi.org/10.5281/zenodo.7061507, accessed on 3 August 2022.
Author Contributions
Conceptualisation, B.F.; methodology, B.F.; software, B.F.; validation, B.F.; formal analysis, B.F.; investigation, B.F.; resources, B.F.; data curation, B.F.; writing—original draft preparation, B.F.; writing—review and editing, B.F. and J.T.; visualisation, B.F.; supervision, J.T.; project administration, B.F. All authors have read and agreed to the published version of the manuscript.
Funding
This research received no external funding.
Institutional Review Board Statement
Not applicable.
Informed Consent Statement
Not applicable.
Data Availability Statement
The dataset and the pitch contour plotter tool are available online at https://doi.org/10.5281/zenodo.7061507, accessed on 3 August 2022.
Acknowledgments
Thanks to Maynooth University and the Higher Education Authority in the Department of Further and Higher Education, Research, Innovation and Science in Ireland for their supports.
Conflicts of Interest
The authors declare no conflict of interest. In addition, the funders had no role in the design of the study; in the collection, analyses, or interpretation of data; in the writing of the manuscript; or in the decision to publish the results.
References
- Choi, S.; Kim, W.; Park, S.; Yong, S.; Nam, J. Children’s Song Dataset for Singing Voice Research Soonbeom. In Proceedings of the International Society for Music Information Retrieval Conference (ISMIR), Montréal, QC, Canada, 11–16 October 2020. [Google Scholar]
- Rosenzweig, S.; Cuesta, H.; Weiß, C.; Scherbaum, F.; Gómez, E.; Müller, M. Dagstuhl ChoirSet: A Multitrack Dataset for MIR Research on Choral Singing. Trans. Int. Soc. Music Inf. Retr. 2020, 3, 98–110. [Google Scholar] [CrossRef]
- Cuesta, H.; Gómez, E.; Martorell, A.; Loáiciga, F. Analysis of Intonation in Unison Choir Singing. In Proceedings of the 15th International Conference on Music Perception and Cognition (ICMPC), Graz, Austria, 23–28 July 2018. [Google Scholar]
- Bittner, R.M.; Pasalo, K.; Bosch, J.J.; Meseguer-Brocal, G.; Rubinstein, D. Vocadito: A Dataset of Solo Vocals with F0, Note, and Lyric Annotations. In Proceedings of the International Society for Music Information Retrieval, Online, 8–12 November 2021. [Google Scholar]
- Rosenzweig, S.; Scherbaum, F.; Shugliashvili, D.; Arifi-Müller, V.; Müller, M. Erkomaishvili Dataset: A Curated Corpus of Traditional Georgian Vocal Music for Computational Musicology. Trans. Int. Soc. Music Inf. Retr. 2020, 3, 31–41. [Google Scholar] [CrossRef]
- Wilkins, J.; Seetharaman, P.; Wahl, A.; Pardo, B. VocalSet: A Singing Voice Dataset. In Proceedings of the 19th ISMIR Conference, Paris, France, 23–27 September 2018; pp. 468–472. [Google Scholar] [CrossRef]
- Hsu, C.-L.; Jang, J.-S.R. On the Improvement of Singing Voice Separation for Monaural Recordings Using the MIR-1K Dataset. IEEE Trans. Audio Speech Lang. Process. 2010, 18, 310–319. [Google Scholar] [CrossRef]
- COFLA (COmputational Analysis of FLAmenco Music) Team. TONAS: A Dataset of Flamenco a Cappella Sung Melodies with Corresponding Manual Transcriptions. In Proceedings of the International Society for Music Information Retrieval Conference (ISMIR), Curitiba, Brazil, 4–8 November 2013. [Google Scholar] [CrossRef]
- Mora, J.; Gómez, F.; Gómez, E.; Escobar-Borrego, F.; Díaz-Báñez, J.M. Characterization and Melodic Similarity of a Cappella Flamenco Cantes. In Proceedings of the International Society for Music Information Retrieval Conference (ISMIR), Utrecht, The Netherlands, 9–13 August 2010; pp. 351–356. [Google Scholar]
- Gómez, E.; Bonada, J. Towards Computer-Assisted Flamenco Transcription: An Experimental Comparison of Automatic Transcription Algorithms as Applied to A Cappella Singing. Comput. Music J. 2013, 37, 73–90. [Google Scholar] [CrossRef]
- Chang, S.; Lee, K. A Pairwise Approach to Simultaneous Onset/Offset Detection for Singing Voice Using Correntropy. In Proceedings of the 2014 IEEE International Conference on Acoustics, Speech and Signal Processing (ICASSP), Florence, Italy, 4–9 May 2014; pp. 629–633. [Google Scholar]
- Heo, H.; Sung, D.; Lee, K. Note Onset Detection Based on Harmonic Cepstrum Regularity. In Proceedings of the 2013 IEEE International Conference on Multimedia and Expo (ICME), San Jose, CA, USA, 15–19 July 2013; pp. 1–6. [Google Scholar]
- Molina, E.; Barbancho, A.M.; Tardón, L.J.; Barbancho, I. Evaluation Framework for Automatic Singing Transcription. In Proceedings of the 15th International Society for Music Information Retrieval Conference (ISMIR 2014), Taipei, Taiwan, 27–31 October 2014; pp. 567–572. [Google Scholar]
- Chan, T.-S.; Yeh, T.-C.; Fan, Z.-C.; Chen, H.-W.; Su, L.; Yang, Y.-H.; Jang, R. Vocal Activity Informed Singing Voice Separation with the IKala Dataset. In Proceedings of the 2015 IEEE International Conference on Acoustics, Speech and Signal Processing (ICASSP), South Brisbane, QLD, Australia, 19–24 April 2015; pp. 718–722. [Google Scholar]
- Bittner, R.; Salamon, J.; Tierney, M.; Mauch, M.; Cannam, C.; Bello, J. MedleyDB: A Multitrack Dataset for Annotation-Intensive MIR Research. In Proceedings of the 15th International Society for Music Information Retrieval Conference, ISMIR 2014, Taipei, Taiwan, 27–31 October 2014; pp. 155–160. [Google Scholar]
- Bittner, R.M.; Wilkins, J.; Yip, H.; Bello, J.P. Medleydb 2.0: New Data and a System for Sustainable Data Collection. In Proceedings of the International Conference on Music Information Retrieval (ISMIR-16), New York, NY, USA, 7–11 August 2016; pp. 2–4. [Google Scholar]
- Bozkurt, B.; Baysal, O.; Yüret, D. A Dataset and Baseline System for Singing Voice Assessment. In Proceedings of the International Symposium on Computer Music Multidisciplinary Research (CMMR), Matosinhos, Portugal, 25–28 September 2017; pp. 430–438. [Google Scholar]
- Dzhambazov, G.; Holzapfel, A.; Srinivasamurthy, A.; Serra, X. Metrical-Accent Aware Vocal Onset Detection in Polyphonic Audio. In Proceedings of the 18th International Society for Music Information Retrieval Conference, ISMIR 2017, Suzhou, China, 23–27 October 2017; pp. 702–708. [Google Scholar]
- Meseguer-Brocal, G.; Cohen-Hadria, A.; Peeters, G. DALI: A Large Dataset of Synchronized Audio, Lyrics and Notes, Automatically Created Using Teacher-Student Machine Learning Paradigm. In Proceedings of the The 19th International Society for Music Information Retrieval Conference, ISMIR 2018, Paris, France, 23–27 September 2018; pp. 431–437. [Google Scholar]
- Cannam, C.; Landone, C.; Sandler, M. Sonic Visualiser. In Proceedings of the International Conference on Multimedia—MM’10, Firenze, Italy, 25–29 October 2010; ACM Press: New York, NY, USA, 2010; p. 1467. [Google Scholar]
- Finale. Available online: https://www.klemm-music.de/makemusic/finale/ (accessed on 3 August 2022).
- Sibelius. Available online: https://www.avid.com/de/sibelius (accessed on 3 August 2022).
- Mauch, M.; Dixon, S. PYIN: A Fundamental Frequency Estimator Using Probabilistic Threshold Distributions. In Proceedings of the 2014 IEEE International Conference on Acoustics, Speech and Signal Processing (ICASSP), Florence, Italy, 4–9 May 2014; pp. 659–663. [Google Scholar] [CrossRef]
- Villavicencio, F.; Bonada, J.; Yamagishi, J.; Pucher, M. Efficient Pitch Estimation on Natural Opera-Singing by a Spectral Correlation Based Strategy; Information Processing Society of Japan (IPSJ): Tokyo, Japan, 2015. [Google Scholar]
- Raffel, C.; Ellis, D.P.W. Intuitive Analysis, Creation and Manipulation of MIDI Data with Pretty_midi. In Proceedings of the 15th International Society for Music Information Retrieval Conference; Taipei, Taiwan, 27–31 October 2014. [Google Scholar]
- Salamon, J.; Gomez, E. Melody Extraction From Polyphonic Music Signals Using Pitch Contour Characteristics. IEEE Trans. Audio Speech Lang. Process. 2012, 20, 1759–1770. [Google Scholar] [CrossRef]
- Ewert, S.; Muller, M.; Grosche, P. High Resolution Audio Synchronization Using Chroma Onset Features. In Proceedings of the 2009 IEEE International Conference on Acoustics, Speech and Signal Processing, Taipei, Taiwan, 19–24 April 2009; pp. 1869–1872. [Google Scholar]
- Muller, M.; Kurth, F.; Röder, T. Towards an Efficient Algorithm for Automatic Score-to-Audio Synchronization. In Proceedings of the ISMIR, Barcelona, Spain, 10–15 October 2004. [Google Scholar]
- Kim, J.W.; Salamon, J.; Li, P.; Bello, J.P. Crepe: A Convolutional Representation for Pitch Estimation. In Proceedings of the 2018 IEEE International Conference on Acoustics, Speech and Signal Processing (ICASSP), Calgary, AB, Canada, 15–20 April 2018; pp. 161–165. [Google Scholar] [CrossRef]
- Mauch, M.; Cannam, C.; Bittner, R.; Fazekas, G.; Salamon, J.; Dai, J.; Bello, J.; Dixon, S. Computer-Aided Melody Note Transcription Using the Tony Software: Accuracy and Efficiency. In Proceedings of the First International Conference on Technologies for Music Notation and Representation (TENOR 2015), Paris, France, 28–30 May 2015; Volume 8. [Google Scholar] [CrossRef] [Green Version]
- McFee, B.; Metsai, A.; McVicar, M.; Balke, S.; Thomé, C.; Raffel, C.; Zalkow, F.; Malek, A.; Dana; Lee, K.; et al. Librosa/Librosa: 0.9.1. 2022. Available online: https://librosa.org/doc/latest/index.html (accessed on 3 August 2022).
- Faghih, B.; Timoney, J. Real-Time Monophonic Singing Pitch Detection. Preprint 2022, 1–19. [Google Scholar] [CrossRef]
- Faghih, B.; Timoney, J. An Investigation into Several Pitch Detection Algorithms for Singing Phrases Analysis. In Proceedings of the 2019 30th Irish Signals and Systems Conference (ISSC), Maynooth, Ireland, 17–18 June 2019; pp. 1–5. [Google Scholar]
- Faghih, B.; Timoney, J. Smart-Median: A New Real-Time Algorithm for Smoothing Singing Pitch Contours. Appl. Sci. 2022, 12, 7026. [Google Scholar] [CrossRef]
- Faghih, B.; Chakraborty, S.; Yaseen, A.; Timoney, J. A New Method for Detecting Onset and Offset for Singing in Real-Time and Offline Environments. Appl. Sci. 2022, 12, 7391. [Google Scholar] [CrossRef]
Figure 1.
An illustration of the Smart-Median algorithm for smoothing pitch contour. The red line shows the pitch contour estimated by an F0 estimator, while the green dashed line is the corrected version of the red line.
Figure 1.
An illustration of the Smart-Median algorithm for smoothing pitch contour. The red line shows the pitch contour estimated by an F0 estimator, while the green dashed line is the corrected version of the red line.

Figure 2.
The software tool used to check and correct F0, onset, offset, and transition annotations by indicating them with different colours.
Figure 2.
The software tool used to check and correct F0, onset, offset, and transition annotations by indicating them with different colours.

Figure 3.
Points’ statuses on a pitch contour. There are two notes, E4 and F4, sung by a professional female singer. (a) Showing offset, the start of a transition, the end of a transition, and onset events in order. (b) The transition was not considered, and the onset started immediately after the offset point according to (a). (c) Similarly, the transition was not considered, but the offset was annotated to lie immediately before the onset point in (a). (d) Likewise, the transition was not considered, but the middle points between the onset and offset points in (a) are annotated as offset and onset.

Figure 4.
The directories’ hierarchy of the Annotated-VocalSet.


Table 1.
A comparison of existing singing datasets.
| Dataset | Solo/Mix | No. of Files | Total Duration (min) | Annotations | Scripts | Number of Singer | Professional/Amateur |
|---|---|---|---|---|---|---|---|
| MIR1K [7] | Both | 1000 | 133 | F0, unvoiced sounds and vocal/non-vocal segments, lyrics | No | 8 female (f), 11 male (m) | Amateur |
| TONAS [8,9,10] | Solo | 72 | 20.6 | F0, onset, note F0 | No | >40 | Professional |
| SVNote1 [11,12] | Solo | 30 | 16.6 | Onset, offset, MIDI pitch | No | 7 m, 3 f | NI * |
| Evaluation Framework [13] | Solo | 38 | 19.2 | MIDI pitch | No | 8 Child, 8 m, 5 f | Both |
| iKala [14] | Solo | 252 | 126 | F0, lyrics, | No | 6 | Professional |
| MedleyDB [15,16] | Both | 28 | 255 | F0, meta data | No | NI | NI |
| MASTmelody [17] | Both | 1018 | 90 | F0 | Yes | NI | Pupils |
| Dzhambazov [18] | Solo | 13 | 7 | F0, amplitude, note MIDI pitch | No | NI | NI |
| Choral Singing [3] | Choir | 48 | 115.5 | MIDI file | No | 16 | Semi-professional |
| VocalSet [6] | Solo | 3560 | 606 | NA + | Yes | 11 m, 9 f | Professional |
| CSD [1] | Solo | 200 | 291.7 | Onset, offset, lyric, MIDI pitch, MIDI | No | 1 f | Professional |
| Dagstuhl ChoirSet [2] | Choir | 81 | 55.5 | MIDI, F0, beats | No | NI | Amateur |
| Erkomaishvili [5] | Solo | 101 | 424.5 | F0, segmentation, onset, lyric | Yes | 1 m | Professional |
| Vocadito [4] | Solo | 40 | 13.62 | F0, lyric, note | No | 29 | Varying levels of training |
| DALI [19] | Mix | 5358 | NI | Note, lyrics | NA | NI | Amateur |
| Annotated-VocalSet | Solo | 2688 | 406.7 | F0, onset, offset, note, lyric, MIDI pitch | Yes | 11 m, 9 f | Professional |
* NI = Not indicated, + NA = Not applicable.
Table 2.
p-values of the t-test applied to the difference between average frequency and nominal frequency.
Table 2.
p-values of the t-test applied to the difference between average frequency and nominal frequency.
| Series 1 | Series 2 | p-Value |
|---|---|---|
| extended 1 | extended 2 | 0.084 |
| extended 1 | extended 3 | <0.01 |
| extended 1 | extended 4 | 0.259 |
| extended 2 | extended 3 | <0.01 |
| extended 2 | extended 4 | 0.567 |
| extended 3 | extended 4 | <0.01 |
Table 3.
p-values of t-test applied to the difference between AverageStd and nominal frequency.
| Series 1 | Series 2 | p-Value |
|---|---|---|
| extended 1 | extended 2 | 0.287 |
| extended 1 | extended 3 | <0.01 |
| extended 1 | extended 4 | 0.784 |
| extended 2 | extended 3 | <0.01 |
| extended 2 | extended 4 | 0.429 |
| extended 3 | extended 4 | <0.01 |
Table 4.
p-values of t-test on the difference between median frequency and nominal frequency.
| Series 1 | Series 2 | p-Value |
|---|---|---|
| extended 1 | extended 2 | 0.844 |
| extended 1 | extended 3 | 0.197 |
| extended 1 | extended 4 | 0.659 |
| extended 2 | extended 3 | 0.278 |
| extended 2 | extended 4 | 0.809 |
| extended 3 | extended 4 | 0.399 |
Table 5.
Average and standard deviation of the difference between average frequency and nominal frequency.
Table 5.
Average and standard deviation of the difference between average frequency and nominal frequency.
| Series | Average | Standard Deviation |
|---|---|---|
| extended 1 | 0.9227 | 3.075 |
| extended 2 | 0.9627 | 3.113 |
| extended 3 | 1.0386 | 3.19 |
| extended 4 | 0.9492 | 3.194 |
Table 6.
Average and standard deviation of the difference between AverageStd and nominal frequency.
| Series | Average | Standard Deviation |
|---|---|---|
| extended 1 | 1.0317 | 2.518 |
| extended 2 | 1.0539 | 2.52 |
| extended 3 | 1.1094 | 2.511 |
| extended 4 | 1.0374 | 2.516 |
Table 7.
Average and standard deviation of the difference between median frequency and nominal frequency.
Table 7.
Average and standard deviation of the difference between median frequency and nominal frequency.
| Series | Average | Standard Deviation |
|---|---|---|
| extended 1 | 0.8892 | 2.745 |
| extended 2 | 0.8933 | 2.787 |
| extended 3 | 0.9159 | 2.784 |
| extended 4 | 0.8984 | 2.786 |
Publisher’s Note: MDPI stays neutral with regard to jurisdictional claims in published maps and institutional affiliations. |
© 2022 by the authors. Licensee MDPI, Basel, Switzerland. This article is an open access article distributed under the terms and conditions of the Creative Commons Attribution (CC BY) license (https://creativecommons.org/licenses/by/4.0/).
Share and Cite
MDPI and ACS Style
Faghih, B.; Timoney, J. Annotated-VocalSet: A Singing Voice Dataset. Appl. Sci. 2022, 12, 9257. https://doi.org/10.3390/app12189257
AMA Style
Faghih B, Timoney J. Annotated-VocalSet: A Singing Voice Dataset. Applied Sciences. 2022; 12(18):9257. https://doi.org/10.3390/app12189257
Chicago/Turabian StyleFaghih, Behnam, and Joseph Timoney. 2022. "Annotated-VocalSet: A Singing Voice Dataset" Applied Sciences 12, no. 18: 9257. https://doi.org/10.3390/app12189257
Note that from the first issue of 2016, this journal uses article numbers instead of page numbers. See further details here.