


The Feasibility of Shadowed Image Restoration Using the Synthetic Aperture Focusing Technique

Abstract
:Featured Application
Abstract
1. Introduction
2. Experimental Setup
2.1. Physical Model
2.2. Laboratory Manipulation
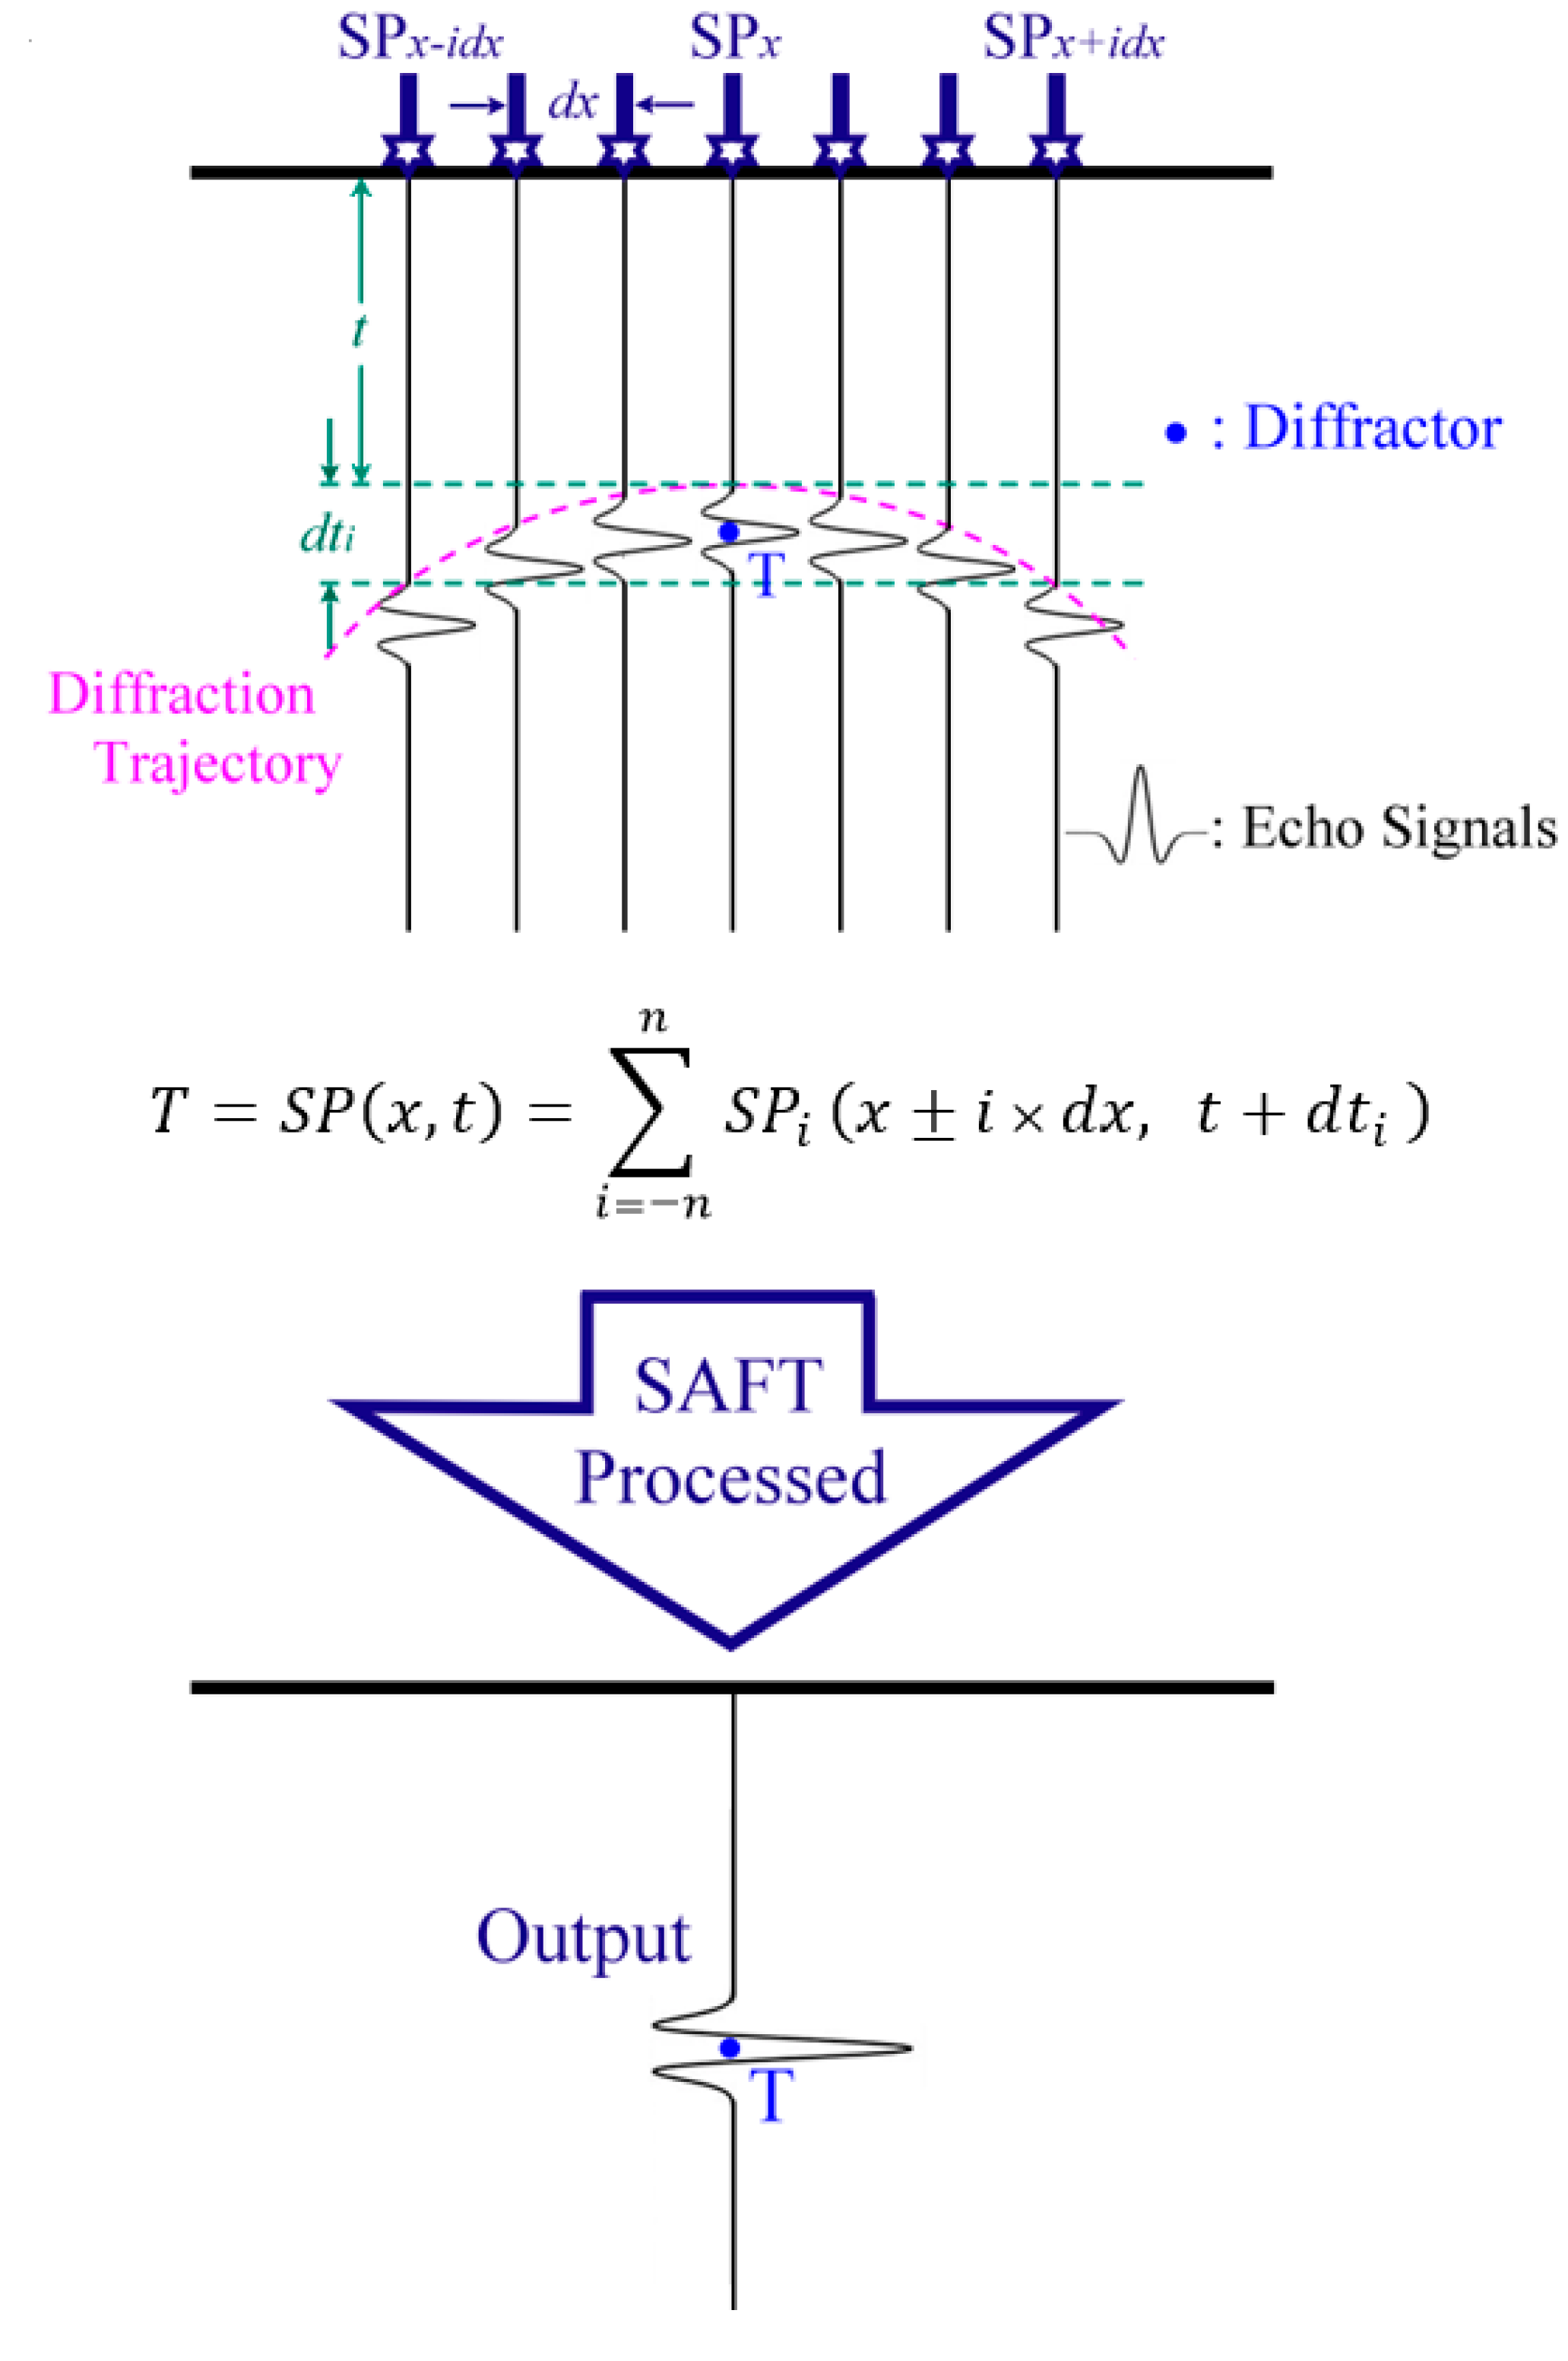
2.3. Restoration Algorithm-Synthetic Aperture Focusing Technique (SAFT)
3. Results
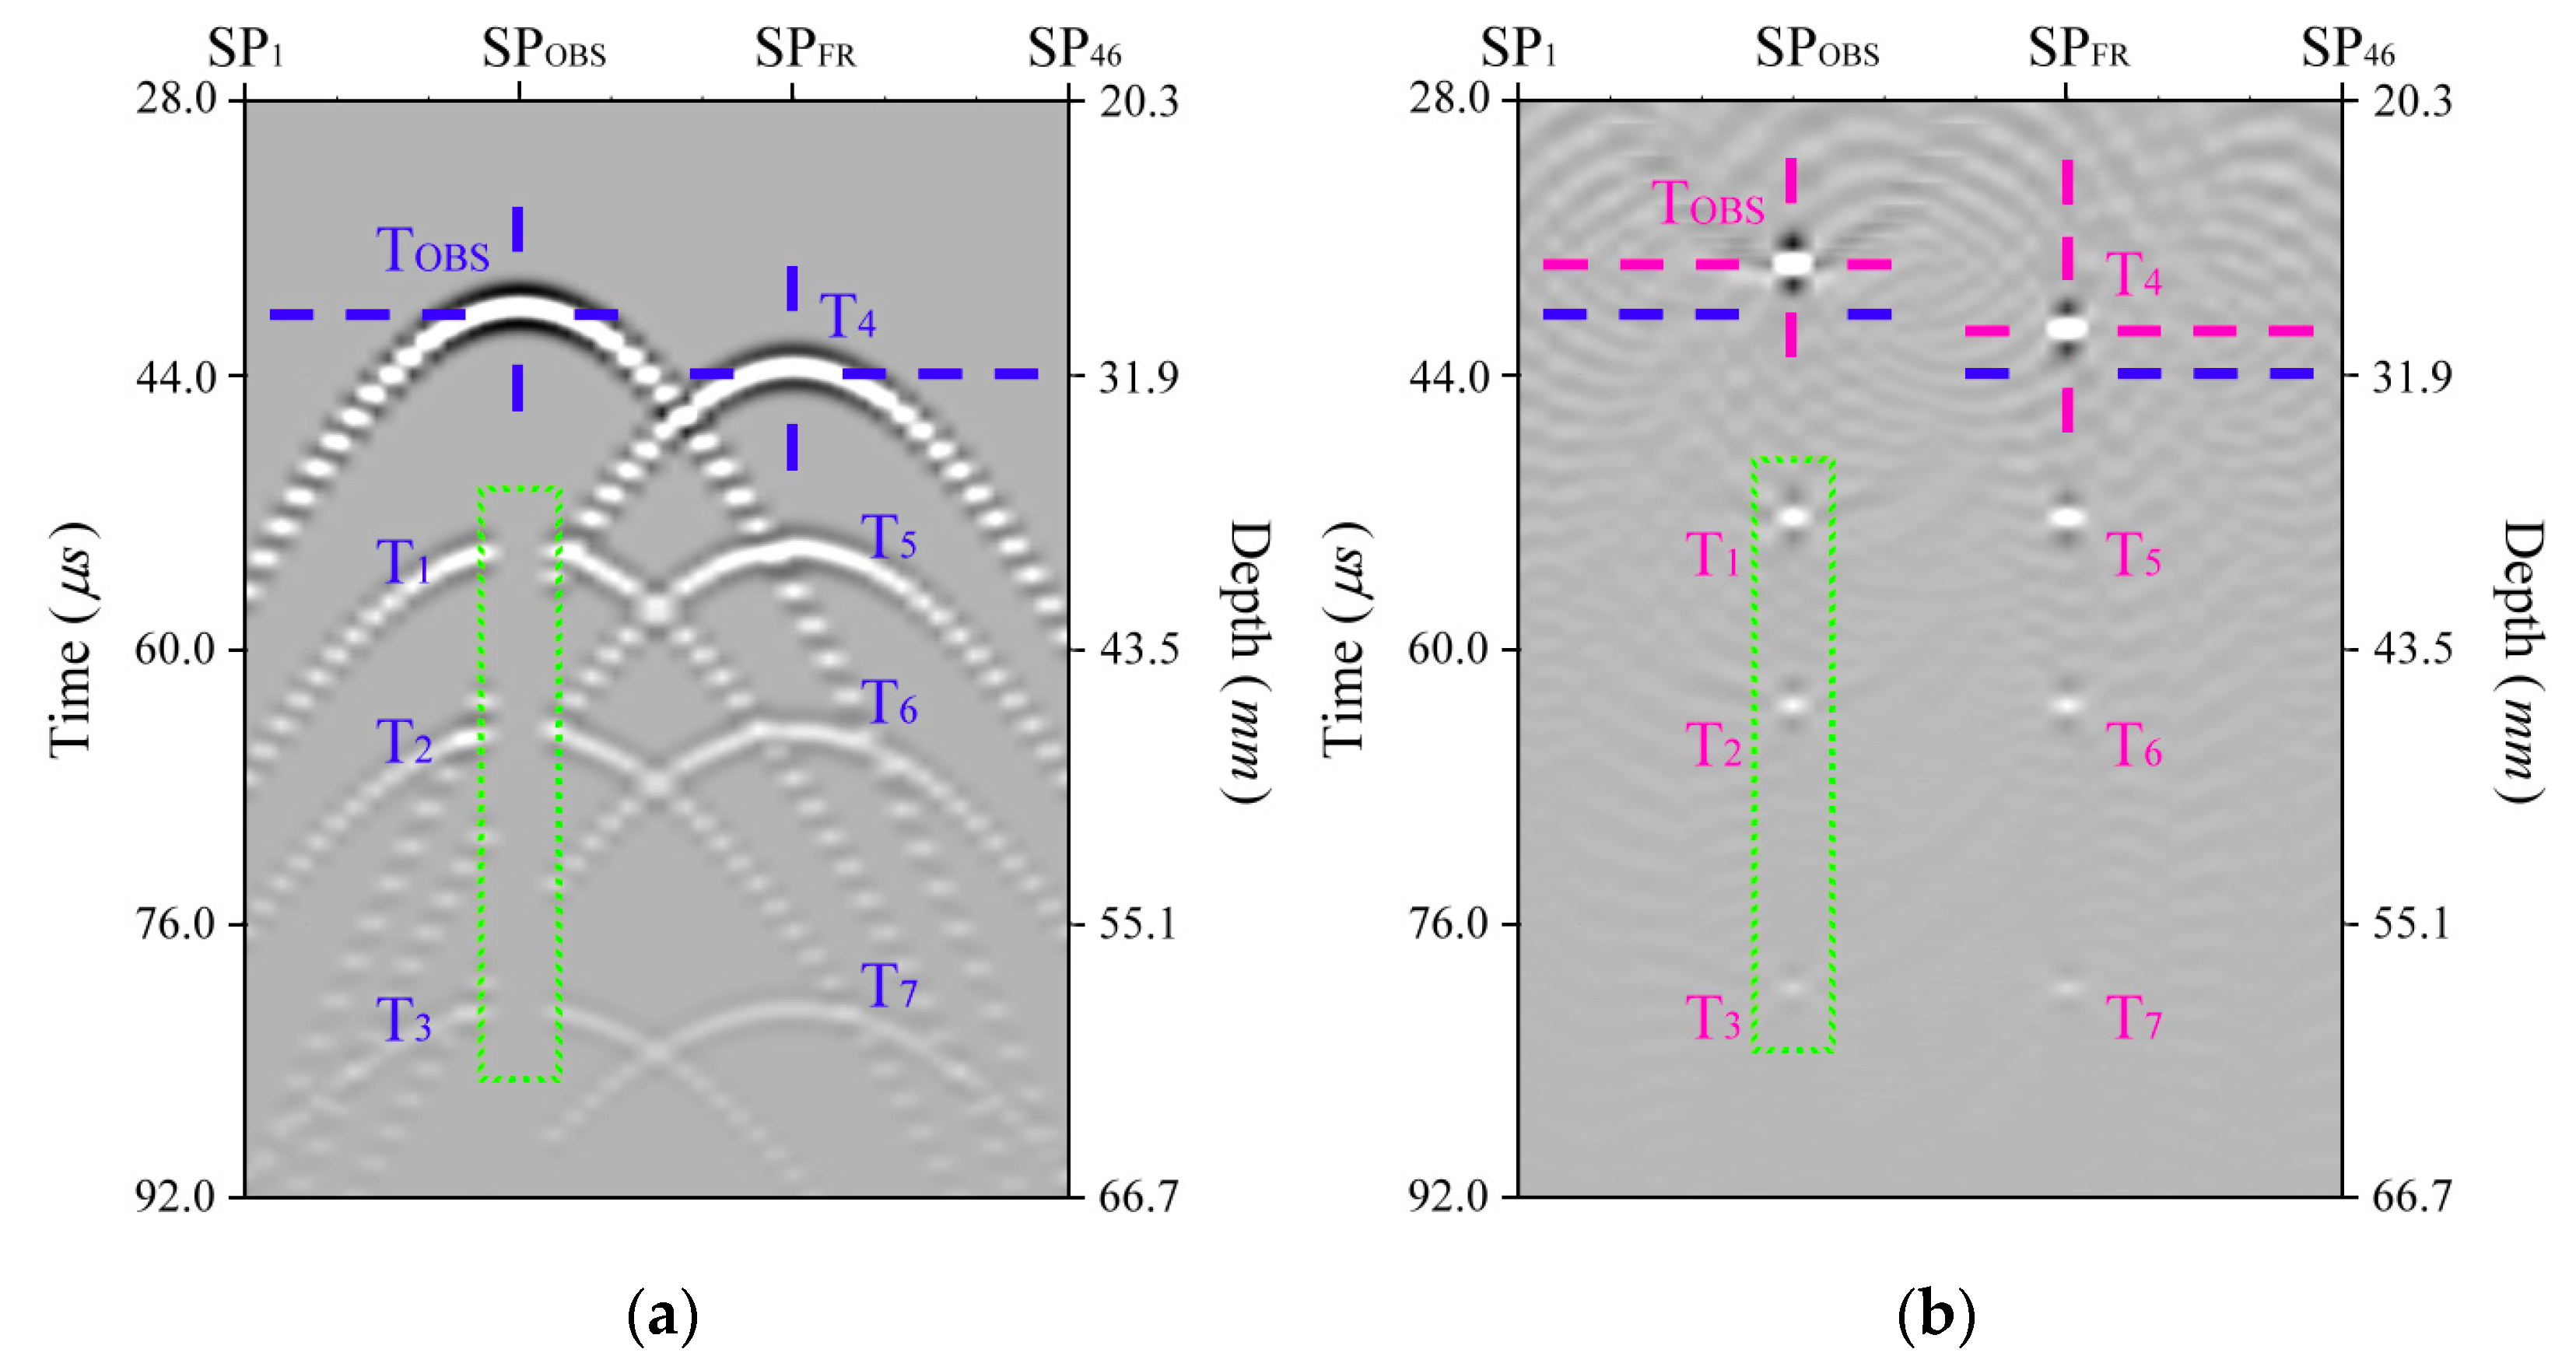
3.1. Synthetic Simulation
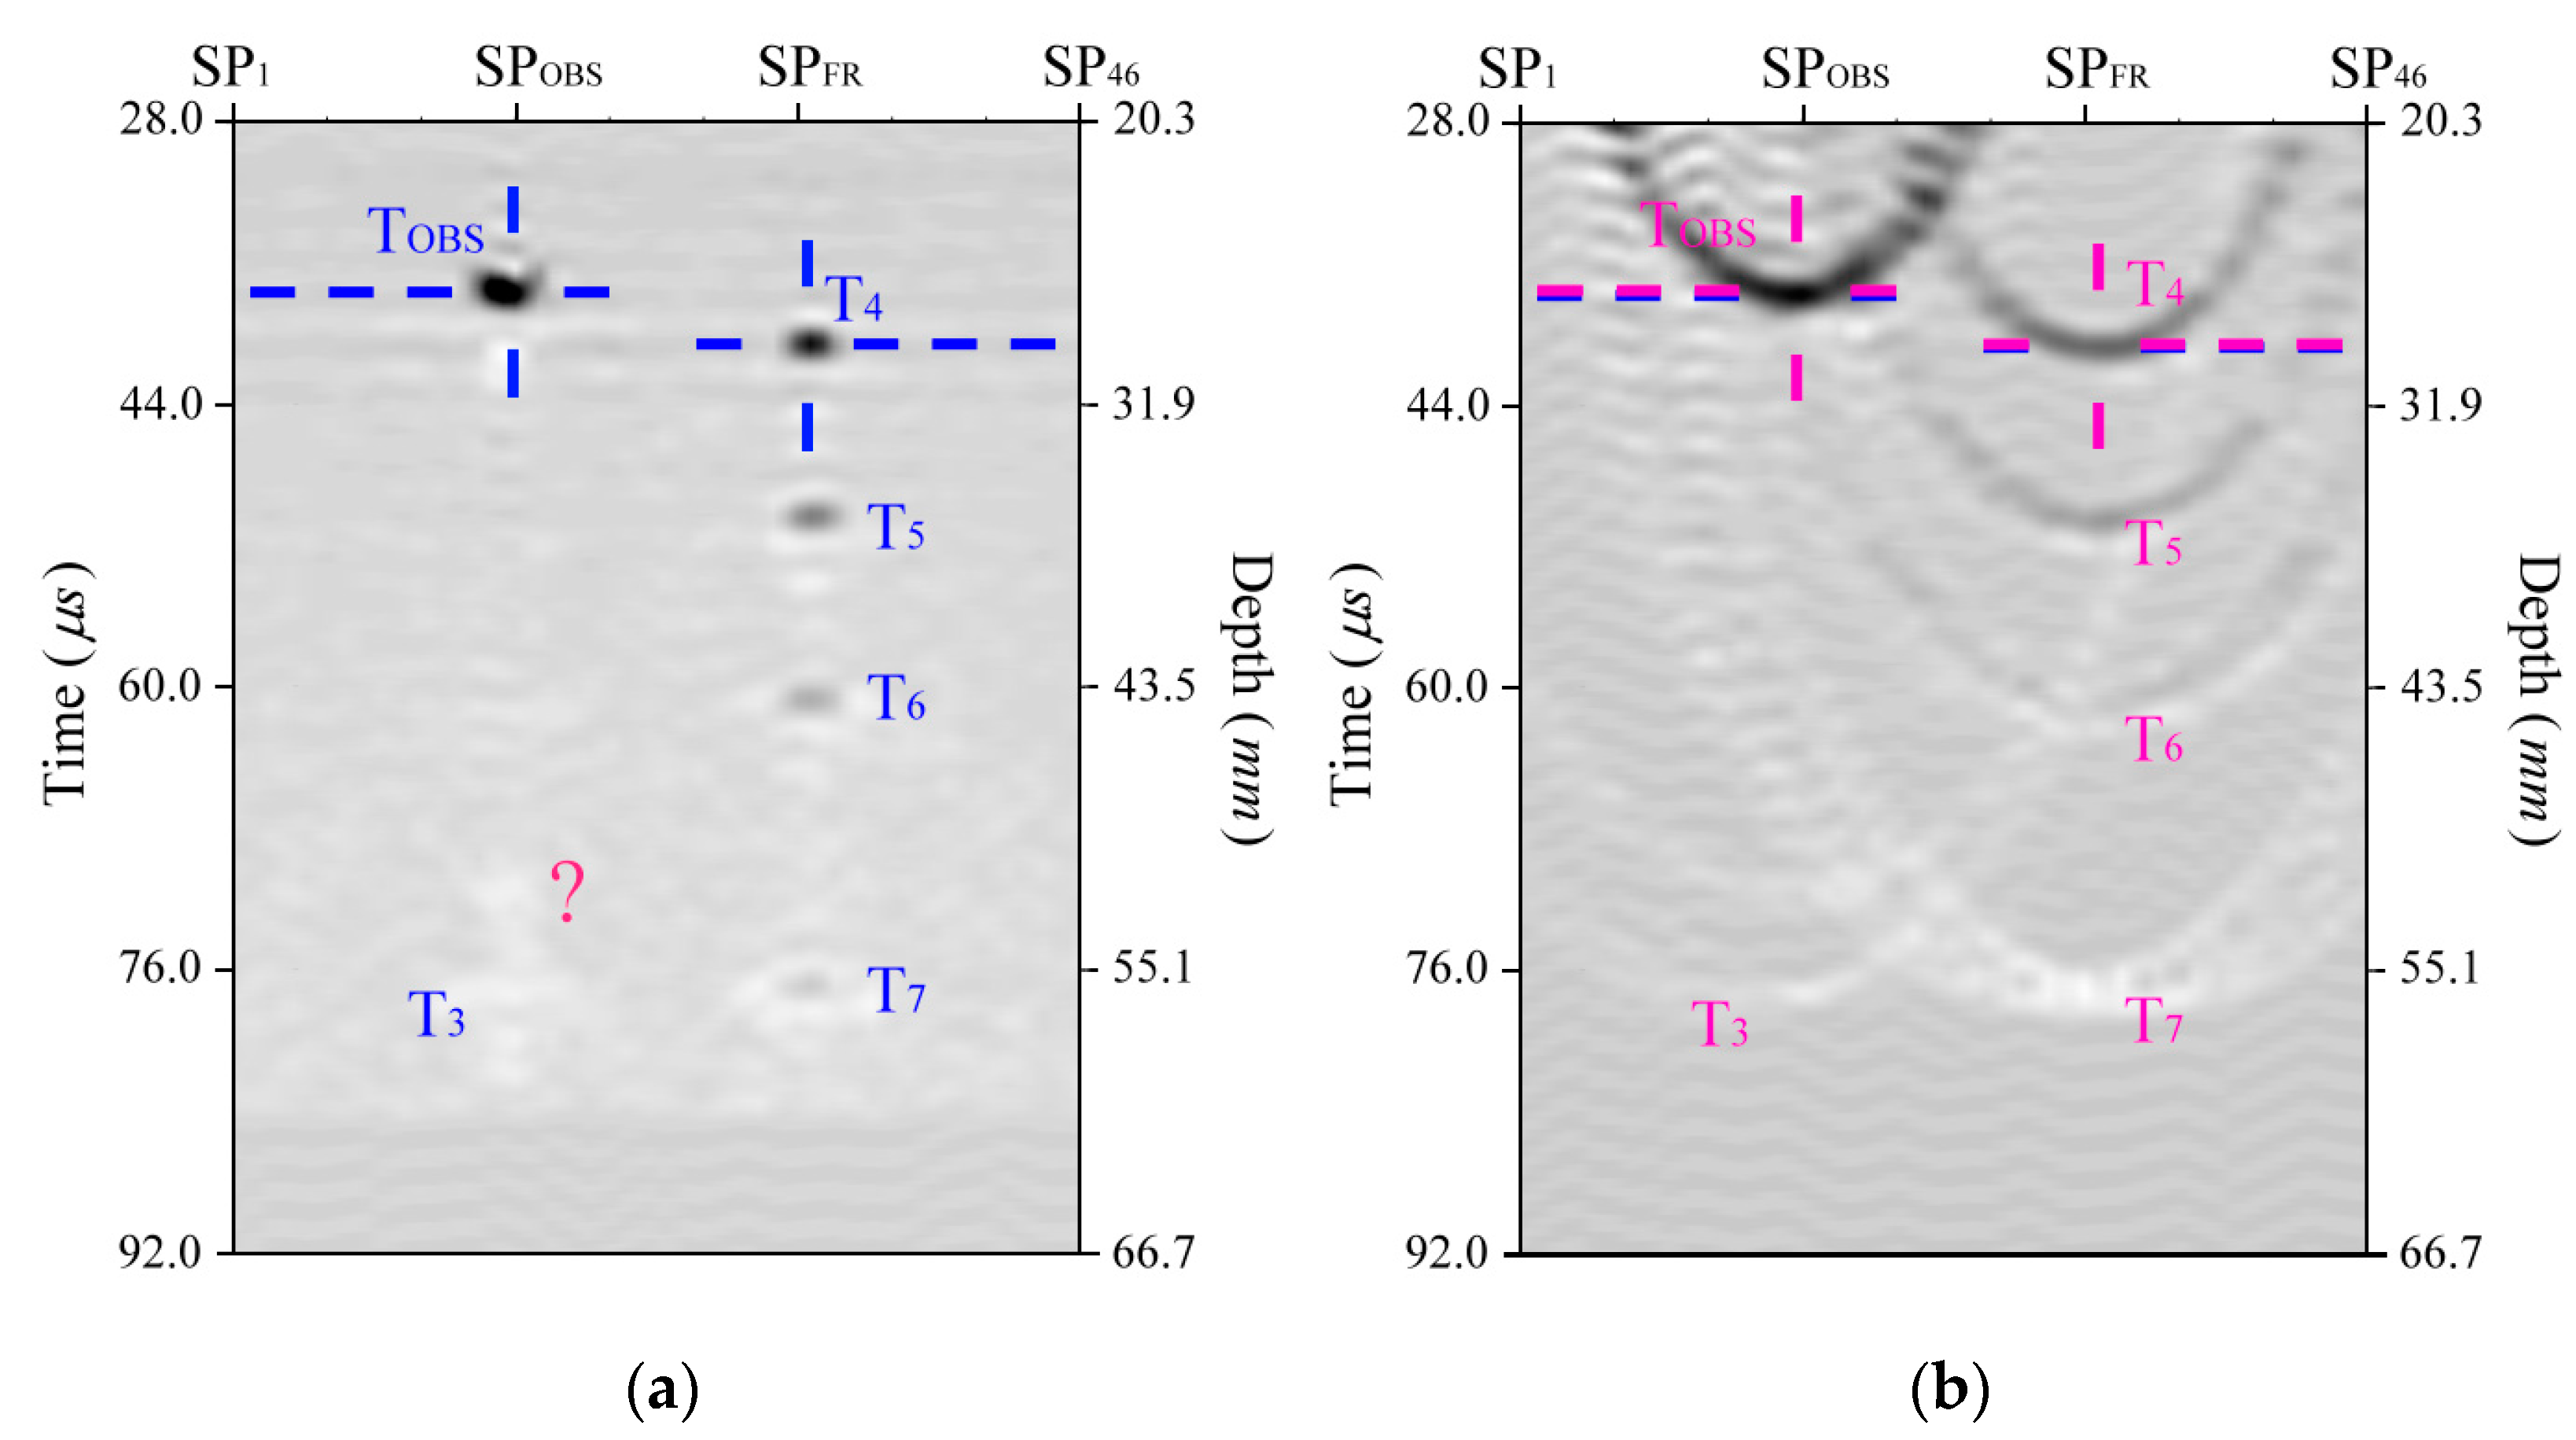
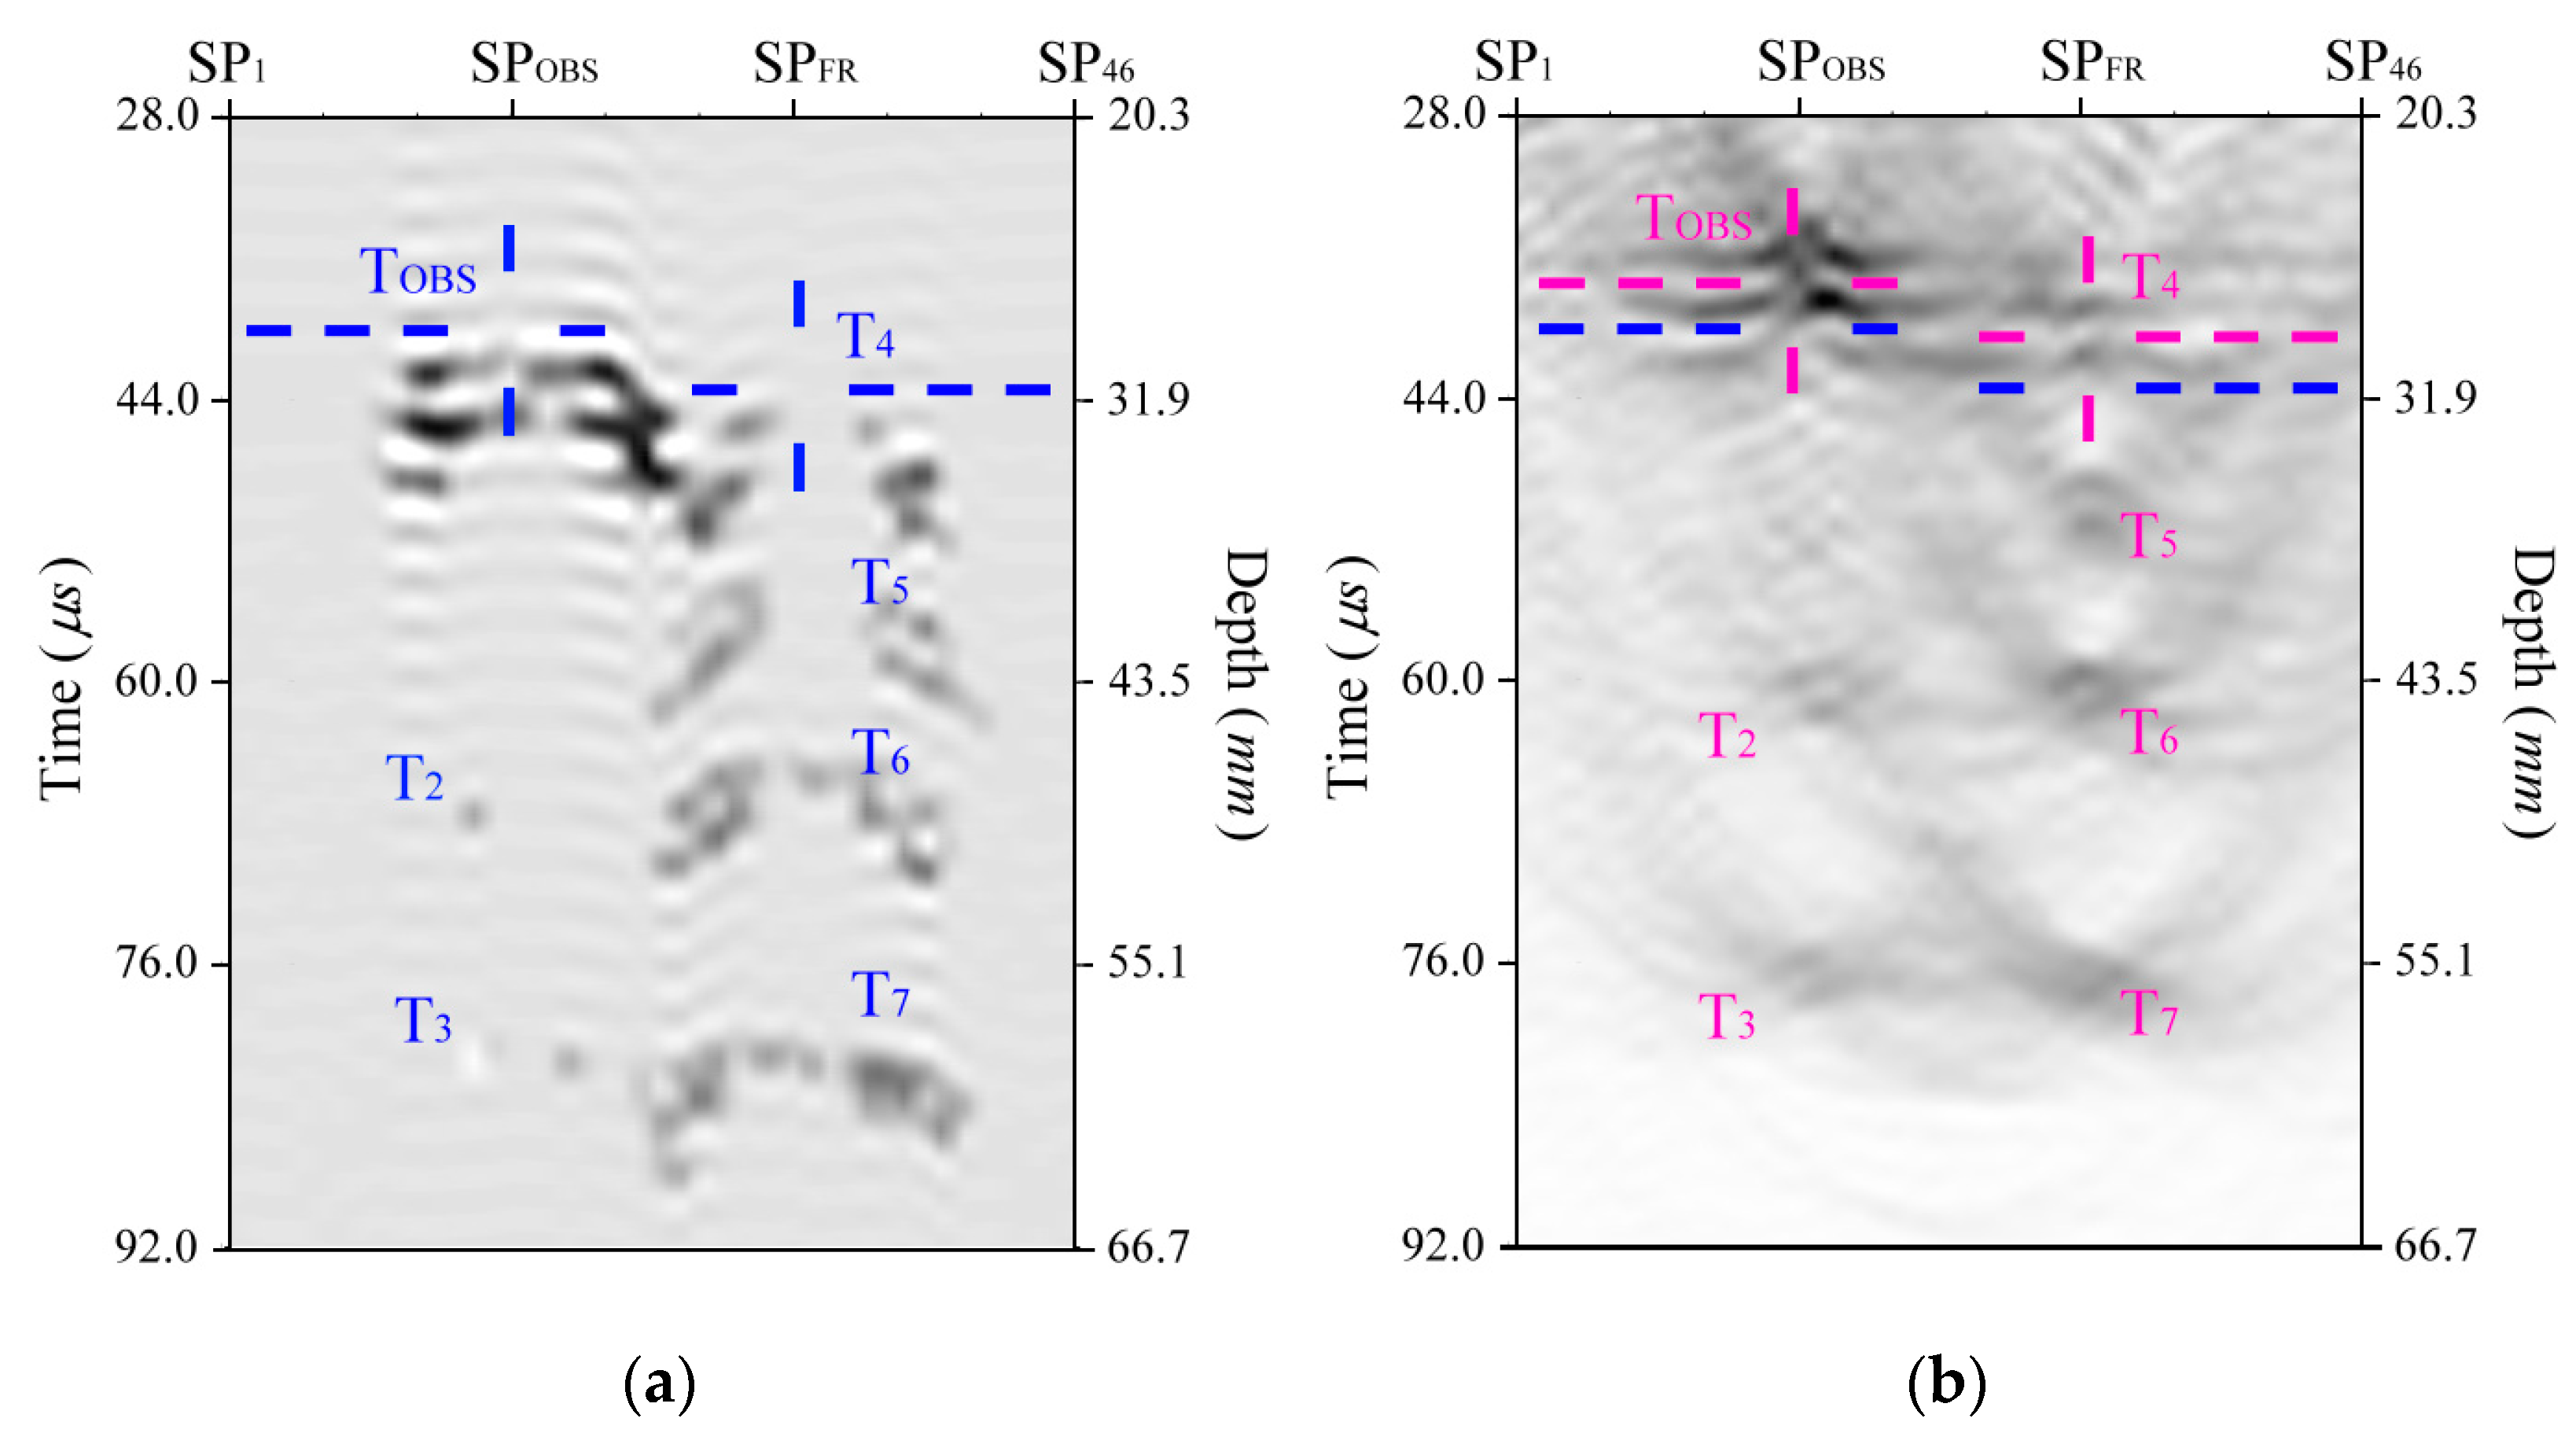
3.2. Experimental Results
4. Discussion
5. Conclusions
Author Contributions
Funding
Acknowledgments
Conflicts of Interest
References
- Kino, G.S. Acoustic Imaging for Nondestructive Evaluation. Proc. IEEE 1979, 67, 510–525. [Google Scholar] [CrossRef]
- Ruiz-Reyes, N.; Vera-Candeas, P.; Curpia’ án-Alonso, J.; Cuevas-Martı’nez, C.; Blanco-Claraco, J.L. High-resolution pursuit for detecting flaw echoes close to the material surface in ultrasonic NDT. NDTE Int. 2006, 39, 487–492. [Google Scholar] [CrossRef]
- Robinson, T.M. Basic principles of ultrasound. In Physics for Medical Imaging Applications; Springer: Dordrecht, The Netherlands, 2007; Volume 240, pp. 101–110. ISBN 978-1-4020-5649-9. [Google Scholar]
- Kremkau, F.W.; Taylor, K.J. Artifacts in ultrasound imaging. J. Ultrasound Med. 1986, 5, 227–237. [Google Scholar] [CrossRef]
- Hu, R.; Singla, R.; Deeba, F.; Rohling, R.N. Acoustic Shadow Detection: Study and Statistics of B-Mode and Radiofrequency Data. Ultrasound Med. Biol. 2019, 45, 2248–2257. [Google Scholar] [CrossRef] [PubMed]
- Dunmire, B.; Harper, J.D.; Cunitz, B.W.; Lee, F.C.; Hsi, R.; Liu, Z.; Bailey, M.R.; Sorensen, M.D. Use of the Acoustic Shadow Width to Determine Kidney Stone Size with Ultrasound. J. Urol. 2016, 195, 171–177. [Google Scholar] [CrossRef] [PubMed]
- Zhou, Z.; Wu, S.; Chang, K.J.; Chen, W.R.; Chen, Y.S.; Kuo, W.H.; Lin, C.C.; Tsui, P.H. Classification of Benign and Malignant Breast Tumors in Ultrasound Images with Posterior Acoustic Shadowing Using Half-Contour Features. J. Med. Biol. Eng. 2015, 35, 178–187. [Google Scholar] [CrossRef]
- Weinstein, S.P.; Conant, E.F.; Mies, C.; Acs, G.; Lee, S.; Sehgal, C. Posterior acoustic shadowing in benign breast lesions: Sonographic-pathologic correlation. J. Ultrasound Med. 2004, 23, 73–83. [Google Scholar] [CrossRef]
- Raza, S.; Goldkamp, A.L.; Chikarmane, S.A.; Birdwell, R.L. US of breast masses categorized as BI-RADS 3, 4, and 5: Pictorial review of factors influencing clinical management. Radiographics 2010, 30, 1199–1213. [Google Scholar] [CrossRef]
- Madabhushi, A.; Yang, P.; Rosen, M.; Weinstein, S. Distinguishing lesions from posterior acoustic shadowing in breast ultrasound via non-linear dimensionality reduction. In Proceedings of the 2006 International Conference of the IEEE Engineering in Medicine and Biology Society, New York, NY, USA, 30 August–3 September 2006; pp. 3070–3073. [Google Scholar]
- Park, H.J.; Kim, K.B. Extracting acoustic shadowing from ultrasound image using local difference. Indones. J. Electr. Eng. Comput. Sci. 2019, 13, 205–209. [Google Scholar] [CrossRef]
- Henderson, M.; Dolan, J. Challenges, solutions, and advances in ultrasound-guided regional anaesthesia. BJA Educ. 2016, 16, 374–380. [Google Scholar] [CrossRef] [Green Version]
- Rani, S.; Jindal, S.; Kaur, B. A Brief Review on Image Restoration Techniques. Int. J. Comput. Appl. 2016, 150, 30–33. [Google Scholar] [CrossRef]
- Abbas, R.F. Review on Some Methods used in Image Restoration. Int. Multidiscip. Res. J. 2020, 10, 13–16. [Google Scholar] [CrossRef]
- Hoegh, K.; Khazanovich, L. Extended synthetic aperture focusing technique for ultrasonic imaging of concrete. NDT E Int. 2015, 74, 33–42. [Google Scholar] [CrossRef]
- Hartzog, H.R. The NDT Technician: Multiple-Transducer Ultrasonic Techniques. NDT Tech. 2017, 6, 4. [Google Scholar]
- Drukker, K.; Giger, M.L.; Mendelson, E.B. Computerized analysis of shadowing on breast ultrasound for improved lesion detection. Med. Phys. 2003, 30, 1833–1842. [Google Scholar] [CrossRef] [PubMed]
- Ultrasonic Transducers. Available online: https://sintrol.fi/wp-content/uploads/2019/10/Ultraaaniluotaimet.pdf (accessed on 2 September 2022).
- Model 5058PR High Voltage Pulser-Receiver. Available online: http://cdn-docs.av-iq.com/dataSheet/5058PR_Datasheet.pdf (accessed on 2 September 2022).
- DPO3000 Series Digital Phosphor OscilloscopesZZZ. User Manual. Available online: https://www.csus.edu/indiv/t/tatror/eee_117_lab/3017_test_equipment/dpo3014%20user%20guide.pdf (accessed on 2 September 2022).
- Busse, L.J.; Collins, H.D.; Doctor, S.R. Review and Discussion of the Development of Synthetic Aperture Focusing Technique for Ultrasonic Testing (SAFT-UT); NUREGKR-3625; Pacific Northwest Lab.: Richland, WA, USA, 1984. [Google Scholar] [CrossRef]
- Karaman, M.; Li, P.C.; O’Donnell, M. Synthetic aperture imaging for small scale systems. IEEE Trans. Ultrason. Ferroelectr. Freq. Control. 1995, 42, 429–442. [Google Scholar] [CrossRef]
- Schmitz, V.; Chakhlov, S.; Müller, W. Experiences with synthetic aperture focusing in the field. Ultrasonics 2000, 38, 731–738. [Google Scholar] [CrossRef]
- Jensen, J.A.; Nikolov, S.I. Synthetic aperture ultrasound imaging. Ultrasonics 2006, 44, e5–e15. [Google Scholar] [CrossRef]
- Chang, C.H.; Chang, Y.F.; Ma, Y.; Shung, K.K. Reliable estimation of virtual source position for SAFT imaging. IEEE Trans. Ultrason. Ferroelectr. Freq. Control. 2013, 60, 356–363. [Google Scholar] [CrossRef]
- Levin, F.K. Apparent velocity from dipping interface reflections. Geophysics 1971, 36, 467–618. [Google Scholar] [CrossRef]
- Transducer Beam Spread. Available online: https://www.nde-ed.org/NDETechniques/Ultrasonics/EquipmentTrans/beamspread.xhtml (accessed on 31 August 2022).
- Understanding How Frequency, Beam Patterns of Transducers, and Reflection Characteristics of Targets Affect the Performance of Ultrasonic Sensors. Available online: https://www.massa.com/wp-content/uploads/2018/06/Massa-Whitepaper-3-DPM-160621.pdf (accessed on 31 August 2022).
- Bracewell, R.N. The Fourier Transform and Its Application; McGraw-Hill Book Co., Inc.: New York, NY, USA, 1986. [Google Scholar]
- Hwang, Y.K.; Ritsema, J.; van Keken, P.E.; Goes, S.; Styles, E. Wavefront healing renders deep plumes seismically invisible. Geophys. J. Int. 2011, 187, 273–277. [Google Scholar] [CrossRef] [Green Version]


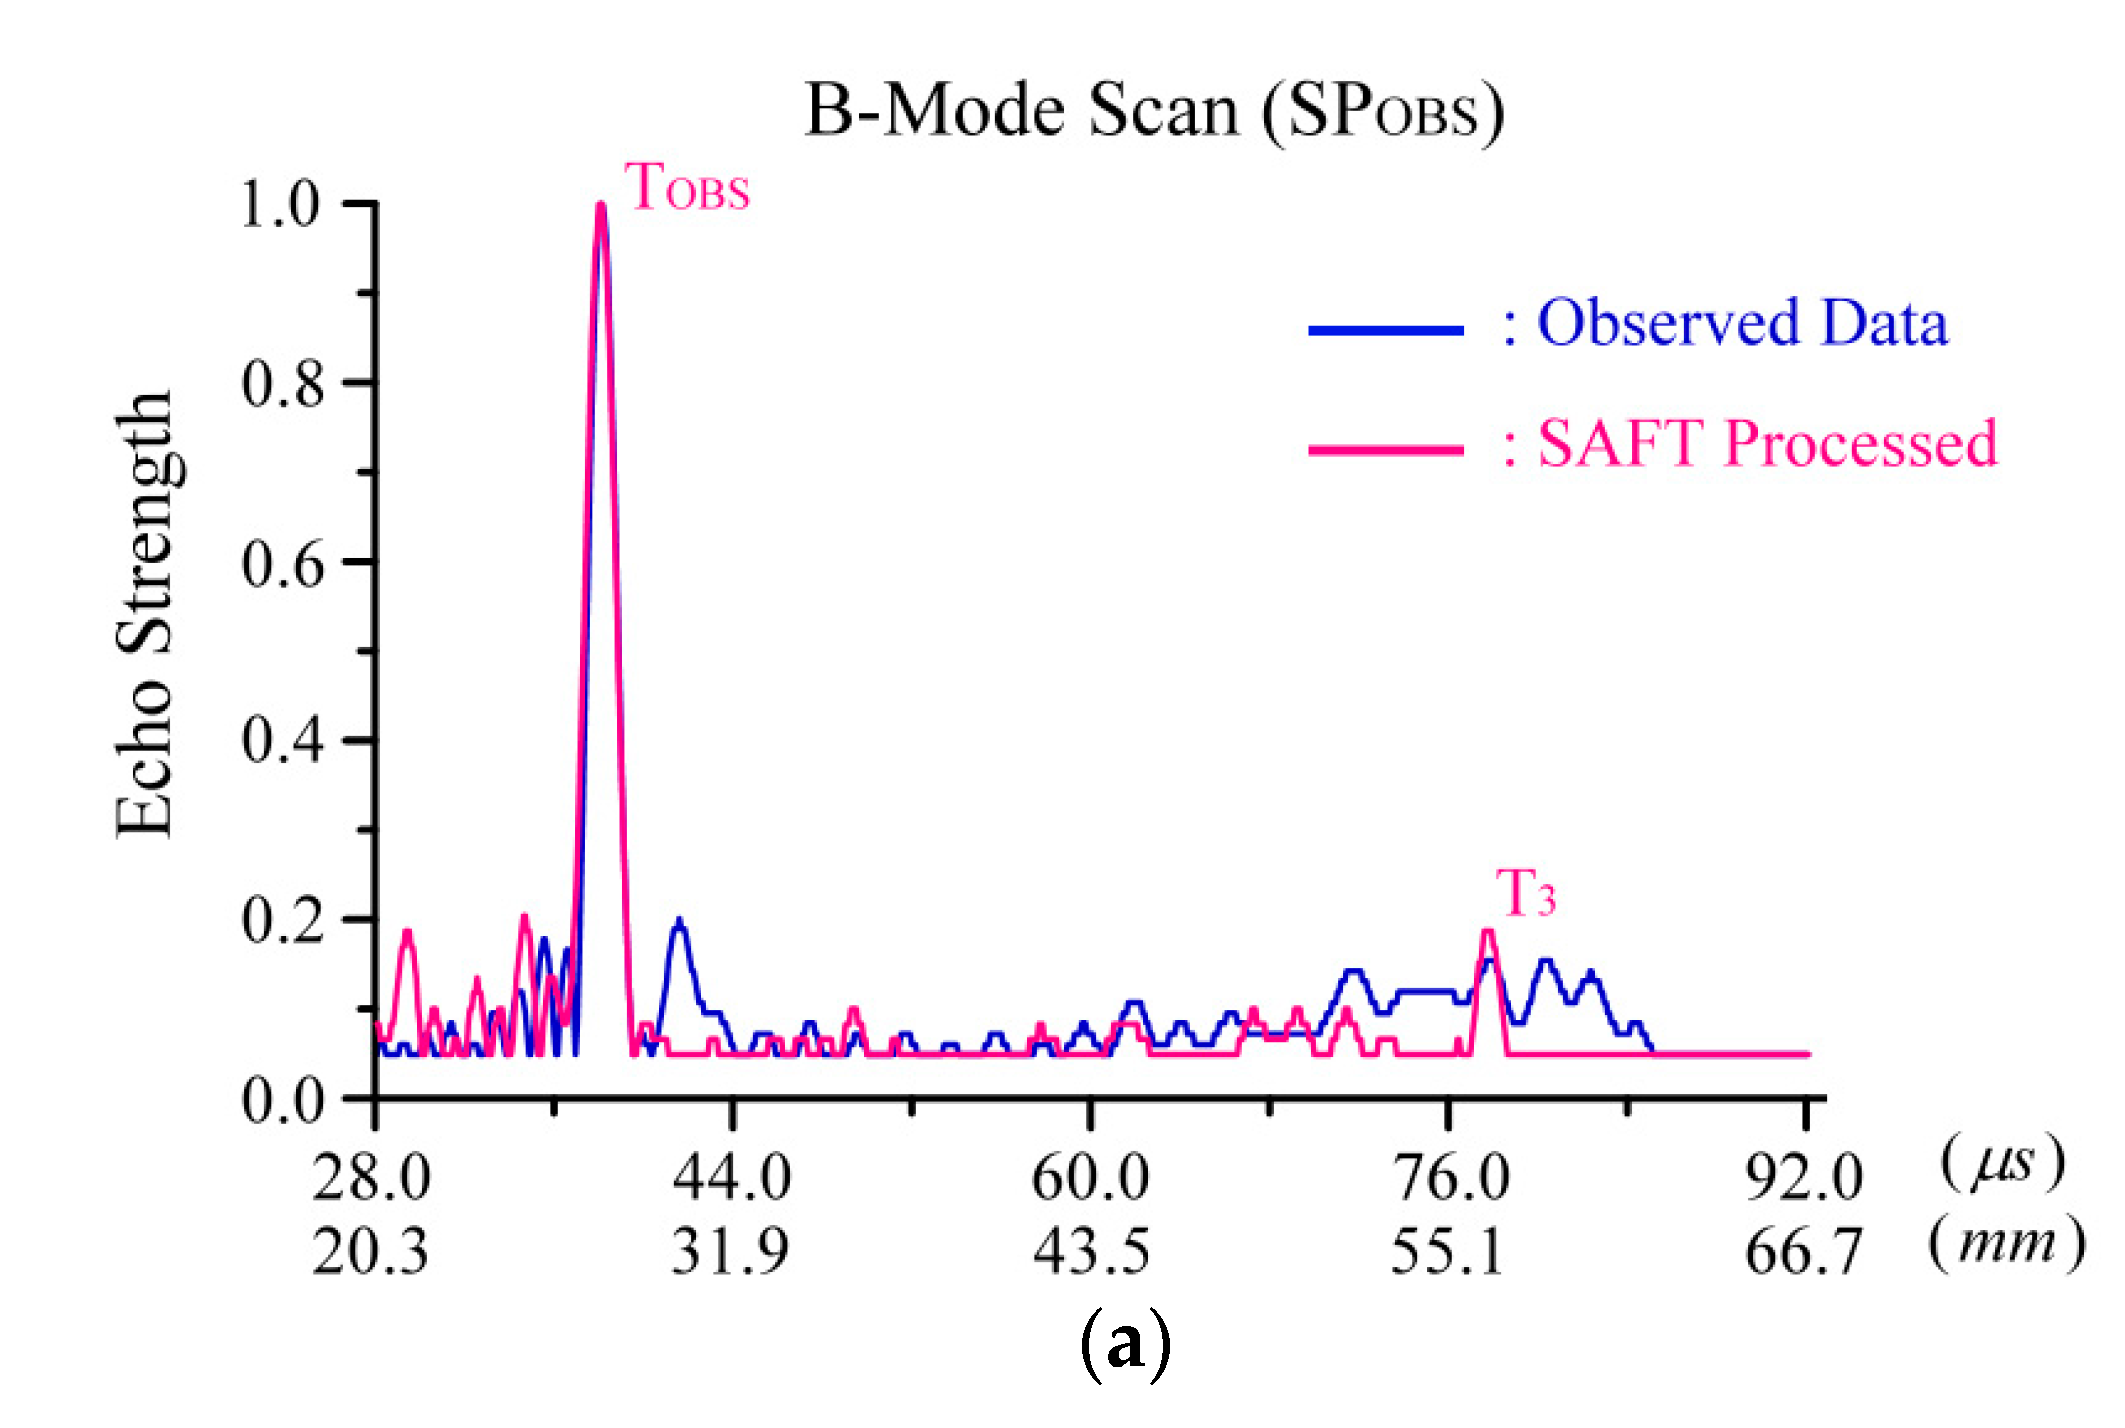
| B-Mode Scan | |||
|---|---|---|---|
| SPOBS | SPFR | ||
| TOBS 30.0/27.25 (mm) | 41.3/37.5 (μs) 27.5/27.2 (mm) | 40.8/40.7 (μs) 29.6/29.5 (mm) | T4 30.0/29.65 (mm) |
| T1 38.0/37.65 (mm) | 48.7/48.7 (μs) 36.8/36.8 (mm) | T5 38.0/37.65 (mm) | |
| T2 46/45.65 (mm) | 61.1/61.1 (μs) 44.3/44.3 (mm) | T6 46/45.65 (mm) | |
| T3 58/57.65 (mm) | 77.6/80.0 (μs) 56.3/58.0 (mm) | 78.1/80.2 (μs) 56.7/58.1 (mm) | T7 58/57.65 (mm) |
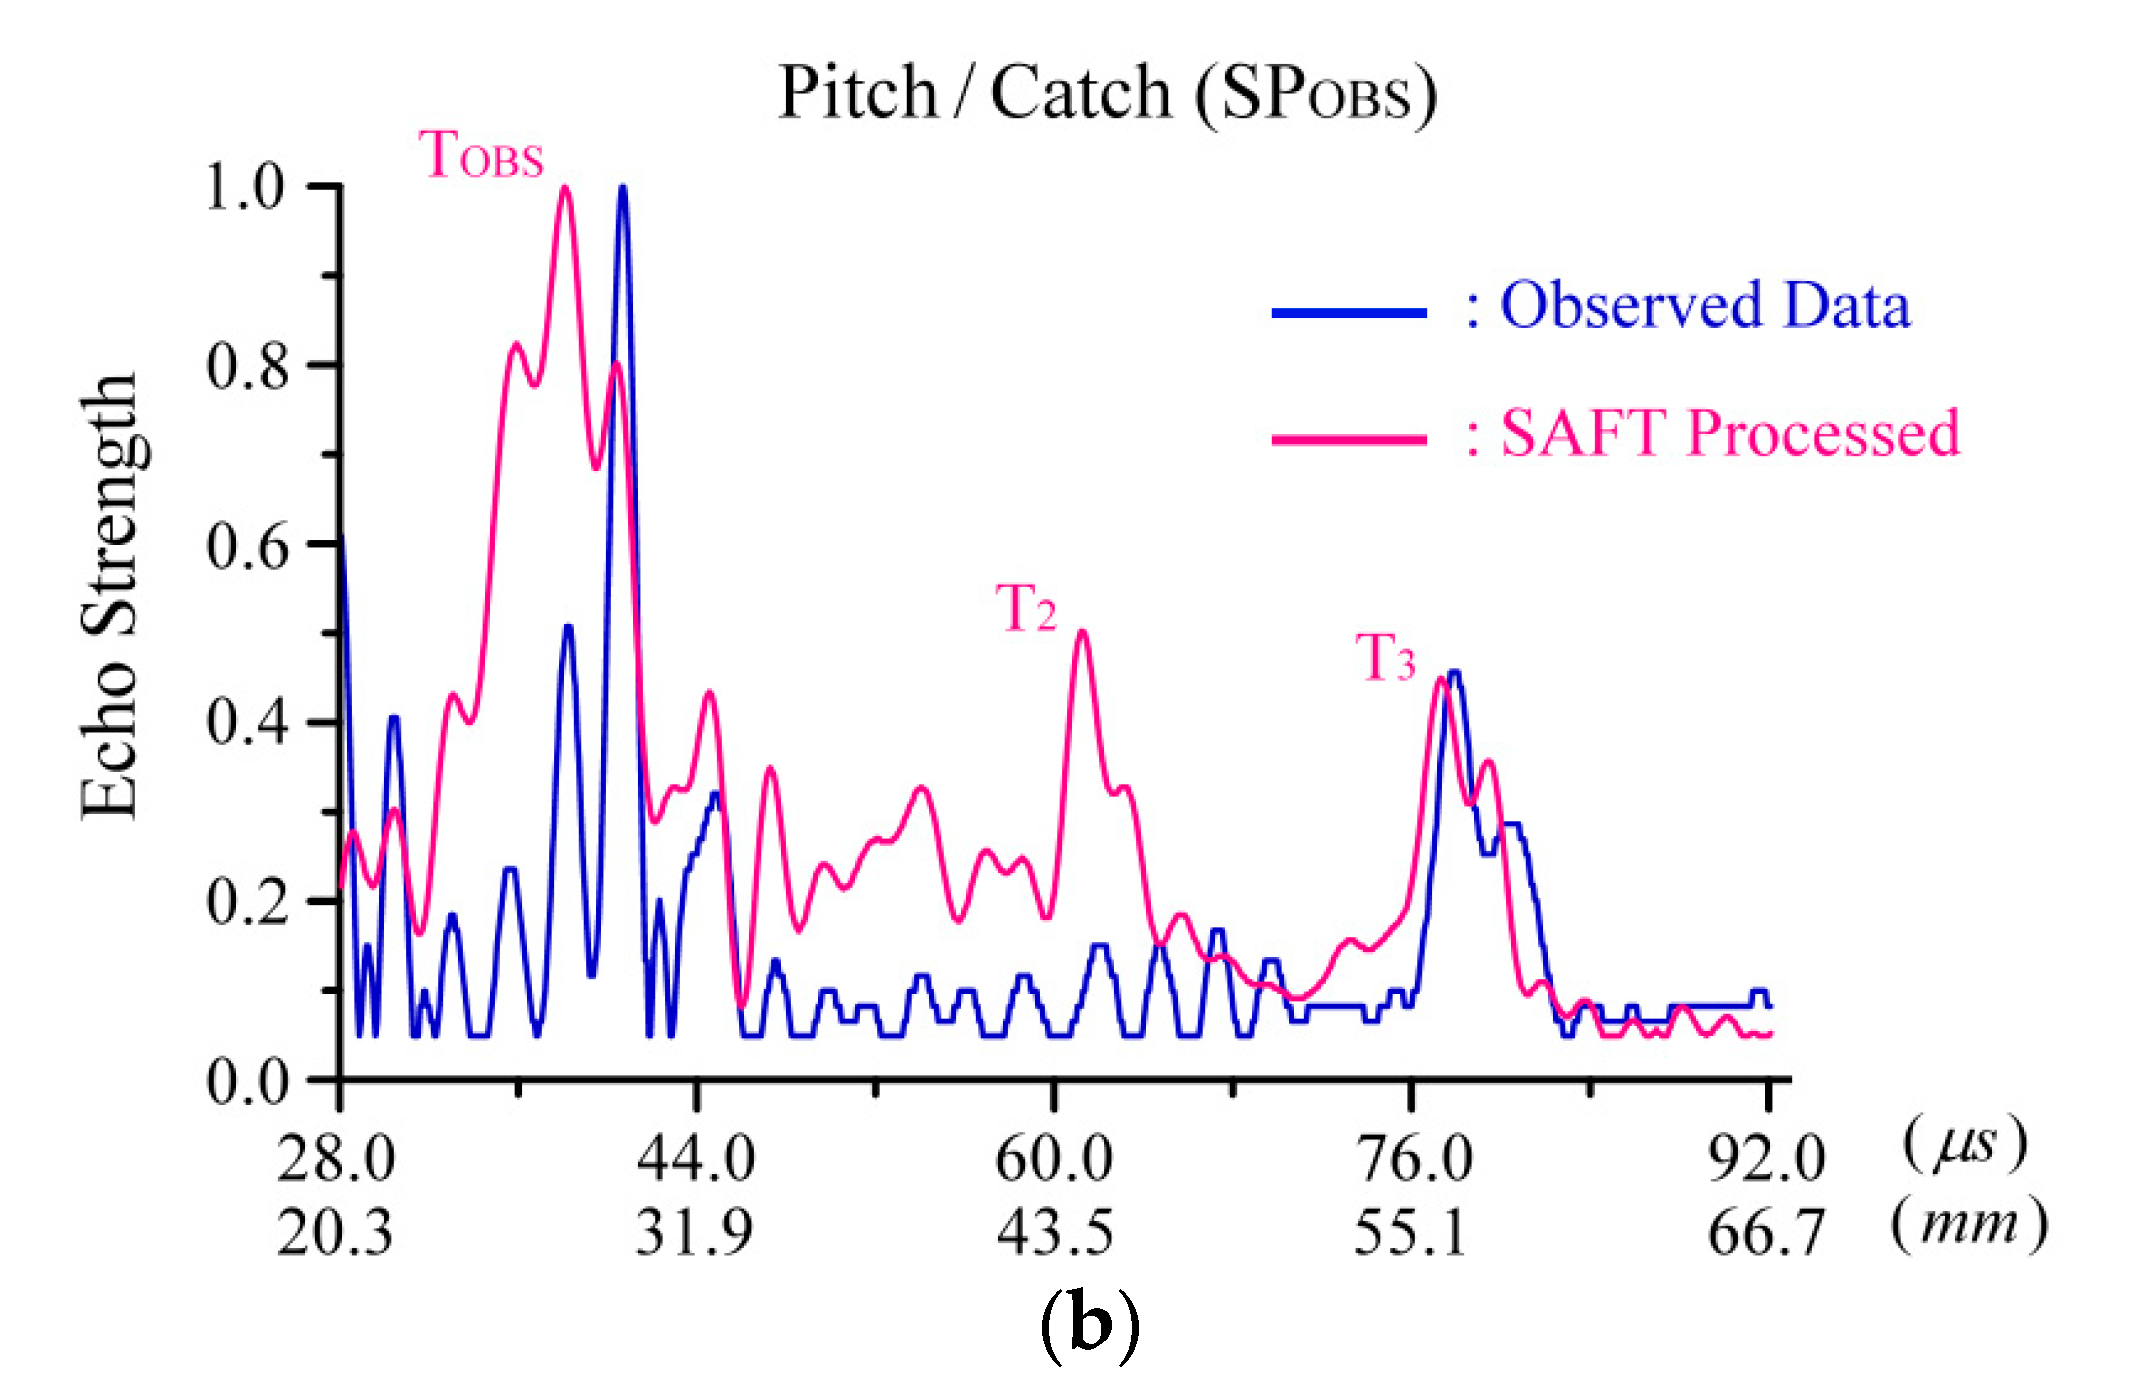
| Pitch/Catch Scan | |||
|---|---|---|---|
| SPOBS | SPFR | ||
| TOBS 30.0/27.25 (mm) | 40.1/37.7 (μs) 29.1/27.3 (mm) | 43.5/41.7 (μs) 31.6/30.2 (mm) | T4 30.0/27.25 (mm) |
| T1 38.0/37.65 (mm) | 53.5/51.6 (μs) 38.8/37.4 (mm) | T5 38.0/37.65 (mm) | |
| T2 46/45.65 (mm) | 63.3/60.8 (μs) 46.1/44.1 (mm) | 63.6/61.9 (μs) 46.1/44.9 (mm) | T6 46/45.65 (mm) |
| T3 58/57.65 (mm) | 79.8/77.5 (μs) 57.8/56.2 (mm) | 81.1/81.0 (μs) 5.8/58.8 (mm) | T7 58/57.65 (mm) |
Publisher’s Note: MDPI stays neutral with regard to jurisdictional claims in published maps and institutional affiliations. |
© 2022 by the authors. Licensee MDPI, Basel, Switzerland. This article is an open access article distributed under the terms and conditions of the Creative Commons Attribution (CC BY) license (https://creativecommons.org/licenses/by/4.0/).
Share and Cite
Huang, K.-Y.; Chang, C.-H.; Chang, Y.-F.; Liu, J.-W.; Chang, J.-W. The Feasibility of Shadowed Image Restoration Using the Synthetic Aperture Focusing Technique. Appl. Sci. 2022, 12, 9297. https://doi.org/10.3390/app12189297
Huang K-Y, Chang C-H, Chang Y-F, Liu J-W, Chang J-W. The Feasibility of Shadowed Image Restoration Using the Synthetic Aperture Focusing Technique. Applied Sciences. 2022; 12(18):9297. https://doi.org/10.3390/app12189297
Chicago/Turabian StyleHuang, Kuo-Yuan, Chih-Hsiung Chang, Young-Fo Chang, Jia-Wei Liu, and Jer-Wei Chang. 2022. "The Feasibility of Shadowed Image Restoration Using the Synthetic Aperture Focusing Technique" Applied Sciences 12, no. 18: 9297. https://doi.org/10.3390/app12189297