3.1. Testing Results
The experiment was carried out by varying the
and
, which are the weight for
and TV terms. Other parameters, such as the number of epochs and the dataset, will be equalized. The number of paired data used was 1365, divided into training and validation datasets. The selection of the validation dataset was done randomly and the number of datasets to be used for validation was 10. This number is relatively very small because the GAN generative model requires a lot of data for the training process. In some references, the paired data used in the training process number from tens to tens of thousands [
7,
10,
11,
12,
28]. Therefore, in the experiment, we maximized the number of paired data for the training process; the cGAN-TV results can be seen clearly and analyzed correctly. In addition, we also prepared 68 testing datasets containing images of real Indonesian people obtained from photographs of students from the Department of Electrical Engineering, University of Indonesia, and several images from compiled datasets. The 68-testing dataset was used because it refers to the GAN study conducted by Chen et al. [
21] where they used 5% testing of the total training data.
The training stage took approximately two hours and was carried out for 40,000 epochs, where, for every 1000 epochs, we displayed the temporary results of the cGAN-TV using one of the validation sketch images. This aimed to monitor the progress of the cGAN-TV more efficiently so that the training process could be manually stopped if it produced unexpected results, such as over smoothing.
The training process for each scenario was carried out one by one, and after each model was saved, the SSIM and FID values were calculated. The test results for each scenario can be seen in
Table 3. The eleven scenarios were carried out in three phases. The first phase (a–f) aimed to find the optimal value of
, in which the
was set to a small value to avoid the over-smoothing effect. After we achieved the optimal
, then we stepped into the second phase (g–j) to find the optimal
with the constant
optimal value. The last stage was to test any higher
and
values. The visual results of each scenario can be seen in
Figure 3.
It should be noted that the SSIM value was calculated by comparing the grayscale structure of the image generated by the generator and the original image of the sketch. In comparison, the FID value was achieved by comparing the two distributions of the entire validation image generator with the distribution of all the original images. The color difference in the image would greatly affect the FID value while having no impact on the SSIM value. Therefore, every time an evaluation was carried out, the SSIM would not change, while the FID would always change because the generator results would generate random background and skin tones.
Based on the test results, it can be seen that the effect of
was very significant on the SSIM and FID values. The lowest SSIM value was 0.695, found in the scenario, with a very small
value of 0.01, and the largest FID value was achieved in scenario c, where the
value was 1. However, when the
value was too large, it appears that the SSIM value was actually decreased, and the FID value increased. This is due to overfitting, and the model could not generalize properly. In scenario e, the SSIM value was 0.834, and the FID value was 94.705. When the
value increased to 150 with the same
value in scenario f, the SSIM dropped to 0.809, while the FID increased to 97.285. The
value also had a significant impact, as seen in scenarios e and g, where the SSIM value increased to 0.834 from 0.815, and the FID value decreased to 94.705 from 97.078. In addition, from scenario g, which used the cGAN (pix2pix) method [
8], we conclude that the TV term contributed to better visual results than that of the
term only (cGAN). The cGAN-generated image contained artifacts around the mouth and uneven skin tone. This shows that our proposed method successfully improved the baseline method.
From the eleven scenarios that were carried out, scenario e produced the best evaluation value, with the
= 100, and
= 0.00001.
Figure 4 shows the resulting photo images of the best scenario of cGAN-TV.
Table 4 shows the SSIM and FID evaluation values from the validation and testing datasets. It can be observed that the SSIM value generated from the testing dataset was 0.06 lower than that of the validation dataset. The obtained FID value was also higher than that of the validation dataset. This is because the photo images in the testing dataset came from real data and had never been seen before by the model. Meanwhile, the validation data was collected from the same source as the training dataset. The validation and training datasets had the same face size, head position, and lighting. While the test dataset had a slightly different configuration.
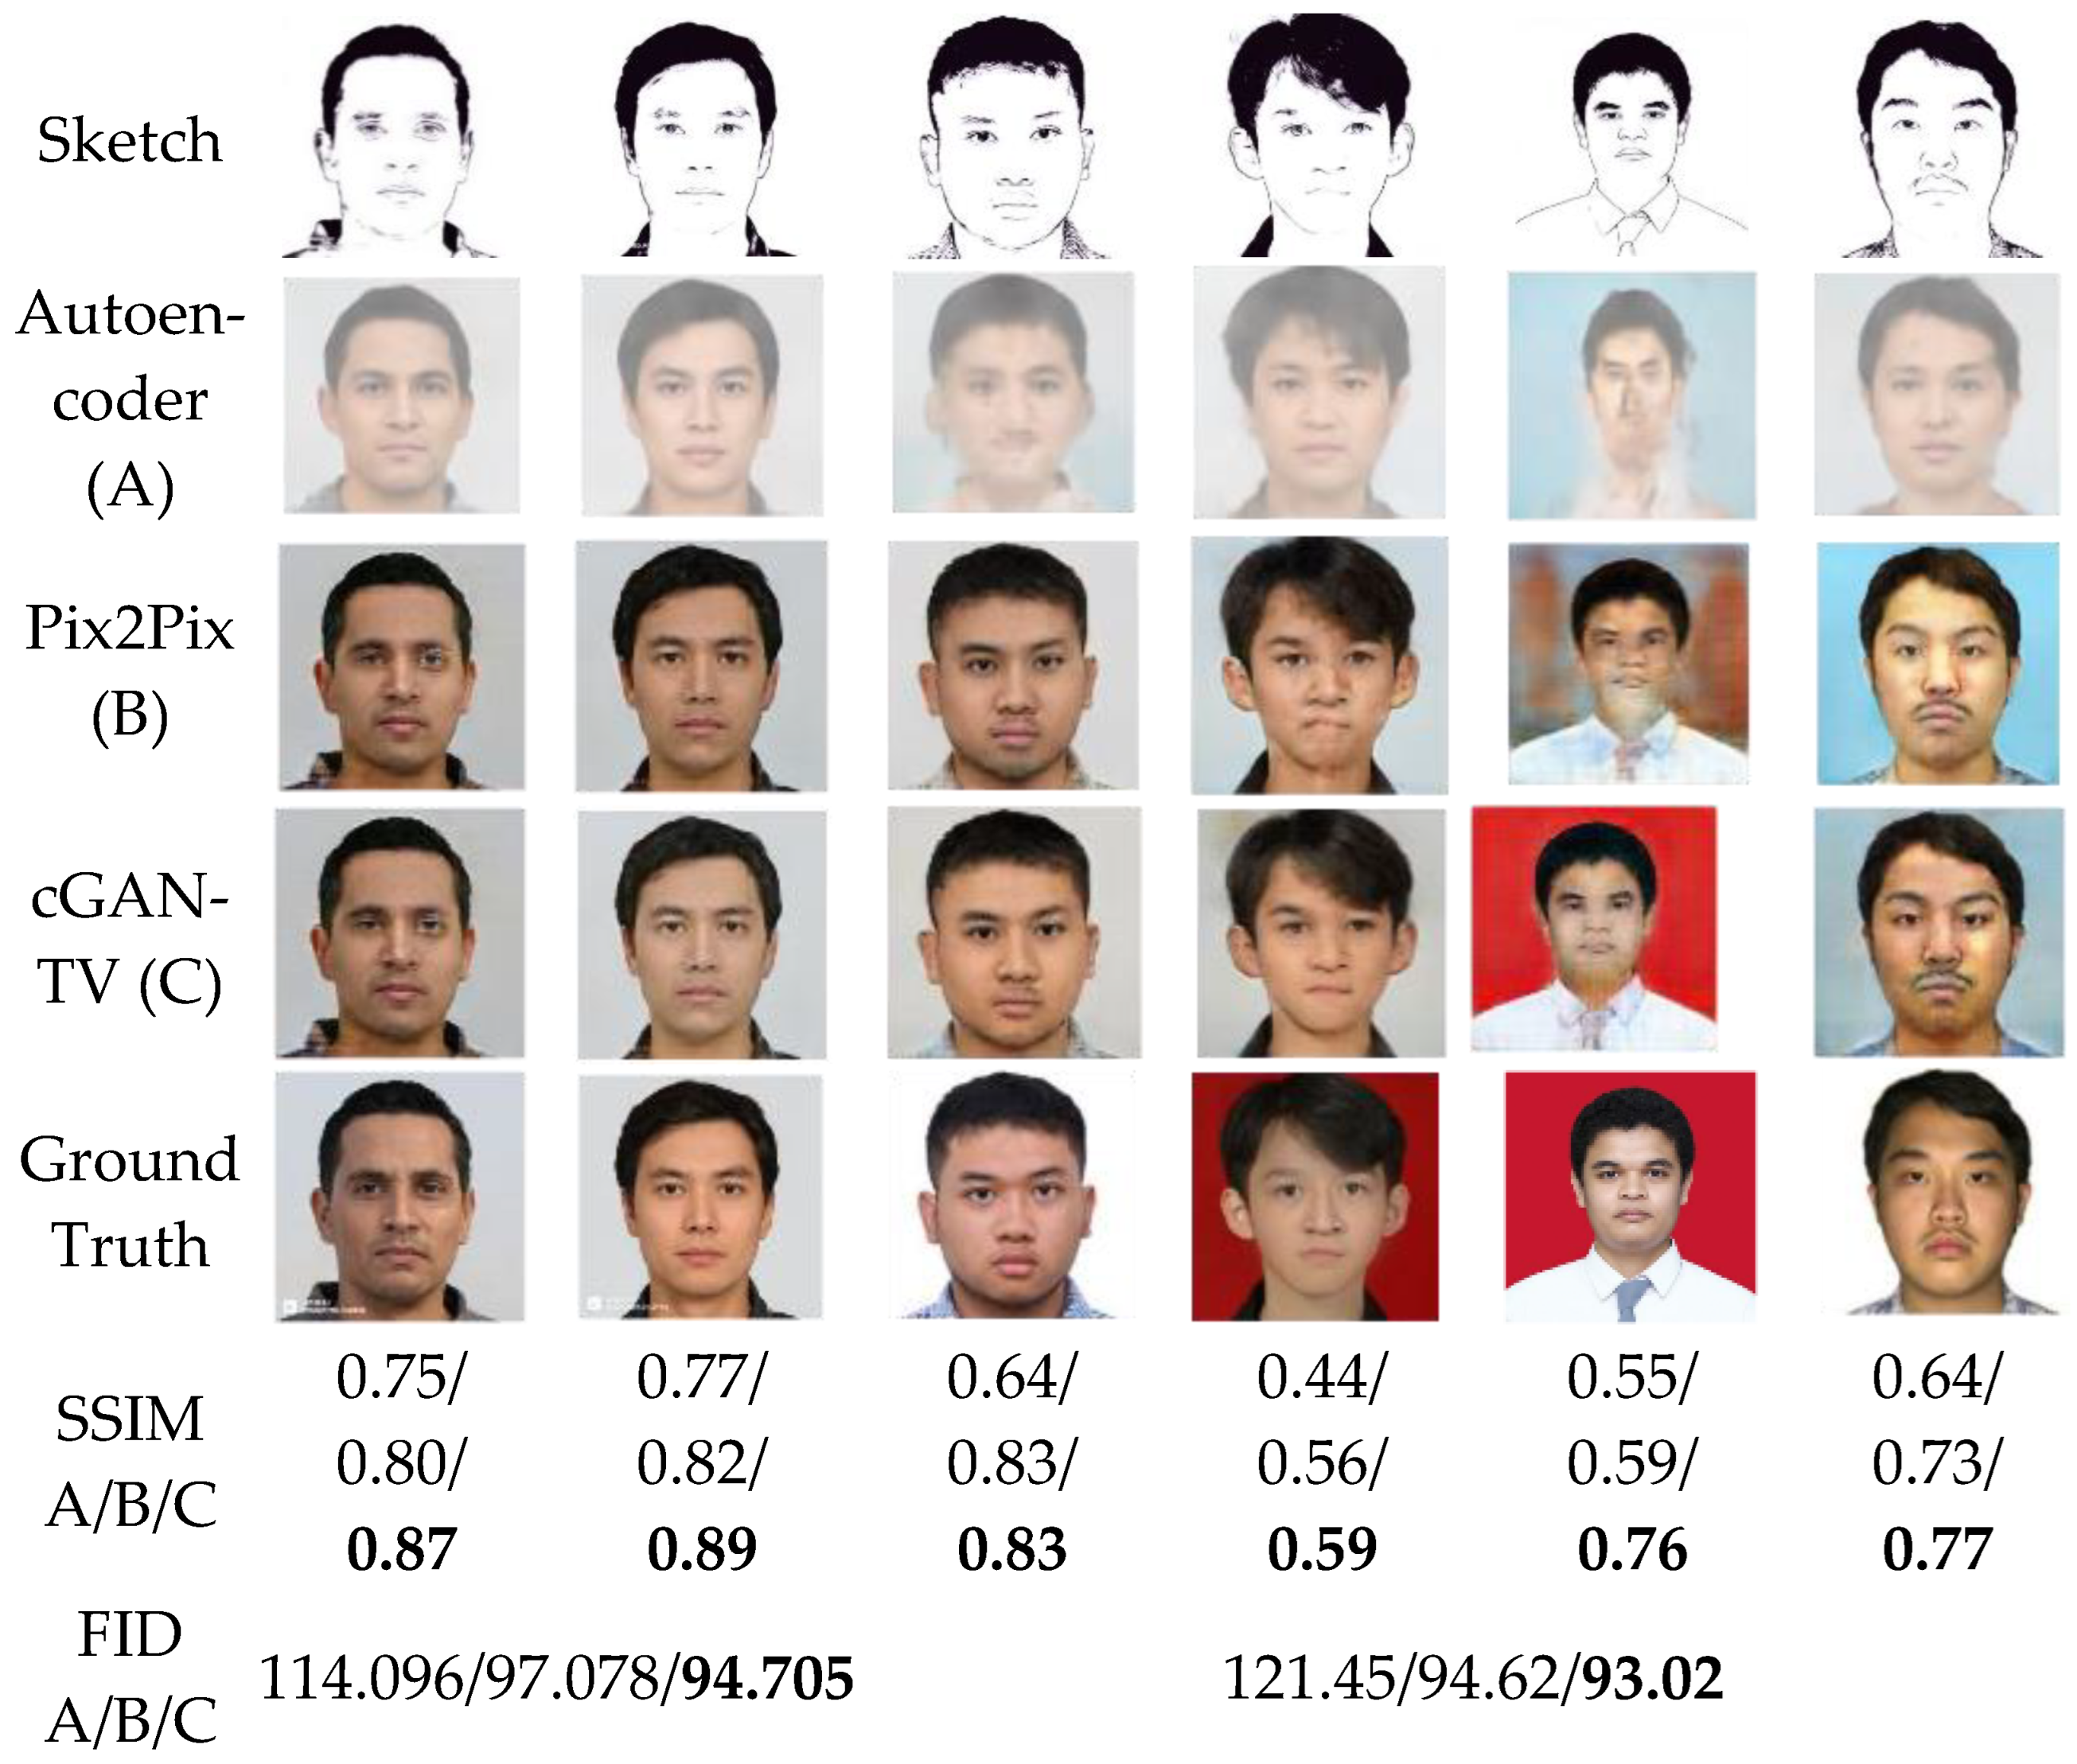
Figure 5 shows three examples of the results of the testing phase. Visually, the generator could create a similar image, but the result was not as good as the validation dataset. This is because the character of the images in the training dataset was quite different from those in the testing dataset, which were collected from real persons. In addition, this was caused by the sketch dataset used, which was not perfectly generated. However, our GAN was able to create images that were quite similar to the corresponding original images, with SSIM values of 0.83, 0.74, and 0.71, with an FID of 93.02.
3.2. Color Correction Evaluation
As shown in
Figure 4, the images produced by cGAN-TV tended to have a similar skin tone. Hence, a color correction was required to make the photo images more realistic and more in accordance with the ground truth. By applying the configuration contained in
Table 2, the resulting image could be more visually similar to the original image.
The first skin tone configuration applied for color correction was for pale white, where the color transfer was not required due to the satisfying results of this color category. We only needed to set the gamma at 0.8. As shown in
Figure 6, this configuration succeeded in producing the skin tone of the resulting image that was more similar to the skin tone of the original image.
The second configuration was fair, in which the color transfer was carried out, and the gamma was set to 0.85. In this case, the color transfer must be performed, because the gamma change only adjusts the exposure of the image and cannot change the skin tone. However, when we only performed the color transfer, the resulting images were too dark and unnatural. Therefore, by using gamma 0.8, the resulting images looked more natural, with the skin tone turning yellowish, as shown in
Figure 7.
As shown in
Figure 7, the third or tan configuration used color transfer and changed the gamma to 1.2. As with the fair configuration, this configuration also used two stages, namely color transfer, and gamma changes. The gamma of the image was increased to 1.2. The effect of the tan configuration can be seen in
Figure 8.
Table 5 shows the result evaluation of cGAN-TV with the implementation of color correction. Although the color correction visually gives a more realistic result, the SSIM value of the color correction implementation decreased from 0.83 to 0.76. This was caused by the SSIM calculation process, which begins with converting the image to grayscale. Since the image has undergone a gamma change, the grayscale result is different for the one without the gamma change. This inappropriate grayscale image causes the image structure to not be in accordance with the original image. However, the decrease in SSIM visually did not have the effect of reducing the visual quality of the results, therefore, it was still tolerable. On the other hand, the FID value increased by 16% from 94,705 to 78,944. This is because the FID evaluation takes color similarity into account, and with color correction, the image between the GAN result and the original image has a more similar distribution when compared to that without color correction. Overall, the implementation of color correction provided a more realistic image result and a better FID value. This is prioritized over a high SSIM value because the improvement in visual quality produced is more helpful for ordinary users (in this case the Indonesian people) in assessing the similarity of faces between two images.


 [17]
[17] [17]
[17]