Article

Factorial Design to Stimulate Biomass Development with Chemically Modified Starch

1
Department of Industrial Systems Engineering and Management, University “Vasile Alecsandri”, 600115 Bacau, Romania
2
Department of Chemical and Food Engineering, University “Vasile Alecsandri”, 600115 Bacau, Romania
3
Department of Biology, Ecology, and Environmental Protection, University “Vasile Alecsandri”, 600115 Bacau, Romania
*
Author to whom correspondence should be addressed.
Appl. Sci. 2022, 12(19), 10069; https://doi.org/10.3390/app121910069
Submission received: 10 August 2022 / Revised: 5 September 2022 / Accepted: 29 September 2022 / Published: 7 October 2022
(This article belongs to the Section Environmental Sciences)

Abstract

:
The present study is focused on mathematical modeling by testing the benefits of modified potato starch in the biomass production of microorganisms, such as the fungus type. Microorganisms need a carbon source for the biomass development. In different industries, microorganisms, such as the Penicillium type, are used for the extraction of different important compounds utilized in biotechnologies. The aim of this study is to establish some important parameters in order to stimulate the biomass production in the presence of chemically modified starch. The carbon sources used in this research are glucose, native potato starch, and chemically modified potato starch. The chemical modification of potato starch was realized with green chemical compounds in order to not influence biomass development. The chemical characterization of starch and modified starch was important in order to confirm the chemical modification of starch. The response function in mathematical modeling is the amount of biomass developed when there are varied parameters. The varied parameters for the factorial design are as follows: time of biomass development, mass report of glucose:starch (G:S), and mass report of glucose:modified starch (G:MS). The results obtained for the optimal values are as follows: 6 days for the biomass development, 1:1.35 for the mass report of G:S, and 1:1.27 for the report of G:MS.

1. Introduction

The use of polysaccharides in biomedical and biological application receives great attention. These materials, which can be used for biomass production, are cheap, non-toxic, renewable, and biodegradable [1,2,3,4,5,6]. For biomass development, the most commonly used materials are glucose, starch, cellulose, and chitosan, in their native or chemically modified form. Starch is the main source of energy for animal life, and 50% of the starch produced industrially is intended for human consumption. Starch is also a low-cost polymer of biodegradable nature. The native starch is naturally available in two forms: amylose and amylopectin. The amylose is chemically formed from a linear chain of (α-1→4) linked glucose molecules. Amylopectin is a highly branched structure with glucose molecules linked via (α-1→6) branch points [6]. On consumption of microorganisms, the molecule of starch is hydrolyzed into glucose. Recent research explains that modified starch molecules can increase crystallinity and digestive enzyme resistivity and have attained great interest in the gastronomic field due to their augmented functional properties [7,8,9,10,11].
The growth and multiplication of microorganisms are the result of the metabolism of bioanalysis, which forms cellular constituents. The production of the product used by the cultivation of microorganisms on different substrates, as is the case with biotechnology, is only possible under known and targeted conditions for maximum yield.
In situations when the imbalance between the cell surface and volume reaches the maximum, a critical moment appears when the growth stops and then starts the cellular division. In the division following, microorganisms are multiplying and restoring normal equilibrium [8,9,10]. The multiplication is realized through fragmentation or the creation of a special type of spores. The idea is that multiplication increases the number of microorganisms.
The cultivation of microorganisms on the medium culture dynamics of cell multiplication and the establishment of the generation duration are very important [12,13,14,15,16]. The generation duration is the time required for a cell to divide and, consequently, lead to a doubling of the population that is growing.
Polysaccharides, particularly modified biopolymers derived from chitin and starch, can be used in different industries [11]. These polysaccharides are abundant, renewable, and biodegradable resources and can be considered as potential materials for biomass development [17,18,19]. Nevertheless, the weak aqueous solubility of the starch molecule is also known to be a major constraint that limits the development of starch-based materials. For non-food industries, starch is modified in order to obtain soluble products with properties suitable for various applications [20,21,22,23,24,25].
In the present work, potato starch was synthesized by esterification in order to fulfill the objective: to increase the aqueous solubility of modified starch. The objective of chemically modifying starch is to solubilize the starch in various ways so that microorganisms are capable of developing. For starch modification, propylene glycol was used in order to increase the water solubility of starch. Chemical modification was confirmed by the 1H NMR spectrum [6]. Hydroxypropylated potato starch (HP), potato starch, and glucose were used as carbon sources for biomass development.
Mathematical modeling uses a factorial design, which is a numerical method, giving the investigator close results with significantly fewer experiments than a conventional experimental technique [16,17,18,19]. Mathematical modeling through factorial design procedures have been used in different domains for optimizing and modeling different processes. The advantages of this optimization method include the fact that not only is the individual (simple) effect of each variable taken into account, but the interaction and/or their possible synergy effects are also considered. This method allows studying the influence of a large number of variables [16,17]. The methods of mathematical planning of experiments aim to obtain the quantitative relationships of the y = f (x1, x2, x3, …) type, respective of mathematical models that are associated to the processes and the systematical, efficient, and economic investigation of significant factors of the process. The interest of the factorial program of the kn type appears because of the difficulty in conventionally establishing the mathematical relationship between the variables of the studies [18,19,20].
This study is focused on establishing some important parameters by factorial design in order to stimulate the biomass production in the presence of chemically modified starch. The response function in mathematical modelling is the amount of biomass developed when there are varied parameters. The varied parameters include the time of biomass development, mass report of glucose:starch (G:S), and mass report of glucose:modified starch (G:MS).

2. Materials and Methods

The chemical modification of starch was realized in order to solubilize the starch molecule. For this reason, the following chemicals were used: propylene oxide (PO) at 99% purity and sodium hydroxide (NaOH) micropearls for analysis, provided by Acros Organics (Noisy-le-Grand, France); dimethyl sulphoxide (DMSO) at 99.5% purity and potato starch, provided by Panreac Quimica SA (Barcelona, Espana). Deionized water was used throughout this work.
The chemical reaction was carried out in a flask at a continuous high pressure at 21 °C. The dried starch was dissolved in DMSO at a concentration of 1 g to 10 mL [18,19,20,21,22,23]. After the starch solubilization (at 21 °C for 48 h), the 1,2-epoxyalkane was added at molar ratios of epoxyalkane to the alcohol function present in starch. The reaction mixture was stirred at 21 °C for 6 h. As a final reaction, the compound was catalyzed by adding NaOH. The modified starch was neutralized with hydrochloric acid, dialyzed for 4 days using a cellulose membrane (Medicell International, MWCO of 12–14,000 Da), and lyophilized.
For biomass development, culture media were used in order to create the sample’s experimentation. The quantities were expressed as one liter of medium (distilled water: 1 L); the pH was measured before the sterilization, which was carried out with the auto-clave (121 °C, 20 min). The culture media were composed of the following: malt agar extract (MAE) (malt extract (Merck)—20 g; yeast extract (Biokar Diagnostics)—2 g; agar (Sigma)—15 g; chloramphenicol—0.2 g) and mineral medium (MM) (KCl—0.250 g; NaH2PO4 x 2H2O—6.470 g; Na2HPO4 x 2H2O—10.410 g; MgSO4—0.244 g; NO3NH4—1.000 g; solution of oligoelements (10 mL par L) ZnSO4, MnCl2, FeSO4, CuSO4, CaCl2, MoO3).
The inoculum of fungi came from spores harvested from the soil [25]. For the preparation of fungus inoculums, the easily quantifiable spores, the propagates, were used. For each isolate, 2–3 mL of sterile distilled water was deposited on a 5-day pre-culture on the MAE medium out of the Petri box. The suspension of spores, recovered in a test tube, was shaken in a vortex in order to homogenize it well. The concentration of the suspension in spores was estimated using a cell of Malassez and an optical microscope.
The estimate biomass of fungus was made on different substrates: native starch and starch modified with propylene oxide.
The medium was prepared with the quantities described above by using elements such as the source of carbon glucose (similar to the reference) and the modified starch. In each Erlenmeyer, 25 mL of the medium, prepared without the solution of NO3NH4 to avoid the production of a Maillard reaction during the pressure-sealing, was added. These last samples were sterilized with the autoclave. The solution of NO3NH4 was added, and after, the mediums with the desired number of spores (104 spores/mL) were combined.
The fungus cultures were incubated on a rotary shaker at room temperature for 5 days. After 5 days, the cultures were filtered by a vacuum. The filters with biomasses were dried with a drying oven at 110 °C for 24 h. The biomasses on the filters were measured, and a second weighing was carried out after 48 h in order to confirm that the content of the water was completely evaporated.
In order to optimize the conditions for the development of the microorganisms, a factorial model, using the MATLAB program model, was applied [26,27,28,29,30,31]. For the realization of this study, 27 tests were carried out, applying the factorial 33 design method. In order to optimize the biomasses development of microorganisms, different parameters were used. In Table 1, the varied parameters and the field variation are presented as follows:
The response function is the quantity of biomass developed. The calculation of the significance of the program 3 test pilot in the central point of the field (0, 0) was carried out, obtaining the values presented in Table 2.
The response function of the design model program was the biomass that is presented in Table 3, and the Equation (1) represents the particular form of response function for the factorial program of type 33.
Y = a 0 + a 1 · x 1 + a 2 · x 2 + a 3 · x 3 + a 11 · x 1 2 + a 22 · x 2 2 + a 33 · x 3 2 + a 12 · x 1 x 2 + a 13 · x 1 x 3 + a 23 · x 2 x 3 + a 123 · x 1 x 2 x 3
The values of the coefficients for the polynomial mathematical model are presented in Table 4.
The mathematical model, which describes the response function of the optimizing criteria, is presented in Equation (2):
Y = 0.083 + 9.889 · 1 0 3 · x 1 7.556 · 1 0 3 · x 2 7.222 · 1 0 3 · x 3 + 3.778 · 1 0 3 · x 1 2 + 9.444 · 1 0 3 · x 2 2 0.012 · x 3 2 + 0.034 · x 1 · x 2 + 2.25 · 1 0 3 · x 1 · x 3 + 0.013 · x 2 · x 3 + 7.5 · 1 0 3 · x 1 · x 2 · x 3

3. Results

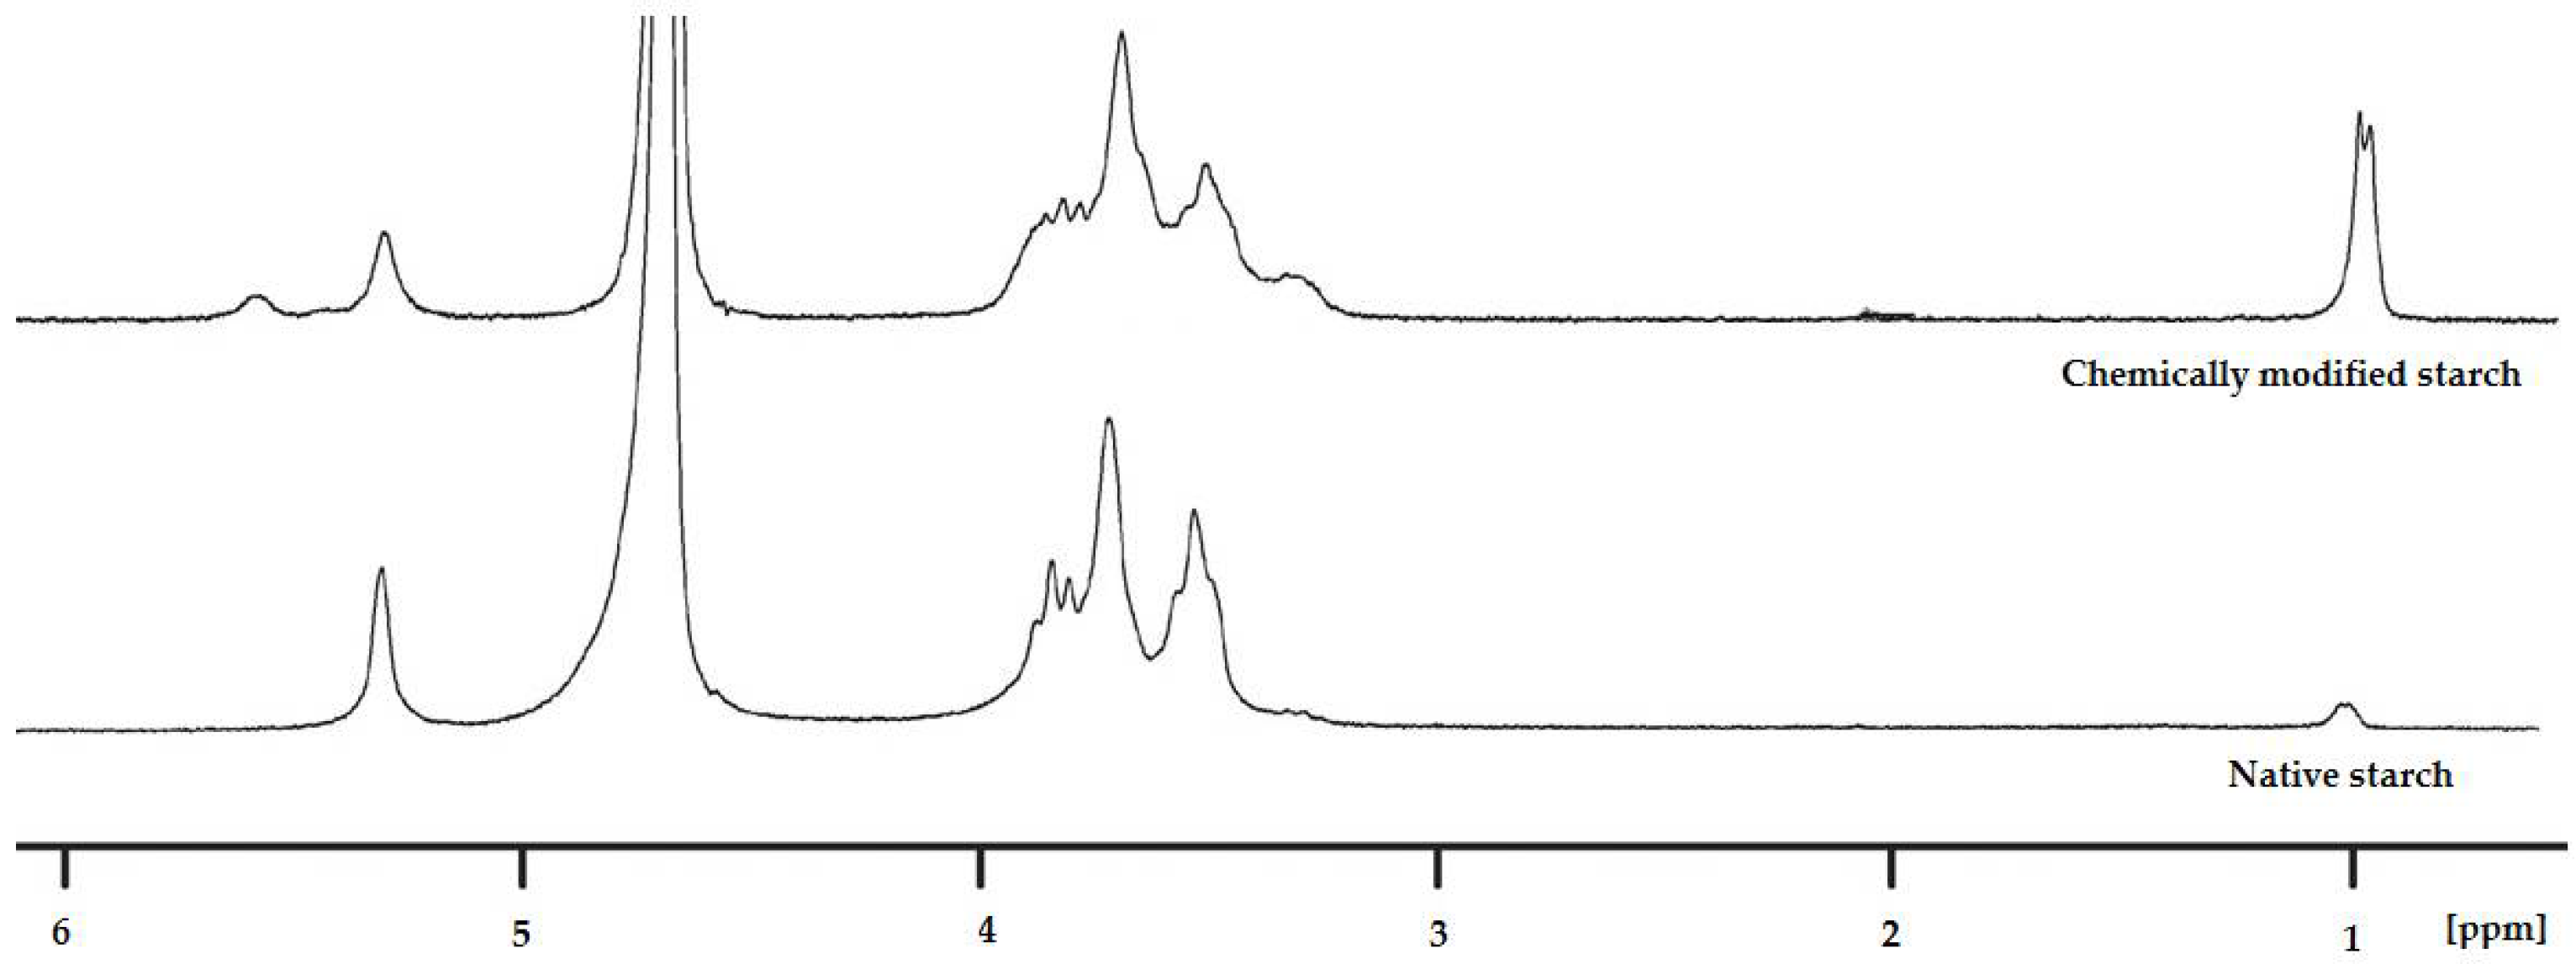
3.1. Chemical Modification of Potato Starch

The starch is a natural polymer of glucose that is also used for chemical modification in order to increase the aqueous solubility. For this reason, it is used for the production of biomass. The starches modified by chemical synthesis are also used as a source of carbon. This result seems to indicate a level of chemical modification of starch by propoxylation. In Figure 1, the 1H NMR spectrum for the native starch molecule and the chemically modified starch is presented [6,12,13,25]. NMR spectra were measured with a 250 MHz Spectrospin NMR spectrometer Bruker (Wissembourg, France). Spectra were recorded in deuterated water (D2O) with the following spectra acquisition parameters: ambient temperature, acquisition time 6 s, pulse angle 30 °C, relaxation delay 1 s, and a total of 50 scans.

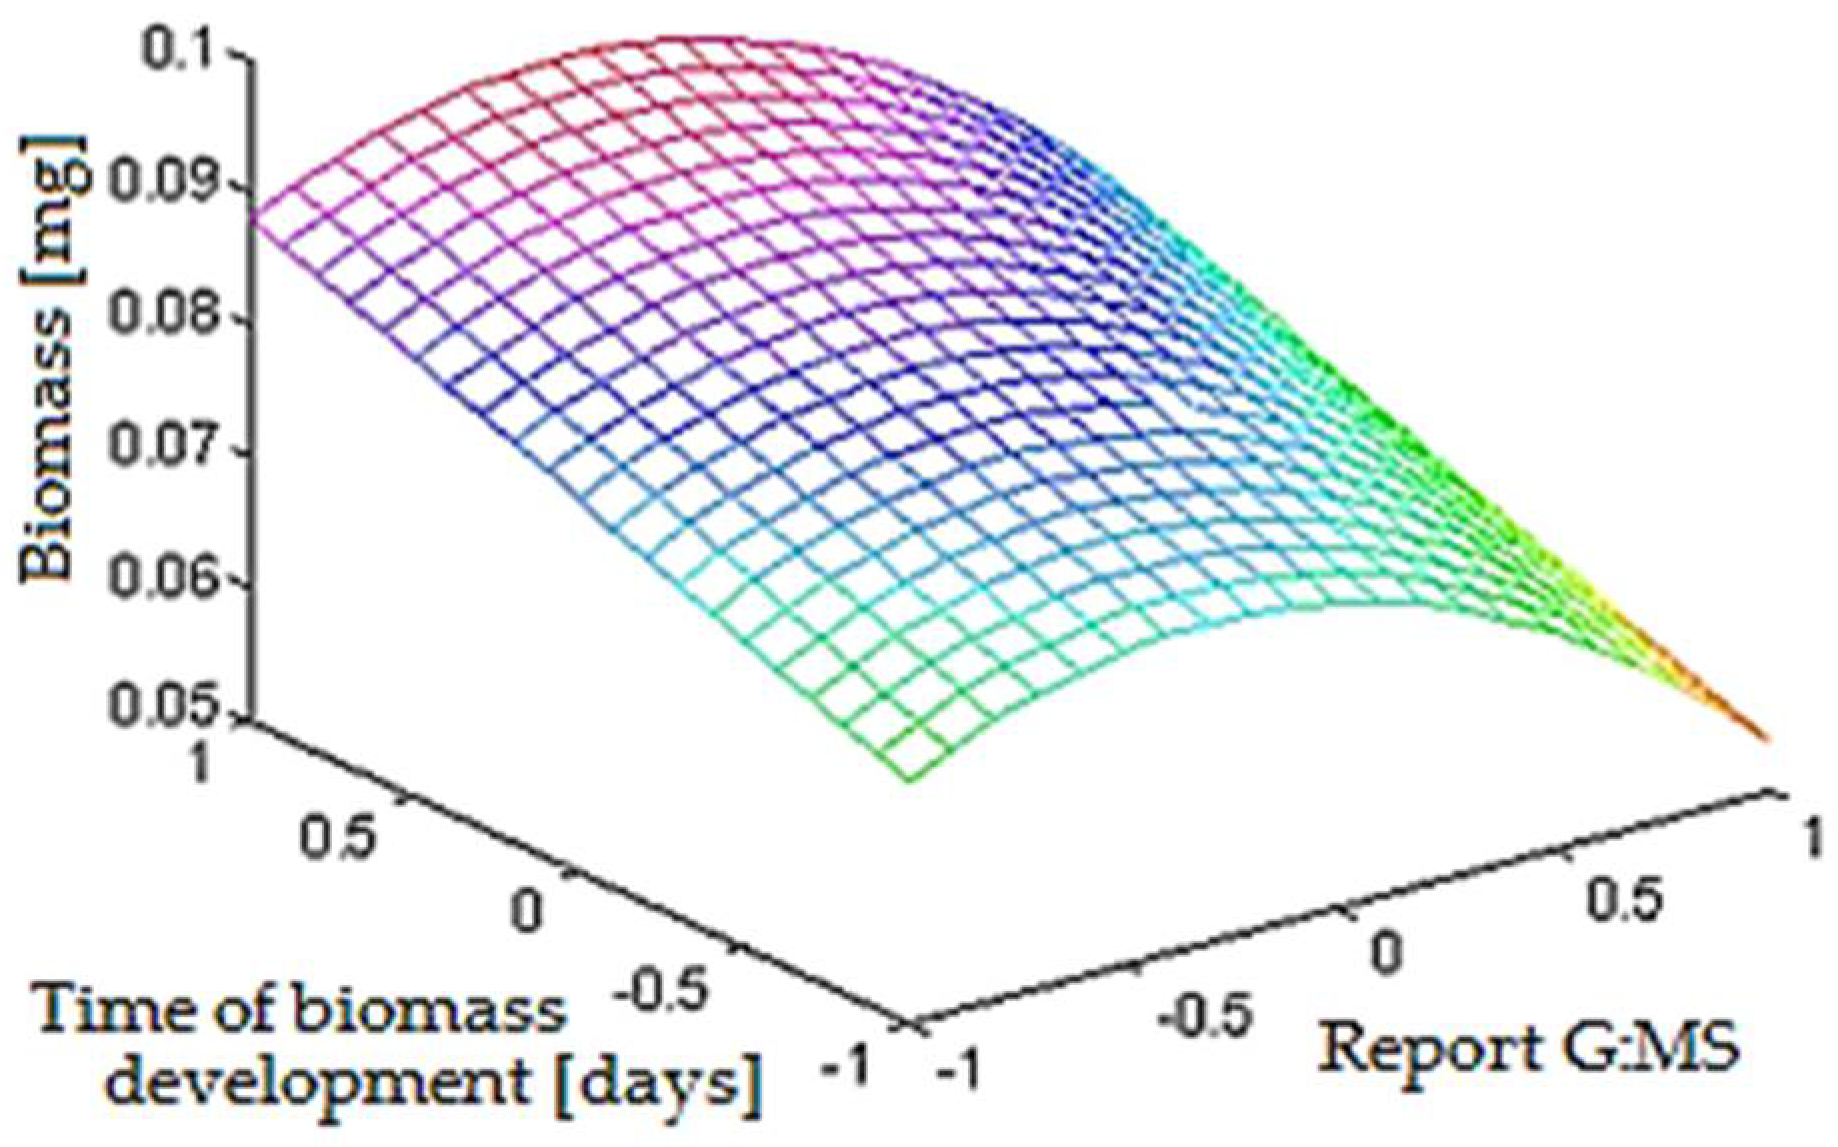
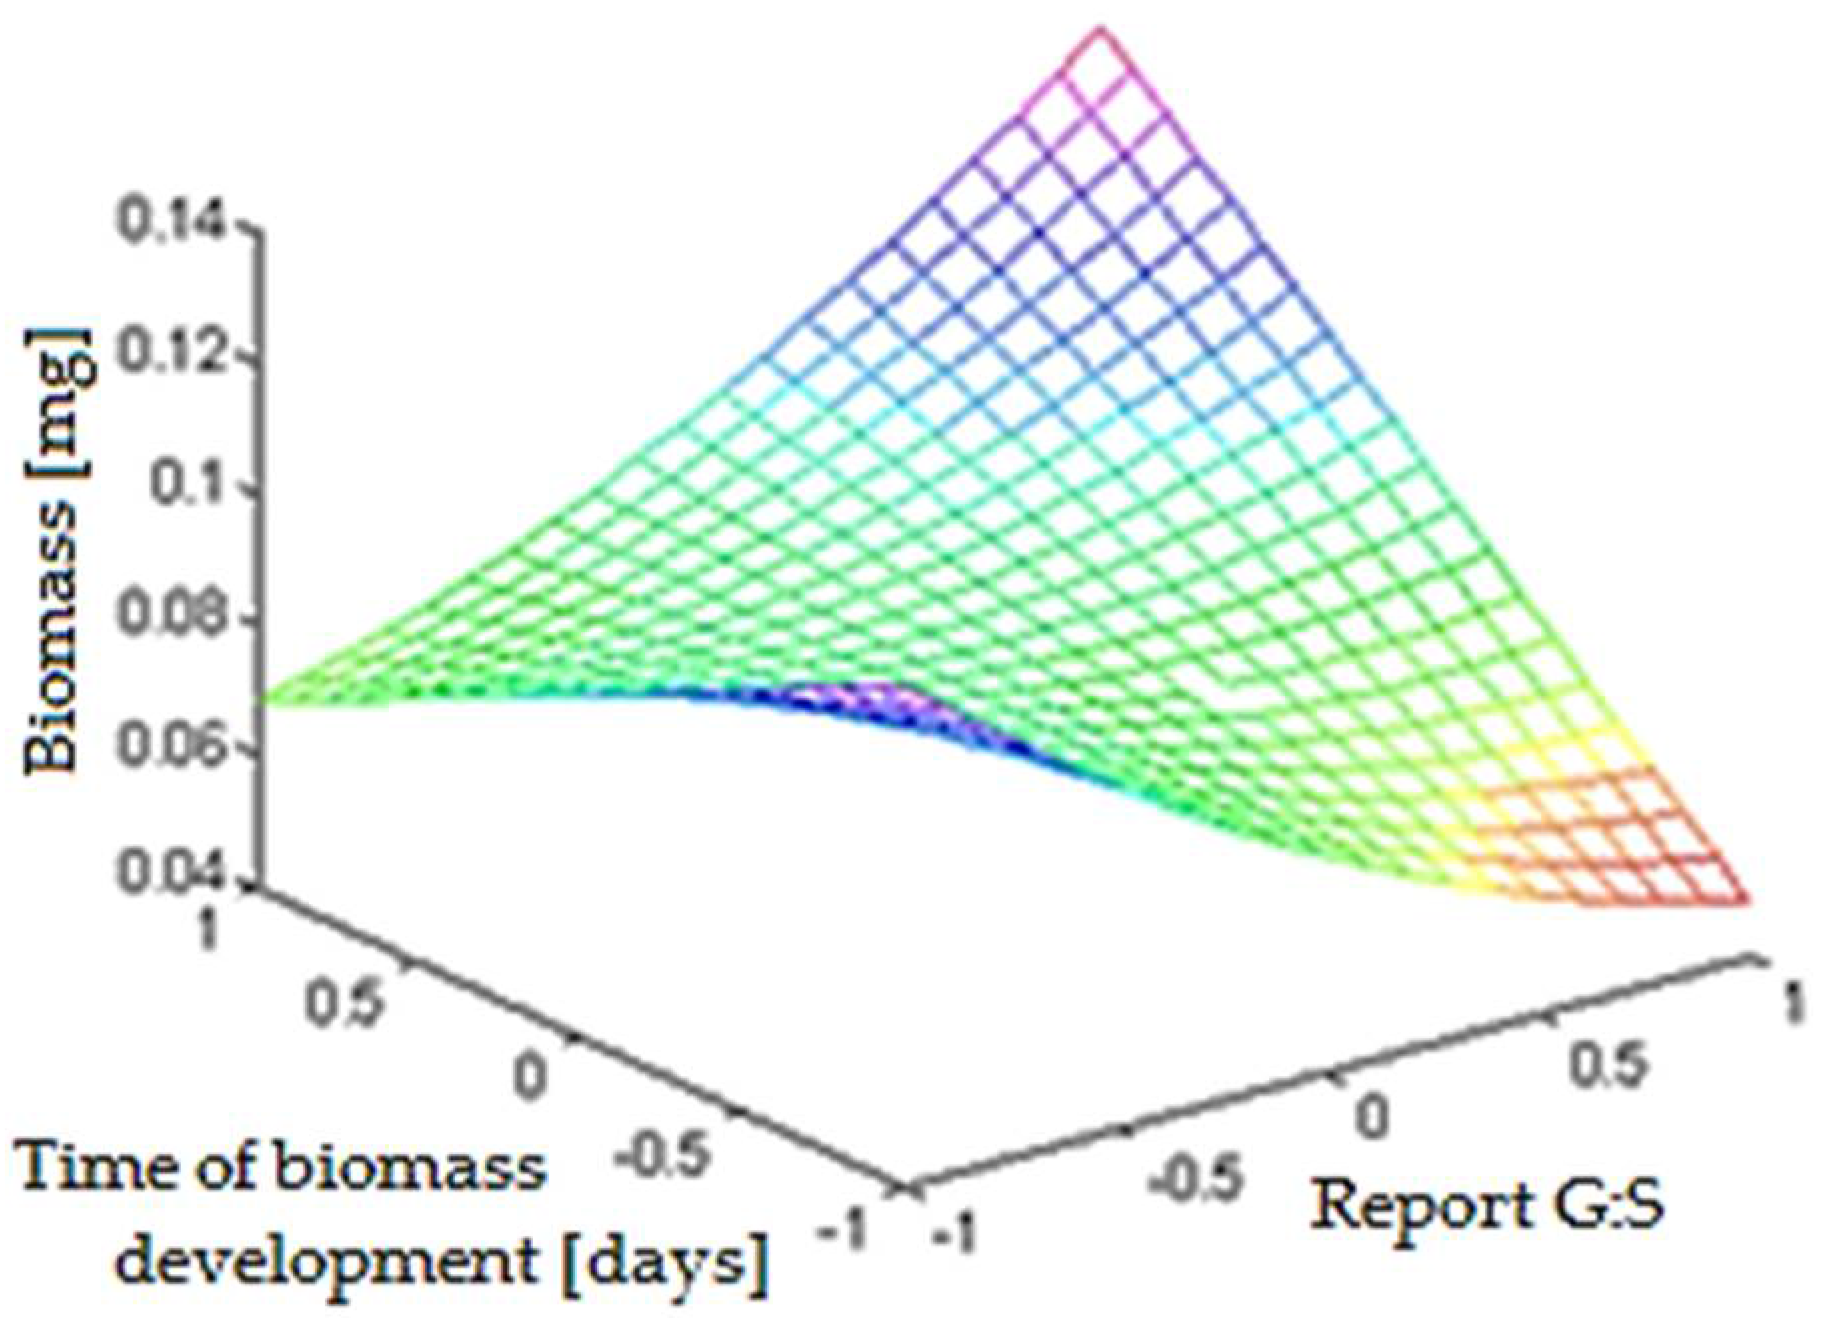
3.2. Elaboration of the Mathematical Model

The response function in this study was the biomass development with the variation of some parameters. Three other tests were done in the central point of the domain (0, 0) to calculate the significance of the program:
y m e d 0 = i = 1 3 y i 0 3 = 0.142 + 0.158 + 0.079 3 = 0.126
The average error square was calculated using the following relation:
ε 2 = i = 1 n ( y i 0 y m e d 0 ) 2 n 1 = 1.744 · 1 0 3
The error for control samples was calculated with relation (5):
ε = ε 2 = 0.042
Determining the significance of the coefficients was carried out with the following relation, where the number of tests, N, is 27:
S = ε N = 0.042 5.196 = 8.038 · 1 0 3
The significance of the coefficients was tested with Student’s t-tests using relation (7):
t j = | a j | / S
The values of the Student’s t-tests for each coefficient are presented in Table 5.
Given the results of the Student’s t-tests, it is observed that the following terms can be eliminated: x2, x11, x123, x13.
The mathematical model that describes the function of the response of the criterion of optimization after the elimination of the insignificant terms, with the assistance of the Student’s t-tests, is:
Y = 0.083 + 9.889 · 1 0 3 · x 1 7.222 · 1 0 3 · x 3 + 0.034 · x 1 · x 2 + 0.013 · x 2 · x 3 + 9.444 · 1 0 3 · x 2 2 0.012 · x 3 2
Further effects of the parameters will be discussed. The value of a0 (0.083) indicates the fact that we have an optimal quantity of biomass to a value approaching this value. The positive coefficient a1 means that the variable x1 has a favorable individual action. The coefficient a3 is negative; therefore, the variable x3 has an unfavorable effect on the process. The individual effect of x2 and the variable x2 will not be discussed since they were proven to be unsignificant by the Student’s t-tests. The coefficient of interaction a12 and a23 is viewed as positive, and the variables x12 and x23, by their interaction, have a favorable effect for the process. In analyzing the quadratic coefficients a22 and a33, the result is that the function of the answer is characterized by a maximum in connection with the variables x1 and x3 and by a minimum in connection with the variable x2 in which the minimum has a larger curve than the maximum.
For the function of the response obtained after the elimination of the unsignificant terms with the assistance of Student’s t-tests, the drifts partial of order I in connection with each variable were calculated:
y x 1 = 9.889 · 1 0 3 + 0.034 · x 2 y x 2 = 0.034 · x 1 + 0.013 · x 3 + 0.0188 · x 2 y x 3 = 7.222 · 1 0 3 + 0.013 · x 2 0.024 · x 3
The drifts partial of first order were calculated in relation to each variable:
{ 9.889 · 1 0 3 + 0.034 · x 2 = 0 0.034 + 0.013 · x 3 + 0.0188 · x 2 = 0 7.222 · 1 0 3 + 0.013 · x 2 0.024 · x 3 = 0 { x 1 = 0.336 x 2 = 0.291 x 3 = 0.458
The optimal point was (0.336; −0.291; −0.458), represented by some adimensional coordinates. As can be observed, the optimal value for x1 exceeded the limits of the acceptable field a little (−1, 1), but the optimal values of the variables x2 and x3 were framed within the limits of this established field. Saving the fields of variation of the time of development, the report between glucose and starch and the report between glucose and modified starch were obtained with the actual values of the optimal point using the following relation:
X 1 = Δ X 1 · x 1 + X 1 m e d X 2 = Δ X 2 · x 2 + X 2 m e d X 3 = Δ X 3 · x 3 + X 3 m e d
in which:
  • X1, X2, X3—the actual optimal values;
  • x1, x2, x3—adimensional optimal values;
  • ΔX1, ΔX2, ΔX3—the step of each field of variation;
  • X1med, X2med, X3med—the average value reality of the parameters.
X 1 = 2 · 0.336 + 5 = 5.672 d a y s X 2 = 0.5 · ( 0.291 ) + 1.5 = 1.355 X 3 = 0.5 · ( 0.458 ) + 1.5 = 1.271
The obtained mathematical models were represented graphically, according to two parameters, the other parameter remaining constant to the value 0 that represented the center of the field of variation. For Y1, there were three surfaces of responses characterized by the following mathematical models:
Y = 0.083 + 9.889 · 1 0 3 · x 3 + 0.013 · x 2 · x 3 + 9.444 · 1 0 3 · x 2 2 0.012 · x 3 2   ( x 1 = 0 )
Y = 0.083 + 9.889 · 10 3 · x 1 7.222 · 10 3 · x 3 0.012 · x 3 2   ( x 2 = 0 )
Y = 0.083 + 9.889 · 1 0 3 · x 1 + 0.034 · x 1 · x 2 + 9.444 · 1 0 3 · x 2 2   ( x 3 = 0 )
The graphs of those mathematical models are represented in Figure 2, Figure 3 and Figure 4.
Y = 0.356 + 0.017 · x 2 0.021 · x 3 + 0.014 · x 2 · x 3 0.033 · x 3 2  
Y = 0.356 0.021 · x 3 0.02 · x 1 · x 3 0.043 · x 1 2 0.033 · x 3 2
Y = 0.356 + 0.017 · x 2 0.043 · x 1 2
In Figure 2, Figure 3 and Figure 4, the roundness from surfaces as well as the maximum and the minimum owed to the effects as of the quadratic coefficients, as long as the point of inflection can be distinguished.
The optimal point searched, represented in dimensionless coordinates, can be seen in optimal values for x1 and x2 that were initially supposed.
By the real values of the optimum, we have the following remarks:
  • the optimal time of development of biomass is 5.67 days ≈ 136 h;
  • the optimal report between glucose and starch is 1:1.35;
  • the optimal report between glucose and modified starch is 1:1.27.
Modeling and optimization through the factorial 33 experiment design confirm the use of parameters. This optimal specific surface area could still be increased by the application of an experimental design to the other steps for biomass development, including number of spores, chemical composition of the biomass, and economic costs.
As a final conclusion, it can be remarked that to obtain a final quantity that is optimal, all variables must be in the selected limit domain.

4. Discussion

The mathematical modeling using factorial experimentation makes the estimate of the decisive parameters’ effects of development biomass of microorganisms possible. The optimal conditions obtained are as follows: 136 h for the time of biomass development, 1:1.35 for the mass report of G:S, and 1:1.27 for the report of G:MS.
Two main types of reactions can be distinguished:
  • reactions that alter the molecular weight of polymer reactions of degradation and crosslinking reactions;
  • reactions that change the properties (without major changes in their molecular weight): stabilization reactions and reactions functionalities.
The starch is a natural polymer of glucose, and it is also easily used by microorganisms. The biomass produced is identical to that obtained in the presence of glucose. Modified starches are also used as a carbon source by microorganisms.
The time of biomass fungus development is essential in applied industries. Research has shown [26,27,28,29,30,31] that fungal biomass, in the presence of polysaccharides, can only develop for 72 h, and then the biomass slows down and disappears. Chemically modified polysaccharides prolong the development of the tested biomass.
The development of biomass has been boosted with glucose in order to obtain the optimal report. When starch and modified starch are finished, the fungal spores need a carbon source to continue the development of biomass.
The study conducted highlights the following: chemically modified starch can be used by microorganisms, such as fungus, as a source of carbon; long-term biomass stimulation requires the presence of glucose as an additional source of carbon; the correlation of the chemically modified starch and glucose ratio is beneficial in the economical use of materials for the biomass development.
As a final conclusion, the factorial design applied to obtain optimal parameters for the development of fungus biomass opens new perspectives in biotechnologies. The classical culture substrate can now be substituted using chemically modified polysaccharides.

Author Contributions

Conceptualization, A.-M.R. and O.P.; methodology, I.D.N., A.-M.R. and V.Z.; software, I.D.N. and V.Z.; validation, I.D.N. and V.Z.; formal analysis, D.N. and R.E.V.; investigation, D.N., O.P. and R.E.V.; resources, D.N., O.P. and R.E.V.; data curation, A.-M.R.; writing—original draft preparation, A.-M.R.; writing—review and editing, A.-M.R.; visualization, I.D.N. and V.Z.; supervision, A.-M.R. All authors have read and agreed to the published version of the manuscript.

Funding

This research was funded by the Ministry of Education and Research, through the National Council for Finance of Higher Education, Romania, grant number CNFIS-FDI-2021-0276.

Institutional Review Board Statement

Not applicable.

Informed Consent Statement

Not applicable.

Data Availability Statement

MDPI Research Data Policies.

Conflicts of Interest

The authors declare no conflict of interest.

References

  1. Hong, Y.-E.; Kweon, M. Optimization of the Formula and Processing Factors for Gluten-Free Rice Bread with Tamarind Gum. Foods 2020, 9, 145. [Google Scholar] [CrossRef] [PubMed] [Green Version]
  2. Kristiawan, M.; Della Valle, G.; Berzin, F. Extrusion Simulation for the Design of Cereal and Legume Foods. Foods 2022, 11, 1780. [Google Scholar] [CrossRef]
  3. Tian, Z.; Hou, L.; Hu, M.; Gao, Y.; Li, D.; Fan, B.; Wang, F.; Li, S. Optimization of Sporulation Conditions for Bacillus subtilis BSNK-5. Processes 2022, 10, 1133. [Google Scholar] [CrossRef]
  4. Costa, D.S.d.; Takeuchi, K.P.; Silva, R.M.d.; Oliveira Filho, J.G.d.; Bertolo, M.R.V.; Belisário, C.M.; Egea, M.B.; Plácido, G.R. Cassava-Starch-Based Films Incorporated with Buriti (Mauritia flexuosa L.) Oil: A New Active and Bioactive Material for Food Packaging Applications. Polysaccharides 2022, 3, 121–135. [Google Scholar] [CrossRef]
  5. Franco, E.; Dussán, R.; Navia, D.P.; Amú, M. Study of the Annealing Effect of Starch/Polyvinyl Alcohol Films Crosslinked with Glutaraldehyde. Gels 2021, 7, 249. [Google Scholar] [CrossRef]
  6. Rosu, A.M.; Veignie, E.; Surpateanu, G.; Brabie, G.; Miron, D.N.; Rafin, C. Synthesis and evaluation of hydroxypropylated potato starch as polymeric support for benzo[a]pyrene degradation by Fenton reaction. Carbohydr. Polym. 2011, 83, 1486–1491. [Google Scholar] [CrossRef]
  7. de Souza, A.F.; Galindo, H.M.; de Lima, M.A.B.; Ribeaux, D.R.; Rodríguez, D.M.; da Silva Andrade, R.F.; Gusmão, N.B.; de Campos-Takaki, G.M. Biotechnological Strategies for Chitosan Production by Mucoralean Strains and Dimorphism Using Renewable Substrates. Int. J. Mol. Sci. 2020, 21, 4286. [Google Scholar] [CrossRef]
  8. Dudeney, A.W.L.; Narayanan, A.; Tarasova, I.I. Removal Of Iron From Silica Sand: Integrated Effluent Treatment By Sulfate Reduction, Photochemical Reduction And Reverse Osmosis. In Biohydrometallurgy and the Environment toward the Mining of the 21st Century; Process Metallurgy 9A; Elsevier: Amsterdam, The Netherlands, 1999; pp. 617–625. [Google Scholar]
  9. Edwards, K.J.; Bond, P.L.; Gihring, T.M.; Banfield, J.F. An Archaeal Iron-Oxidising Extreme Acidophile Important In Acid Mine Drainage. Science 2000, 287, 1796–1799. Available online: https://www.science.org/doi/10.1126/science.287.5459.1796 (accessed on 9 August 2022). [CrossRef] [Green Version]
  10. Philus, C.D.; Mahanty, B. Dynamic modelling of tetrazolium-based microbial toxicity assay—A parametric proxy of traditional dose-response relationship. Environ. Sci. Pollut. Res. 2021, 28, 45390–45401. [Google Scholar] [CrossRef]
  11. Johnson, D.B. Importance Of Microbial Ecology In The Development Of New Mineral Technologies. Hydrometallurgy 2001, 59, 147–158. [Google Scholar] [CrossRef]
  12. Johnson, D.B. Biological Removal Of Sulfurous Compounds From Inorganic Wastewaters. In Environmental Technologies to Treat Sulfur Pollution: Principles and Engineering; Lens, P., Hulshoff Pol, L., Eds.; International Association on Water Quality: London, UK, 2000; pp. 175–206. [Google Scholar]
  13. Johnson, D.B.; Hallberg, K.B. Pitfalls of passive mine water treatment. Rev. Environ. Sci. Biotechnol. 2002, 1, 335–343. [Google Scholar] [CrossRef]
  14. Norris, P.R.; Burton, N.P.; Foulis, A.M. Acidophiles In Bioreactor Mineral Processing. Extremophiles 2000, 4, 71–76. [Google Scholar] [CrossRef]
  15. Okibe, N.; Gericke, M.; Hallberg, K.B.; Johnson, D.B. Enumeration And Characterization Of Acidophilic Microorganisms Isolated From A Pilot Plant Stirred Tank Bioleaching Operation. Appl. Environ. Microb. 2003, 69, 1936–1943. [Google Scholar] [CrossRef] [Green Version]
  16. Georgescu, A.M.; Brabie, G.; Nistor, I.D.; Nardou, F.; Penot, C. Utilization Of Experimental Design For Specific Area Optimization Of A Pillared Bentonite. J. Food Saf. 2013, XII, 284–290. [Google Scholar]
  17. Georgescu, A.M.; Muntianu, G.; Nistor, I.D.; Nardou, F. Modeling And Optimization of Al-Pillaring Process Using Experimental Design Procedure. J. Agroaliment. Process. Technol. 2017, 23, 212–216. [Google Scholar]
  18. Cerasola, V.A.; Perlotti, L.; Pennisi, G.; Orsini, F.; Gianquinto, G. Potential Use of Superabsorbent Polymer on Drought-Stressed Processing Tomato (Solanum lycopersicum L.) in a Mediterranean Climate. Horticulturae 2022, 8, 718. [Google Scholar] [CrossRef]
  19. Ajbar, A.; Alqahtani, R.T.; Musa, S.S. Static and Dynamic Analysis of a Continuous Bioreactor Model for the Production of Biofuel from Refinery Wastewater Using Rhodococcus opacus. Mathematics 2022, 10, 2842. [Google Scholar] [CrossRef]
  20. Kubit, A.; Trzepieciński, T.; Kluz, R.; Ochałek, K.; Slota, J. Multi-Criteria Optimisation of Friction Stir Welding Parameters for EN AW-2024-T3 Aluminium Alloy Joints. Materials 2022, 15, 5428. [Google Scholar] [CrossRef]
  21. Meengam, C.; Sillapasa, K. Evaluation of Optimization Parameters of Semi-Solid Metal 6063 Aluminum Alloy from Friction Stir Welding Process Using Factorial Design Analysis. J. Manuf. Mater. Process. 2020, 4, 123. [Google Scholar] [CrossRef]
  22. Nejrotti, S.; Mannu, A.; Blangetti, M.; Baldino, S.; Fin, A.; Prandi, C. Optimization of Nazarov Cyclization of 2,4-Dimethyl-1,5-diphenylpenta-1,4-dien-3-one in Deep Eutectic Solvents by a Design of Experiments Approach. Molecules 2020, 25, 5726. [Google Scholar] [CrossRef]
  23. Fotovvati, B.; Balasubramanian, M.; Asadi, E. Modeling and Optimization Approaches of Laser-Based Powder-Bed Fusion Process for Ti-6Al-4V Alloy. Coatings 2020, 10, 1104. [Google Scholar] [CrossRef]
  24. Kiss, E.L.; Berkó, S.; Gácsi, A.; Kovács, A.; Katona, G.; Soós, J.; Csányi, E.; Gróf, I.; Harazin, A.; Deli, M.A.; et al. Design and Optimization of Nanostructured Lipid Carrier Containing Dexamethasone for Ophthalmic Use. Pharmaceutics 2019, 11, 679. [Google Scholar] [CrossRef] [PubMed]
  25. Ramalho, M.J.; Loureiro, J.A.; Coelho, M.A.N.; Pereira, M.C. Factorial Design as a Tool for the Optimization of PLGA Nanoparticles for the Co-Delivery of Temozolomide and O6-Benzylguanine. Pharmaceutics 2019, 11, 401. [Google Scholar] [CrossRef] [Green Version]
  26. Ali, I.; Ahmad, M.; Ganat, T. Experimental Study of Bentonite-Free Water Based Mud Reinforced with Carboxymethylated Tapioca Starch: Rheological Modeling and Optimization Using Response Surface Methodology (RSM). Polymers 2021, 13, 3320. [Google Scholar] [CrossRef]
  27. Schmidt, O.; Magel, E.; Frühwald, A.; Glukhykh, L.; Erdt, K.; Kaschuro, S. Influence of sugar and starch content of palm wood on fungal development and prevention of fungal colonization by acid treatment. Holzforschung 2016, 70, 783–791. [Google Scholar] [CrossRef]
  28. Fannin, T.E.; Marcus, M.D.; Anderson, D.A.; Bergman, H.L. Use of a fractional factorial design to evaluate interactions of environmental factors affecting biodegradation rates. Appl. Environ. Microbiol. 1981, 42, 936–943. [Google Scholar] [CrossRef] [PubMed] [Green Version]
  29. Hanrahan, G.; Zhu, J.; Gibani, S.; Patil, D.G. Chemometrics And Statistics | Experimental Design. In Encyclopedia of Analytical Science, 2nd ed.; Worsfold, P., Townshend, A., Poole, C., Eds.; Elsevier: Amsterdam, The Netherlands, 2005; pp. 8–13. ISBN 9780123693976. [Google Scholar] [CrossRef]
  30. Lin, C.J.; Zhang, R.; Waisner, S.A. Effects of process factors on the performance of electrochemical disinfection for wastewater in a continuous-flow cell reactor. Environ. Sci. Pollut. Res. 2021, 28, 36573–36584. [Google Scholar] [CrossRef]
  31. Kushwaha, O.; Uthayakumar, H.; Kumaresan, K. Modeling of carbon dioxide fixation by microalgae using hybrid artificial intelligence (AI) and fuzzy logic (FL) methods and optimization by genetic algorithm (GA). Environ. Sci. Pollut. Res. 2022; Online ahead of print. [Google Scholar] [CrossRef]
Figure 1. 1H NMR spectra of native starch and chemically modified starch.
Applsci 12 10069 g001
Figure 2. The influence of the report between glucose and starch and the report between glucose and modified starch when the time of the development of biomass is maintained in the field centers.
Applsci 12 10069 g002
Figure 3. The influence of the time of development of the biomass and the report between glucose and modified starch when the report between glucose and starch is maintained in the field centers.
Applsci 12 10069 g003
Figure 4. The influence of the time of development of the biomass and the report between glucose and starch when the report between glucose and modified starch is maintained in the field centers.
Applsci 12 10069 g004
Table 1. Parameters considered and their field of variation.
ParameterReduced VariableMinimum Value (−1)Average Value (0)Maximum Value (+1)
Time of development (days)x1357
Report glucose:starchx21:11:1.51:2
Report glucose:modified starchx31:11:1.51:2
Table 2. Values in the central point of the field.
yk0y10y20y30
Quantity of biomass [mg]0.1420.1580.079
Table 3. Coefficients of the polynomial.
Nb.Time of Development [days]Report Glucose: StarchReport Glucose: Modified StarchBiomass [mg]
x1x2x3Y1
1−1 (3)−1 (1:1)−1 (1:1)0.142
20 (1:1.5)0.144
3+1 (1:2)0.124
40 (1:1.5)−1 (1:1)0.014
50 (1:1.5)0.016
6+1 (1:2)0.095
7+1 (1:2)−1 (1:1)0.113
80 (1:1.5)0.012
9+1 (1:2)0.011
100 (5)−1 (1:1)−1 (1:1)0.143
110 (1:1.5)0.145
12+1 (1:2)0.013
130 (1:1.5)−1 (1:1)0.096
140 (1:1.5)0.014
15+1 (1:2)0.013
16+1 (1:2)−1 (1:1)0.012
170 (1:1.5)0.144
18+1 (1:2)0.146
19+1 (7)−1 (1:1)−1 (1:1)0.014
200 (1:1.5)0.099
21+1 (1:2)0.021
220 (1:1.5)−1 (1:1)0.148
230 (1:1.5)0.150
24+1 (1:2)0.146
25+1 (1:2)−1 (1:1)0.095
260 (1:1.5)0.098
27+1 (1:2)0.078
Table 4. Values of the coefficients for the regression function.
CoefficientsFunction of Response
Y1 (Quantity of Biomass [mg])
a00.083
a19.889·10−3
a2−7.556·10−3
a3−7.222·10−3
a113.778·10−3
a229.444·10−3
a33−0.012
a120.034
a132.25·10−3
a230.013
a1237.5·10−3
Table 5. Values of the Student’s t-tests.
tjt0t1t2t3t12t13t23t11t22t33t123
Calculated value10.2661.230.940.8994.2610.281.6170.471.1751.5210.933
Publisher’s Note: MDPI stays neutral with regard to jurisdictional claims in published maps and institutional affiliations.

