Abstract
A vortex tube is a simple device that separates incoming gas into cold and hot gases. Several theories have been proposed to explain the principle of energy separation in the vortex tube. Existing theories have advantages and defects. Recently, various studies employed numerical simulations to study the flow in the vortex tube. As a result, flow structures were well clarified. However, in most cases, the temperature separation was partially discussed based on the temperature distribution in the radial direction. This study aimed to explain the principle of energy separation in the vortex tube. To do so, the relative contributions of the radial pressure gradient, axial pressure gradient, and viscous dissipation to the temperature separation were investigated using numerical simulations and energy equation analysis. The results indicated that the axial pressure gradient in the near-axis region was the major contributor to an increase in hot exit temperature. In addition, the reason for the increase in hot exit temperature with an increase in cold mass fraction was explained. The reason for the decrease in cold exit temperature with an increase in cold mass fraction was also explained.
1. Introduction
A vortex tube is a simple device that separates incoming gas into cold and hot gases. This device has many advantages in terms of simplicity, durability, low cost, no maintenance, temperature control, environmental affinity, no moving parts, and no electricity or chemicals. Therefore, vortex tubes have been widely used in various industrial fields. Since the discovery of the vortex tube by [1,2], extensive experimental and numerical studies have been conducted to optimize the vortex tube geometry [3,4,5,6], apply the vortex tube for wide applications [7], investigate the flow pattern inside the tube [8,9,10], and elucidate the temperature (or energy) separation mechanism [5,7,11,12].
A large number of studies put a lot of effort towards explaining the energy (or temperature) separation. The temperature distribution inside a vortex tube is often explained by adiabatic expansion and compression [13,14,15]. Although the sudden expansion contributes significantly to the temperature drop in the core (near-axis) region, this theory does not account for a hot exit temperature higher than the inlet temperature because the pressure at any point inside the tube is lower than the inlet pressure [10,15,16,17].
Kurosaka [18] proposed an acoustic streaming model; however, this model did not build a quantitative relationship with thermal parameters. Further, numerical simulation results [15], which did not consider the acoustic streaming effect, showed good agreement with the experimental data of [18]. Stephan et al. [19] stated that the temperature separation resulted from a secondary flow (Gotler vortex) in the boundary layer along a concave surface. However, the Gotler vortex is a small secondary flow and cannot explain the temperature increase in the axial direction. Ahlborn et al. [20] attributed the heating to the conversion of kinetic energy into heat and the cooling to the reverse process. Ahlborn et al. [21] and Ahlborn and Gordon [22] suggested that the temperature separation process was similar to the classic refrigeration cycle because the secondary circulation acted as a refrigerant. However, Behera et al. [15] and Behera et al. [23] argued that secondary circulation played a role in reducing the temperature separation.
Meanwhile, Arbuzov et al. [14] concluded that the increase in temperature was attributed to the viscous heating of the boundary layer and that the formation of a strong vortex flow resulted in adiabatic cooling in the core region. Dutta et al. [24] claimed that shear energy transfer was the main reason for energy separation, but how shear work contributes to temperature separation was not discussed. Xue et al. [25] analyzed temperature separation in terms of exergy distribution. Guo and Zhang [26] presumed that energy transfer occurred from the inner vortex region to the outer vortex through the boundary between the two vortices.
Some researchers attributed energy separation to the heat pump mechanism [27,28,29,30]. If some fluid moves radially back and forth due to turbulent eddies, the fluid tends to be adiabatically heated as it moves from the inner core region to the outer periphery region and adiabatically cooled as it moves from the periphery region to the core region. However, turbulent eddies also contribute to temperature homogenization.
The above existing works that elucidated the temperature separation were based on assumptions or hypotheses. In recent years, various studies have employed numerical simulations to study the vortex tube [31]. Table 1 summarizes previous numerical simulation works. Because this study is focused on the principle of temperature separation, the previous works that simply presented the results of geometry/condition optimization were not included in Table 1. In most works listed in Table 1, the temperature separation was not explained or was partially discussed based on the temperature distribution in the radial direction; however, as we show later in this study, the temperature does not always increase in the radial direction.

Table 1.
Previous numerical simulation works.
The flow structures were relatively well clarified [9,30,33,40,41,42]. However, the principle of temperature separation was less investigated. Liu and Liu [8] claimed that the angular momentum transfer, pressure expansion, and transformation from kinetic energy resulted in energy separation. Eiamsa-ard and Promvonge [43] tested the effect of each term in the energy equation on temperature separation. The mean kinetic energy diffusion was the main influence on the temperature separation in the inlet region, while pressure work, stress generation, and stress gradient transport played also a significant effect. However, the results were simply reported without a detailed explanation of the reasons. In addition, only one cold mass fraction was considered. Aljuwayhel et al. [35] quantified the energy transfer between the core and periphery regions and attributed the temperature separation to the work transfer caused by a viscous shear between the regions. However, viscous heating increases the temperature in the core region as well as in the periphery region.
Therefore, there is room for numerical simulations to explain the principle of temperature separation despite many previous works. Two-dimensional numerical simulations were carried out in this study. Two-dimensional simulations were enough to explain the principle of temperature separation and were a practical choice for considering many simulations with different cold mass fractions. In this study, the relative contributions of the radial pressure gradient, axial pressure gradient, and viscous dissipation to the temperature separation were discussed based on the simulation results and energy equation. Moreover, the effect of the cold mass fraction on the hot and cold exit temperatures were explained for the first time.
2. Numerical Methods
The flow and temperature fields inside the Ranque–Hilsch vortex tube were obtained by solving the mass, momentum, and energy equations, which are given respectively as:
where , , , , , , , , , and denote the density, velocity vector, pressure, effective viscosity, identity matrix, turbulent kinetic energy, total energy, effective thermal conductivity, temperature, and effective viscous stress tensor, respectively [46].
In Equation (3), the last term is related to viscous dissipation and must be included because of the strong vortex flow inside a small tube. In some existing studies [34,35,36], the standard turbulence model yielded better predictions of the vortex tube flow. Therefore, the standard turbulence model was also used in the present study.
Numerical simulations were conducted for the representative experimental data of [47], which is used in the literature on vortex tube. Figure 1 shows the computational domain for the axisymmetric swirl flow in the vortex tube. The tube length (), tube radius (), cold exit radius (), inlet length (), and hot exit length () values are 106 mm, 5.7 mm, 3.1 mm, 0.95 mm, and between 1–6 mm, respectively; air was used as the working fluid. The National Institute of Standards and Technology (NIST) air property model was used to consider more realistic thermodynamic properties [48]. Numerical simulations were conducted using the ANSYS Fluent solver [46].
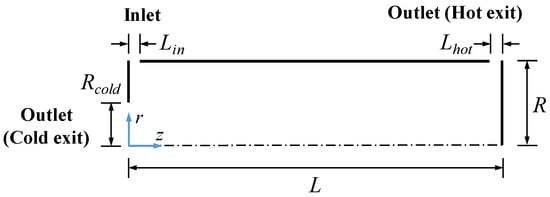
Figure 1.
Schematic of the computational domain for axisymmetric swirl flow.
Inlet conditions were specified according to the approach used by Skye et al. [47]. At the inlet, the mass flow rate and total temperature were set to 0.0083 kg/s and 294 K, respectively. The radial and circumferential components of the inlet flow direction were set to −0.25 and 0.97, respectively. The hot and cold exits were exposed to atmospheric pressure. The hot exit area was adjusted by the throttle to control the cold mass fraction (cmf), which is defined as the ratio of the cold exit mass flow rate to the inlet mass flow rate.
For the numerical methods, pressure-based coupled algorithms were used for pressure-velocity coupling, and the QUICK scheme was applied to the spatial discretization of variables. The residual criterion for convergence was set to 10−6. A grid test was conducted under the experimental conditions of cmf = 0.5. The quadrilateral grid system with finer grids near the inlet and two exits was used. Figure 2 shows the grid convergence test result. denotes the total temperature difference between the hot exit and inlet, and represents the total temperature difference between the cold exit and inlet. When the number of computational cells is more than 85,000 (with an average orthogonal quality of 0.99), the total temperatures at the hot and cold exits do not change significantly. Thus, in this study, we used the grid system with 85,000.
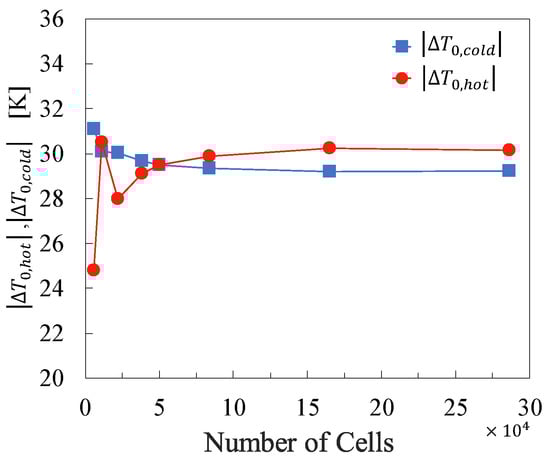
Figure 2.
Grid convergence test.
3. Results and Discussion
3.1. Validation
Figure 3 shows a comparison of the simulation results with Skye’s data [47]. When calculating the total temperatures at the hot and cold exits, mass-weighted averaging was applied. The present simulation results agree well with the experimental data. In particular, the prediction at the cold exit is better than Skye’s prediction, except in the low cold mass fraction region. The sudden reduction in in the low cold mass fraction region is attributed to the backflow of atmospheric air at 294 K through some area of the cold exit. The partial backflow is attributed to the presence of a large zone with negative pressure near the cold exit. This trend was also observed in Skye’s experimental and numerical data. The backflow through the cold exit disappears with an increase in the cold mass fraction.
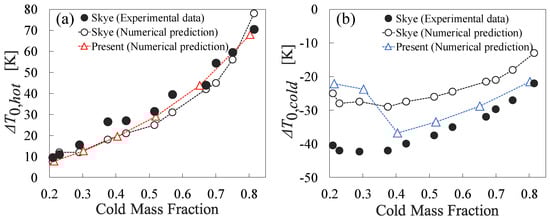
Figure 3.
Total temperature separation: (a) hot exit, (b) cold exit.
3.2. Total Temperature Separation
We discuss the simulation results of each of the exemplary cold mass fractions of 0.2, 0.5, and 0.8 to understand the total temperature separation. Figure 4 shows the total temperature difference contours for different cold mass fractions, where denotes the local total temperature minus the inlet total temperature.
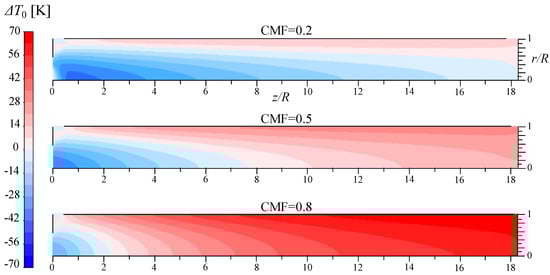
Figure 4.
Total temperature difference contours for different cold mass fractions.
The tendency of the total temperature to be higher in the periphery (near wall) region than in the core (near-axis) region is attributed to the strong vortex flow inside the tube. Figure 5 shows the pressure contours for the different cold mass fractions. The pressure in the periphery region is higher than that in the core region. Figure 6 shows the velocity contours for cmf = 0.2. The black line indicates the stagnation-stream surface at which the core and periphery vortex regions are separated. The velocity magnitude is very large near the wall but small near the axis, and the circumferential velocity accounts for most of the velocity magnitude. The higher the flow velocity, the higher the total temperature is.
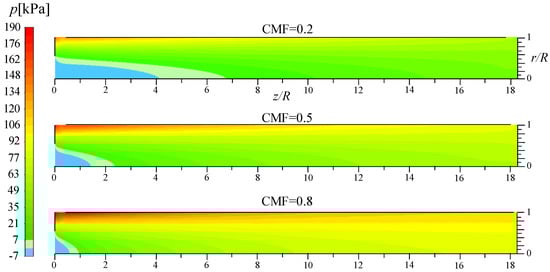
Figure 5.
Pressure contours for different cold mass fractions.
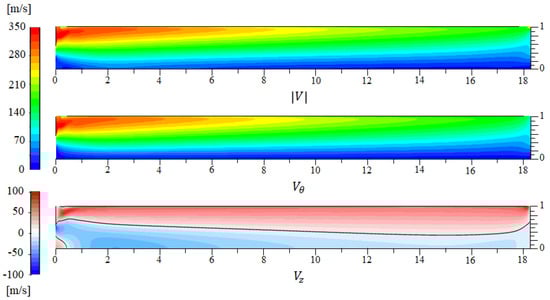
Figure 6.
Velocity contours for cmf = 0.2.
The tendency of the gradual increase in total temperature in the axial direction is attributed to static temperature (unless otherwise stated, temperature refers to static temperature). Figure 7 shows the temperature difference contours for different cold mass fractions, where denotes the difference between the local temperature and inlet temperature. Overall, the temperature increases in the axial direction. The temperature distribution shape is similar to the existing result [43]. It follows from Figure 6 and Figure 7 that the hot exit temperature is more affected by the axial temperature increase rather than the radial temperature increase. The increase in temperature at the hot exit appears to be less related to the energy transfer between the core and periphery regions. If the energy transfer between the two regions is the main cause of temperature separation and the core (near-axis) region continues to lose energy, the temperature in the core region would decrease in the axial direction. Rather, the temperature increases in the axial direction. Aljuwayhel et al. [35] attempted to explain the temperature separation in terms of heat transfer and viscous work transfer through the stagnation-stream surface. They attributed the temperature increase at the hot exit to the work transfer due to viscous shear. However, viscous heating increases the temperature in the core region as well as in the periphery region. For these reasons, the present analysis was not made on the stagnation-stream surface.
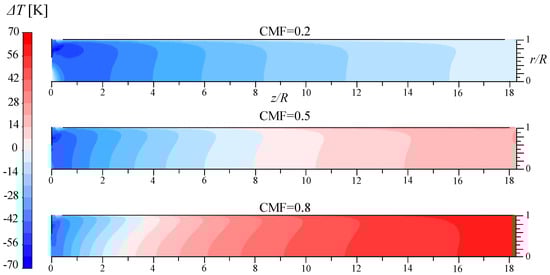
Figure 7.
Temperature difference contours for different cold mass fractions.
Notice that, for cmf = 0.8, the temperature increases significantly. This rapid increase in temperature contributes to a large total temperature at the hot exit, as shown in Figure 3a. Meanwhile, it is shown in Figure 7 that the decrease in the cold exit temperature is larger for cmf = 0.5 than it is for cmf = 0.8. Thus, the lower the cold mass fraction, the lower the total temperature is at the cold exit, except when the cold mass fraction is very low, as shown in Figure 3b. In the region where the cold mass fraction is very low, a partial backflow of atmospheric air at 294 K through the cold exit decreases the total temperature separation at the cold exit.
In summary, the gradual increase in total temperature in the radial direction is mainly due to the gradual increase in velocity magnitude in the radial direction; . The gradual increase in total temperature in the axial direction is due to the gradual increase in temperature in the axial direction; . In the next section, the gradual increase in temperature in the axial direction is discussed.
3.3. Temperature Separation
For a steady and axisymmetric swirl flow, the energy equation, Equation (3), can be simplified considerably. Further, the heat conduction term is not considered in the temperature separation discussion because we are concerned with temperature separation; however, heat conduction always plays a role in making the temperature uniform in space. Consequently, the energy equation can be written as
where , , , and represent the radial velocity, axial velocity, temperature, and specific heat, respectively. On the right-hand side, the first and second terms are related to the reversible rate of internal energy increase by compression, and the third term is related to the irreversible viscous dissipation. is given by
To compare the first and second terms on the left-hand side of Equation (4), we define
Figure 8 shows the contours for the different cold mass fractions. Overall, is not very small in most regions, and this implies that is comparable to or higher than in most regions. In addition, considering the strong swirl flow characteristics, is considerably greater than in most regions. Therefore, the first term on the left-hand side of Equation (4) can be safely neglected, and the temperature equation can be simplified further as:
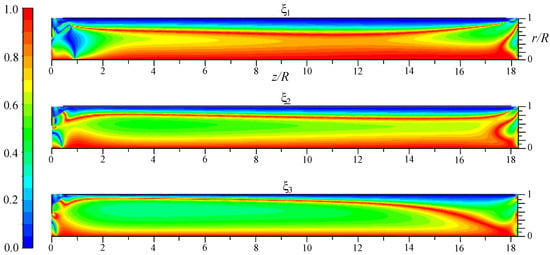
Figure 8.
Contours for different cold mass fractions.
The axial temperature gradient depends on the radial pressure gradient, axial pressure gradient, and viscous dissipation.
For comparing the three terms on the right-hand side of Equation (7), we define
where , , and represent the measures of the relative importance of the first, second, and third terms on the right-hand side of Equation (7), respectively. Figure 9 and Figure 10 show the , , and contours and streamlines for cmf = 0.2 and 0.8, respectively. is dominant in the inner core region; and are large in the periphery region and tend to have similar values, except in the region near the hot exit. Figure 9 shows that is very high at approximately , which is attributed to the increased turbulent viscosity there. As seen in the streamlines created using the radial and axial velocities, the flow is complicated because of the presence of the stagnation point.
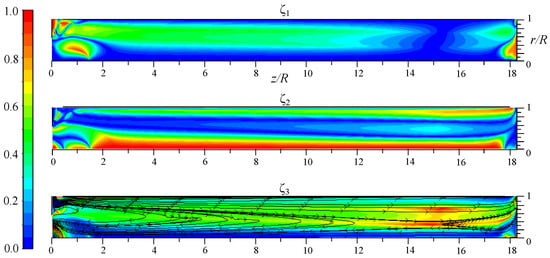
Figure 9.
, , and streamlines for cmf = 0.2.
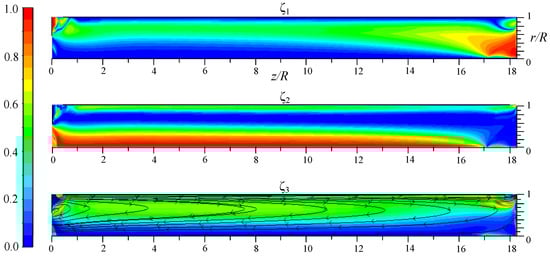
Figure 10.
, , and streamlines for cmf = 0.8.
As shown in Figure 6, the axial velocity is positive and negative in the periphery and core regions, respectively. The calculations are performed along the axial direction lines at r/R = 0.1 and 0.8 to avoid the singularity in calculating and from Equation (8). The two horizontal lines belong to either the core or periphery region; the sign of does not change in most regions of each horizontal line. It is desirable to interpret the positive and negative values of as positive and negative contributions to , respectively, because the heat conduction effect was not included and some assumptions were used in Equation (7).
Figure 11 shows the distributions of , , and along the axial-direction line at r/R = 0.1 (core vortex region). The value of is considerably higher than those of and . This means that the axial pressure gradient in the near-axis region is the major contributor to an increase in temperature in the axial direction. Overall, the value of is higher for cmf = 0.8 than that for 0.2, which implies that the axial pressure gradient increases with the cold mass fraction and is consistent with the pressure contours shown in Figure 5. The higher the cold mass fraction, the higher the axial pressure gradient in the near-axis region. This is because as the pressure in the near-axis region at the hot exit section increases due to narrowing the hot exit area by the throttle valve, the return of flow from the hot exit section toward the cold exit section becomes large.
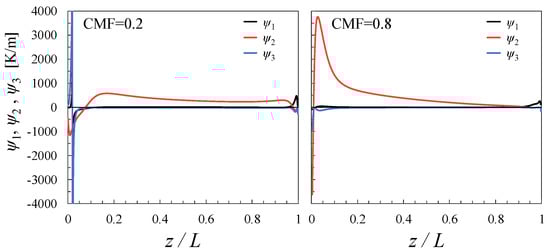
Figure 11.
Distributions of , , and along the axial-direction line at r/R = 0.1.
Figure 12 plots the distributions of , , and along the horizontal lines at r/R = 0.8 (periphery region). The viscous dissipation effect () is seen to contribute the most to the temperature separation in the peripheral region. However, that effect is expected to be reduced by the other effects. Figure 13 compares the distributions of at r/R = 0.1 and 0.8. For both cmf = 0.2 and cmf = 0.8, the magnitudes of at r/R = 0.1 are considerably greater than those at r/R = 0.8. Consequently, the increase in the hot exit temperature results from the axial pressure gradient in the core region; the higher the cold mass fraction, the larger the axial pressure gradient is. Thus, the hot exit temperature increases with the cold mass fraction.
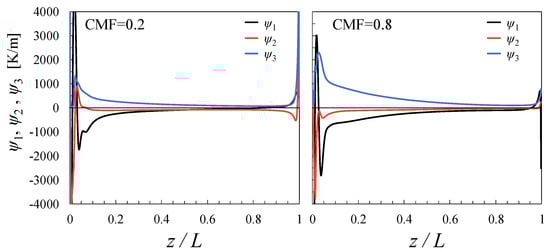
Figure 12.
Distributions of , , and along the axial-direction line at r/R = 0.8.
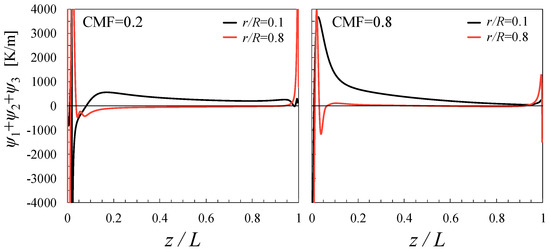
Figure 13.
Comparison of the distributions of at r/R = 0.1 and 0.8.
According to the adiabatic expansion and compression theory, the temperature inside the tube must be lower than the inlet temperature because the pressure at any point inside the tube is lower than the inlet pressure, as shown in Figure 5. In this study, the axial temperature gradient was analyzed in relation to the axial pressure gradient. Therefore, although the pressure at any point inside the tube is lower than the inlet pressure, the temperature may increase significantly in the axial direction because of the axial pressure gradient in the core region. As the first approximation of Equation (7), the temperature difference between the hot and cold exits can be approximated as , where denotes the pressure difference between the center of the right end of the tube and the center of the left cold exit. This approximation is based on the fact that the axial pressure gradient in the core region is the major contributor to an increase in temperature in the axial direction. Consider the pressure contour for cmf = 0.8, as shown in Figure 5, where . Assuming that and , the temperature difference between the hot and cold exit is estimated to be 97 K, which is not very different from the temperature difference of 90 K for cmf = 0.8, as shown in Figure 7.
Meanwhile, Liew et al. [28] developed a prediction model for the hot and cold exit temperatures, which is based on the heat pump theory and requires only the inlet and exit pressures. However, since turbulent eddies may also contribute to temperature homogenization, that model is not complete. In this work, the hot exit temperature increase was attributed to the large axial pressure gradient. The higher the cold mass fraction, the larger the axial pressure gradient was. This is because the pressure in the region near the hot exit must be sufficiently high enough to create a reverse flow in the core toward the cold exit, as the hot exit area is reduced by adjusting the hot end valve.
A swirling vortex flow results in decreases in cold exit temperature and core-region pressure, and the cold exit temperature depends on the cold mass fraction. As shown in Figure 5, the lower flow rate leaves the cold exit, and the larger negative pressure zone appears near the cold exit. If the negative pressure zone is too large, a partial backflow of atmospheric air at 294 K through the cold exit may occur. In that condition, the decrease in cold exit temperature decreases as the cold mass fraction decreases. This phenomenon was also reported by [47].
It is also seen in Figure 3b and Figure 7 that the decrease in the cold exit temperature for cmf = 0.8 is smaller than that for cmf = 0.5. If the cold mass fraction is large enough that a partial backflow does not occur through the cold exit, then the cold exit temperature decreases as the cold mass fraction increases. The first reason is that the overall temperature inside the tube increases as the cold mass fraction increases. The second reason is that the core vortex flow moving toward the cold exit serves to transport the hot air in the hot exit region to the cold exit region. Therefore, as shown in Figure 7, for a high cold mass fraction, the temperature in the near-axis region tends to be higher than that in the periphery region. It is interesting to notice that the temperature does not always increase in the radial direction.
4. Conclusions
Numerical simulations were conducted to explain the principle of energy separation in the vortex tube. The tendency of hot-exit temperature was explained as follows:
- The axial pressure gradient in the near-axis region was the major contributor to an increase in temperature in the axial direction. Due to narrowing the hot exit area by the throttle valve, the pressure increased in the near-axis region, and the temperature increased in the axial direction due to reversible compression.
- The higher the cold mass fraction, the higher the hot exit temperature was, which was attributed to the fact that, as the pressure in the near-axis region at the hot exit section increased, the return of flow from the hot exit section toward the cold exit section became large.
- The viscous dissipation effect was significant only in the region adjacent to the stagnation point.
- The tendency of the cold exit temperature with respect to the cold mass fraction was explained as follows:
- When the cold mass fraction was low and the negative pressure zone was too large, a partial backflow of atmospheric air through the cold exit occurred. In that condition, the decrease in cold exit temperature decreased with a decrease in the cold mass fraction.
- When the cold mass fraction was large such that a partial backflow did not occur through the cold exit, the cold exit temperature decreased with an increase in the cold mass fraction. The reason was that the core vortex flow moving toward the cold exit served to transport the hot air in the hot exit region to the cold exit region. It was interesting that, for a high cold mass fraction, the temperature in the near-axis region tended to be higher than that in the periphery region.
Two-dimensional numerical simulations were enough to explain the principle of temperature separation and were a practical choice for considering many simulations with different cold mass fractions, though they have limitations. Therefore, three-dimensional numerical simulations will be conducted to confirm the principle of temperature separation.
Author Contributions
Conceptualization, B.J.K.; validation, S.Y.P.; formal analysis, S.S.Y.; data curation, S.H.Y.; writing—original draft preparation, S.Y.P.; writing—review and editing, B.J.K. All authors have read and agreed to the published version of the manuscript.
Funding
This work was supported by National Research Foundation of Korea grants funded by the Ministry of Science and ICT (No. NRF-2021M2D2A1A02039565 and NRF-2022R1A4A1030333).
Institutional Review Board Statement
Not applicable.
Informed Consent Statement
Not applicable.
Data Availability Statement
The simulated data presented in this paper are available on request from the corresponding author.
Conflicts of Interest
The authors declare no conflict of interest.
References
- Ranque, G.J. Experiments on Expansion in a Vortex with Simultaneous Exhaust of Hot and Cold Air. J. Phys. Radium 1933, 4, 112–114. [Google Scholar]
- Hilsch, R. The use of the expansion of gases in a centrifugal field as cooling process. Rev. Sci. Instrum. 1947, 18, 108–113. [Google Scholar] [CrossRef] [PubMed]
- Thakare, H.R.; Monde, A.; Parekh, A.D. Experimental, computational and optimization studies of temperature separation and flow physics of vortex tube: A review. Renew. Sustain. Energy Rev. 2015, 52, 1043–1071. [Google Scholar] [CrossRef]
- Im, S.Y.; Yu, S.S. Effects of geometric parameters on the separated air flow temperature of a vortex tube for design optimization. Energy 2012, 37, 154–160. [Google Scholar] [CrossRef]
- Khait, A.; Noskov, A.; Alekhin, V.; Bianco, V. Analysis of the local entropy generation in a double-circuit vortex tube. Appl. Therm. Eng. 2018, 130, 1391–1403. [Google Scholar] [CrossRef]
- Khait, A.; Bianco, V.; Lovtsov, A.; Noskov, A.; Alekhin, V. Novel transonic nozzle for Ranque-Hilsch vortex tube. Int. J. Heat Mass Transf. 2021, 180, 121801. [Google Scholar] [CrossRef]
- Zhang, B.; Guo, X. Prospective applications of Ranque–Hilsch vortex tubes to sustainable energy utilization and energy efficiency improvement with energy and mass separation. Renew. Sustain. Energy Rev. 2018, 89, 135–150. [Google Scholar] [CrossRef]
- Liu, X.; Liu, Z. Investigation of the energy separation effect and flow mechanism inside a vortex tube. Appl. Therm. Eng. 2014, 67, 494–506. [Google Scholar] [CrossRef]
- Farouk, T.; Farouk, B. Large eddy simulations of the flow field and temperature separation in the Ranque–Hilsch vortex tube. Int. J. Heat Mass Transf. 2007, 50, 4724–4735. [Google Scholar] [CrossRef]
- Xue, Y.; Binns, J.R.; Arjomandi, M.; Yan, H. Experimental investigation of the flow characteristics within a vortex tube with different configurations. Int. J. Heat Fluid Flow 2019, 75, 195–208. [Google Scholar] [CrossRef]
- Xue, Y.; Arjomandi, M.; Kelso, R. A critical review of temperature separation in a vortex tube. Exp. Therm. Fluid Sci. 2010, 34, 1367–1374. [Google Scholar] [CrossRef]
- Eiamsa-ard, S.; Promvonge, P. Numerical simulation of flow field and temperature separation in a vortex tube. Int. Commun. Heat Mass Transf. 2008, 35, 937–947. [Google Scholar] [CrossRef]
- Kazantseva, O.V.; Piralishvili, S.A.; Fuzeeva, A.A. Numerical Simulation of Swirling Flows in Vortex Tubes. High Temp. 2005, 43, 608–613. [Google Scholar] [CrossRef]
- Arbuzov, V.A.; Dubnishchev, Y.N.; Lebedev, A.V.; Pravdina, M.K.; Yavorski, N.I. Observation of large-scale hydrodynamic structures in a vortex tube and the Ranque effect. Tech. Phys. Lett. 1997, 23, 938–940. [Google Scholar] [CrossRef]
- Behera, U.; Paul, P.J.; Dinesh, K.; Jacob, S. Numerical investigations on flow behaviour and energy separation in Ranque–Hilsch vortex tube. Int. J. Heat Mass Transf. 2008, 51, 6077–6089. [Google Scholar] [CrossRef]
- Shannak, B.A. Temperature separation and friction losses in vortex tube. Heat Mass Transf. 2004, 40, 779–785. [Google Scholar] [CrossRef]
- Gao, C.M.; Bosschaart, K.J.; Zeegers, J.C.H.; de Waele, A.T.A.M. Experimental study on a simple Ranque–Hilsch vortex tube. Cryogenics 2005, 45, 173–183. [Google Scholar] [CrossRef]
- Kurosaka, M. Acoustic streaming in swirling flow and the Ranque—Hilsch (vortex-tube) effect. J. Fluid Mech. 1982, 124, 139–172. [Google Scholar] [CrossRef]
- Stephan, K.; Lin, S.; Durst, M.; Huang, F.; Seher, D. An investigation of energy separation in a vortex tube. Int. J. Heat Mass Transf. 1983, 26, 341–348. [Google Scholar] [CrossRef]
- Ahlborn, B.; Keller, J.U.; Staudt, R.; Treitz, G.; Rebhan, E. Limits of temperature separation in a vortex tube. J. Phys. D Appl. Phys. 1994, 27, 480–488. [Google Scholar] [CrossRef]
- Ahlborn, B.K.; Keller, J.U.; Rebhan, E. The Heat Pump in a Vortex Tube. J. Non-Equilib. Thermodyn. 1998, 23, 159–165. [Google Scholar] [CrossRef]
- Ahlborn, B.K.; Gordon, J.M. The vortex tube as a classic thermodynamic refrigeration cycle. J. Appl. Phys. 2000, 88, 3645–3653. [Google Scholar] [CrossRef]
- Behera, U.; Paul, P.J.; Kasthurirengan, S.; Karunanithi, R.; Ram, S.N.; Dinesh, K.; Jacob, S. CFD analysis and experimental investigations towards optimizing the parameters of Ranque–Hilsch vortex tube. Int. J. Heat Mass Transf. 2005, 48, 1961–1973. [Google Scholar] [CrossRef]
- Dutta, T.; Sinhamahapatra, K.; Bandyopadhyay, S. CFD analysis of energy separation in Ranque-Hilsch vortex tube at cryogenic temperature. J. Fluids 2013, 2013, 562027. [Google Scholar] [CrossRef]
- Xue, Y.; Arjomandi, M.; Kelso, R. Experimental study of the thermal separation in a vortex tube. Exp. Therm. Fluid Sci. 2013, 46, 175–182. [Google Scholar] [CrossRef]
- Guo, X.; Zhang, B. Analysis of the unsteady heat and mass transfer processes in a Ranque–Hilsch vortex tube: Tube optimization criteria. Int. J. Heat Mass Transf. 2018, 127, 68–79. [Google Scholar] [CrossRef]
- Kassner, R.; Knoernschild, E.M. Friction Laws and Energy Transfer in Circular Flow. Part 1—The Law of Shear Stresses in Circular Flow. Part 2—Energy Transfer in Circular Flow and Possible Applications (Explanation of the Hilsch or Ranque Effect); Headquarters Air Materiel Command Wright-Patterson Air Force Base: Dayton, OH, USA, 1948. [Google Scholar]
- Liew, R.; Zeegers, J.C.H.; Kuerten, J.G.M.; Michalek, W.R. Maxwell’s Demon in the Ranque-Hilsch Vortex Tube. Phys. Rev. Lett. 2012, 109, 054503. [Google Scholar] [CrossRef]
- Kolmes, E.J.; Geyko, V.I.; Fisch, N.J. Heat pump model for Ranque–Hilsch vortex tubes. Int. J. Heat Mass Transf. 2017, 107, 771–777. [Google Scholar] [CrossRef]
- Guo, X.; Zhang, B.; Shan, Y. LES study on the working mechanism of large-scale precessing vortices and energy separation process of Ranque-Hilsch vortex tube. Int. J. Therm. Sci. 2021, 163, 106818. [Google Scholar] [CrossRef]
- Karthikeya Sharma, T.; Amba Prasad Rao, G.; Madhu Murthy, K. Numerical Analysis of a Vortex Tube: A Review. Arch. Comput. Methods Eng. 2017, 24, 251–280. [Google Scholar] [CrossRef]
- Mirjalili, M.; Ghorbanian, K. Numerical investigation of transient thermo-fluid processes in a Ranque-Hilsch vortex tube. Int. J. Refrig. 2021, 131, 746–755. [Google Scholar] [CrossRef]
- Thakare, H.R.; Parekh, A.D. CFD analysis of energy separation of vortex tube employing different gases, turbulence models and discretisation schemes. Int. J. Heat Mass Transf. 2014, 78, 360–370. [Google Scholar] [CrossRef]
- Manimaran, R. Computational analysis of energy separation in a counter-flow vortex tube based on inlet shape and aspect ratio. Energy 2016, 107, 17–28. [Google Scholar] [CrossRef]
- Aljuwayhel, N.F.; Nellis, G.F.; Klein, S.A. Parametric and internal study of the vortex tube using a CFD model. Int. J. Refrig. 2005, 28, 442–450. [Google Scholar] [CrossRef]
- Thakare, H.R.; Parekh, A.D. Computational analysis of energy separation in counter—Flow vortex tube. Energy 2015, 85, 62–77. [Google Scholar] [CrossRef]
- Dutta, T.; Sinhamahapatra, K.P.; Bandyopdhyay, S.S. Comparison of different turbulence models in predicting the temperature separation in a Ranque–Hilsch vortex tube. Int. J. Refrig. 2010, 33, 783–792. [Google Scholar] [CrossRef]
- Chen, J.; Zeng, R.; Zhang, W.; Qiu, L.; Zhang, X. Numerical analysis of energy separation in Ranque-Hilsch vortex tube with gaseous hydrogen using real gas model. Appl. Therm. Eng. 2018, 140, 287–294. [Google Scholar] [CrossRef]
- Baghdad, M.; Ouadha, A.; Imine, O.; Addad, Y. Numerical study of energy separation in a vortex tube with different RANS models. Int. J. Therm. Sci. 2011, 50, 2377–2385. [Google Scholar] [CrossRef]
- Bianco, V.; Khait, A.; Noskov, A.; Alekhin, V. A comparison of the application of RSM and LES turbulence models in the numerical simulation of thermal and flow patterns in a double-circuit Ranque-Hilsch vortex tube. Appl. Therm. Eng. 2016, 106, 1244–1256. [Google Scholar] [CrossRef]
- Alekhin, V.; Bianco, V.; Khait, A.; Noskov, A. Numerical investigation of a double-circuit Ranque–Hilsch vortex tube. Int. J. Therm. Sci. 2015, 89, 272–282. [Google Scholar] [CrossRef]
- Secchiaroli, A.; Ricci, R.; Montelpare, S.; D’Alessandro, V. Numerical simulation of turbulent flow in a Ranque–Hilsch vortex tube. Int. J. Heat Mass Transf. 2009, 52, 5496–5511. [Google Scholar] [CrossRef]
- Eiamsa-ard, S.; Promvonge, P. Numerical investigation of the thermal separation in a Ranque–Hilsch vortex tube. Int. J. Heat Mass Transf. 2007, 50, 821–832. [Google Scholar] [CrossRef]
- Ouadha, A.; Baghdad, M.; Addad, Y. Effects of variable thermophysical properties on flow and energy separation in a vortex tube. Int. J. Refrig. 2013, 36, 2426–2437. [Google Scholar] [CrossRef]
- Khait, A.V.; Noskov, A.S.; Lovtsov, A.V.; Alekhin, V.N. Semi-empirical turbulence model for numerical simulation of swirled compressible flows observed in Ranque–Hilsch vortex tube. Int. J. Refrig. 2014, 48, 132–141. [Google Scholar] [CrossRef]
- ANSYS. ANSYS Fluent Theory Guide (Release 2022R1); ANSYS: Canonsburg, PA, USA, 2022. [Google Scholar]
- Skye, H.M.; Nellis, G.F.; Klein, S.A. Comparison of CFD analysis to empirical data in a commercial vortex tube. Int. J. Refrig. 2006, 29, 71–80. [Google Scholar] [CrossRef]
- Dutta, T.; Sinhamahapatra, K.P.; Bandyopadhyay, S.S. Numerical investigation of gas species and energy separation in the Ranque-Hilsch vortex tube using real gas model. Int. J. Refrig. 2011, 34, 2118–2128. [Google Scholar] [CrossRef]


Publisher’s Note: MDPI stays neutral with regard to jurisdictional claims in published maps and institutional affiliations. |
© 2022 by the authors. Licensee MDPI, Basel, Switzerland. This article is an open access article distributed under the terms and conditions of the Creative Commons Attribution (CC BY) license (https://creativecommons.org/licenses/by/4.0/).