
Uncertainty Analysis and Improvement of Propellant Gauging System Applied in Space

Abstract
:1. Introduction
2. Theoretical Model of the PGS Method
3. Measuring Uncertainty Analysis and the Modified Model
3.1. Measuring Uncertainty Analysis
3.1.1. Monte Carlo Method
3.1.2. Calculation Input
3.1.3. Uncertainty Analysis of Each Factor
3.2. Modified Model
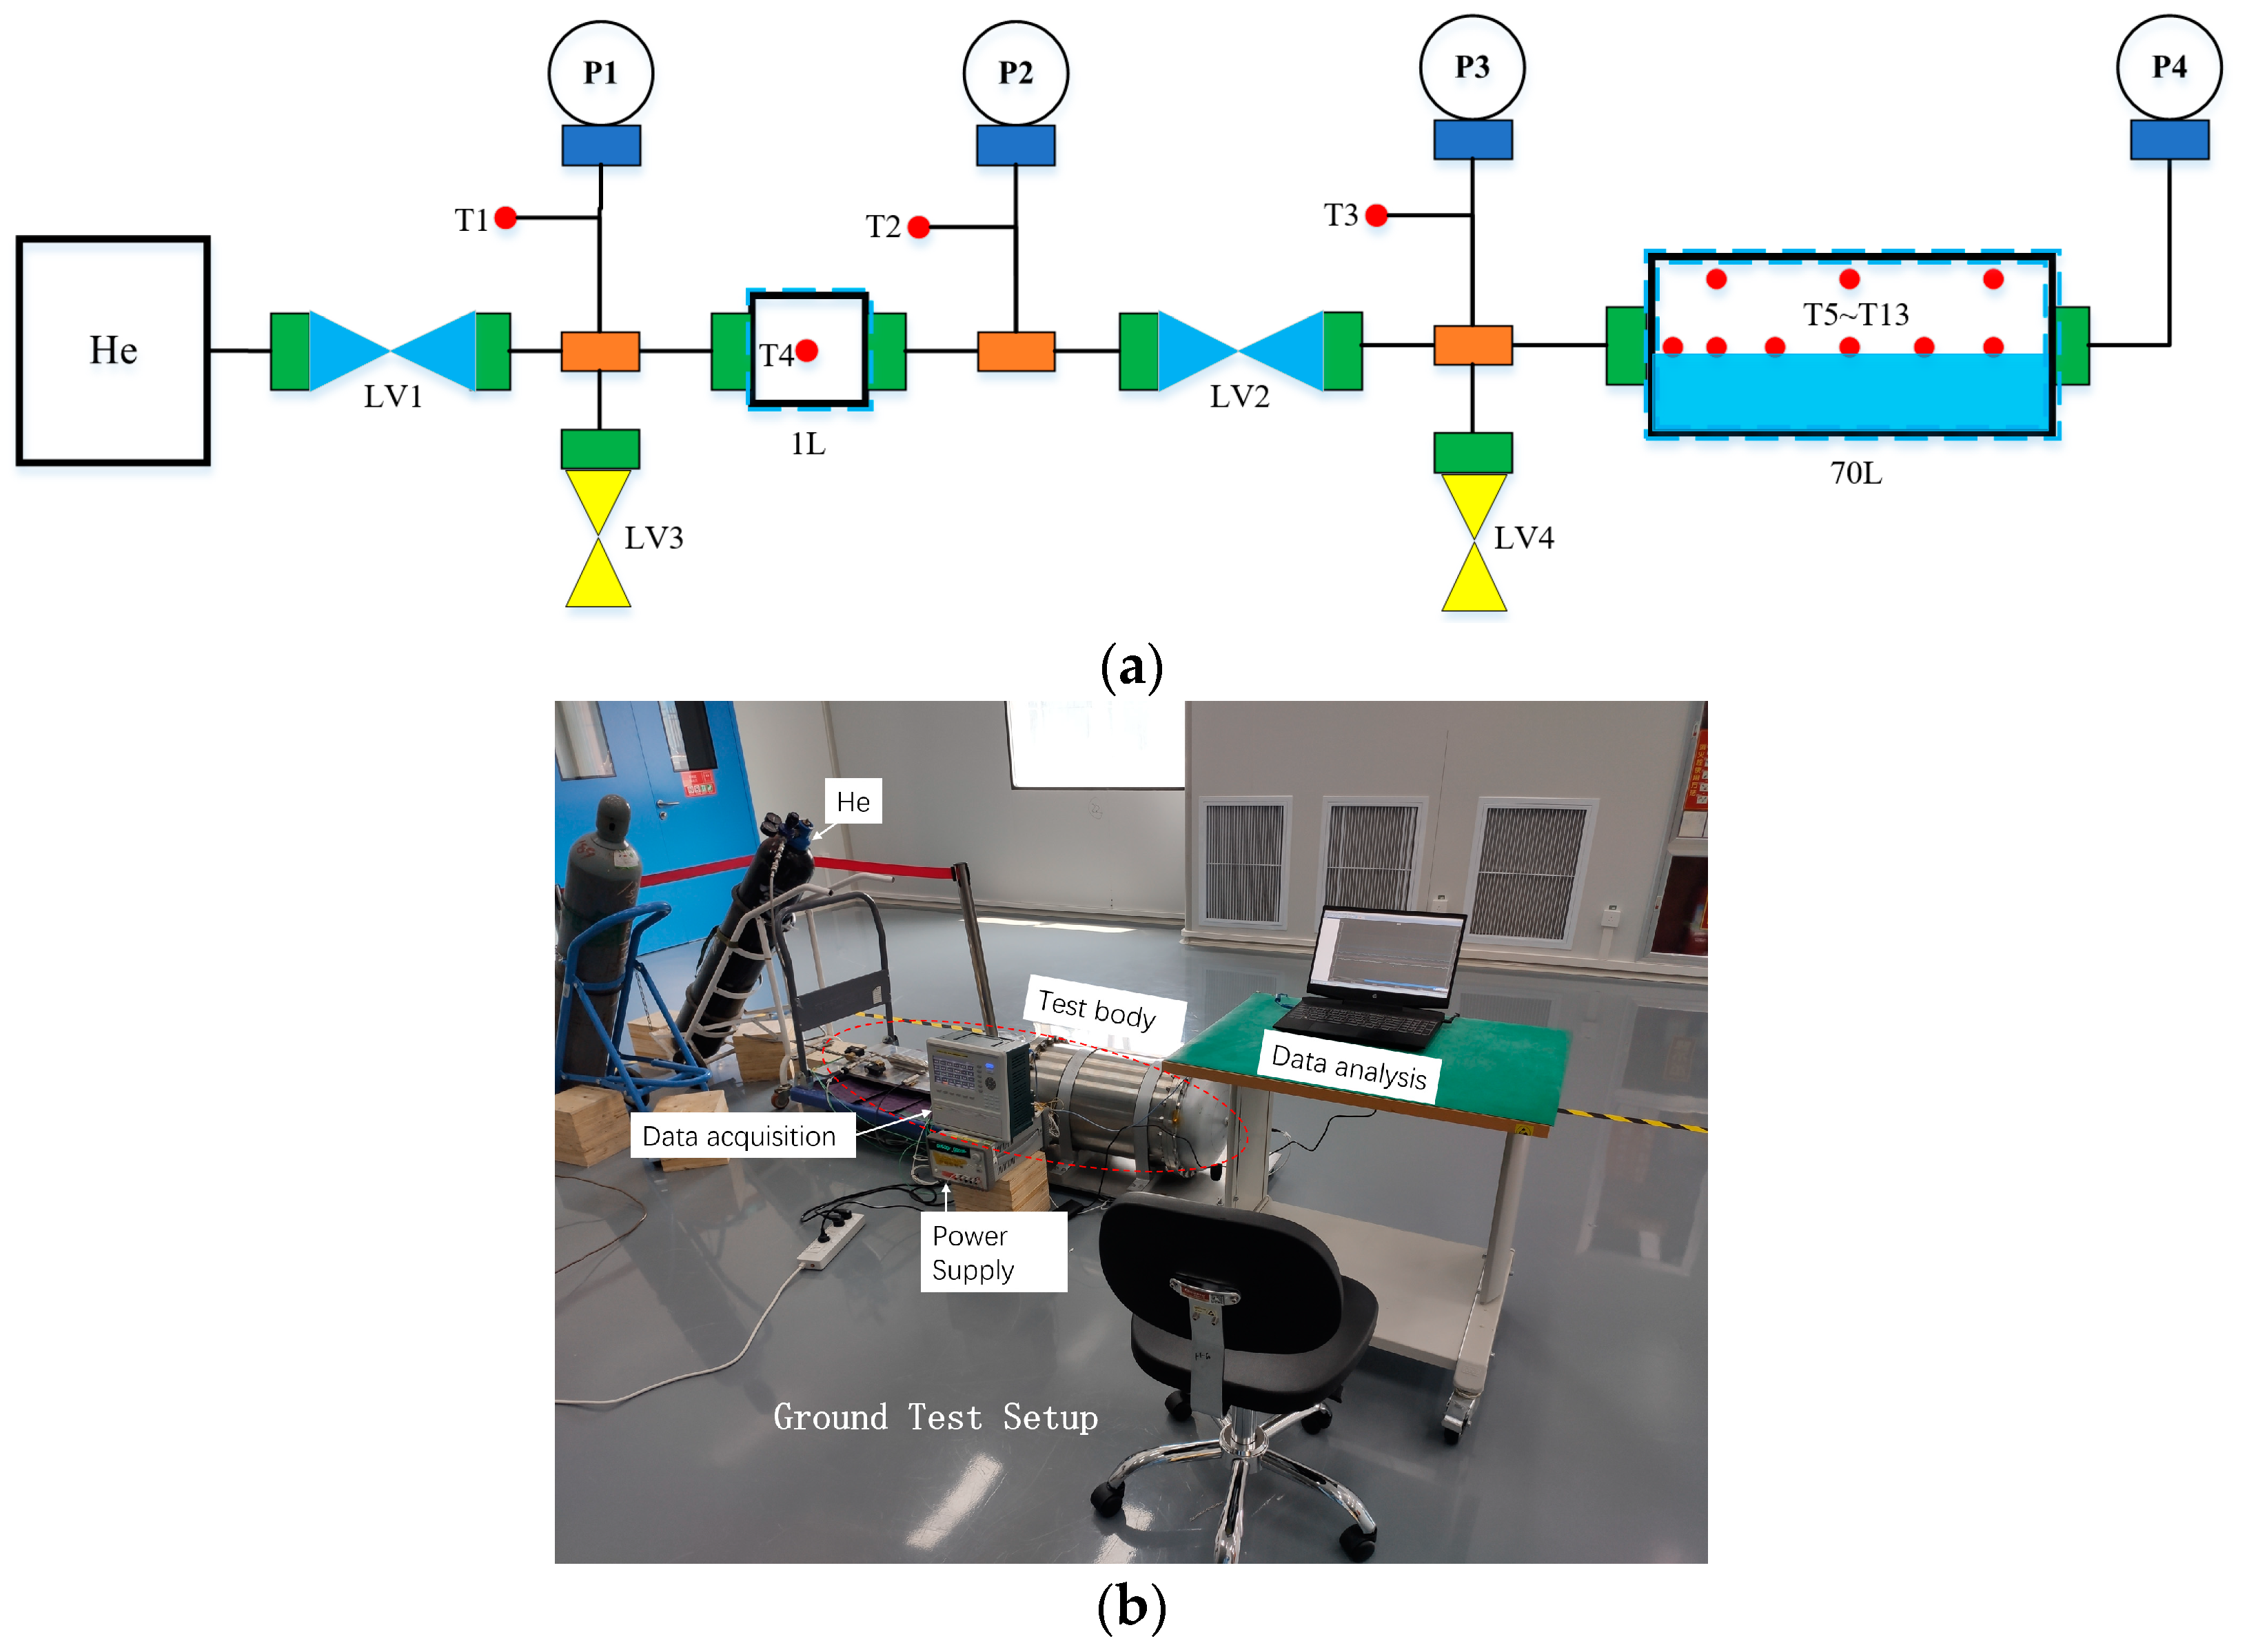
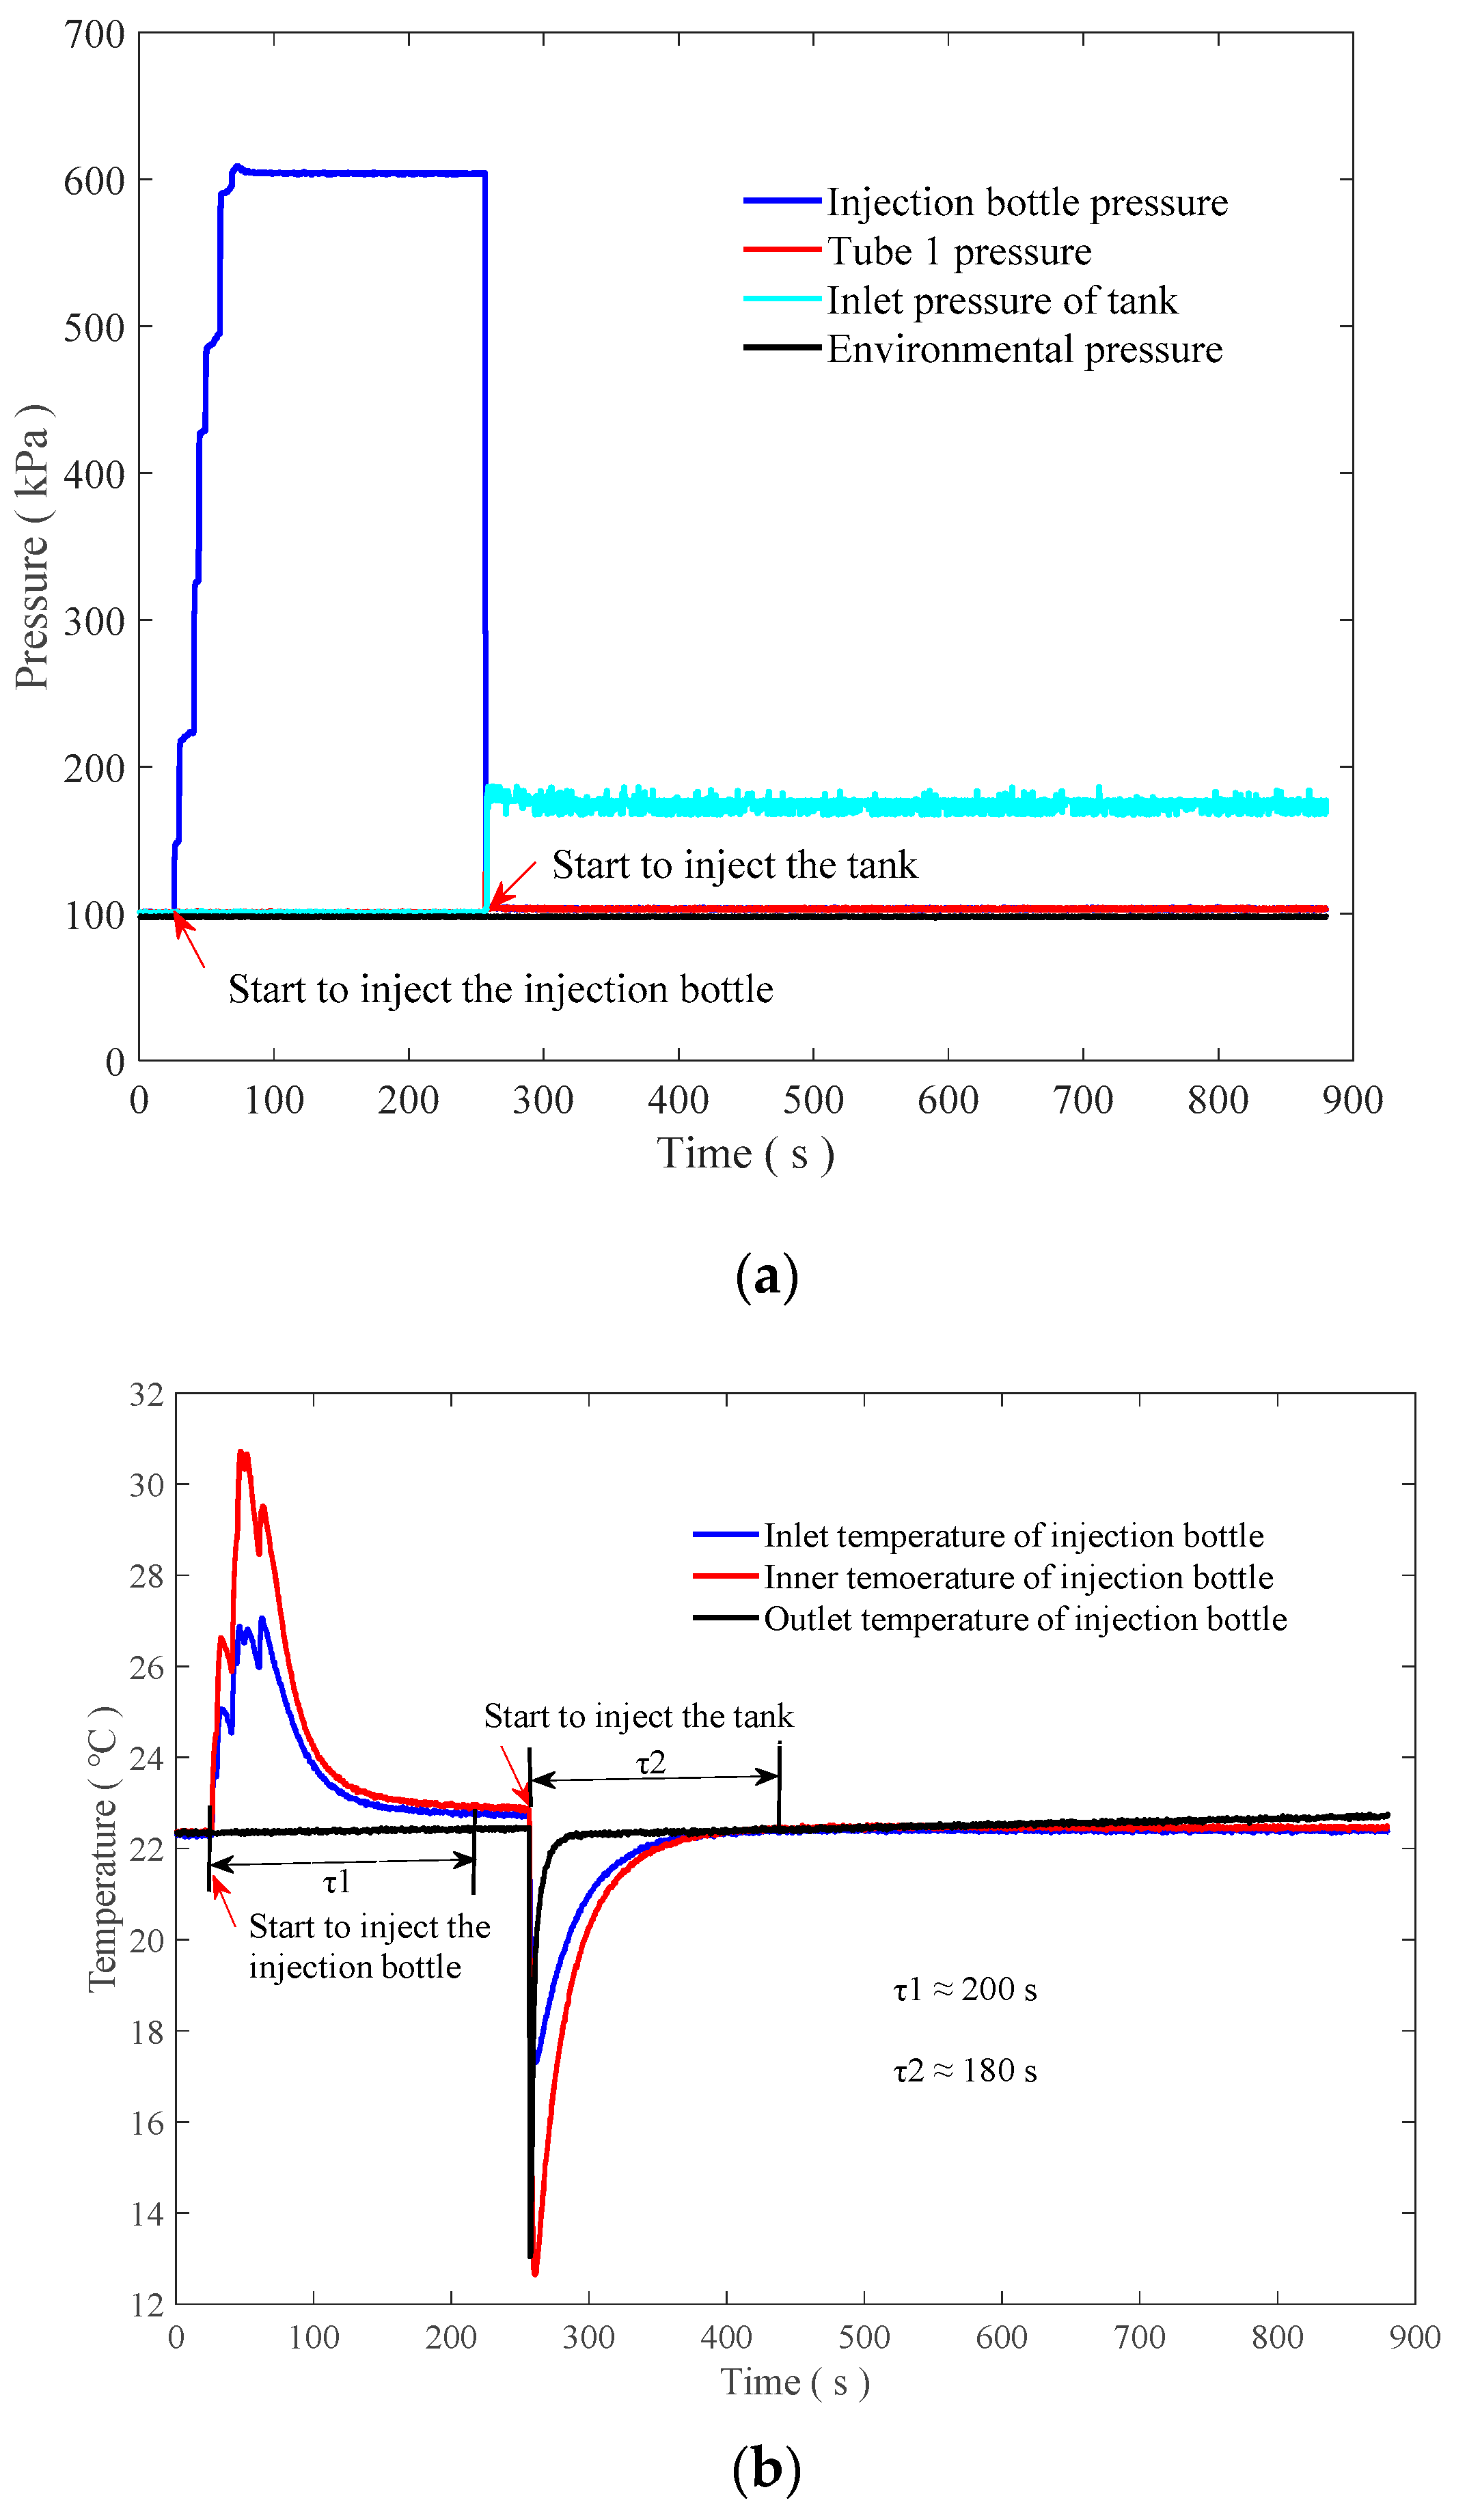
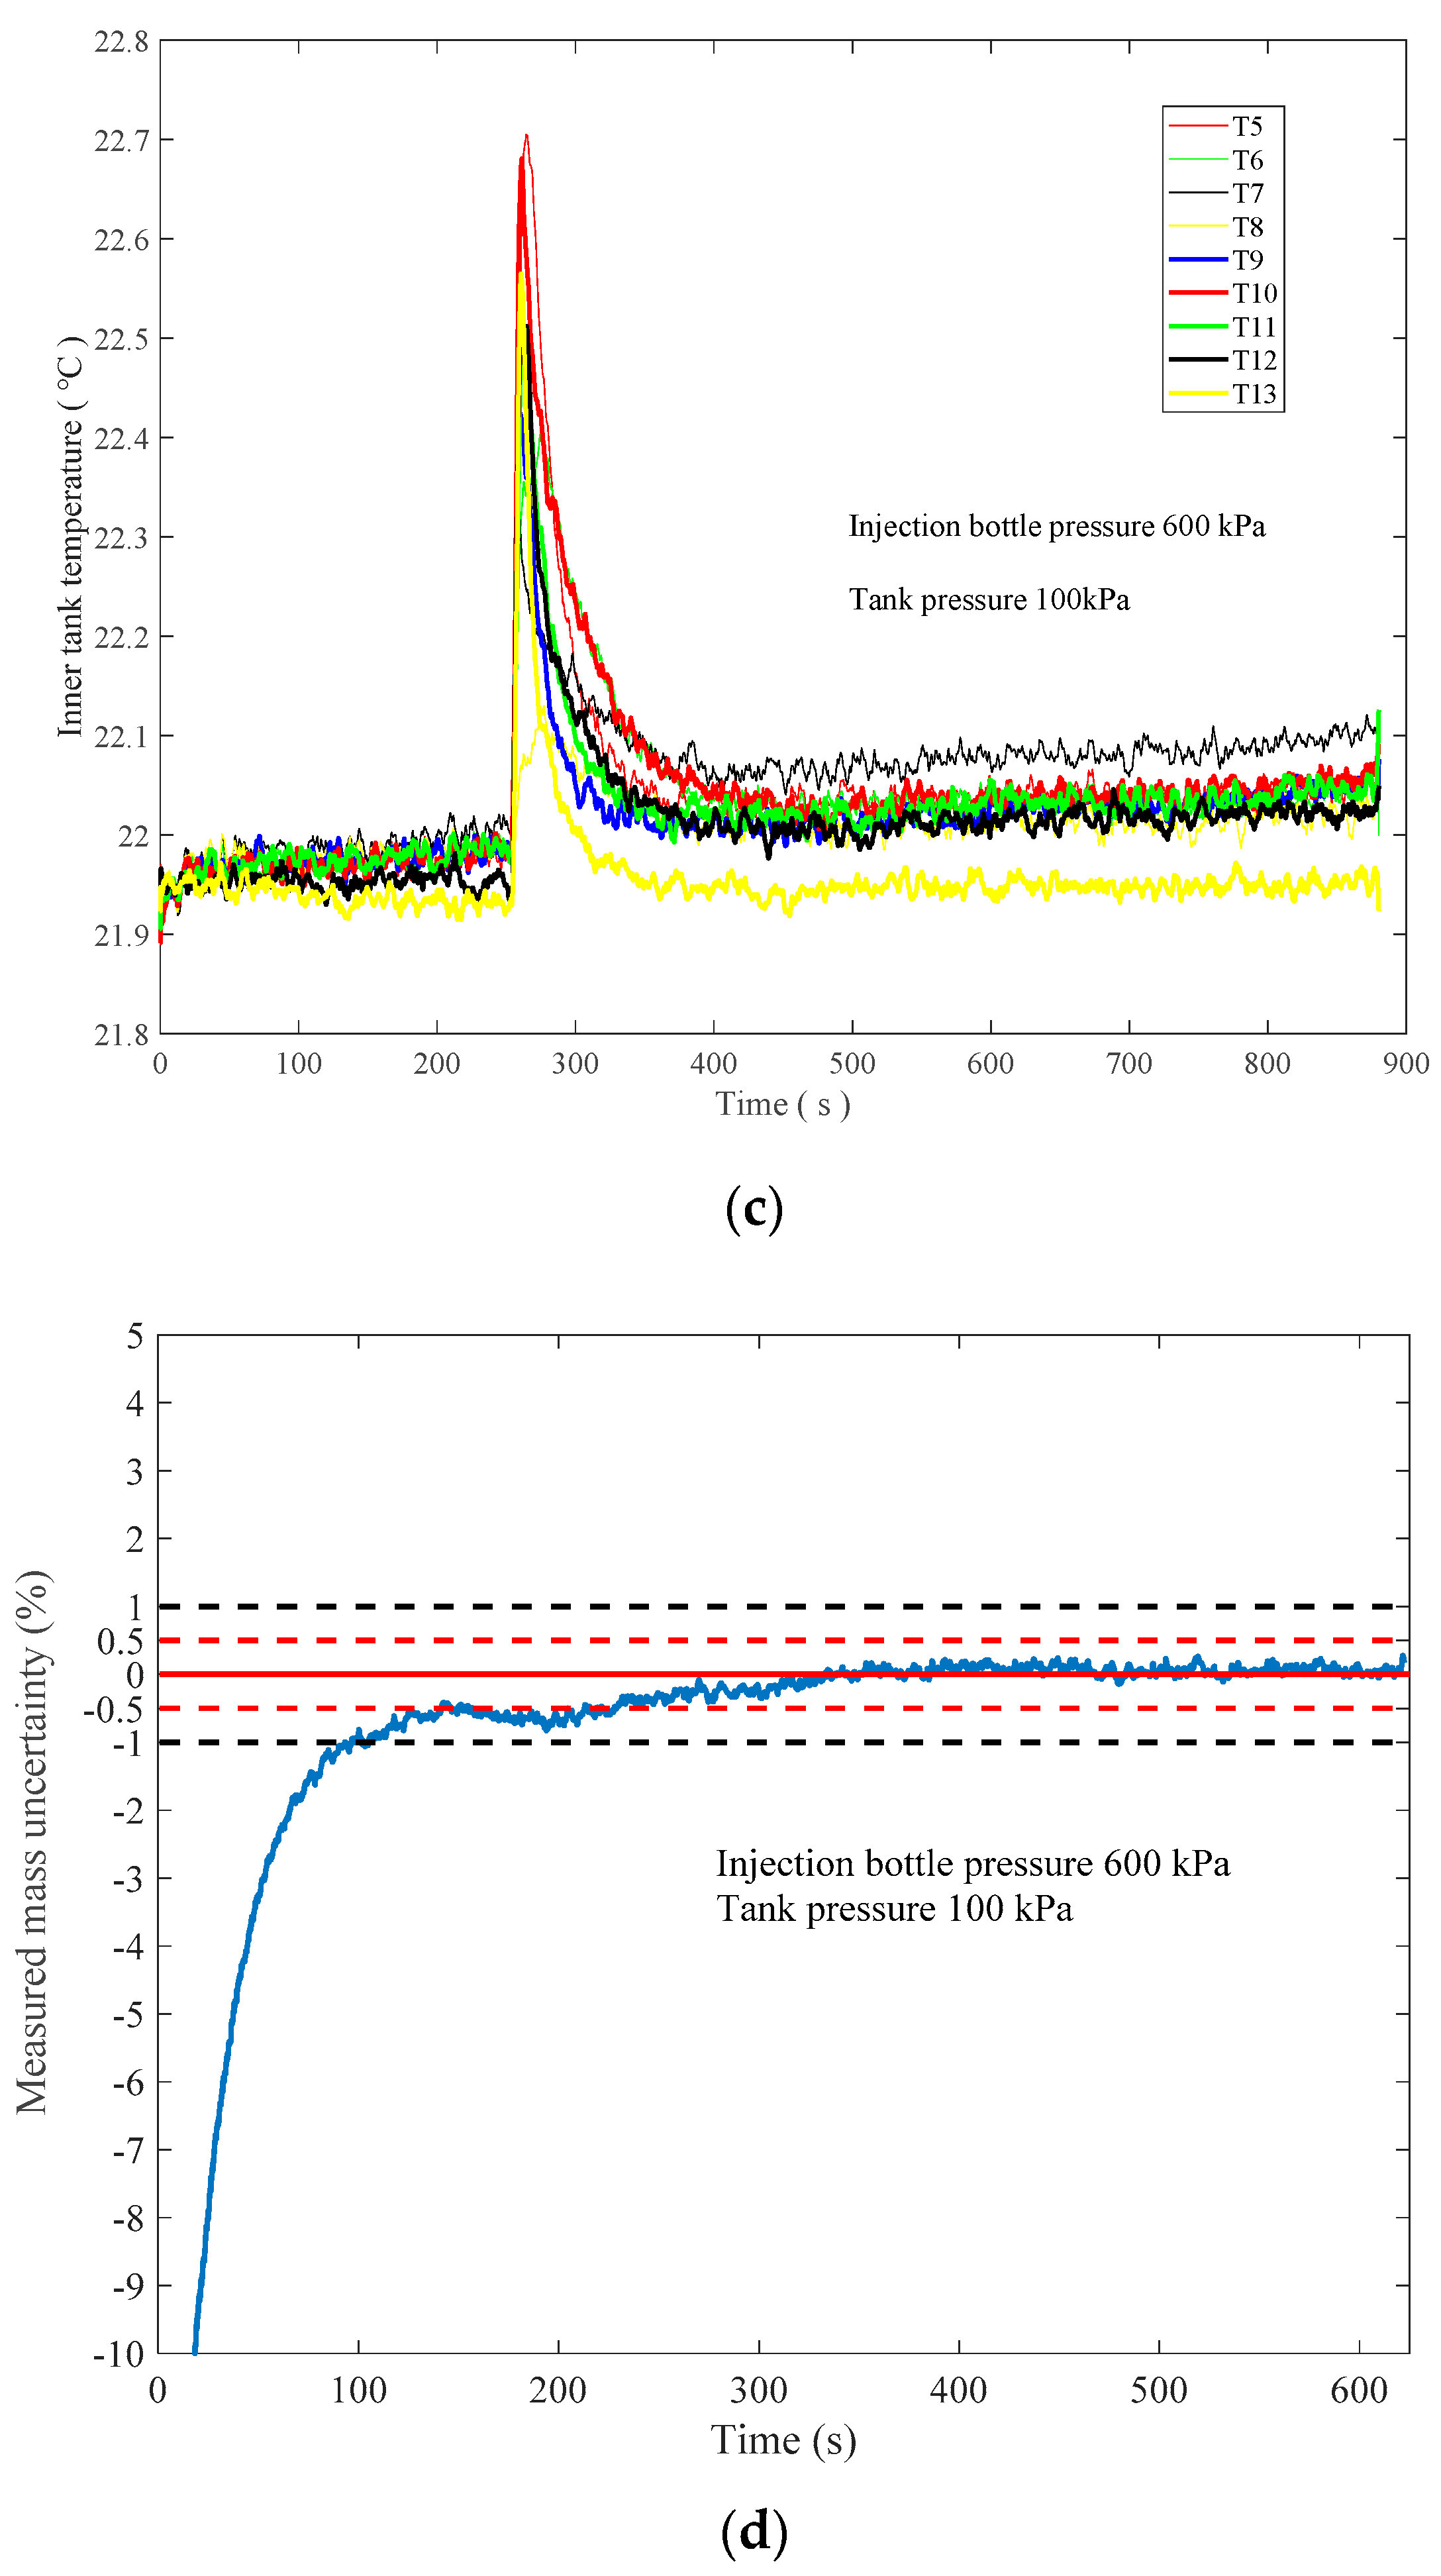
4. Ground Tests
Experiment Setup
5. Conclusions
Author Contributions
Funding
Informed Consent Statement
Conflicts of Interest
References
- Evans, R.L.; Olivier, J.R. Proposal for Determining the Mass of Liquid Propellant within a Space Vehicle Propellant Tank Subjected to a Zero Gravity Environment; NASA: Washington, DC, USA, 1963.
- Dodge, F.T. Propellant Mass Gauging: Database of Vehicle Applications and Research and Development Studies; Southwest Research Institute: San Antonio, TX, USA, 2008; pp. 1–43. [Google Scholar]
- Li, X.; Li, Z.; Zhang, R.; Zhang, X.; Chen, Y. The Effects of Droplets and Bubbles on On-orbit Propellant Volumetric Measurements Using Cavity Resonances. Microgravity Sci. Technol. 2022, 34, 7. [Google Scholar] [CrossRef]
- Trinks, H.; Behring, T. Liquid propellant content measurement methods applicable to space missions. In Proceedings of the 25th Joint Propulsion Conference, Monterey, CA, USA, 12–16 July 1989. [Google Scholar] [CrossRef]
- Jums, I.M.; Rogers, A.C. Compression Mass Gauge Testing in a Liquid Hydrogen Dewar. In Advances in Cryogenic Engineering; Springer: Boston, MA, USA, 1995; pp. 1803–1811. [Google Scholar]
- Van Dresar, N.T. PVT gauging with liquid nitrogen. Cryogenics 2006, 46, 118–125. [Google Scholar] [CrossRef]
- Van Dresar, N.T. An uncertainty analysis of the PVT gauging method applied to sub-critical cryogenic propellant tanks. Cryogenics 2004, 44, 515–523. [Google Scholar] [CrossRef]
- Kowalski, R.; Baker, D.L. Propellant Tank PVT Quantity Gauging Summary; NASA: Washington, DC, USA, 2013.
- Dresar, N.T.V.; Zimmerli, G.A. Pressure-Volume-Temperature (PVT) Gauging of an Isothermal Cryogenic Propellant Tank Pressurized with Gaseous Helium; NASA/TP-2014-218083; NASA: Washington, DC, USA, 2014.
- Dodge, F.T.; Green, S.T.; Petullo, S.P.; Van Dresar, N.T. Development and design of a zero-G liquid quantity gauge for a solar thermal vehicle. AIP Conf. Proc. 2002, 608, 502–509. [Google Scholar] [CrossRef] [Green Version]
- Green, S.; Walter, D.; Dodge, F.; Deffenbaugh, D.; Siebenaler, S.; Van Dresar, N. Ground Testing of a Compression Mass Gauge. In Proceedings of the 40th AIAA/ASME/SAE/ASEE Joint Propulsion Conference and Exhibit, Fort Lauderdale, FL, USA, 11–14 July 2004; pp. 1–12. [Google Scholar]
- Fu, J.; Chen, X.; Huang, Y. Uncertainty Analysis of Propellant Compression Mass Gauge for Spacecraft. Procedia Eng. 2012, 31, 122–127. [Google Scholar] [CrossRef] [Green Version]
- Fu, J.; Chen, X.Q.; Huang, Y.Y. Compression Mass Gauge Method for Liquid Propellant Residue. Chin. Space Sci. Technol. 2012, 32, 78–83. [Google Scholar]
- Fu, J.; Chen, X.; Huang, Y. Compression Frequency Choice for Compression Mass Gauge Method and Effect on Measurement Accuracy. Microgravity Sci. Technol. 2013, 25, 213–223. [Google Scholar] [CrossRef]
- Fu, J.; Chen, X.; Huang, Y.; Li, X. Validation of a Compression Mass Gauge using ground tests for liquid propellant mass measurements. Adv. Space Res. 2014, 53, 1359–1369. [Google Scholar] [CrossRef]
- Tang, F.; Liang, J.Q.; Song, T.; Ma, Y.H.; Lin, J.S. On-orbit flight verification of FY-4 satellite PGS technology. In Proceedings of the 38th Technical Exchange Conference of China Aerospace Third Professional Information Network and 2nd Aerospace Power Joint Conference—Liquid Propulsion Technology, Dalian, China, 2017; Available online: https://cpfd.cnki.com.cn/Article/CPFDTOTAL-HTDZ201708001007.htm (accessed on 4 September 2022). (In Chinese).
- Tang, F.; Liang, J.Q.; Ma, Y.H. FY-4 Satellite Propulsion System Enhances China’s Capability to Access Space. Space Int. 2017, 9–11. Available online: https://www.cnki.com.cn/Article/CJFDTOTAL-GJTK201710003.htm (accessed on 4 September 2022). (In Chinese).
- Doux, C.; Justak, J. Liquid Oxygen Test Results for an Optical Mass Gauge Sensor. In Proceedings of the 45th AIAA/ASME/SAE/ASEE Joint Propulsion Conference & Exhibit, Denver, CO, USA, 2–5 August 2009; pp. 1–13. [Google Scholar]
- Chi, X.; Ke, X.; Xu, W. Optical fibre liquid sensor for cryogenic propellant mass measurement. Electron. Lett. 2019, 55, 278–280. [Google Scholar] [CrossRef]
- Sullenberger, R.M.; Munoz, W.M.; Lyon, M.P.; Vogel, K.; Yalin, A.P.; Korman, V.; Polzin, K.A. Optical Mass Gauging System for Measuring Liquid Levels in a Reduced-Gravity Environment. J. Spacecr. Rocket. 2011, 48, 528–533. [Google Scholar] [CrossRef]
- Yendler, B.S.; Myers, M.; Chilelli, N.; Chernikov, S.; Wang, J.; Djamshidpour, A. Implementation of Thermal Gauging Method for ABS 1A (LM 3000) satellite. In Proceedings of the SpaceOps 2016 Conference, Daejeon, Korea, 16–20 May 2016. [Google Scholar] [CrossRef]
- Guo, L.; Li, Y.; Jiao, Y.; Tang, F.; Song, T. Ground Test on Thermal Propellant Gauging System. Aerosp. Control. Appl. 2018, 44, 74–78. [Google Scholar] [CrossRef]
- Guo, L.; Li, Y.; Jiao, Y.; Jin, Z.T.; Li, D.W. Numerical Simulation of thermal Propellant Gauging System for Satellite. Navig. Control. 2018, 17, 102–107. [Google Scholar] [CrossRef]
- Jiang, S.C.; Fu, X.; Kang, A.F.; Yuan, S.; Lin, J.S.; Yu, J. Research on Thermal Propellant Gauge System on Satellite. Aerosp. Shanghai 2014, 31, 43–47. Available online: https://www.cnki.com.cn/Article/CJFDTOTAL-SHHT201403008.htm (accessed on 4 September 2022).
- Klem, M.D.; Smith, T.D.; Wadel, M.F.; Meyer, M.L.; Free, J.M.; Cikanek, H.A., III. Liquid Oxygen/Liquid methane propulsion and Cyrogenic Advanced Development. In Proceedings of the 62nd International Aeronautical Congress, Cape Town, South Africa, 3–7 October 2011; p. 20110016509. [Google Scholar]
- Zimmerli, G.; Asipauskas, M.; Wagner, J.; Follo, J. Propellant quantity gauging using the radio frequency mass gauge. In Proceedings of the 49th AIAA Aerospace Sciences Meeting including the New Horizons Forum and Aerospace Exposition, Orlando, FL, USA, 4–7 January 2011; p. 1320. [Google Scholar]
- Zimmerli, G.A.; Mueller, C.H. Compatibility of the Radio Frequency Mass Gauge with Graphite-Epoxy Composite Tanks. In Proceedings of the JANNAF Propulsion Meeting, Nashville, TN, USA, 1–4 June 2015; p. 20150011071. [Google Scholar]
- Johnson, W.L.; Balasubramaniam, R.; Hibbs, R.; Zimmerli, G.A.; Asipauskas, M.; Bittinger, S.; Dardano, C.; Koci, F.D. Demonstration of Multilayer Insulation, Vapor Cooling of Structure, and Mass Gauging for Large-Scale Upper Stages: Structural Heat Intercept, Insulation, and Vibration Evaluation Rig (SHIIVER) Final Report; NASA: Washington, DC, USA, 2021.
- Zimmerli, G.A.; Vaden, K.; Herlacher, M.; Buchanan, D.; Van Dresar, N. Radio Frequency Mass Gauging of Propellants. In Proceedings of the 45th AIAA Aerospace Sciences Meeting and Exhibit, Reno, NV, USA, 8–11 January 2007; pp. 1–14. [Google Scholar]
- Ding, F.L.; Wei, Y.M. Application Analysis of Ultrasonic Flowmeter in the Spacecraft Propulsion System. Aerosp. Control. Appl. 2010, 36, 47–50. Available online: http://journal01.magtech.org.cn/Jwk3_kjkzjs/CN/Y2010/V36/I6/47 (accessed on 4 September 2022).
- Lei, W. Technologies of Liquid Gauge in Space. J. Propuls. Technol. 1996, 17, 83–86. Available online: https://www.cnki.com.cn/Article/CJFDTOTAL-TJJS603.018.htm (accessed on 4 September 2022).
- Da, D.; Zhang, T. The Technical Scheme for the Measurement of Liquid Propellant Residue on The National Satellite. J. Propuls. Technol. 1997, 18, 98–102. [Google Scholar]
- Da, D.; Zhang, T. Introduction and Estimation on Measurement Methods of Liquid Propellant Applicable to Satellites. J. Propuls. Technol. 1997, 18, 89–94. [Google Scholar]
- Song, T.; Ma, Y.H.; Lin, C.J.; Liang, J.Q.; Wei, Y.M. Analysis of Effect of Ground and Space Environment Propellant Gauging with Gas Injection Method. Spacecr. Eng. 2011, 20, 147–151. Available online: https://www.cnki.com.cn/Article/CJFDTOTAL-HTGC201104024.htm (accessed on 4 September 2022).
- Wei, Y.M.; Song, T.; Liang, J.Q. The Residual Propellant Gauging and Estimation Method on Spacecraft Parallel Tank Configuration. Aerosp. Control. Appl. 2010, 36, 25–30. Available online: https://gszy.irtree.com/Qikan/Article/Detail?id=35822284 (accessed on 4 September 2022).
- Sun, X.L.; Liang, L.; Tian, L.; Huang, Z.; Yang, L. Method of High Accuracy Residual Propellant Measurement Based on Gas Injection. Spacecr. Eng. 2020, 29, 1–6. Available online: https://www.cnki.com.cn/Article/CJFDTOTAL-HTGC202001003.htm (accessed on 4 September 2022).
- Zhang, T.; Da, D. Thermodynamic Models of PGSI and Their Usage for Liquid Propellant Remaining Measurement on Satellite. Chin. Space Sci. Technol. 1998, 2, 52–57. [Google Scholar]
- Zhang, T.; Da, D.; Cheng, B.; Li, Y.; Liu, Z.; Huo, H. The Simulation Test for Gauging Liquid Propellant Remaining on a Satellite. Chin. Space Sci. Technol. 2000, 4, 44–50. [Google Scholar]
- Yuan, L.; Wang, S.; Lian, R.Z.; Liu, T. On-board gauging method of remaining propellant. J. Rocket. Propuls. 2013, 39, 81–87. Available online: https://www.cnki.com.cn/Article/CJFDTOTAL-HJTJ201305016.htm (accessed on 4 September 2022).


| Vessel | Before Gas Injection | After Gas Injection | ||
|---|---|---|---|---|
| P (MPa) | T (°C) | P (MPa) | T (°C) | |
| High-pressure gas bottle 1 | 10.15 | / | 9.30 | / |
| High-pressure gas bottle 2 | 10.25 | / | 9.40 | / |
| Tank 1 (Fuel) | 1.45 | 9.5 | 1.57 | 11.5 |
| Tank 2 (Oxygen) | 1.48 | 13.3 | 1.60 | 14.8 |
| Tank 3 (Fuel) | 1.45 | 11.8 | 1.56 | 14.0 |
| Tank 4 (Oxygen) | 1.48 | 11 | 1.59 | 12.5 |
| No. | Injection Bottle Pressure (kPa) | Tank Pressure (kPa) | Uncertainty (% FS) |
|---|---|---|---|
| 1 | 374.326 | 102.536 | −0.383 |
| 2 | 377.676 | 101.296 | −0.270 |
| 3 | 390.306 | 101.976 | 0.120 |
| 4 | 399.426 | 98.900 | −0.360 |
| 5 | 402.406 | 103.986 | 0.210 |
| 6 | 487.956 | 108.896 | 0.163 |
| 7 | 488.506 | 108.616 | 0.024 |
| 8 | 506.286 | 109.976 | −0.199 |
| 9 | 503.276 | 105.176 | −0.305 |
| 10 | 519.114 | 100.386 | −0.014 |
| 11 | 608.356 | 112.156 | −0.110 |
| 12 | 617.566 | 116.446 | −0.220 |
| 13 | 603.996 | 114.396 | 0.120 |
| 14 | 611.216 | 115.656 | −0.167 |
| 15 | 595.316 | 114.986 | 0.204 |
Publisher’s Note: MDPI stays neutral with regard to jurisdictional claims in published maps and institutional affiliations. |
© 2022 by the authors. Licensee MDPI, Basel, Switzerland. This article is an open access article distributed under the terms and conditions of the Creative Commons Attribution (CC BY) license (https://creativecommons.org/licenses/by/4.0/).
Share and Cite
Yang, Y.; Han, W.; Huang, Y.; Zhang, X.; Huang, H. Uncertainty Analysis and Improvement of Propellant Gauging System Applied in Space. Appl. Sci. 2022, 12, 10148. https://doi.org/10.3390/app121910148
Yang Y, Han W, Huang Y, Zhang X, Huang H. Uncertainty Analysis and Improvement of Propellant Gauging System Applied in Space. Applied Sciences. 2022; 12(19):10148. https://doi.org/10.3390/app121910148
Chicago/Turabian StyleYang, Yanjie, Wei Han, Yiyong Huang, Xiang Zhang, and Hao Huang. 2022. "Uncertainty Analysis and Improvement of Propellant Gauging System Applied in Space" Applied Sciences 12, no. 19: 10148. https://doi.org/10.3390/app121910148