
Study on Sand-Accumulation Changes of Highway and Formation Mechanism of Sand Damage in Drifting Dunes Areas

Abstract
:1. Introduction
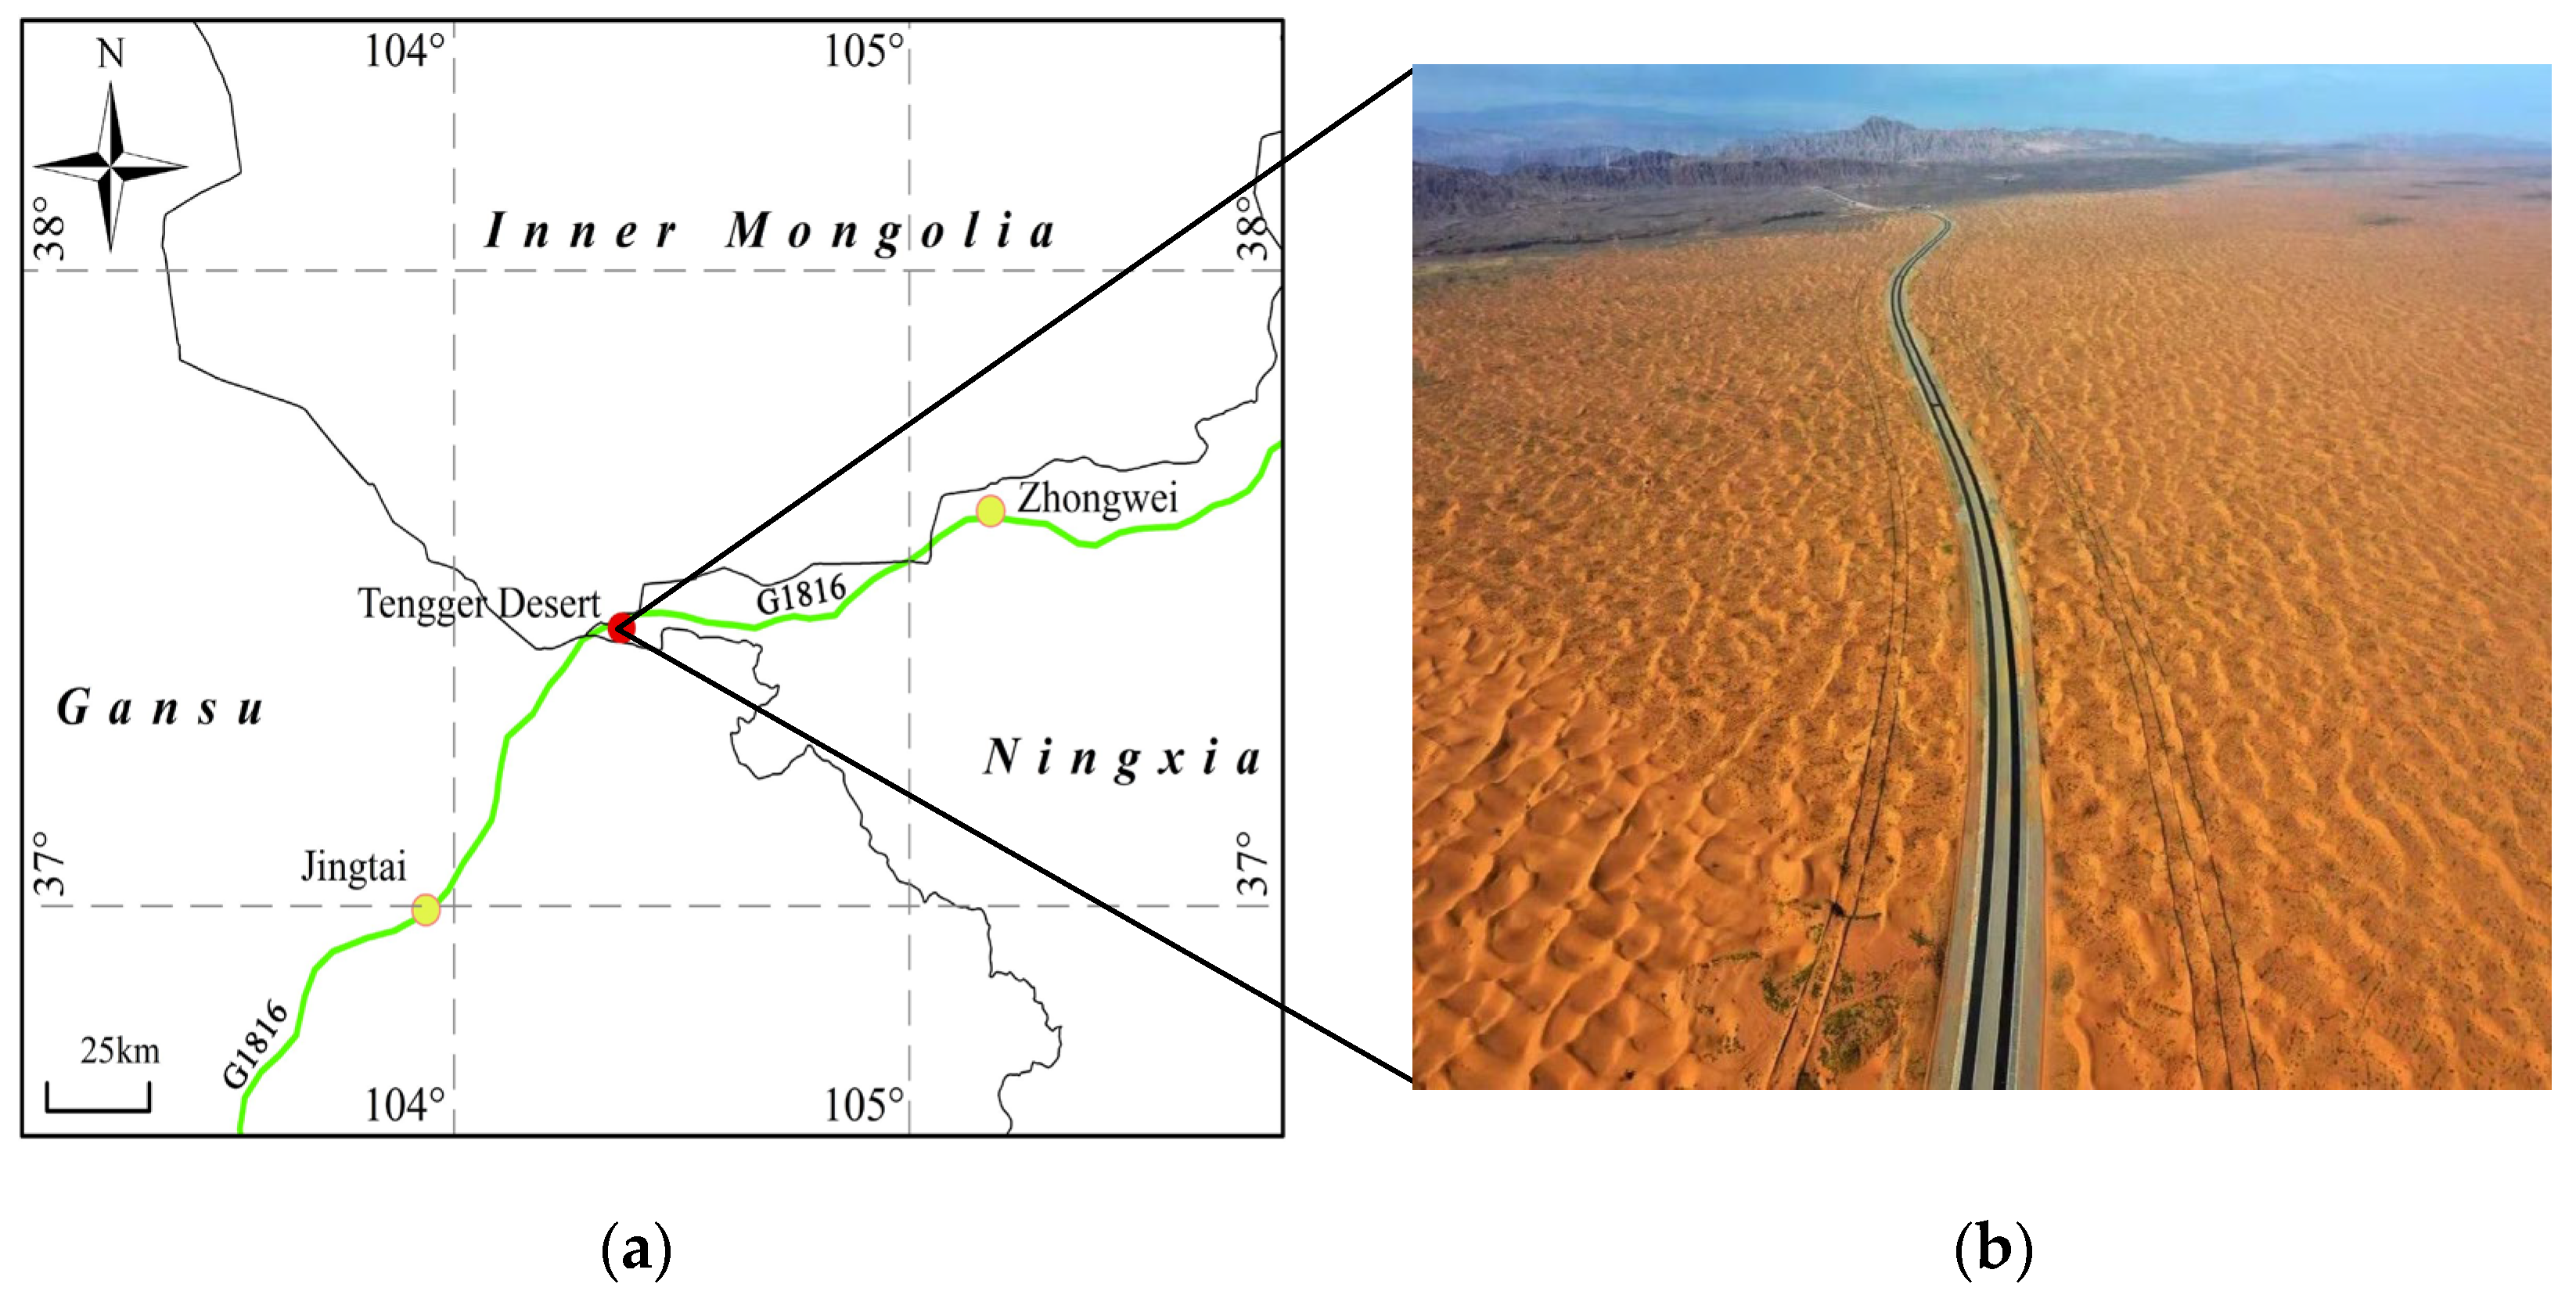
2. Field Experiment
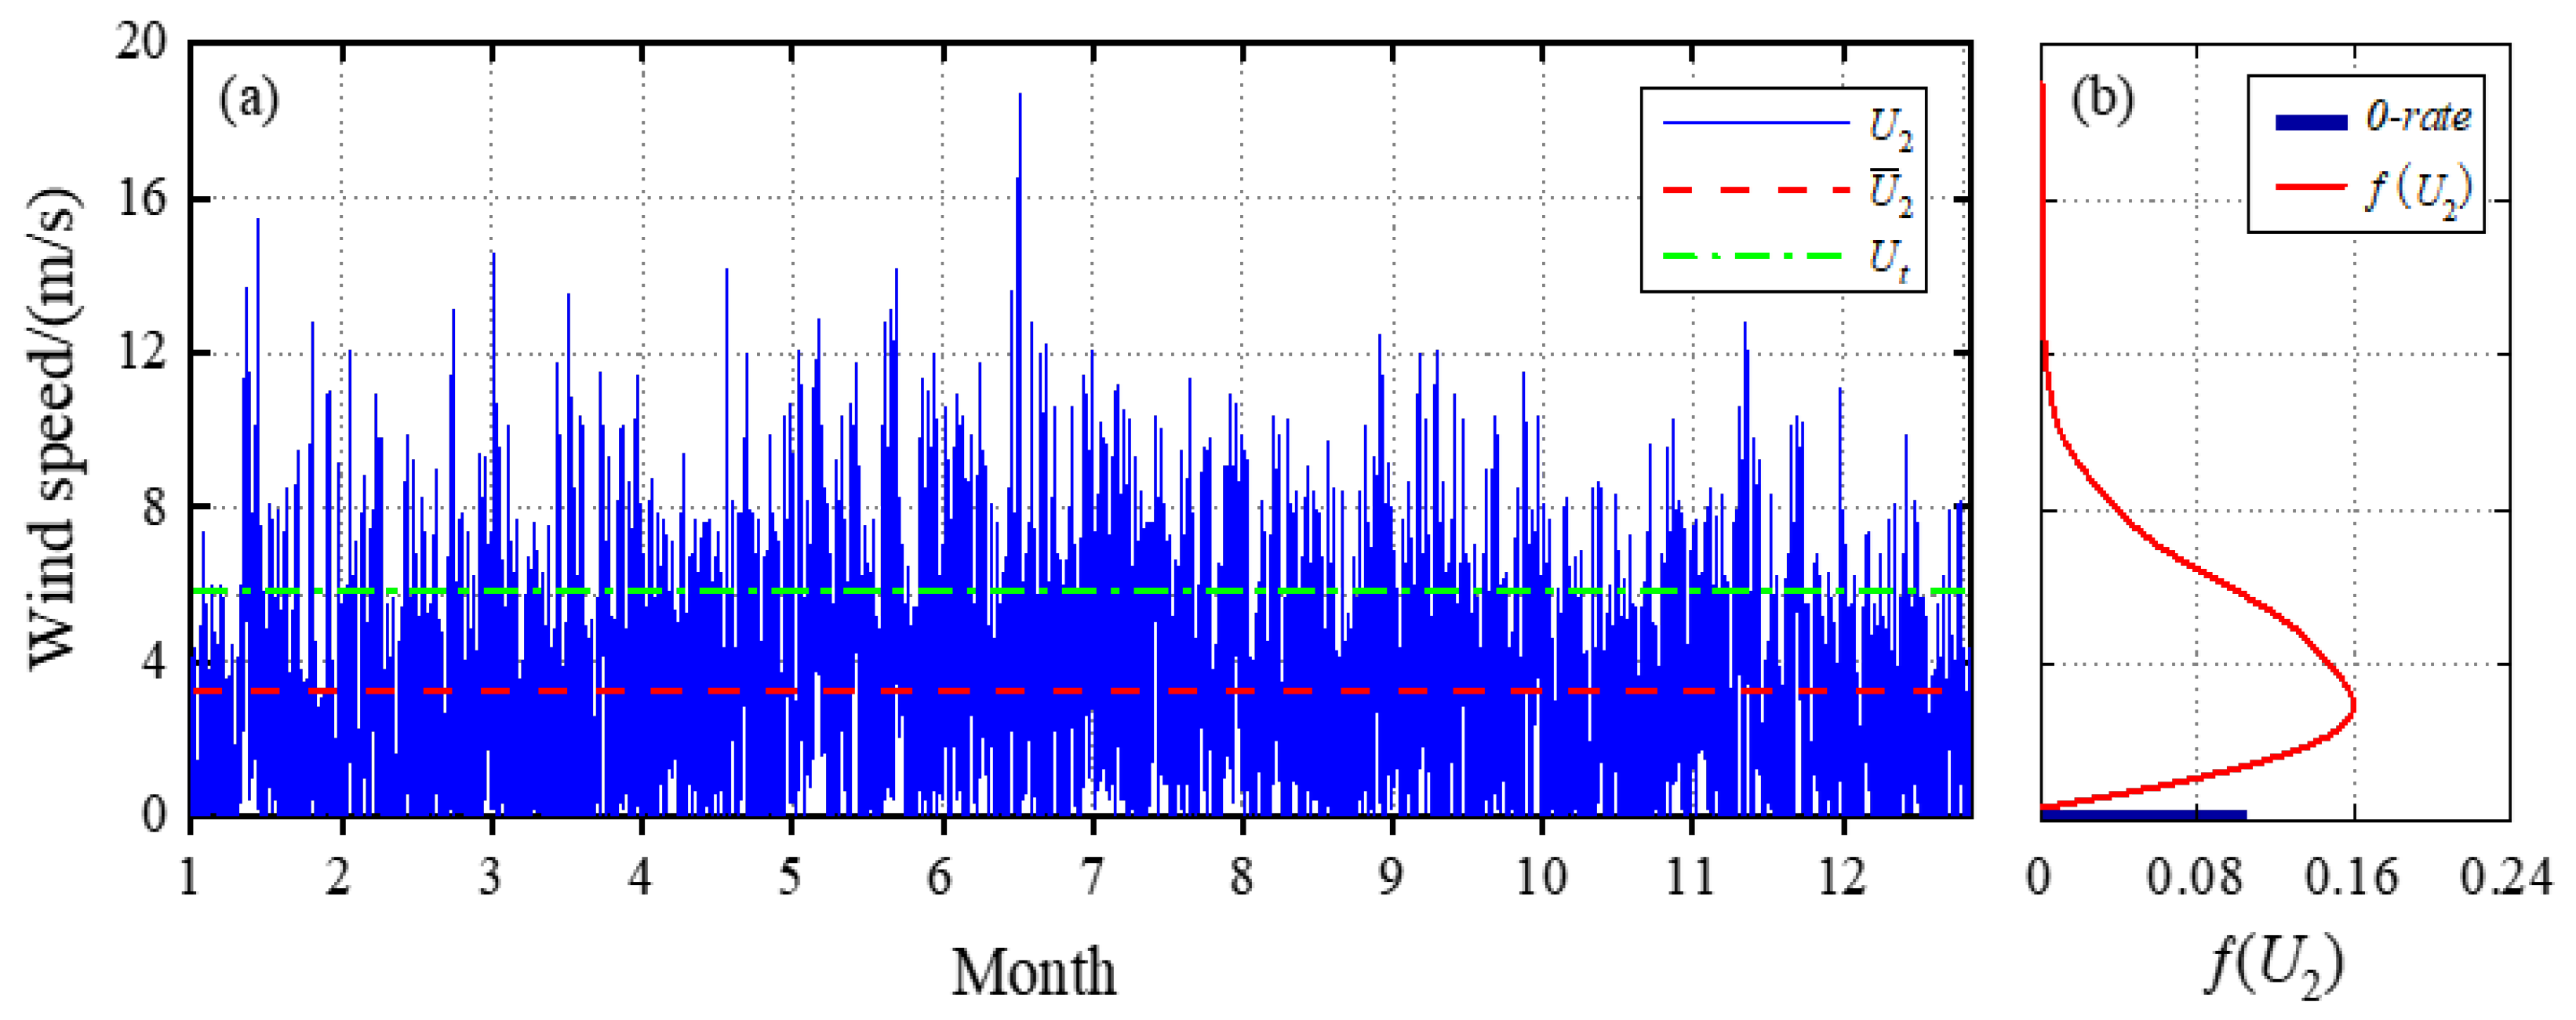
2.1. Wind Speed Monitoring
2.2. Sand Transport Environment and Analysis
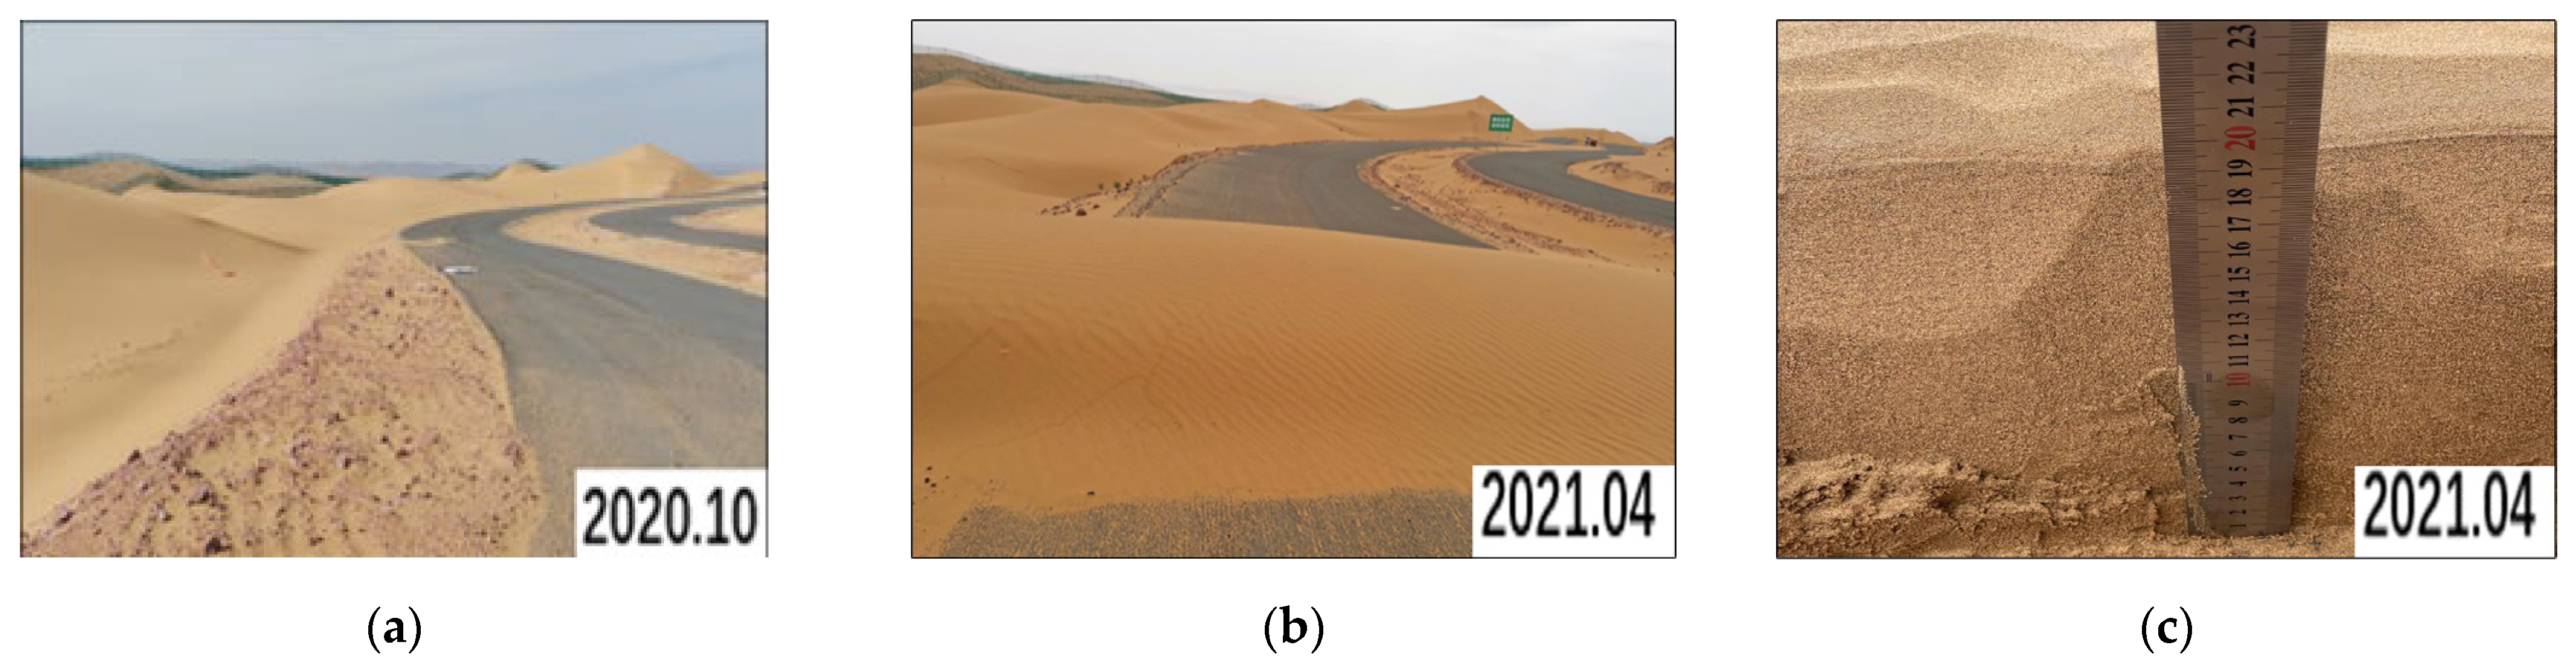
2.3. Sand Accumulation Observation and Analysis
3. Numerical Simulation
3.1. Numerical Model
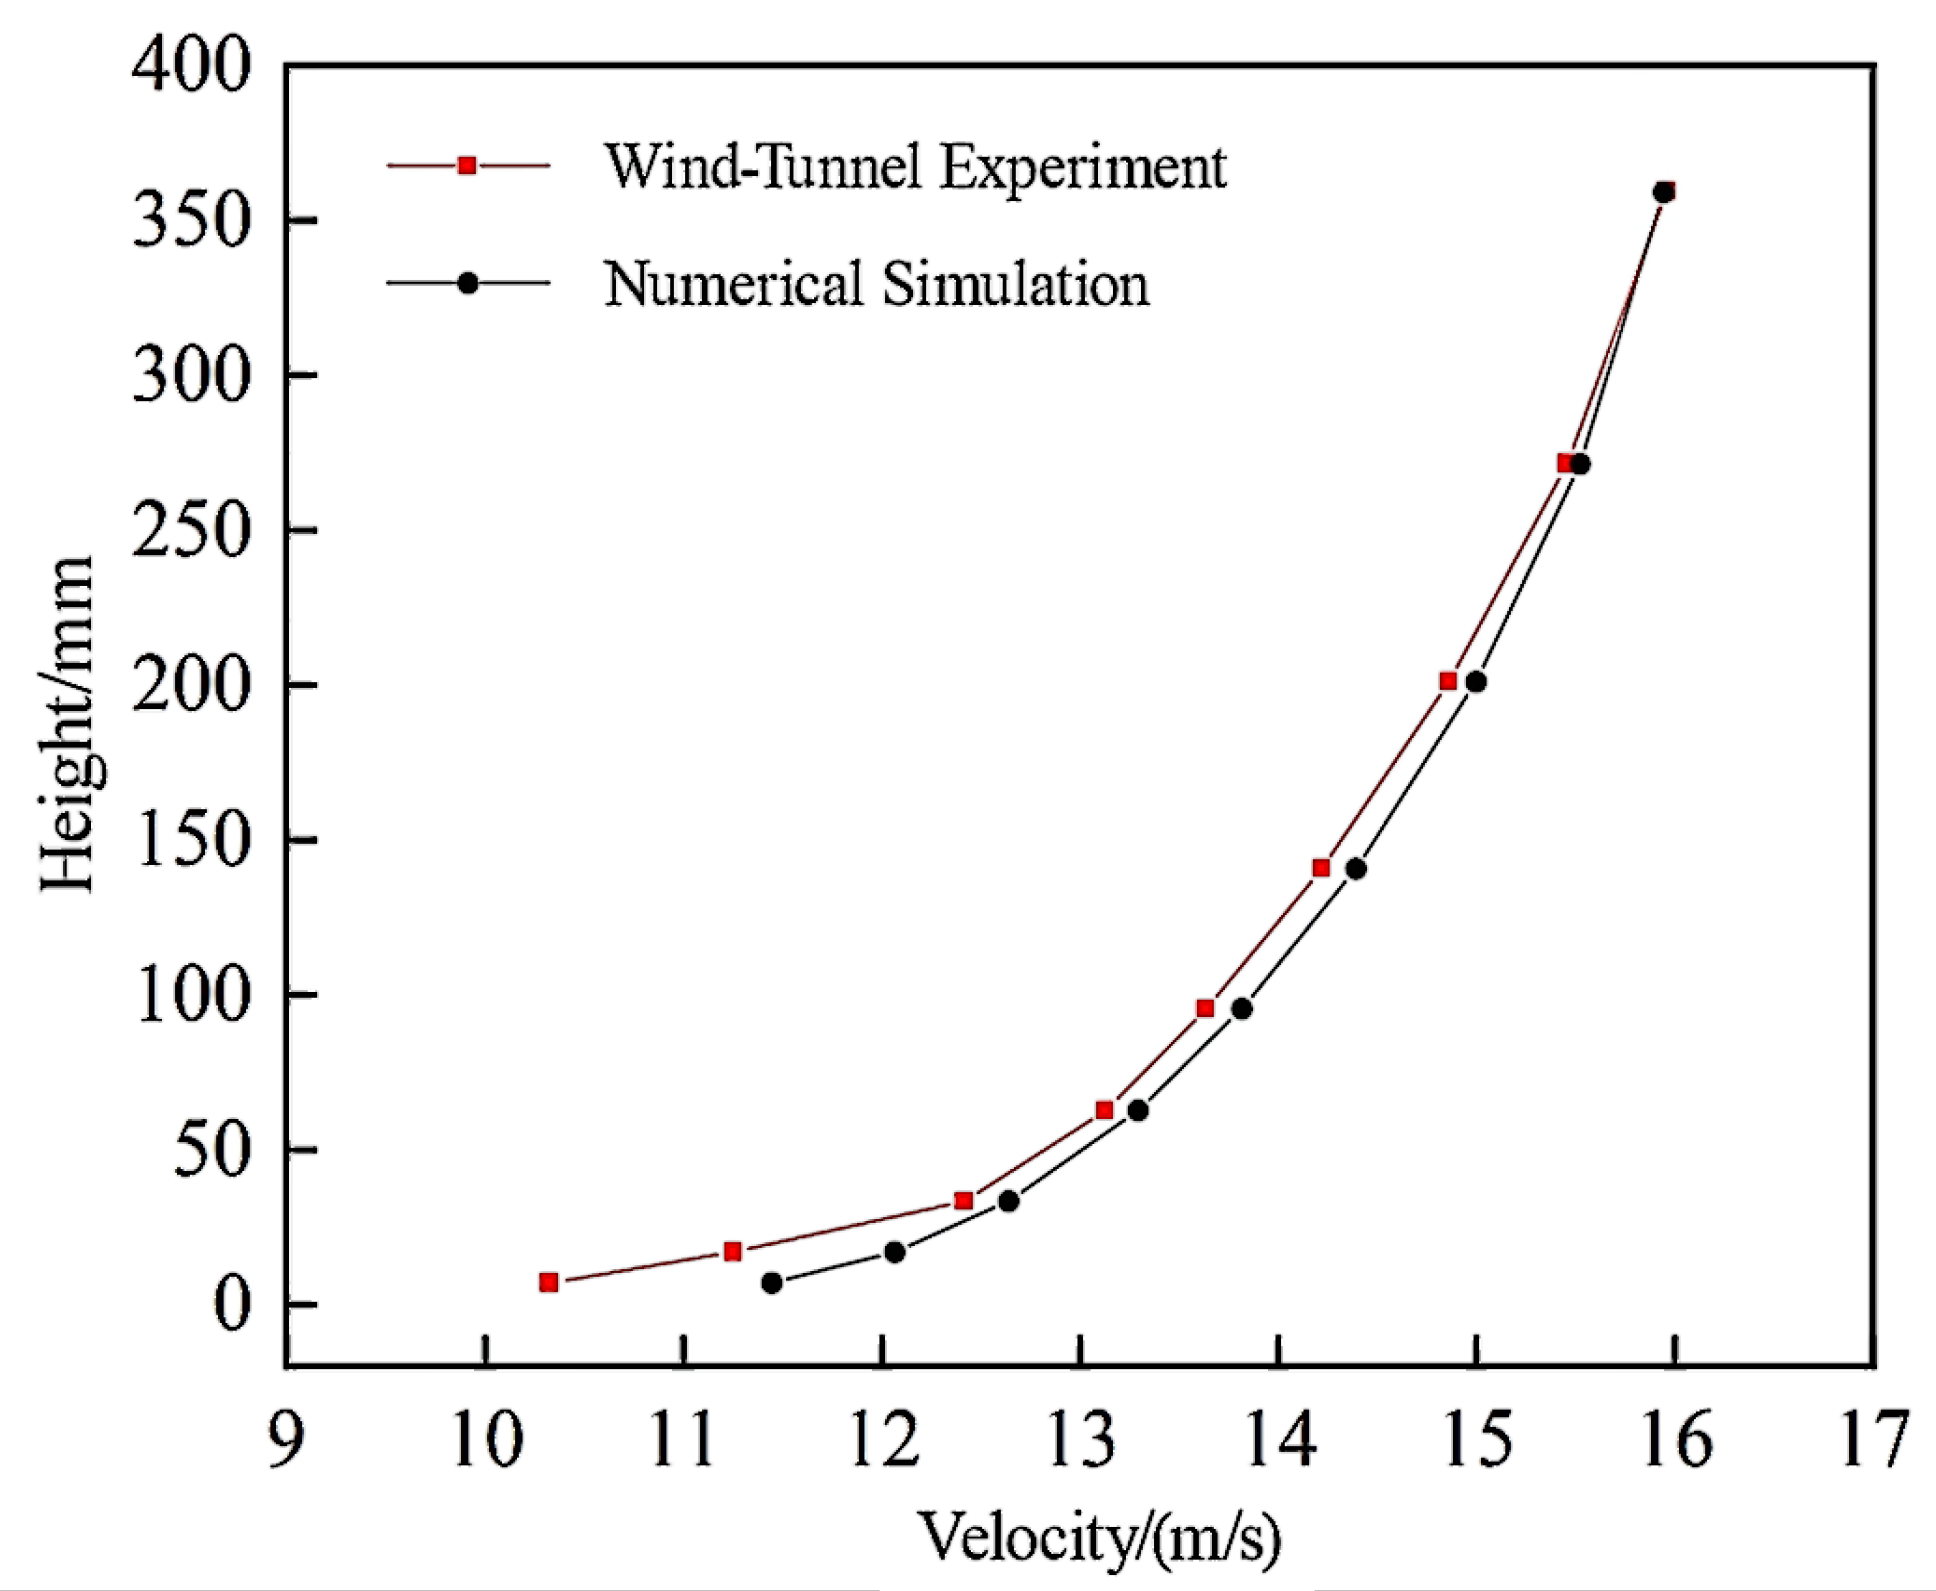
3.2. Verification of Numerical Simulation Results
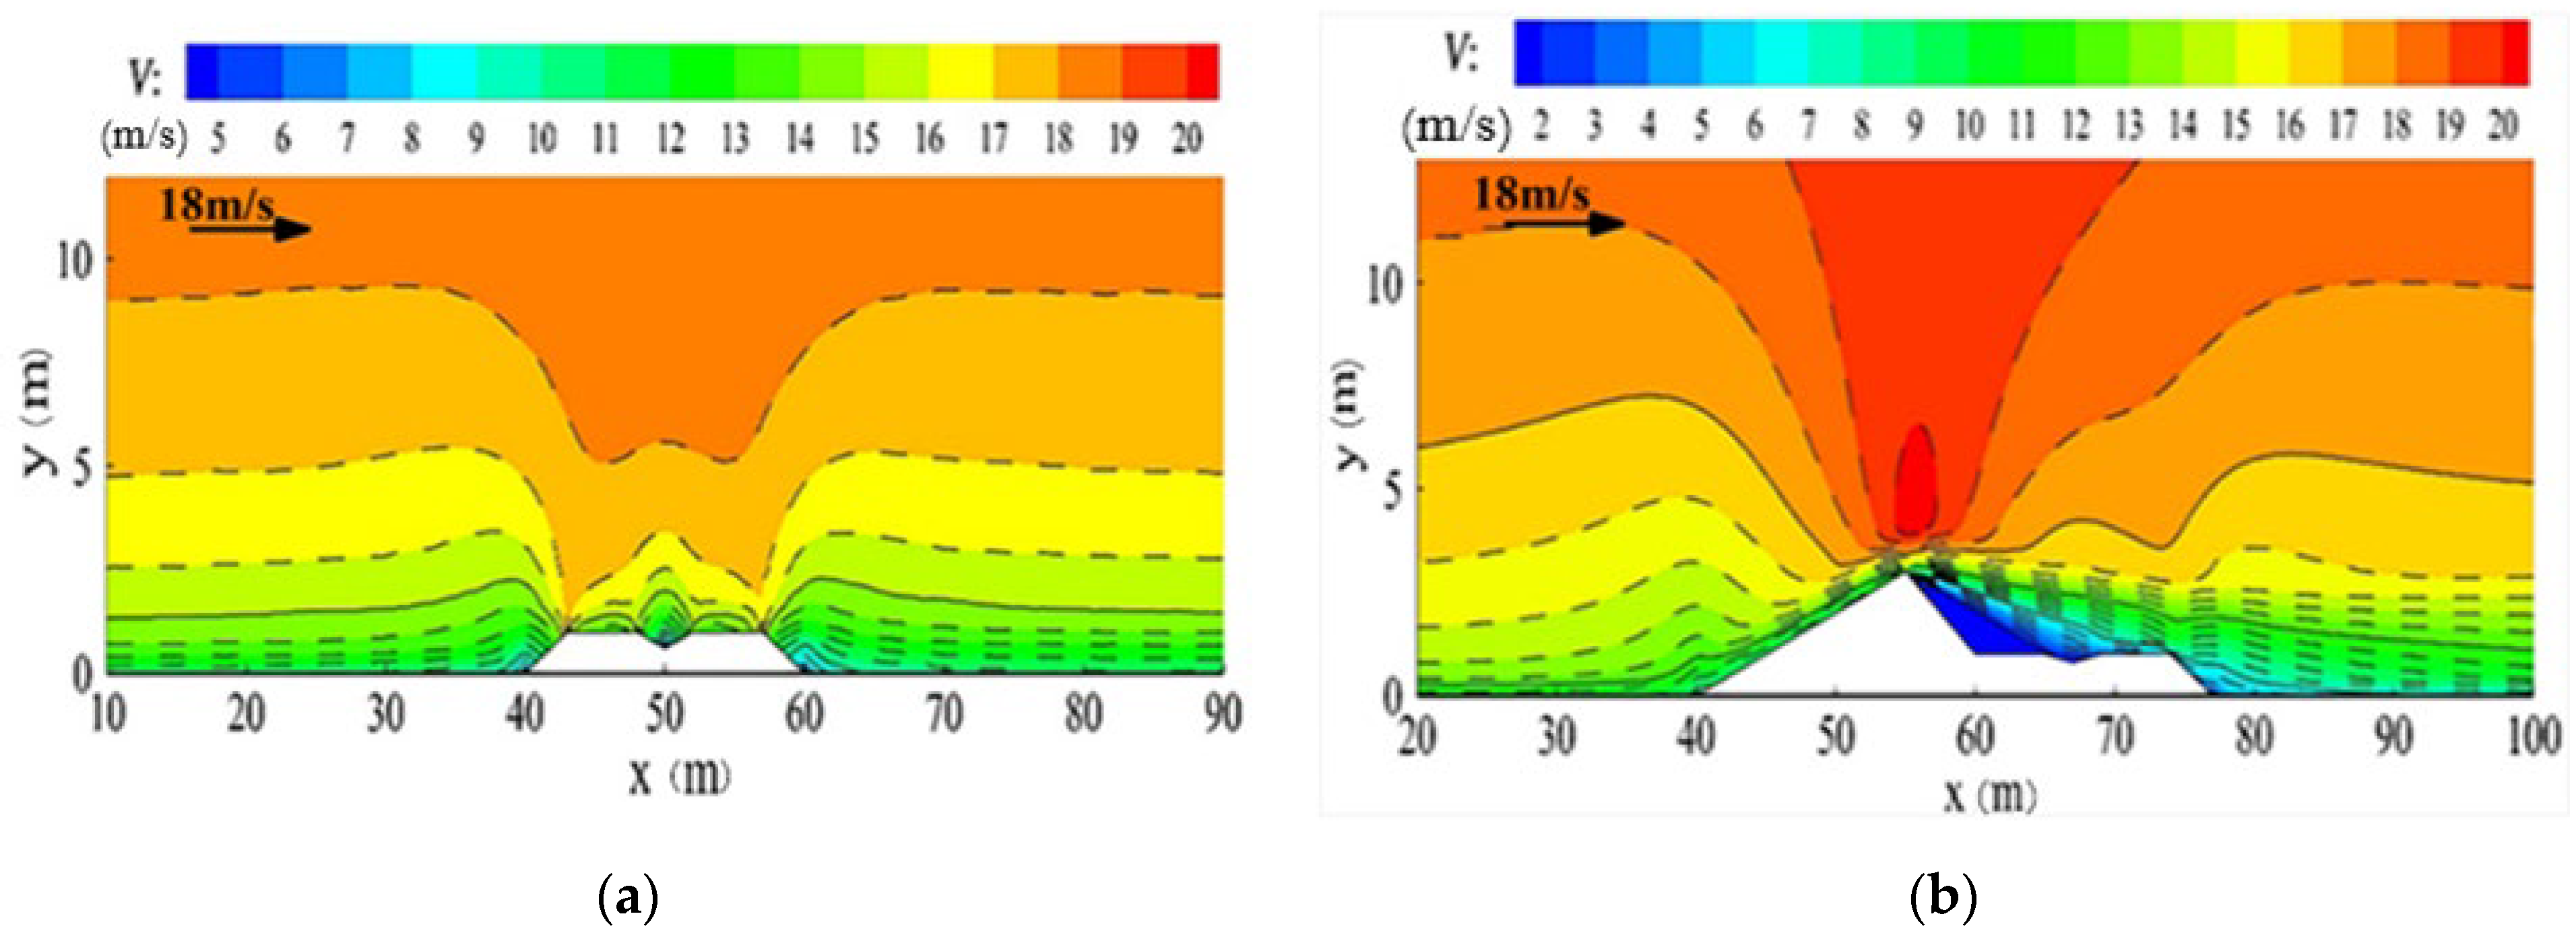
3.3. Distribution Characteristics of Flow Field around Subgrade
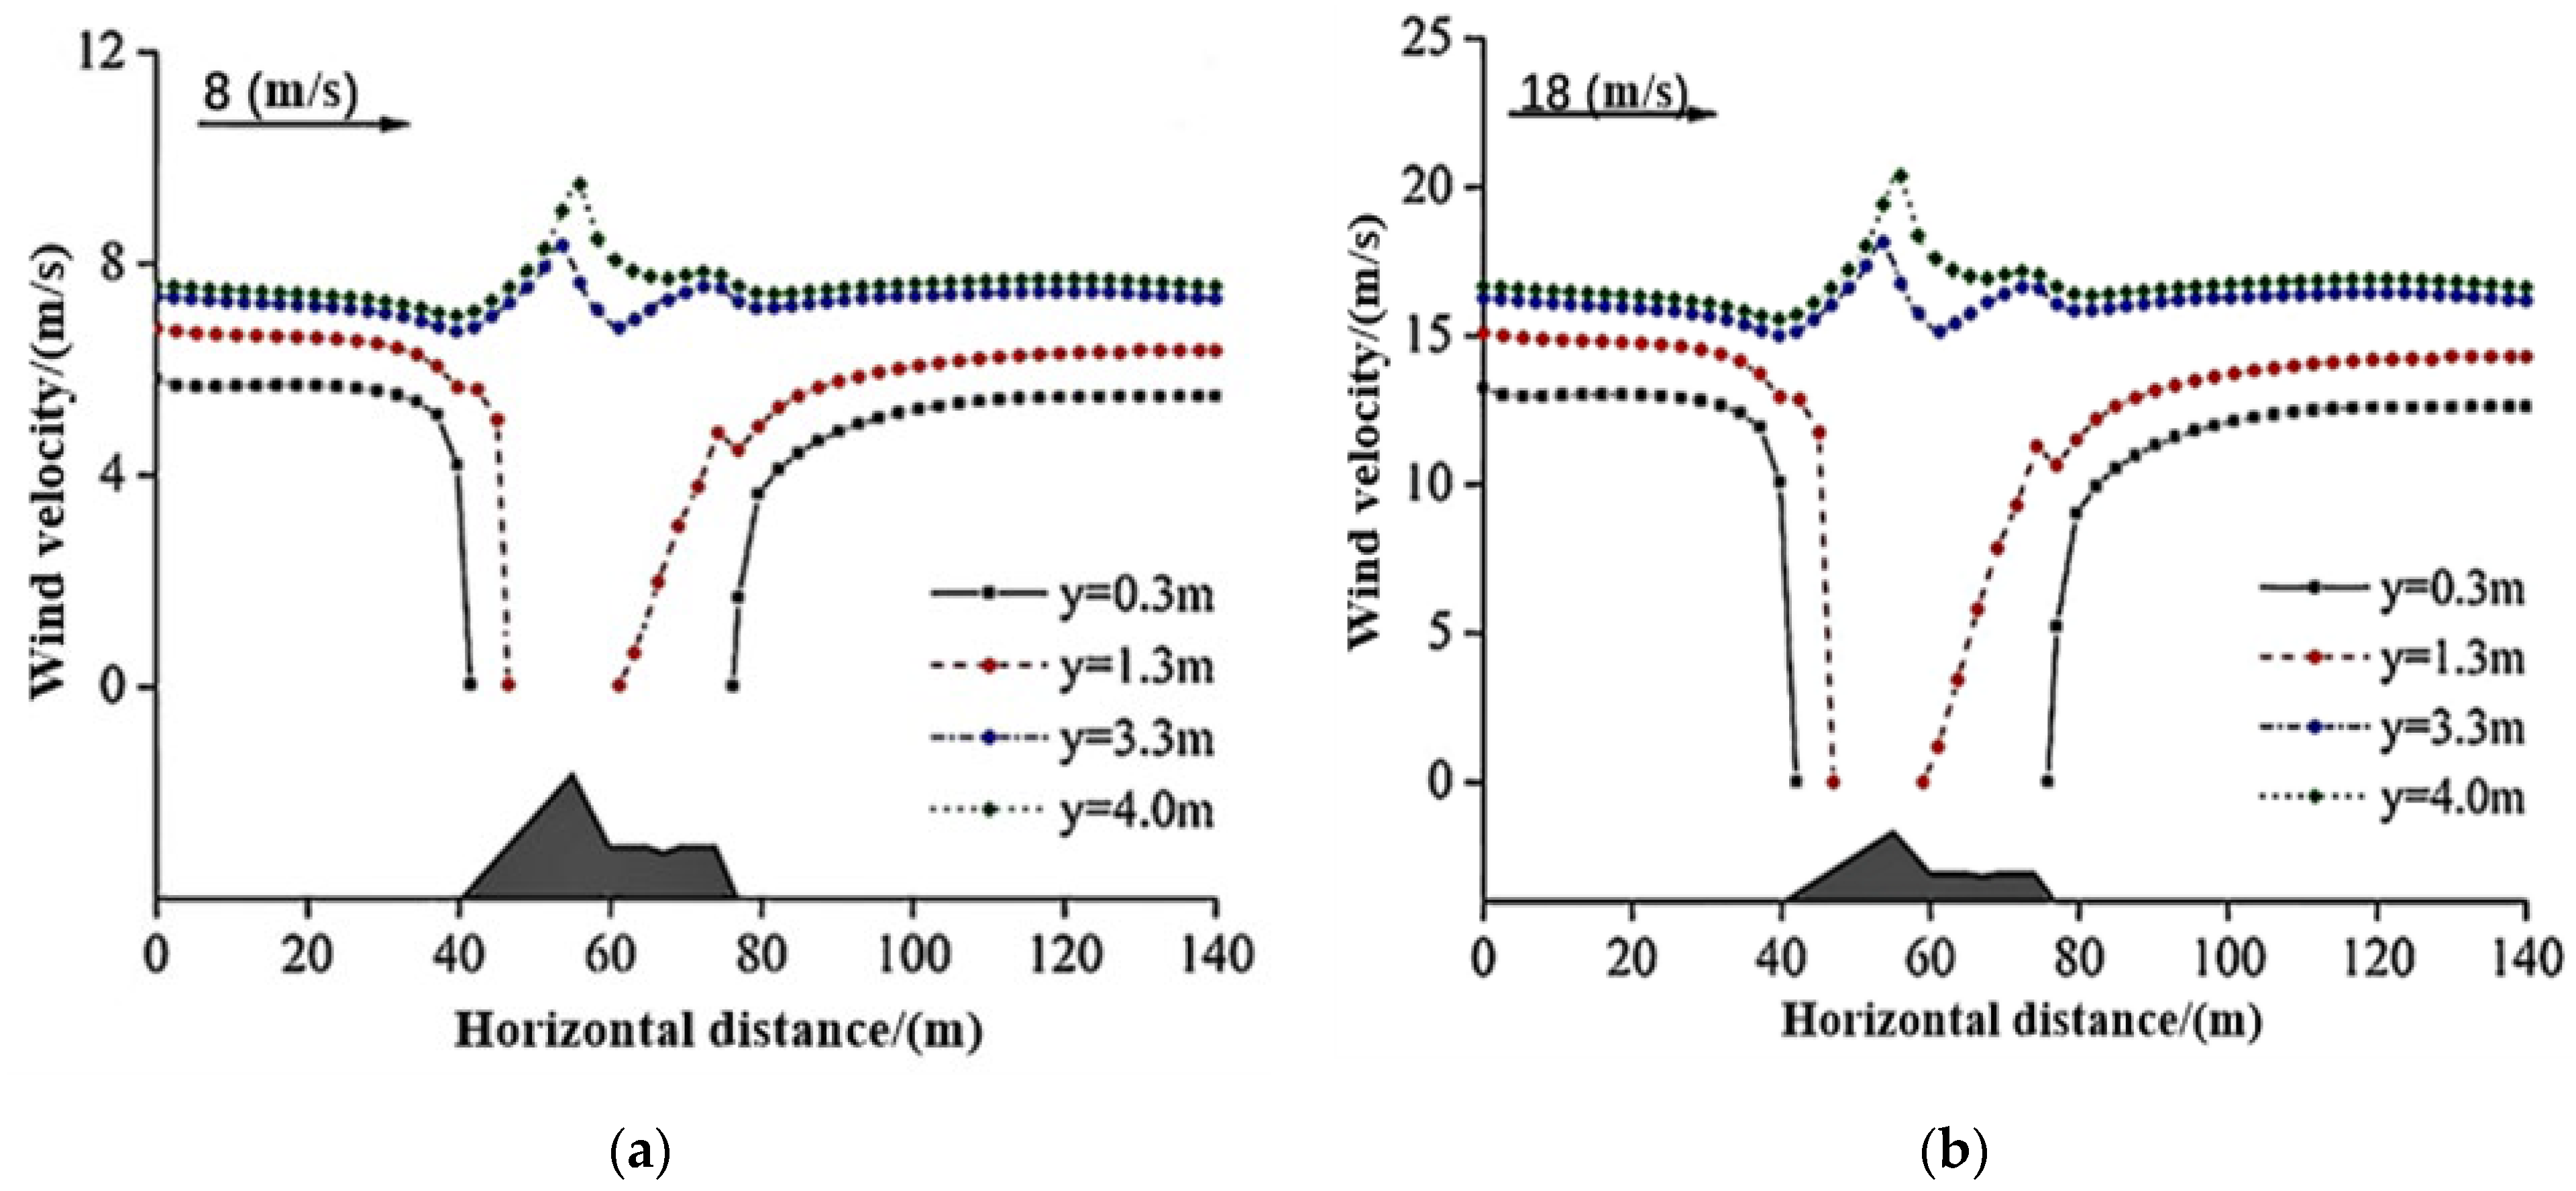
3.4. Horizontal Wind Speed Changes at Different Heights
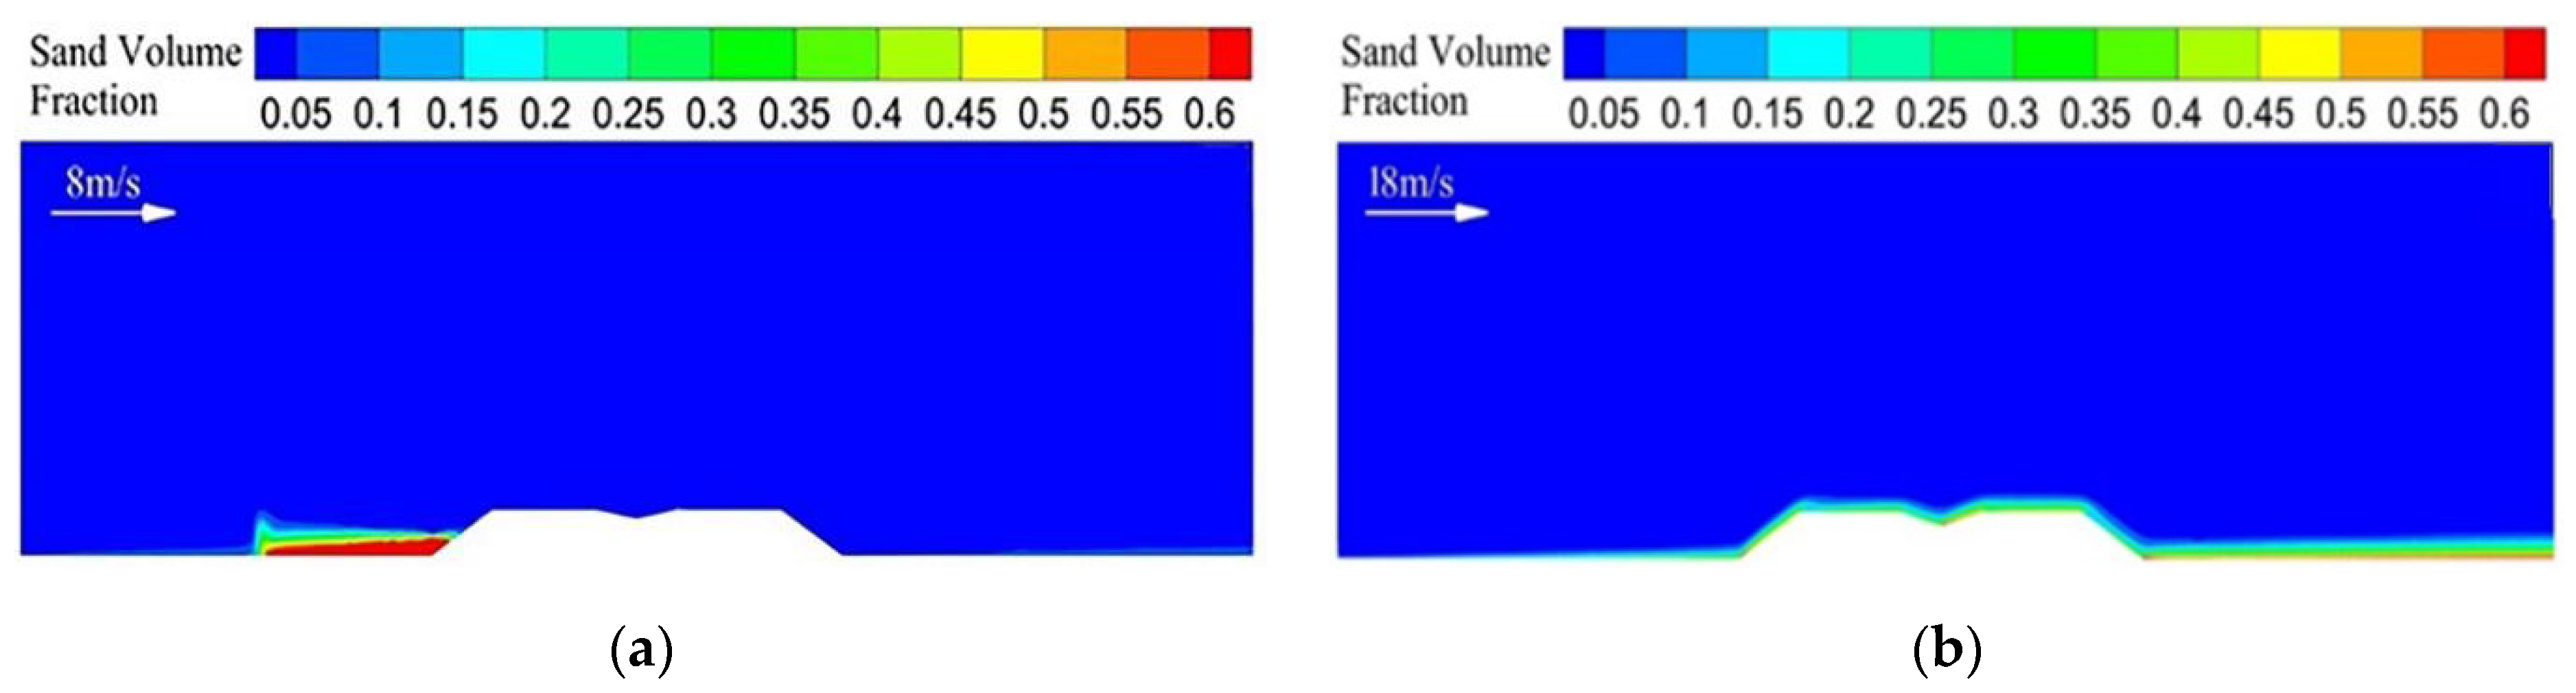
3.5. Formation Mechanism of Sediment around Embankment
4. Discussion
5. Conclusions
- (1)
- Long-term wind action can make dunes move along the dominant wind direction, forming sand burial on the highway, thus affecting the normal operation of the highway.
- (2)
- The existence of dunes would affect the flow field structure and sand-accumulation position around the embankment. The airflow velocity gathers to the maximum at the top of the dune. The airflow velocity changes in different wind speeds of the same highway structure are basically consistent.
- (3)
- For each point on the subgrade section, the airflow velocity at the junction of dune and subgrade decreases the most and it is easy to form sand accumulation. However, under the condition of low wind speed, dunes hinder the sand-carrying wind, and the airflow velocity decreases below the sand-driving wind on the windward slope of the dune, resulting in the deposition of most sand grains.
- (4)
- For the highway in the drifting dune area, the wind energy environment change trend should be studied in detail, sand protection should be set on the dominant wind direction side to control the dune movement speed, and the sand-accumulation situation on the highway should be checked regularly to clear the sand accumulation in time.
Author Contributions
Funding
Institutional Review Board Statement
Informed Consent Statement
Data Availability Statement
Conflicts of Interest
References
- Zhang, K.C.; Qu, J.J.; Yu, Y.P.; Han, Q.; Wang, T.; An, Z.; Hu, F. Progress of Research on Wind-blown Sand Prevention and Control of Railways in China. Adv. Earth Sci. 2019, 34, 573–583. [Google Scholar]
- Raffaele, L.; Bruno, L. Windblown sand action on civil structures: Definition and probabilistic modelling. Eng. Struct. 2019, 178, 88–101. [Google Scholar] [CrossRef]
- Wang, C.; Li, S.; Li, Z.; Lei, J.; Chen, J. Effects of windblown sand damage on desert highway guardrails. Nat. Hazards 2020, 103, 283–298. [Google Scholar] [CrossRef]
- Miri, A.; Middleton, N. Long-term impacts of dust storms on transport systems in south-eastern Iran. Nat. Hazards 2022, 114, 291–312. [Google Scholar] [CrossRef]
- Pan, J.; Zhao, H.; Wang, Y.; Liu, G. The influence of aeolian sand on the anti-skid characteristics of asphalt pavement. Materials 2021, 14, 5523. [Google Scholar] [CrossRef] [PubMed]
- Hu, G.; Dong, Z.; Zhang, Z.; Yang, L.; Hao, L.; Hesp, P.; Miot Da Silva, G. Wind regime and aeolian landforms on the eastern shore of Qinghai Lake, Northeastern Tibetan Plateau, China. J. Arid Environ. 2021, 188, 104451. [Google Scholar] [CrossRef]
- Huang, N.; Gong, K.; Xu, B.; Zhao, J.; Dun, H.; He, W.; Xin, G. Investigations into the law of sand particle accumulation over railway subgrade with wind-break wall. Eur. Phys. J. E 2019, 42, 145. [Google Scholar] [CrossRef]
- Li, S.; Li, C.; Yao, D.; Ge, X.; Zhang, G. Wind tunnel experiments for dynamic modeling and analysis of motion trajectories of wind-blown sands. Eur. Phys. J. E 2020, 43, 22. [Google Scholar] [CrossRef]
- He, W.; Huang, N.; Xu, B.; Wang, W. Numerical simulation of wind-sand movement in the reversed flow region of a sand dune with a bridge built downstream. Eur. Phys. J. E 2018, 41, 53. [Google Scholar] [CrossRef]
- Xin, G.; Huang, N.; Zhang, J.; Dun, H. Investigations into the design of sand control fence for Gobi buildings. Aeolian Res. 2021, 49, 100662. [Google Scholar] [CrossRef]
- Xie, S.; Qu, J.; Zhang, K.; Han, Q.; Pang, Y. The mechanism of sand damage at the Fushaliang section of the Liuyuan-Golmud expressway. Aeolian Res. 2021, 48, 100648. [Google Scholar] [CrossRef]
- Yintang, L.; Yi, G. Numerical simulation of aeolian dusty sand transport in a marginal desert region at the early entrainment stage. Geomorphology 2008, 100, 335–344. [Google Scholar]
- Shi, L.; Jiang, F.; Han, F. Numerical simulation of response law of wind-blown sand flow around the railway embankment. Tiedao Xuebao/J. China Railw. Soc. 2014, 36, 82–87. [Google Scholar]
- Leone, E.; Kobayashi, N.; Francone, A.; Bartolo, S.D.; Strafella, D.; D’Alessandro, F.; Tomasicchio, G.R. Use of Nanosilica for Increasing Dune Erosion Resistance during a Sea Storm. J. Mar. Sci. Eng. 2021, 9, 620. [Google Scholar] [CrossRef]
- Walker, I.J. Secondary airflow and sediment transport in the lee of a reversing dune. Earth Surf. Proc. Land. 1999, 24, 437–448. [Google Scholar] [CrossRef]
- Yin, Y.; Ding, W. A novel cloud model prediction for surface roughness based on multidimensional & multi-rules reasoning. Jixie Gongcheng Xuebao/J. Mech. Eng. 2016, 52, 204–212. [Google Scholar]
- Wang, W.; Huang, N.; Dun, H. Analysis of wind-sand movement over sand dune with different railway forms downstream. Lixue Xuebao/Chin. J. Theor. Appl. Mech. 2020, 52, 680–688. [Google Scholar]
- Schönfeldt, H.-J.; Löwis, S.v. Turbulence-driven saltation in the atmospheric surface layer. Meteorol. Z. 2003, 12, 257–268. [Google Scholar] [CrossRef]
- Wiggs, G.F.S.; Weaver, C.M. Turbulent flow structures and aeolian sediment transport over a barchan sand dune. Geophys. Res. Lett. 2012, 39, 1–7. [Google Scholar] [CrossRef]
- Zhang, K.; Qu, J.; An, Z. Characteristics of wind-blown sand and near-surface wind regime in the Tengger Desert, China. Aeolian Res. 2012, 6, 83–88. [Google Scholar] [CrossRef]
- Zhang, K.C.; An, Z.S.; He, M.Z. Aeolian sand environments and disaster prevention along Zhongwei section of the Wuhai-Maqin Highway. Arid Land Geogr. 2021, 44, 983–991. [Google Scholar]
- Zhang, Z.S.; Dong, Z.B.; Zhao, A.G. Effect of different time intervals in assessing sand drift potential. Arid Land Geogr. 2010, 33, 177–182. [Google Scholar]
- Pearce, K.I.; Walker, I.J. Frequency and magnitude biases in the ‘Fryberger’ model, with implications for characterizing geomorphically effective winds. Geomorphology 2005, 68, 39–55. [Google Scholar] [CrossRef]
- Xue, L.; Li, C.; Zheng, Z.; Shen, W.; Wang, H. Classification of Stability of Surrounding Rock Based on Two-Dimensional Cloud and Apriori. Tiedao Xuebao/J. China Railw. Soc. 2020, 42, 121–128. [Google Scholar]
- Yizhaq, H.; Xu, Z.; Ashkenazy, Y. The effect of wind speed averaging time on the calculation of sand drift potential: New scaling laws. Earth Planet. Sci. Lett. 2020, 544, 116373. [Google Scholar] [CrossRef]
- Fryberger, S.G. Dune Forms and Wind Regime; United States Government Printing Office: Washington, DC, USA, 1979; pp. 137–169.
- Luo, F.; Gao, J.; Xin, Z.; Bian, K.; Hao, Y.; Liu, F. Characteristics of sand-driving wind regime and sediment transport in northeast edge of Ulan Buh Desert. Nongye Gongcheng Xuebao/Trans. Chin. Soc. Agric. Eng. 2019, 35, 145–152. [Google Scholar]
- Cheng, J.; Jiang, F.; Xue, C.; Xin, G.; Li, K.; Yang, Y. Characteristics of the disastrous wind-sand environment along railways in the Gobi area of Xinjiang, China. Atmos. Environ. 2015, 102, 344–354. [Google Scholar] [CrossRef]
- Li, J.; Wang, J.; Wang, R.; Guo, J.; Luo, X.; Li, Y.; Cui, W. Monitoring of moving speed of dunes along the Yellow River based on UAV technology and analysis of influencing factors. J. Agric. Eng. 2021, 37, 57–64. [Google Scholar]
- Nolet, C.; van Puijenbroek, M.; Suomalainen, J.; Limpens, J.; Riksen, M. UAV-imaging to model growth response of marram grass to sand burial: Implications for coastal dune development. Aeolian Res. 2018, 31, 50–61. [Google Scholar] [CrossRef]
- Cheng, J.; Xin, G.; Zhi, L.; Jiang, F. Unloading Characteristics of Sand-drift in Wind-shallow Areas along Railway and the Effect of Sand Removal by Force of Wind. Sci. Rep. UK 2017, 7, 41462. [Google Scholar] [CrossRef] [Green Version]
- Tennekes, H. The logarithmic wind profile. J. Atmos. Sci. 1973, 30, 234–238. [Google Scholar] [CrossRef]
- Bauer, B.O.; Houser, C.A.; Nickling, W.G. Analysis of velocity profile measurements from wind-tunnel experiments with saltation. Geomorphology 2004, 59, 81–98. [Google Scholar] [CrossRef]
- Feng, S.; Ning, H. Computational simulations of blown sand fluxes over the surfaces of complex microtopography. Environ. Modell. Softw. 2010, 25, 362–367. [Google Scholar] [CrossRef]
- Cheng, J.; Zhi, L.; Xue, C.; Jiang, F. Control Law of Lower Air Deflector for Sand Flow Field along Railway. Zhongguo Tiedao Kexue/China Railw. Sci. 2017, 38, 16–23. [Google Scholar]
- Xin, G.; Cheng, J.; Yang, Y. Study on effect of characteristics of hanging-type concrete sand barrier opening and wind-sand field along railway. Tiedao Xuebao/J. China Railw. Soc. 2016, 38, 99–107. [Google Scholar]
- Chen, B.; Cheng, J.; Xin, L.; Wang, R. Effectiveness of hole plate-type sand barriers in reducing aeolian sediment flux: Evaluation of effect of hole size. Aeolian Res. 2019, 38, 1–12. [Google Scholar] [CrossRef]
- Xin, G.; Huang, N.; Zhang, J. Wind tunnel experiment on sand accumulation mechanism and optimization measures of windbreak wall along railway in windy area. J. Mech. 2020, 52, 635–644. [Google Scholar]


| Observation Time | Area of Sand Accumulation/m2 | Maximum Thickness/cm | Average Sand Accumulation Width/cm |
|---|---|---|---|
| 2020-12 | 19 | 1.5 | 68 |
| 2021-04 | 24 | 21 | 70 |
| 2021-08 | 27 | 50 | 90 |
Publisher’s Note: MDPI stays neutral with regard to jurisdictional claims in published maps and institutional affiliations. |
© 2022 by the authors. Licensee MDPI, Basel, Switzerland. This article is an open access article distributed under the terms and conditions of the Creative Commons Attribution (CC BY) license (https://creativecommons.org/licenses/by/4.0/).
Share and Cite
Han, F.; Wang, C.; Liu, Z.; Li, L.; Yin, W. Study on Sand-Accumulation Changes of Highway and Formation Mechanism of Sand Damage in Drifting Dunes Areas. Appl. Sci. 2022, 12, 10184. https://doi.org/10.3390/app121910184
Han F, Wang C, Liu Z, Li L, Yin W. Study on Sand-Accumulation Changes of Highway and Formation Mechanism of Sand Damage in Drifting Dunes Areas. Applied Sciences. 2022; 12(19):10184. https://doi.org/10.3390/app121910184
Chicago/Turabian StyleHan, Feng, Chengxiang Wang, Zhibo Liu, Liangying Li, and Wenhua Yin. 2022. "Study on Sand-Accumulation Changes of Highway and Formation Mechanism of Sand Damage in Drifting Dunes Areas" Applied Sciences 12, no. 19: 10184. https://doi.org/10.3390/app121910184