Abstract
The vehicle driving simulator (VDS) is a virtual reality-based system that provides drivers and passengers with a driving feeling similar to the actual vehicle. However, the motion system of the VDS has limitations in providing the same driving feeling as the actual driving due to its limited kinematics and dynamic characteristics. In order to solve these problems and limit the motion of the VDS to the kinematic workspace, a washout algorithm is needed. However, since the classical washout algorithm causes simulator sickness due to time delay and signal distortion caused by using the signal filters, various washout algorithms have been proposed, such as a new tilt coordination algorithm and method of directly reflecting subregions of vehicle tilt angle. However, the new tilt coordination washout algorithm has the disadvantage of extremely degrading the rotational motion sensation, and the subregions scale method has the disadvantage of ambiguous criteria for selecting scale parameters. In this paper, we propose a novel washout algorithm that improves the motion sensation of the driver and passengers by an enhanced tilt coordination and subregion scale washout algorithm and evaluate it through a simulation based on the human sensation model. The proposed washout algorithm has the advantage of maintaining enhanced translational motion sensation by the new tilt coordination algorithm while complementing deteriorated rotational motion sensation. In addition, the structure of the algorithm is simple and gain tunning is intuitive, making it easy for the user to apply to the motion system of the VDS.
1. Introduction
For developing advanced driving assist systems (ADAS) and automated driving systems (ADS) in the automotive industry area, the real-car test often shows limitation because of the high cost, time constraints and the higher risk of accidents in the case of complicated traffic scenarios. To overcome these limitations, the vehicle driving simulator (VDS) has been used for driving tests and experiments. However, the VDS is also limited by the problem of simulator sickness [1,2,3,4,5].
The motion platforms of the VDS have been used in real-time for many applications to simulate real-car motion [2,3,4,5]. However, the motion platforms have limitations in mechanical motion areas, so the washout algorithms that limit motion areas while providing a sense of motion like the actual vehicle motion are needed [3,4,5]. The optimal control strategy, false cues reduction method in case of roll motion, enhanced yaw motion method and others are developed for flight simulator [6,7,8,9]. However, since aircraft and vehicles have different motion characteristics, it is necessary to develop a washout algorithm suitable for vehicle motion.
A representative washout algorithm is a classical one. Although a classical washout algorithm has advantages such as short analysis time and verified stability, there are several problems such that it is difficult to select cutoff frequency of used filters and the original signal is falsified on tilt coordination [3]. To overcome these problems, a various washout algorithm is proposed. Artificial intelligent algorithms, such as fuzzy and genetic algorithms, are studied for this area [10,11,12,13,14,15,16,17,18,19,20,21]. It consists of the fuzzy and genetic algorithm to reduce simulator sickness. However, there are various tunning parameters in these algorithms; it is difficult to select an optimized parameter and apply it to the motion platform. Because the tilt coordination algorithm in the classical washout algorithm uses the low pass filter, studies have also been conducted to remove low pass filters [3]. However, as a result, the translational motion sensation is improved, but the rotational motion sensation is deteriorated. To improve the rotational motion sensation, a method for directly reflecting the angle value of the vehicle to the motion platform has been proposed [4,5], but there is still a problem of a lack of mathematical consideration to select scale parameters.
In this paper, we propose the new tilt coordination algorithm with proportional gain to generate enhanced translation motion sensation and prevent the rotational motion sensation from deteriorating and analyze parameters in the subregion scale method. Two algorithms are integrated and simulated based on the human sensation model to verify their performance.
2. Classical Washout Algorithm
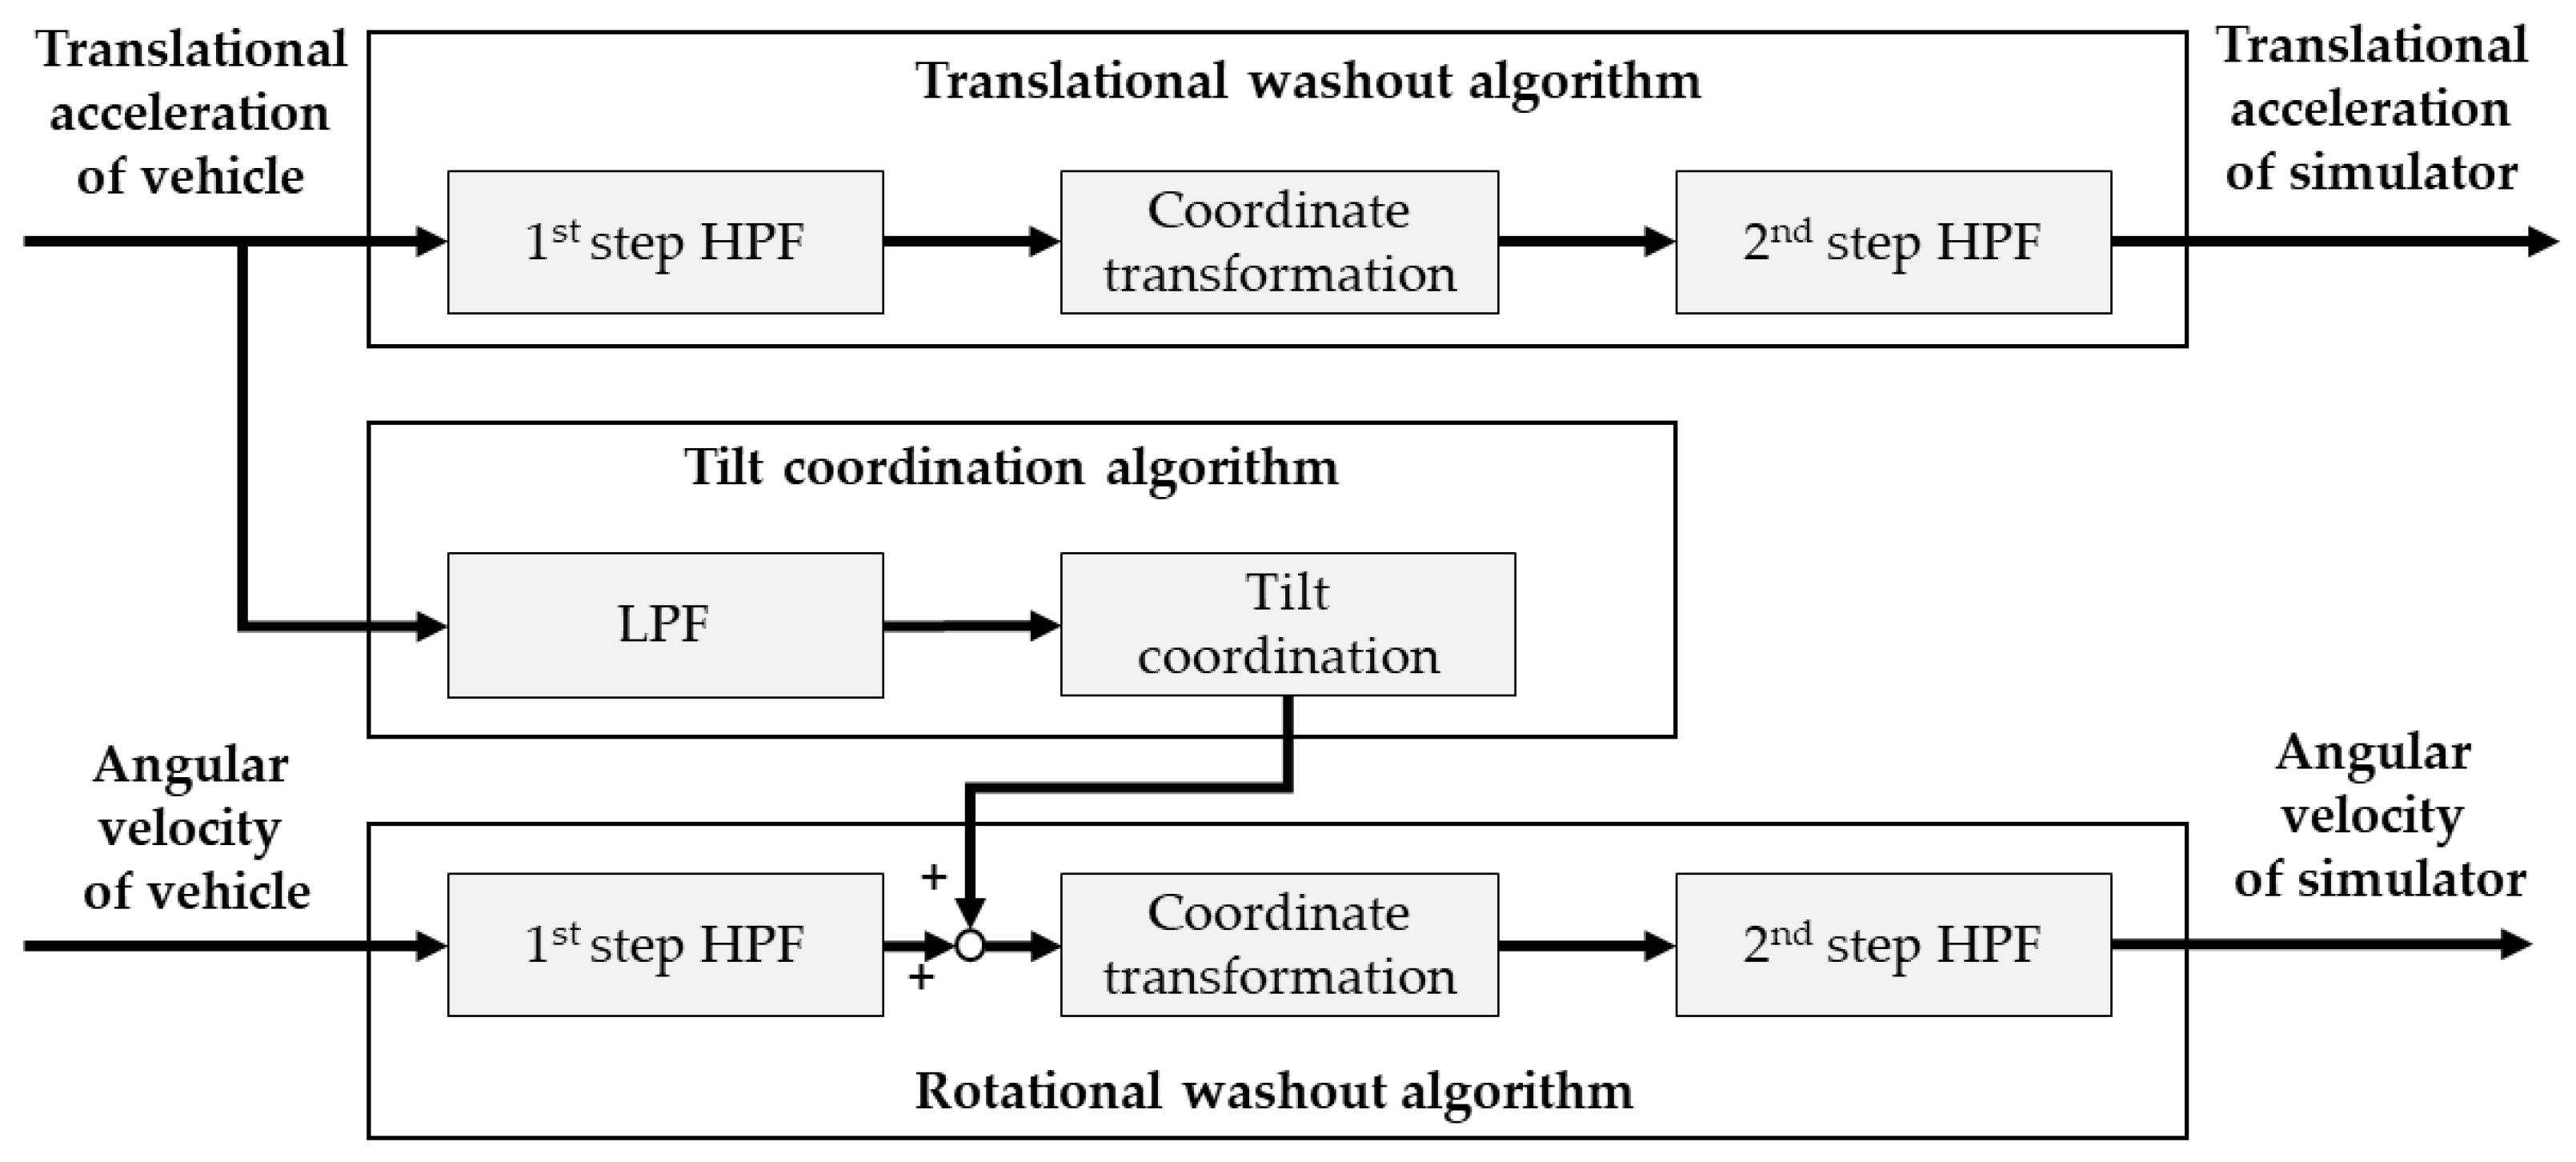
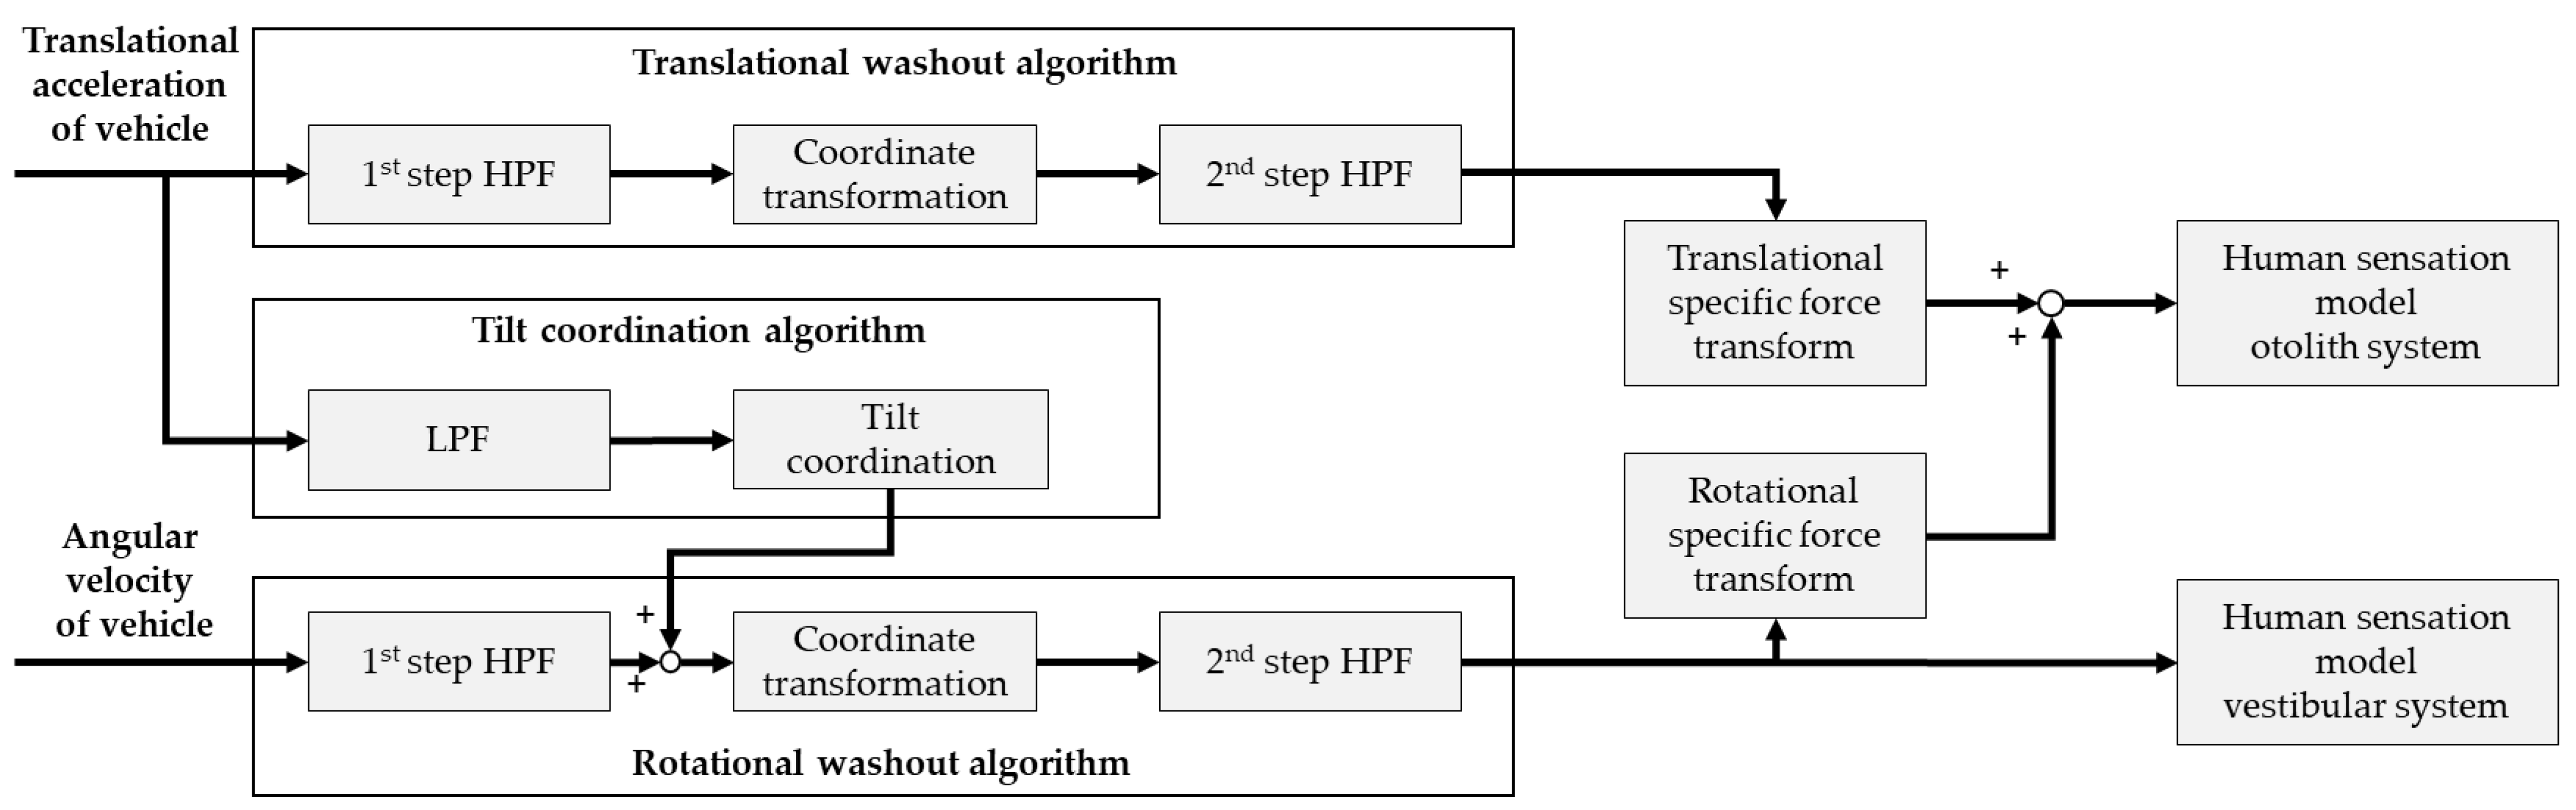
The classical washout algorithm is composed of a translational washout, a rotational washout and tilt coordination. Figure 1 shows the block diagram of the algorithm. HPF means the high pass filter; LPF means the low pass filter in Figure 1. Translational accelerations and angular velocities of the vehicle are acquired from a vehicle dynamics model installed in the VDS. Output data of the algorithm are used to simulate the motion platform of the VDS [2,3,4,5].
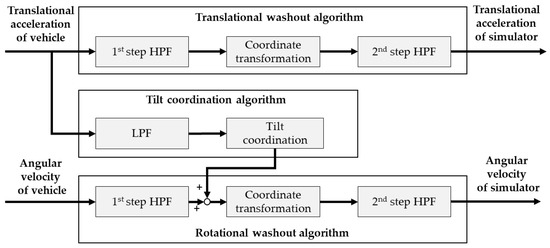
Figure 1.
Structure of the classical washout algorithm.
2.1. Translational Washout Algorithm
The translational washout algorithm consists of high pass filters and the coordinate transformation. The low-frequency translational acceleration is removed by using the 1st step high pass filter, and the coordinate transformation is performed from the upper plate coordinate system to the base plate coordinate system of the motion platform. The translational acceleration in the upper plate coordinate system [2,3,4,5] is written as
where is the translational acceleration in the upper plate coordinate system, is the translational acceleration in the base plate coordinate system and is the coordinate transformation matrix derived by Bryant angles.
where is the roll angle, is the pitch angle and is the yaw angle of the motion platform in the base plate coordinate system. Additional low-frequency translational acceleration generated by the coordinate transformation is removed by using the 2nd step high pass filter.
2.2. Rotational Washout Algorithm
The rotational washout algorithm consists of high pass filters and the coordinate transformation. The low-frequency angular velocity is removed by using the 1st step high pass filter, and the coordinate transformation is performed from the upper plate coordinate system to the base plate coordinate system of the motion platform. The angular velocity in the upper plate coordinate system [2,3,4,5] is expressed as
where is the angular velocity in the upper plate coordinate system, is the angular velocity in the base plate coordinate system and is used to transform the angular velocity from the upper coordinate system to the base plate coordinate system
Additional low-frequency angular velocity generated by the coordinate transformation is removed by using the 2nd step high pass filter.
2.3. Tilt Coordination Algorithm
The translational washout algorithm cannot generate the complete specific force because high pass filters only generate the high-frequency specific. However, the removed specific force at the translational washout algorithm can be generated by using the tilt coordination algorithm [2,3,4,5].
The driver feels the specific force to the opposite direction of the gravity. If the motion platform is tilted toward the opposite direction of the gravity, then the specific force is generated. The relation between the specific force and the angular velocity is written as:
where is the angular velocity caused by the specific force, is the specific force in the upper coordinate system and is the gravity vector in the upper coordinate system.
2.4. Limitation
The classical washout algorithm shows several limitations, although its computational speed is fast and its performance is stable. First, since the high and low pass filters used for tilt coordination are not ideal filters, there is a problem that the sum of the specific force is distorted. In addition, a time delay occurs in the simulator motion system due to the phase delay caused by the low pass filter, providing the driver with a different feeling of movement from the actual feeling of motion. These side effects are more problematic in rapid driving such as slalom and rapid acceleration and deceleration [2,3,4,5].
3. Proposed Washout Algorithm
3.1. New Tilt Coordination Algorithm with Proportional Gain α
Concept
In the classical washout algorithm, continuous translational acceleration is enhanced using a high pass filter, and the specific force component generates a low-frequency translational acceleration by passing the translational acceleration through a low pass filter and then by gradient transformation. However, since the actual high and low pass filters are not ideal filters, the sum of the specific force applied with these filters is distorted differently from the original specific force. Therefore, the new gradient transformation model is proposed by using the difference between the translation acceleration and the translation acceleration past the high pass filter to solve the problem caused using the low pass filter during gradient transformation [3].
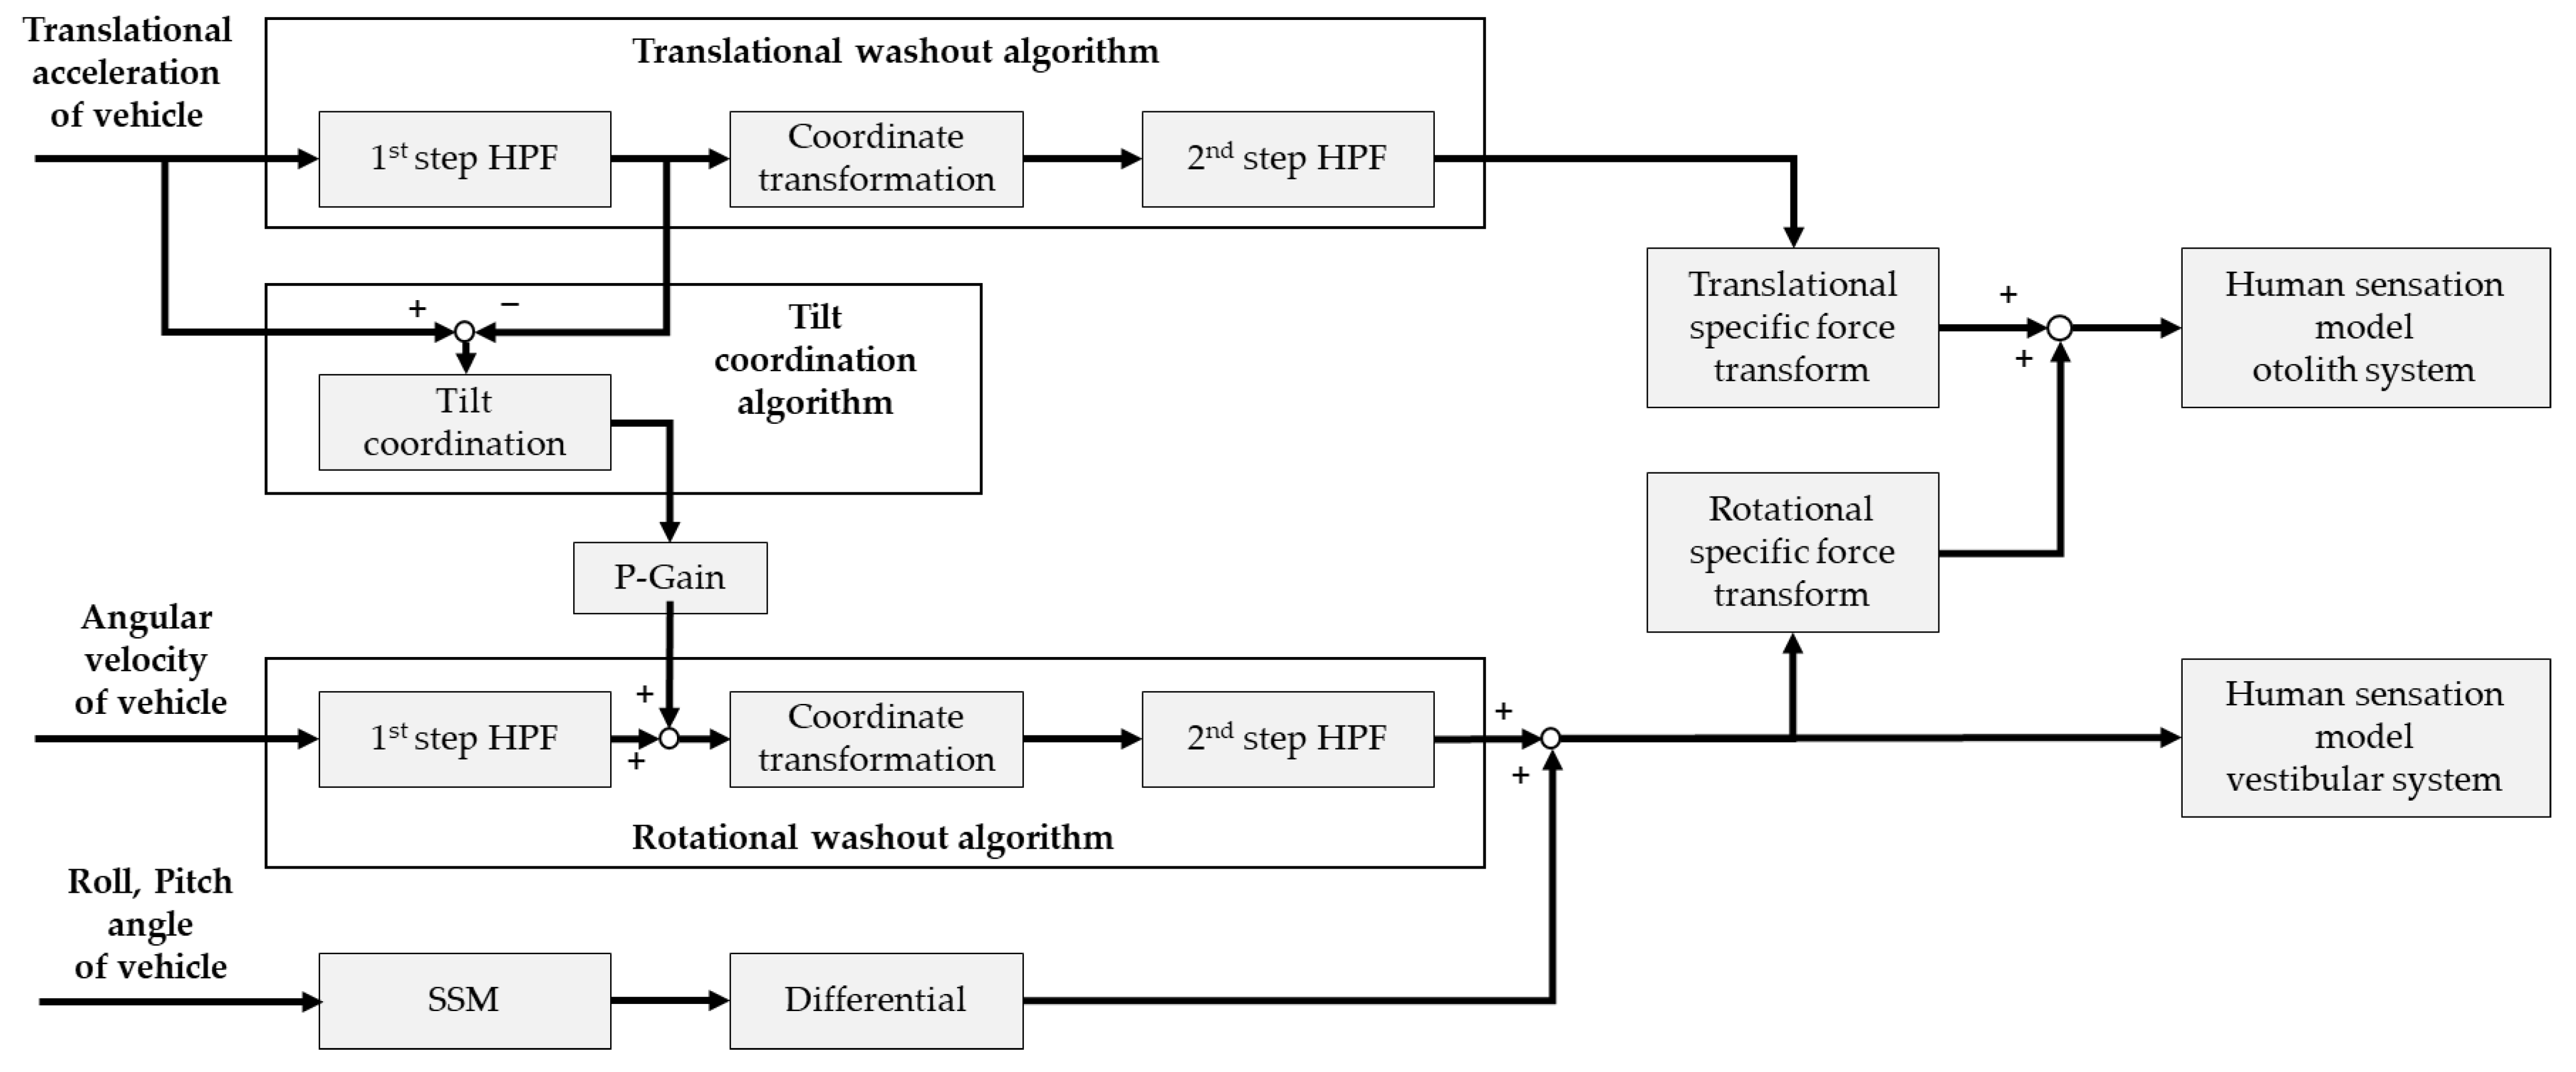
However, the new tilt coordination algorithm improves the translational motion sensation, but the rotational motion sensation is extremely deteriorated. Therefore, this paper supplemented the side effect of the new tilt coordination by applying a proportional gain to the specific force component generated from the new tilt coordination. The proportional gain α has a value between 0 and 1, and a new gradient transformation is fully reflected in the case of 1, but a value less than 1 prevents a decrease in rotational motion sensation. However, it should be noted that taking the gain too small can limit the improvement of translational motion sensation, which is an advantage of the new tilt coordination algorithm.
3.2. Subregion Scale Method
In the case of vehicles, unlike aircraft, the angle of the roll and pitch direction is limited in motion within a specific angular range depending on road gradient and dynamic characteristics. Accordingly, the rotational motion sensation may be improved by directly reflecting the tilt angle of the vehicle to the simulator motion. Rotational motion sensation can be simulated by the tilt angle of the vehicle, but excessive application of the tilt angle of the vehicle rather leads to a decrease in translational motion sensation. Therefore, there is a need for a method of maintaining an improved translational motion sensation, improving a rotational motion sensation and appropriately scaling so as not to deviate from the motion area of the simulator.
Although this method has been proposed in the past [4,5], it simply presents the scale method and insufficient research on the method of selecting the scale parameter, so this paper presents the criteria for setting the scale value considering the operation area of the motion system through mathematical analysis. Figure 2 shows the structure of the proposed washout algorithm. SSM means the subregion scale method.
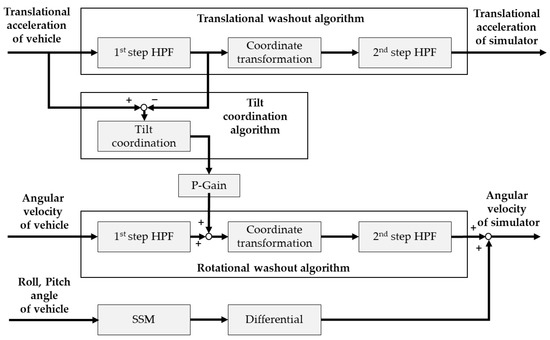
Figure 2.
Structure of the proposed washout algorithm.
Analysis of Parameter Used in Subregion Scale Method
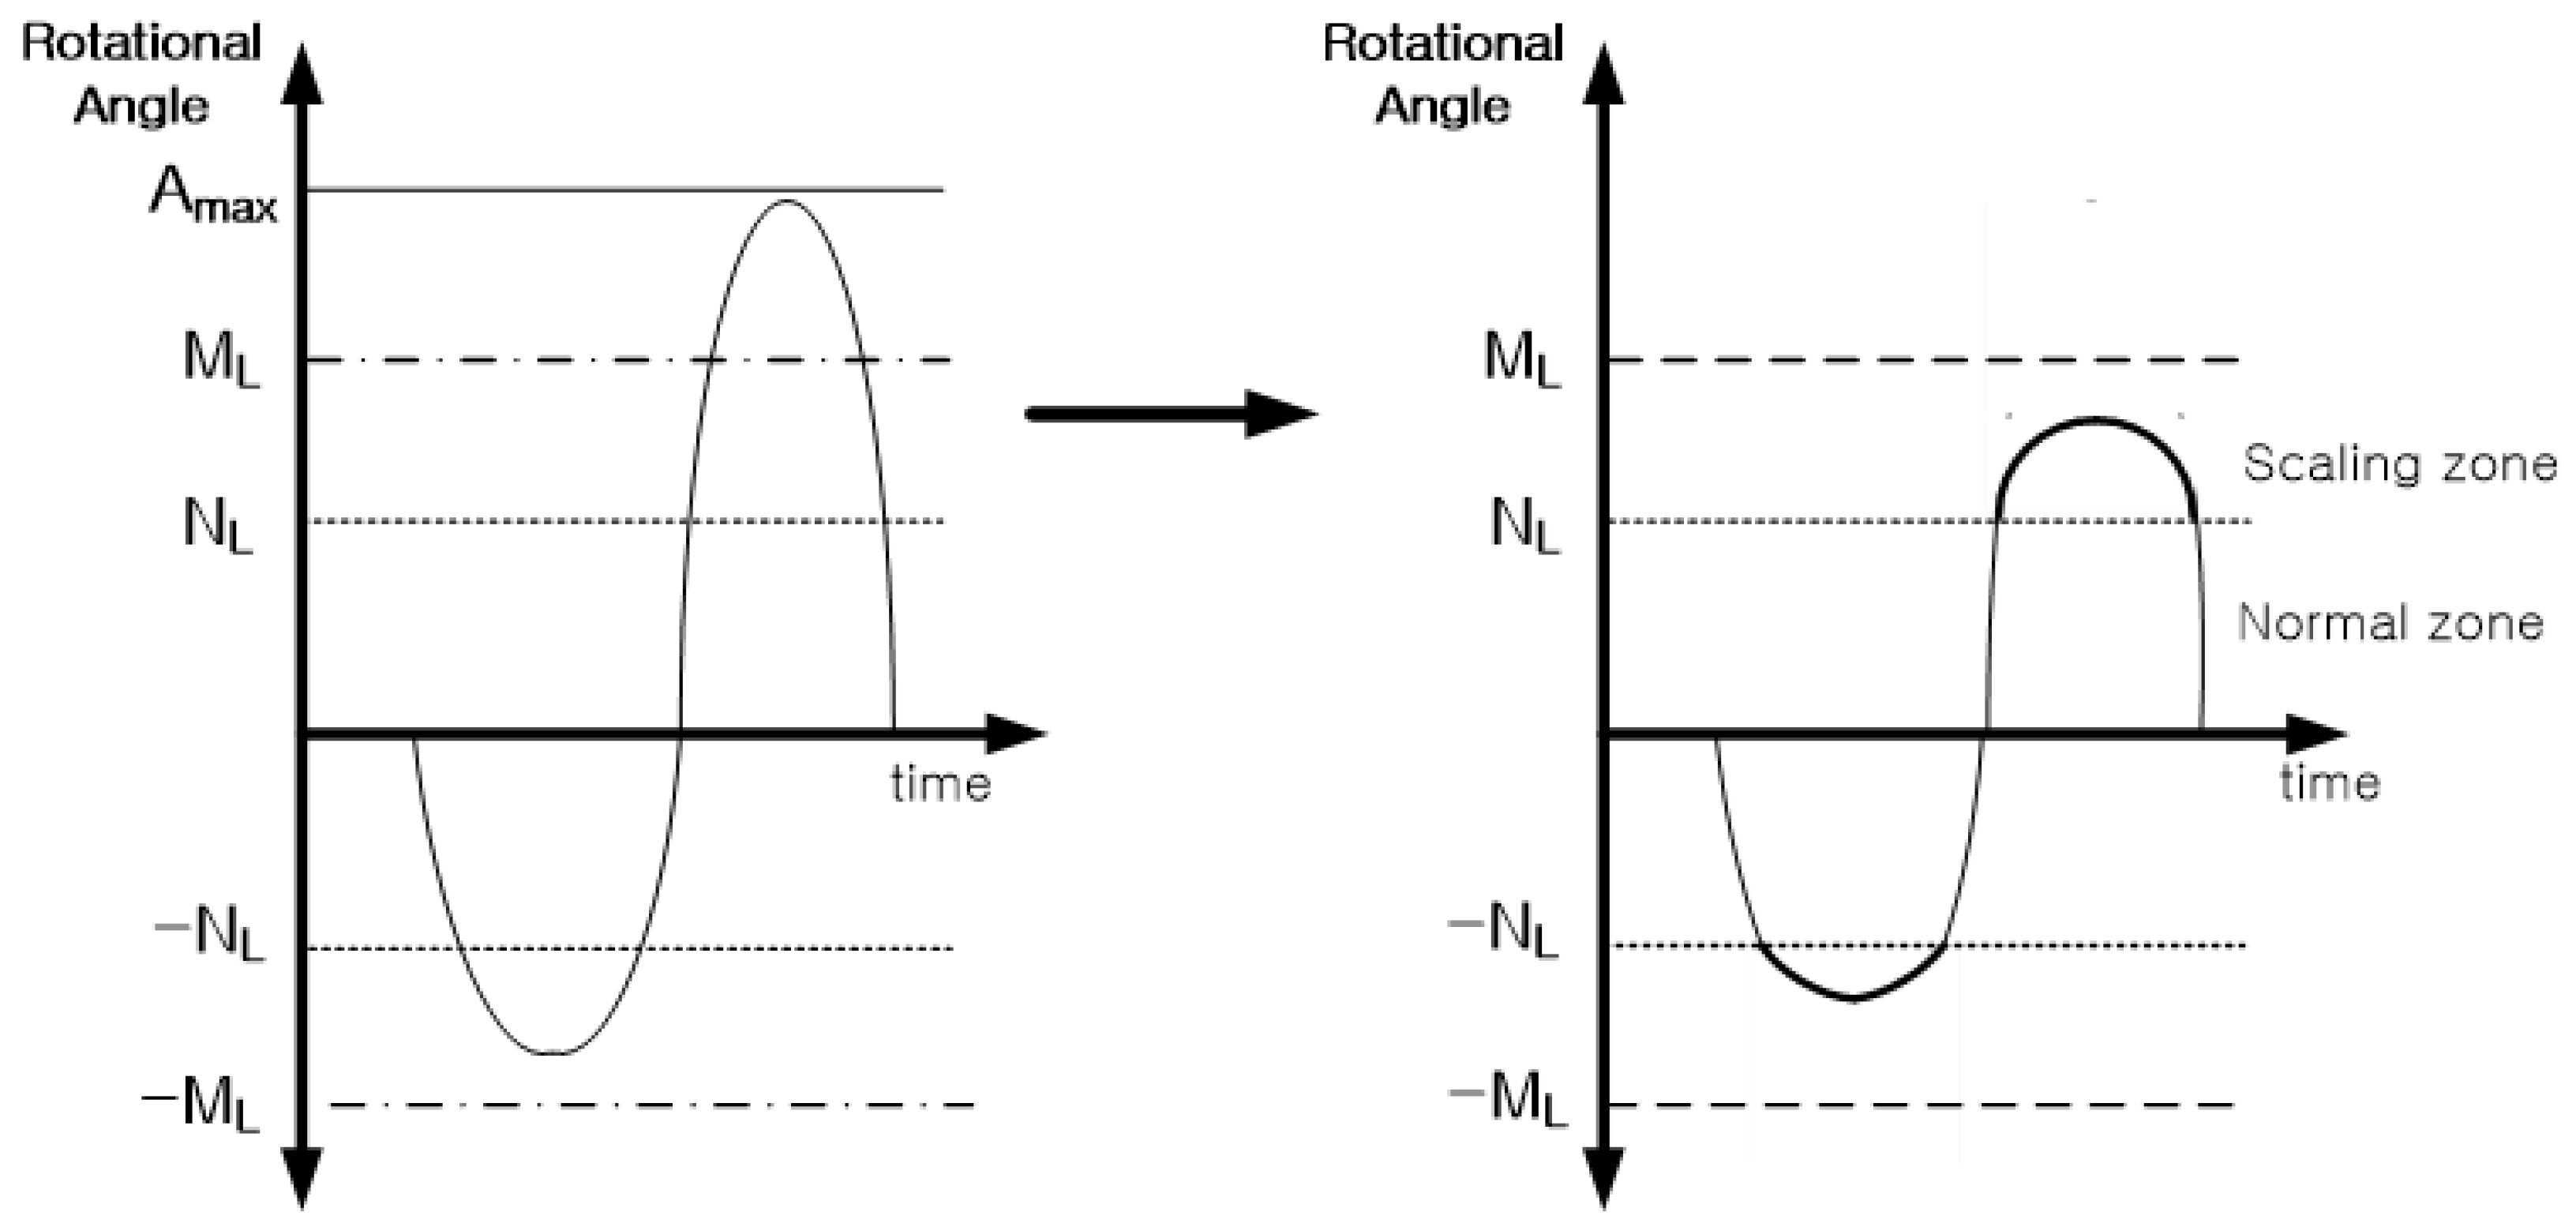
Figure 3 represents principle of the subregion scale method. is the normal zone without signal scale. is defined as
where is the scale constant and has a value between 0 and 1, and represents the maximum vehicle tilt angle generated by the VDS. If has 1, rotation angle value is not scaled and is reproduced on the simulator’s motion platform.

Figure 3.
Principle of the SSM.
In the scaling region, it may be expressed by the following equation so as not to exceed the mechanical limit of the motion platform.
where represents a scaled angle value, is an original angle value and is a scale constant having a value between 0 and 1. In order to maintain the shape of the angle value, is replaced with , and Equation (7) can be summarized as follows using Equation (6).
To determine , it is necessary to consider and the angular motion limit of the motion platform.
where is the kinematic limit of the motion platform, and is a scale constant representing the ratio between and . The constraint condition to restrict the rotational angle within is defined as
Equation (10) is rewritten as
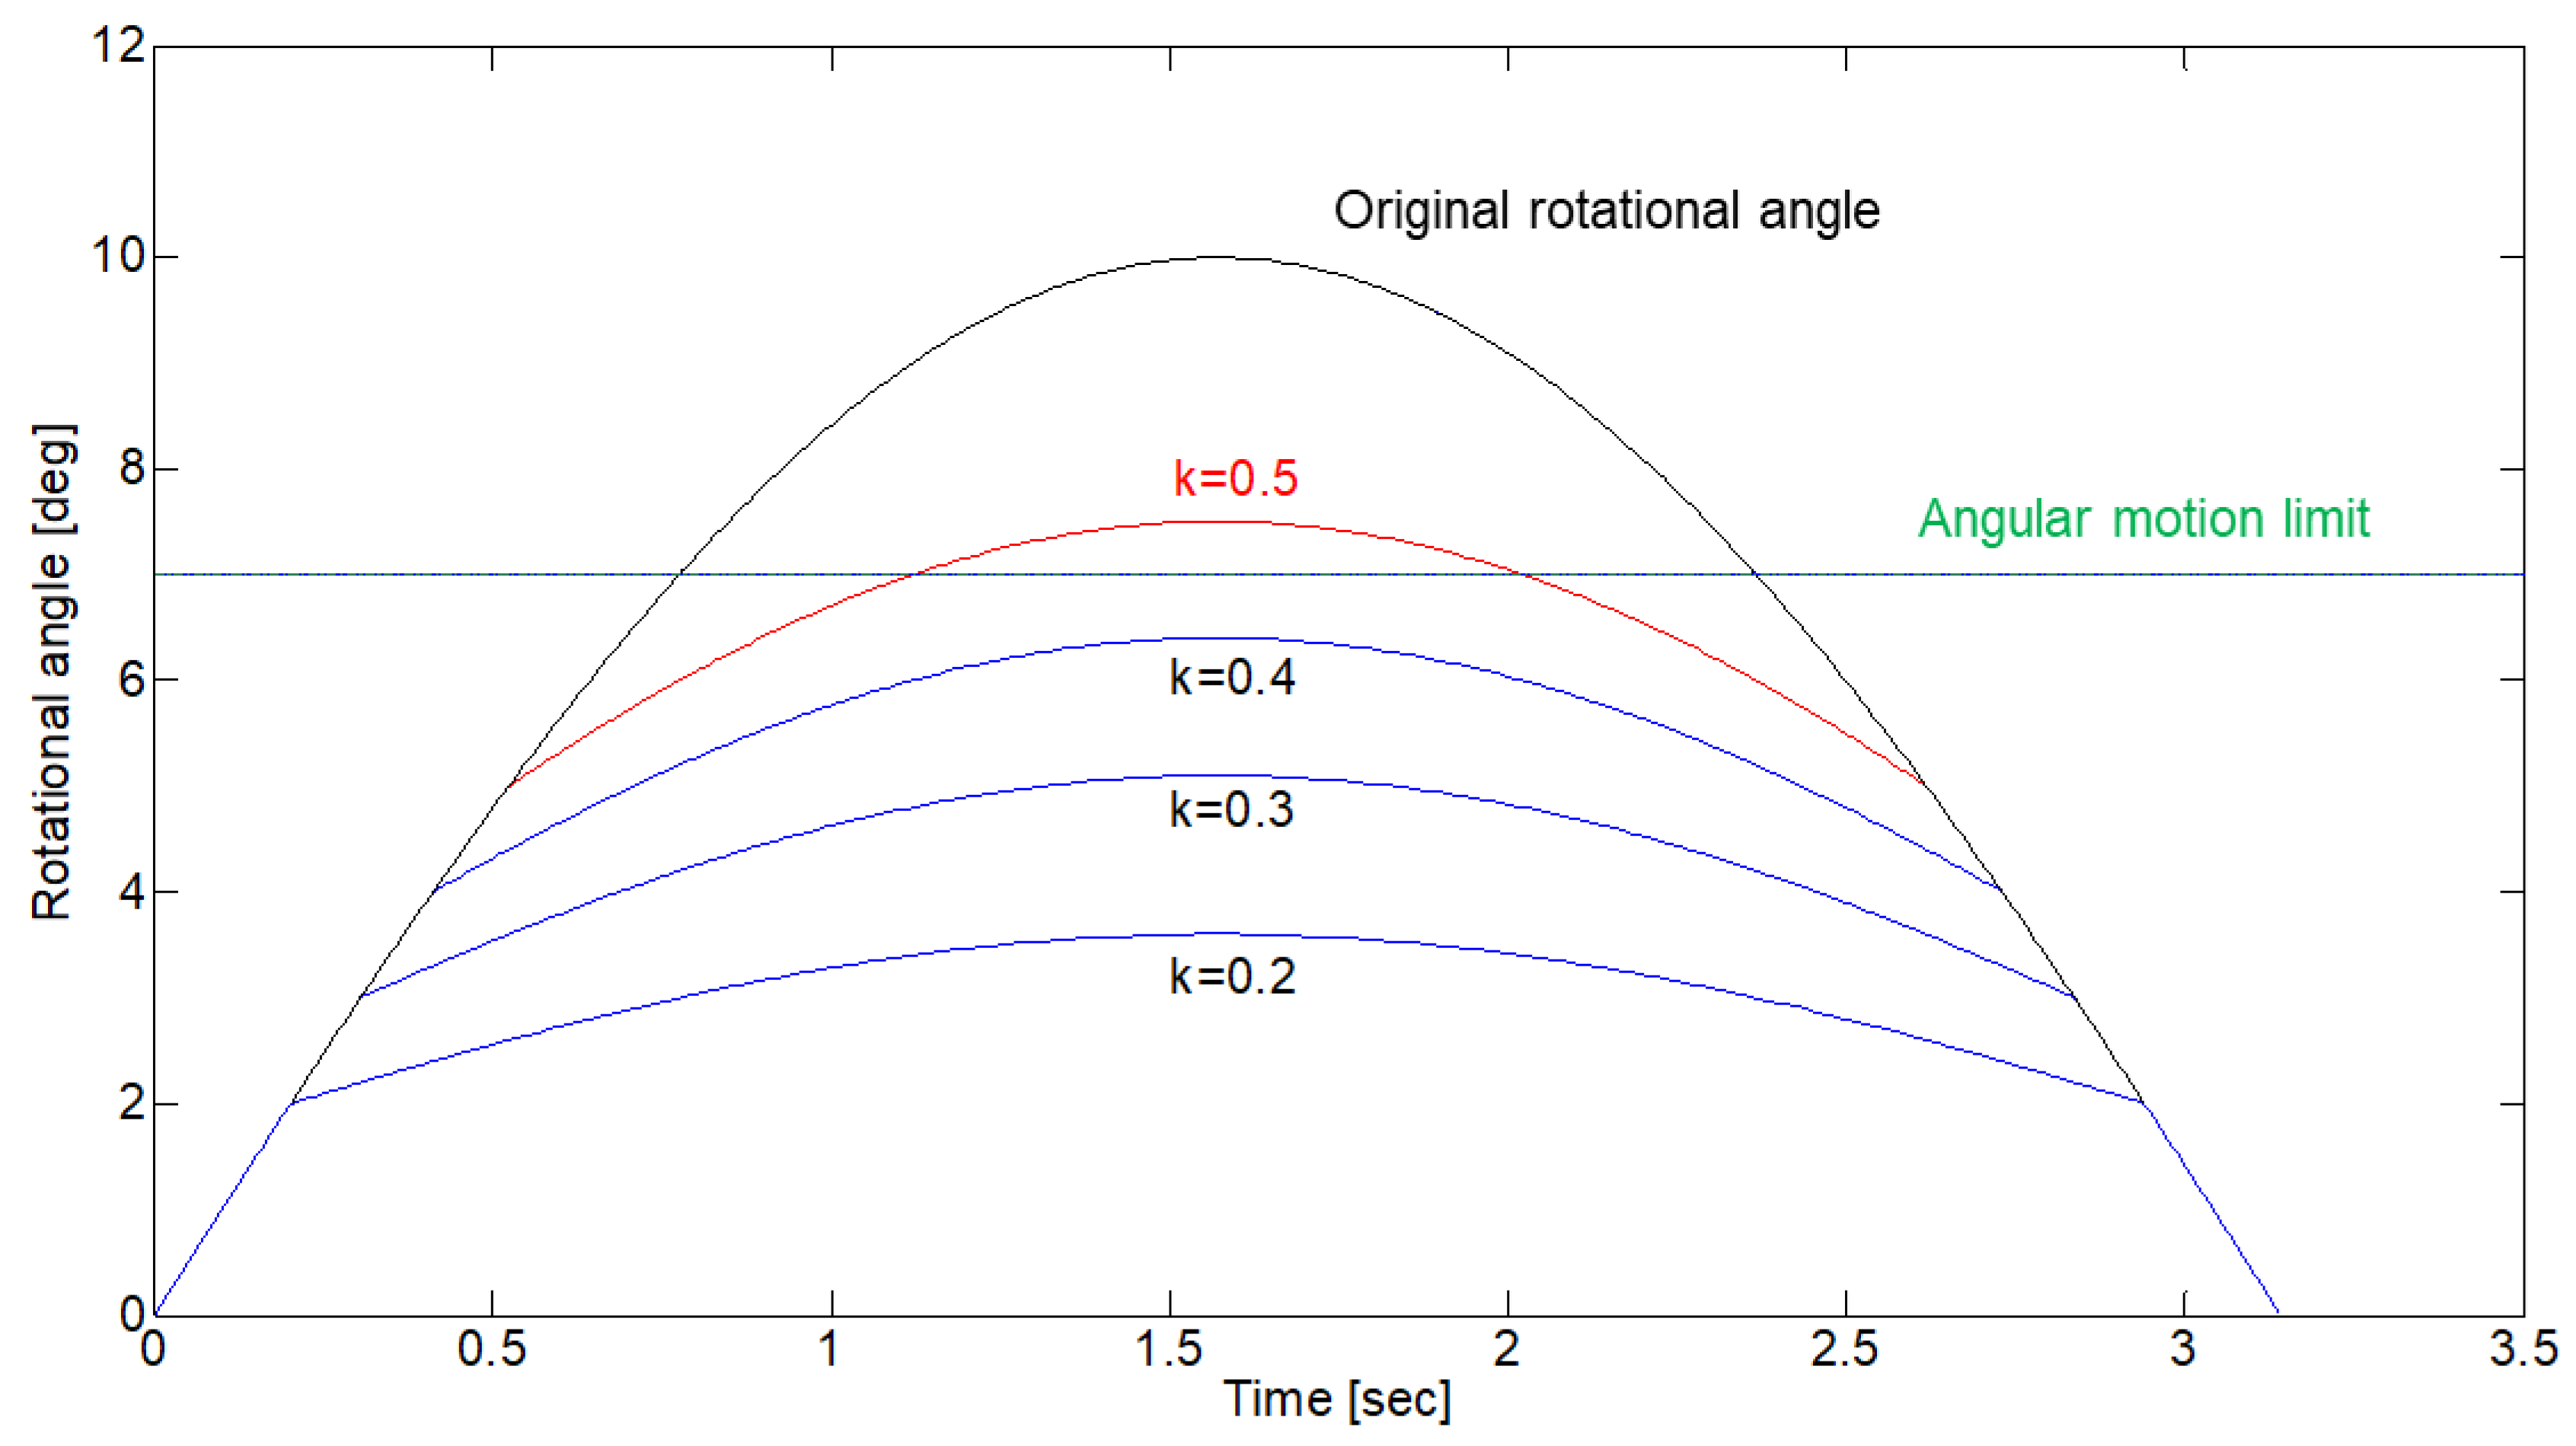
Equation (11) is the constraint condition to select scale parameter k. Figure 4 shows relations between k and δ. If the user selects δ in consideration of the maximum angle value of the vehicle and the mechanical limit value of the motion system, the user can select the scale variable k, which the user can set to the maximum. For example, if and , k that does not exceed the kinematic limit can be set to maximum 0.4523. Figure 5 shows the scaled tilt angle according to the change in the value of k.
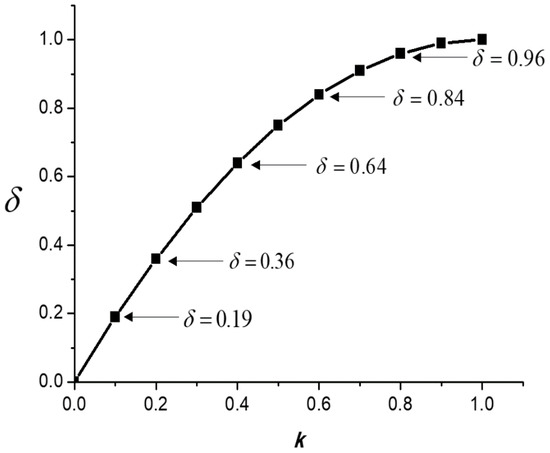
Figure 4.
Relation of k and δ.
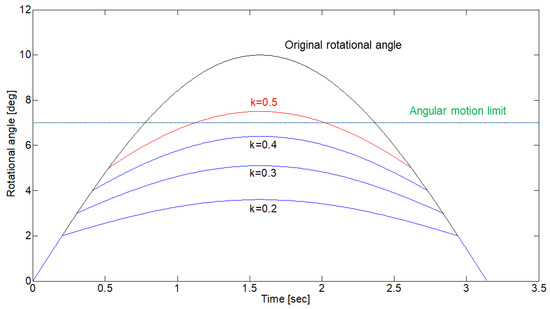
Figure 5.
Example of rotational angle according to value of k.
4. Simulation
4.1. KATECH Advanced Automoitve Simulator
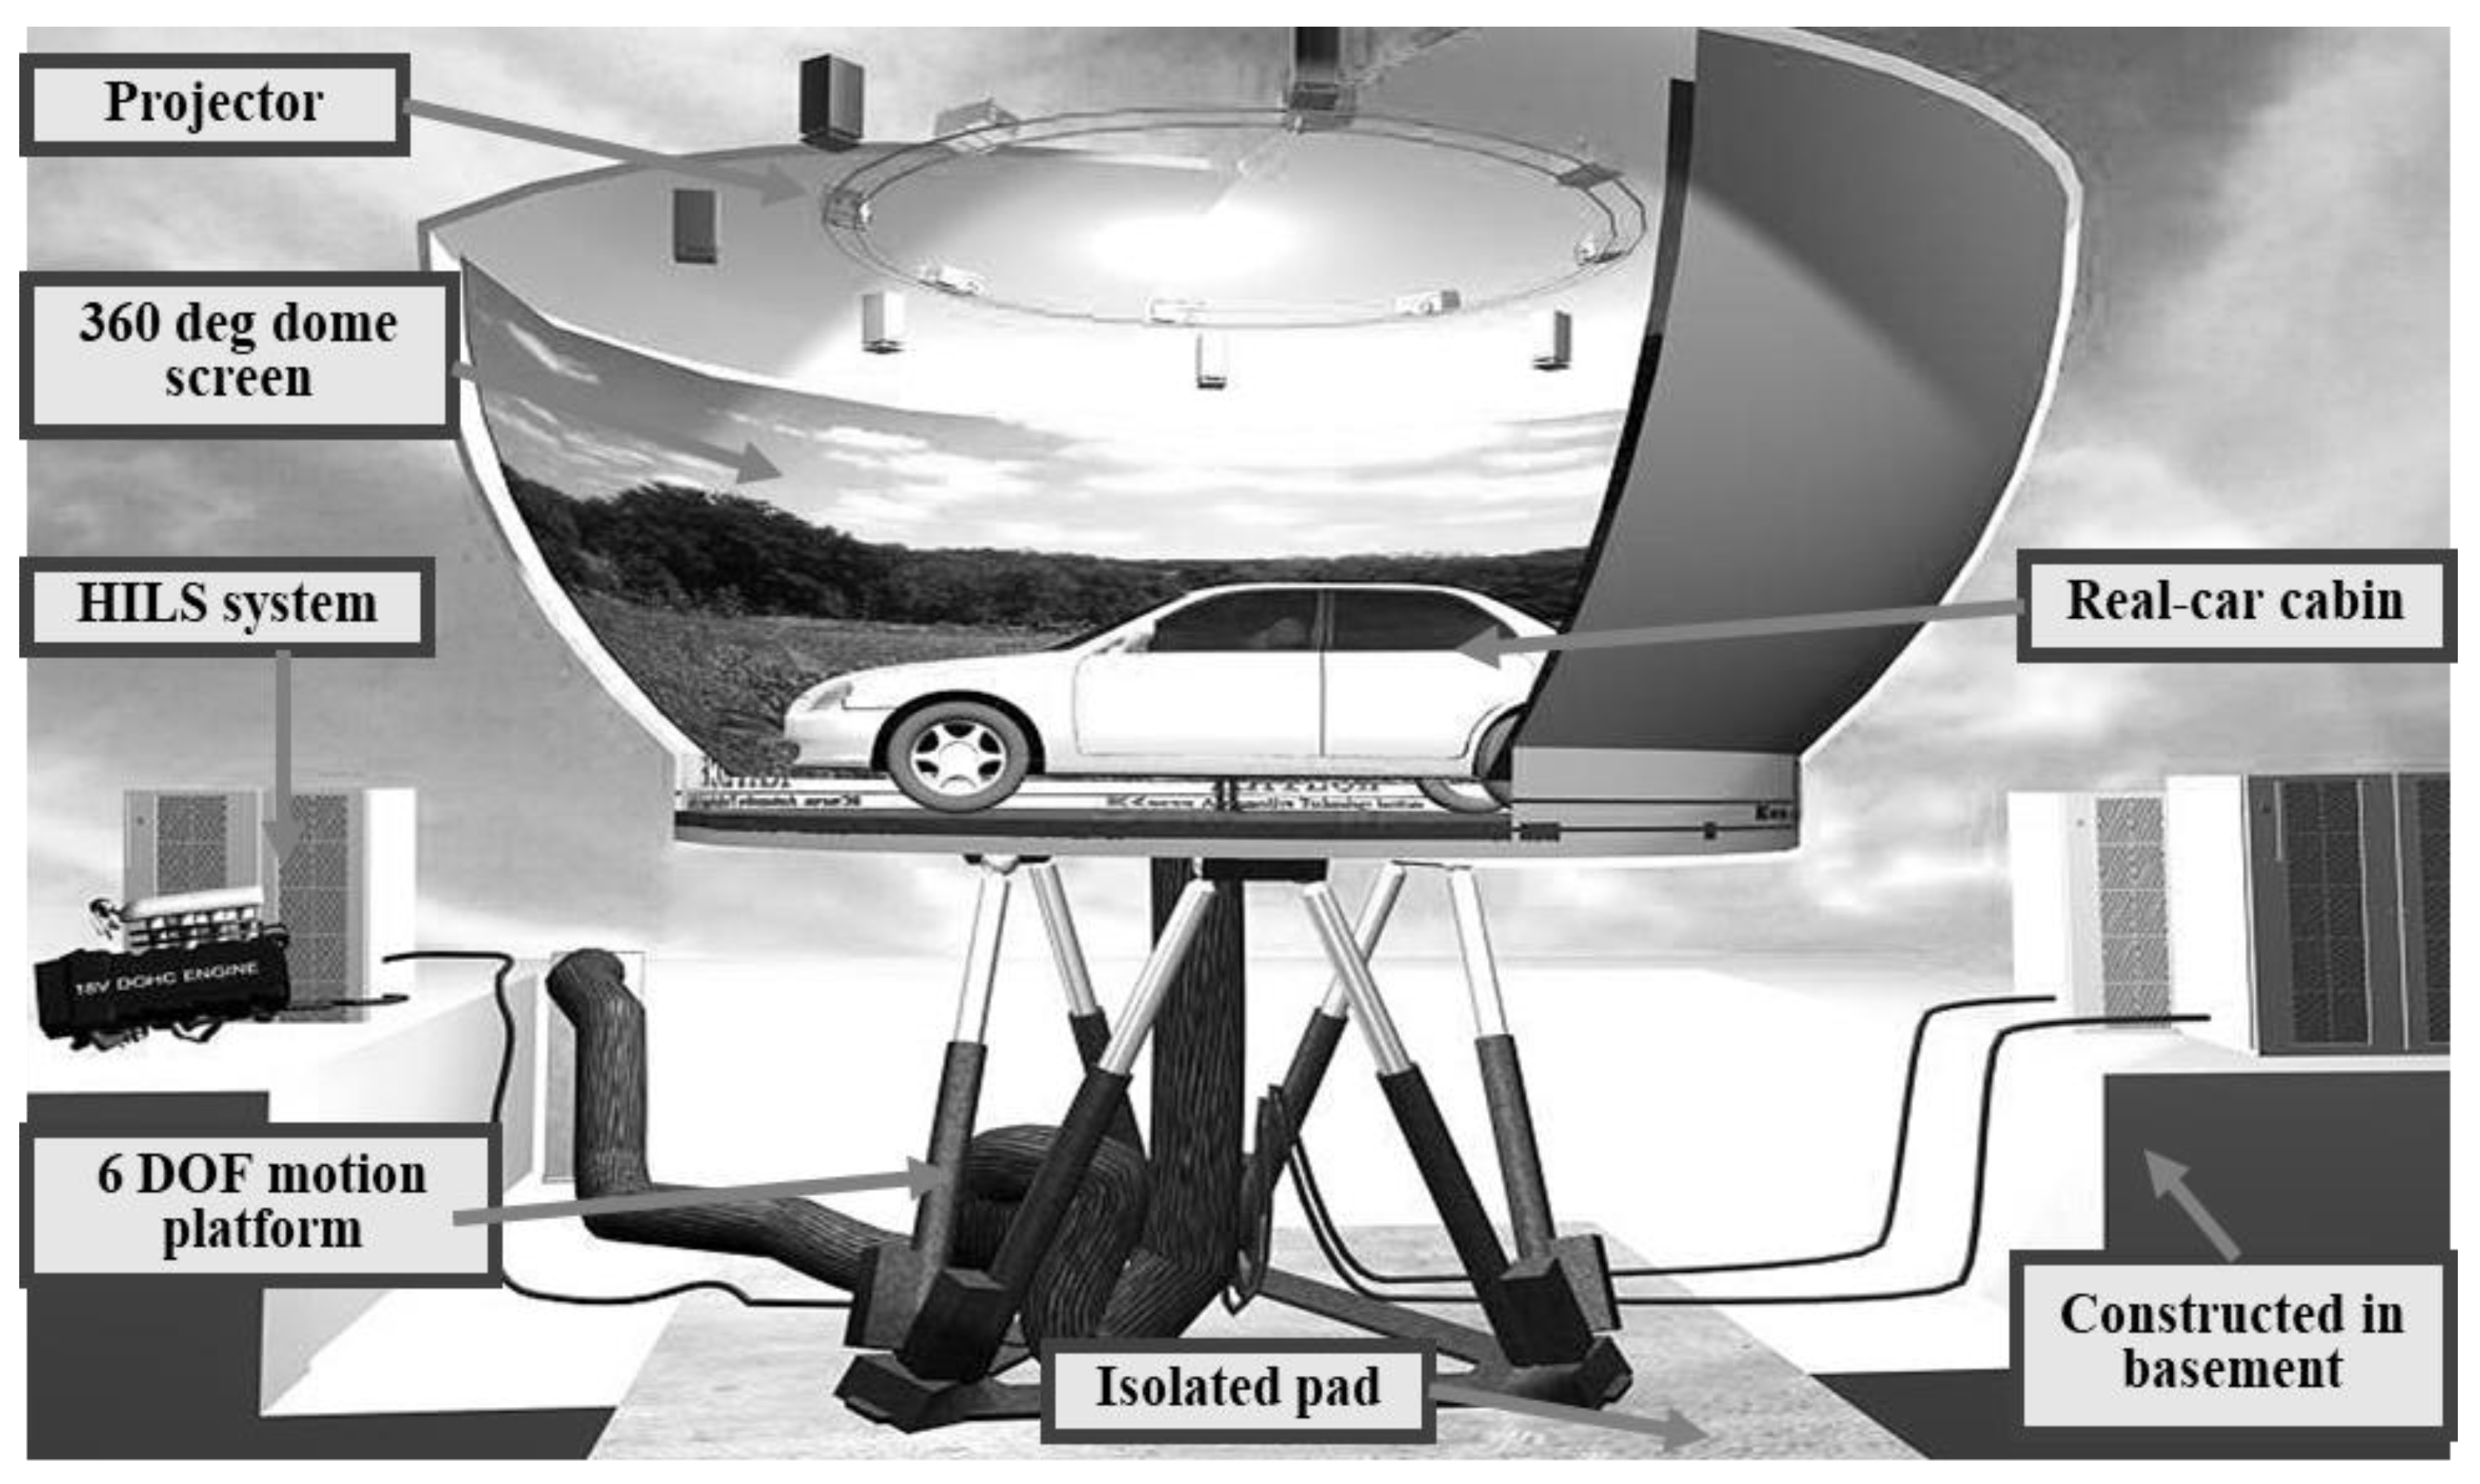
KATECH (Korea Automotive Technology Institute Cheonan-si, Korea) advanced automotive simulator (KAAS) has been developed to test automotive parts of ADAS and ADS. A unit function test, a compatibility test and a T-car test often show difficulties to test these advanced automotive parts. The KAAS system provides a realistic driving environment and an enhanced test environment for automotive parts developers. Figure 6 shows the developed KAAS system.
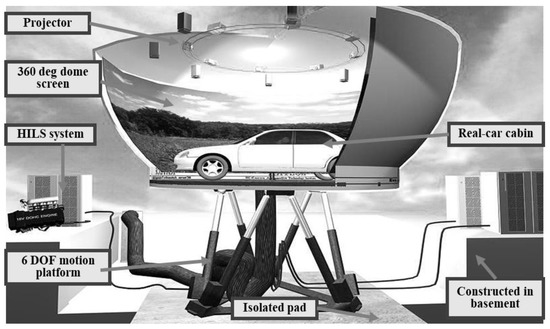
Figure 6.
KATECH advanced automotive simulator.
The completed KAAS system is an integrated system with a VR-based driving simulator, real-time HILS systems, vehicle network simulators, wireless communication devices, various 3D DBs of real city area, a real-time GPS/CDMA simulator and human analysis devices. Because of the developed KAAS, it is possible to research and develop automotive parts according to various vehicle models, traffic scenarios, drivers and others. The real-car cabin is used for the KAAS car cabin system. An electric power steering (EPS) of a sedan is employed to create the reaction force, and the reaction force is varied according to the velocity of the vehicle in nine different force levels. The EPS is directly connected to the steering column through a universal joint. An encoder is mounted on the column to detect the steering angle and to provide the angle for the micro-controller. For the brake pedal, the original hydraulic system is used, and a potentiometer is installed to measure the brake pedal angle. For the acceleration pedal, the original structure and throttle position sensor are used.
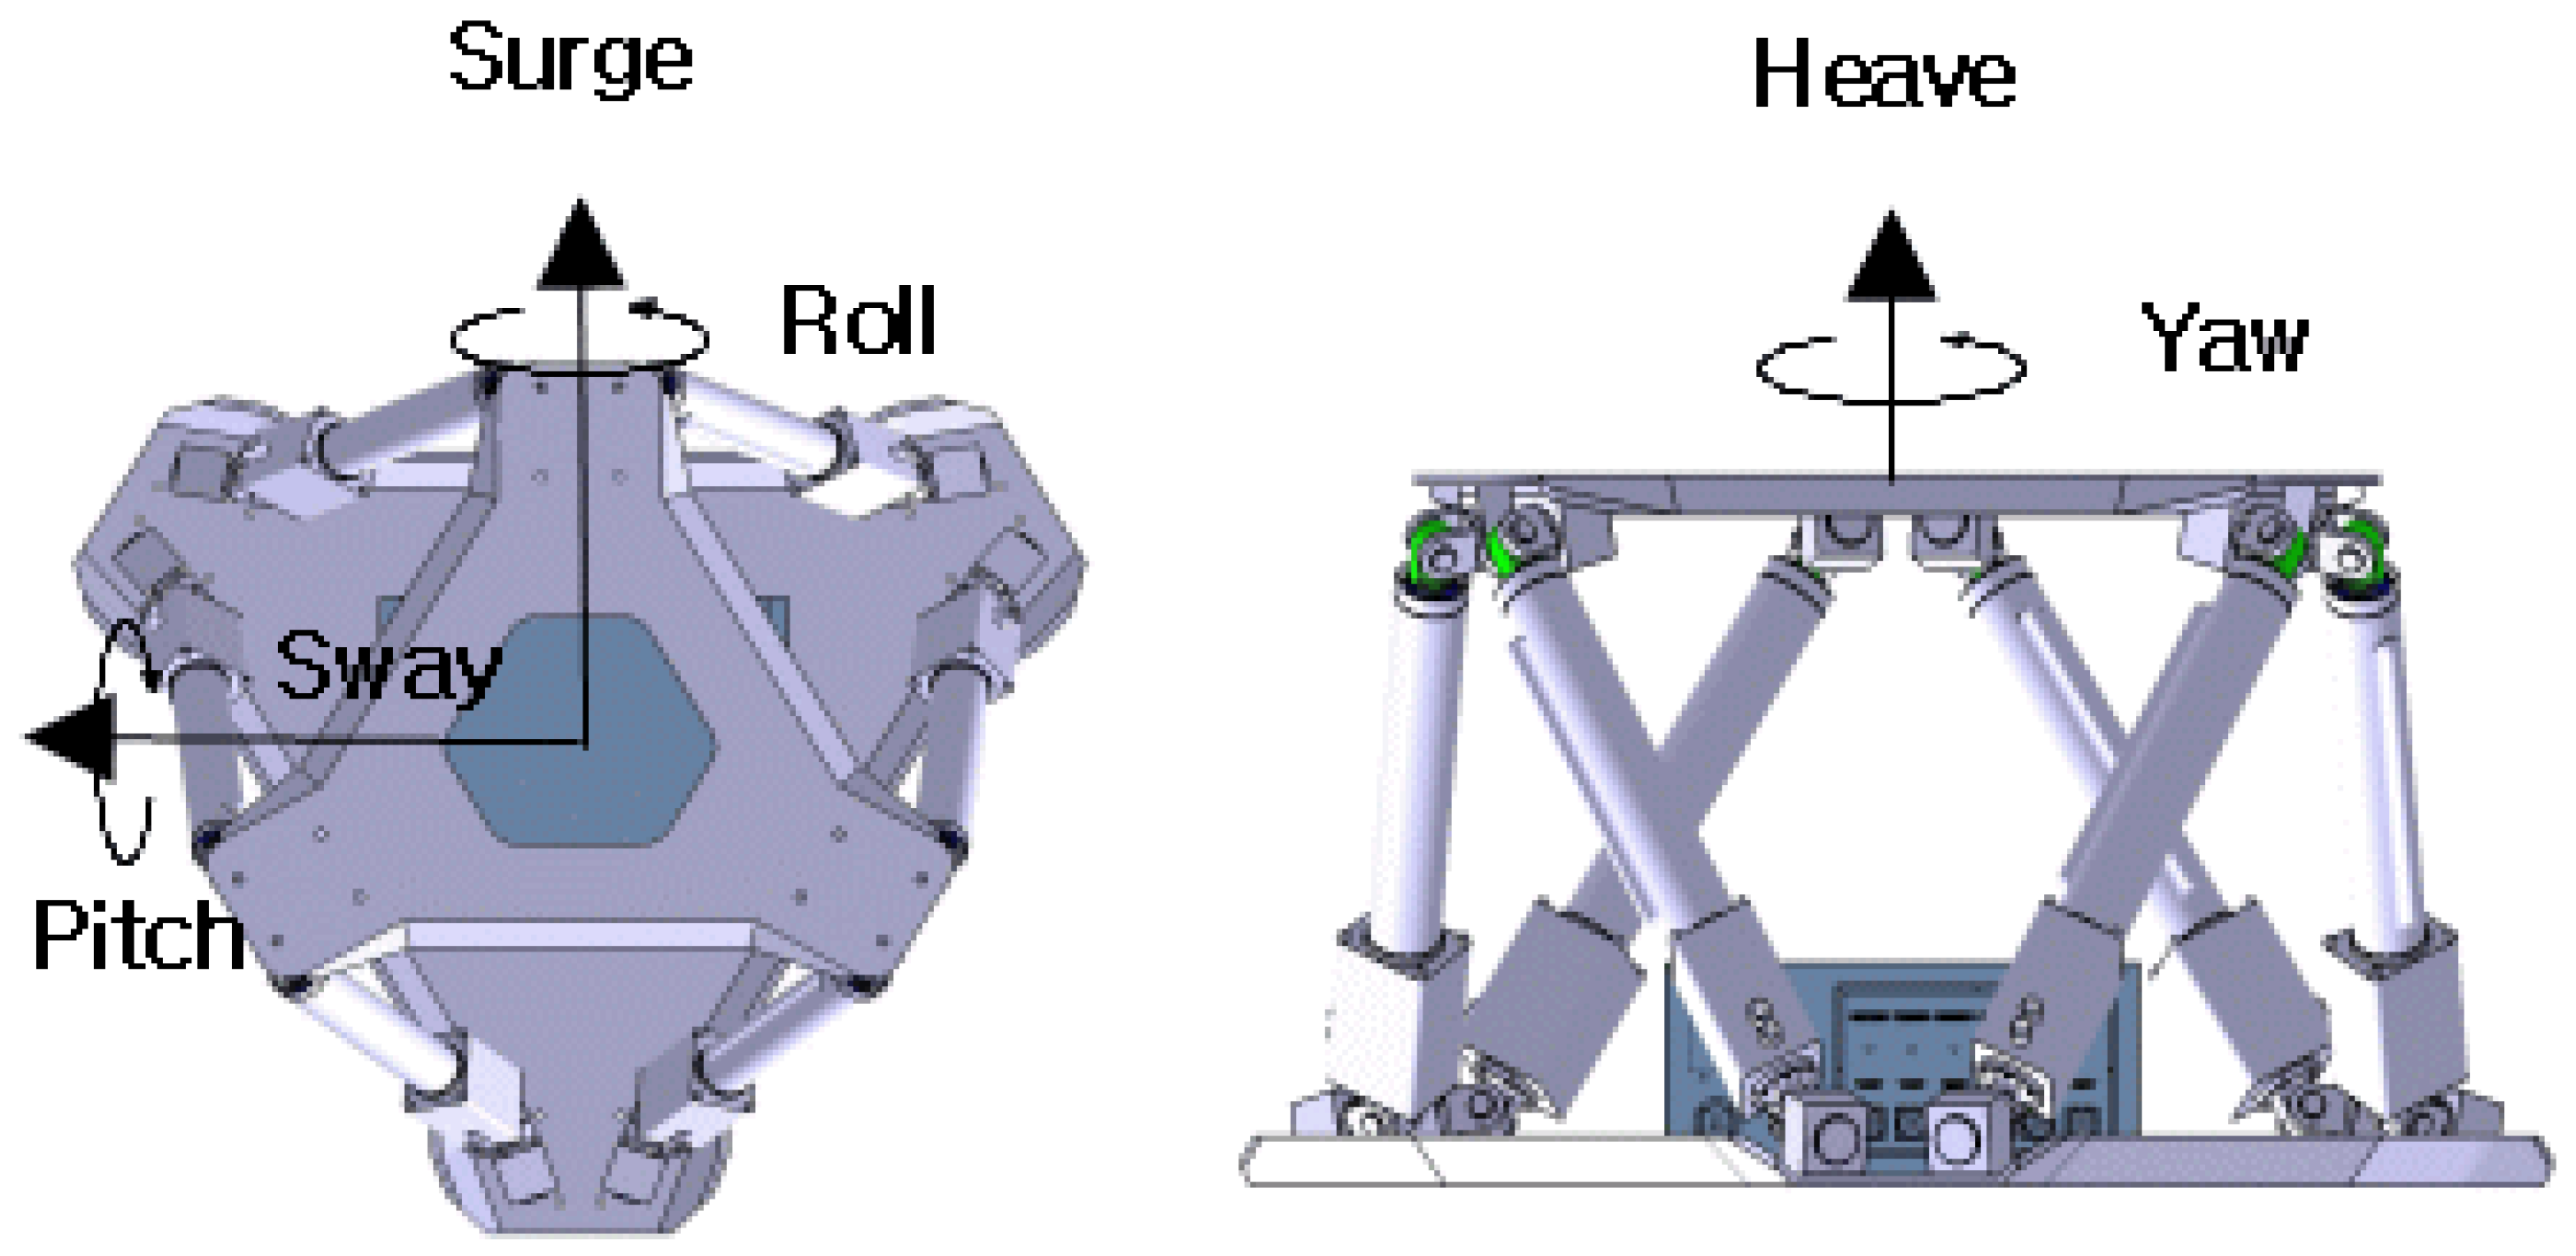
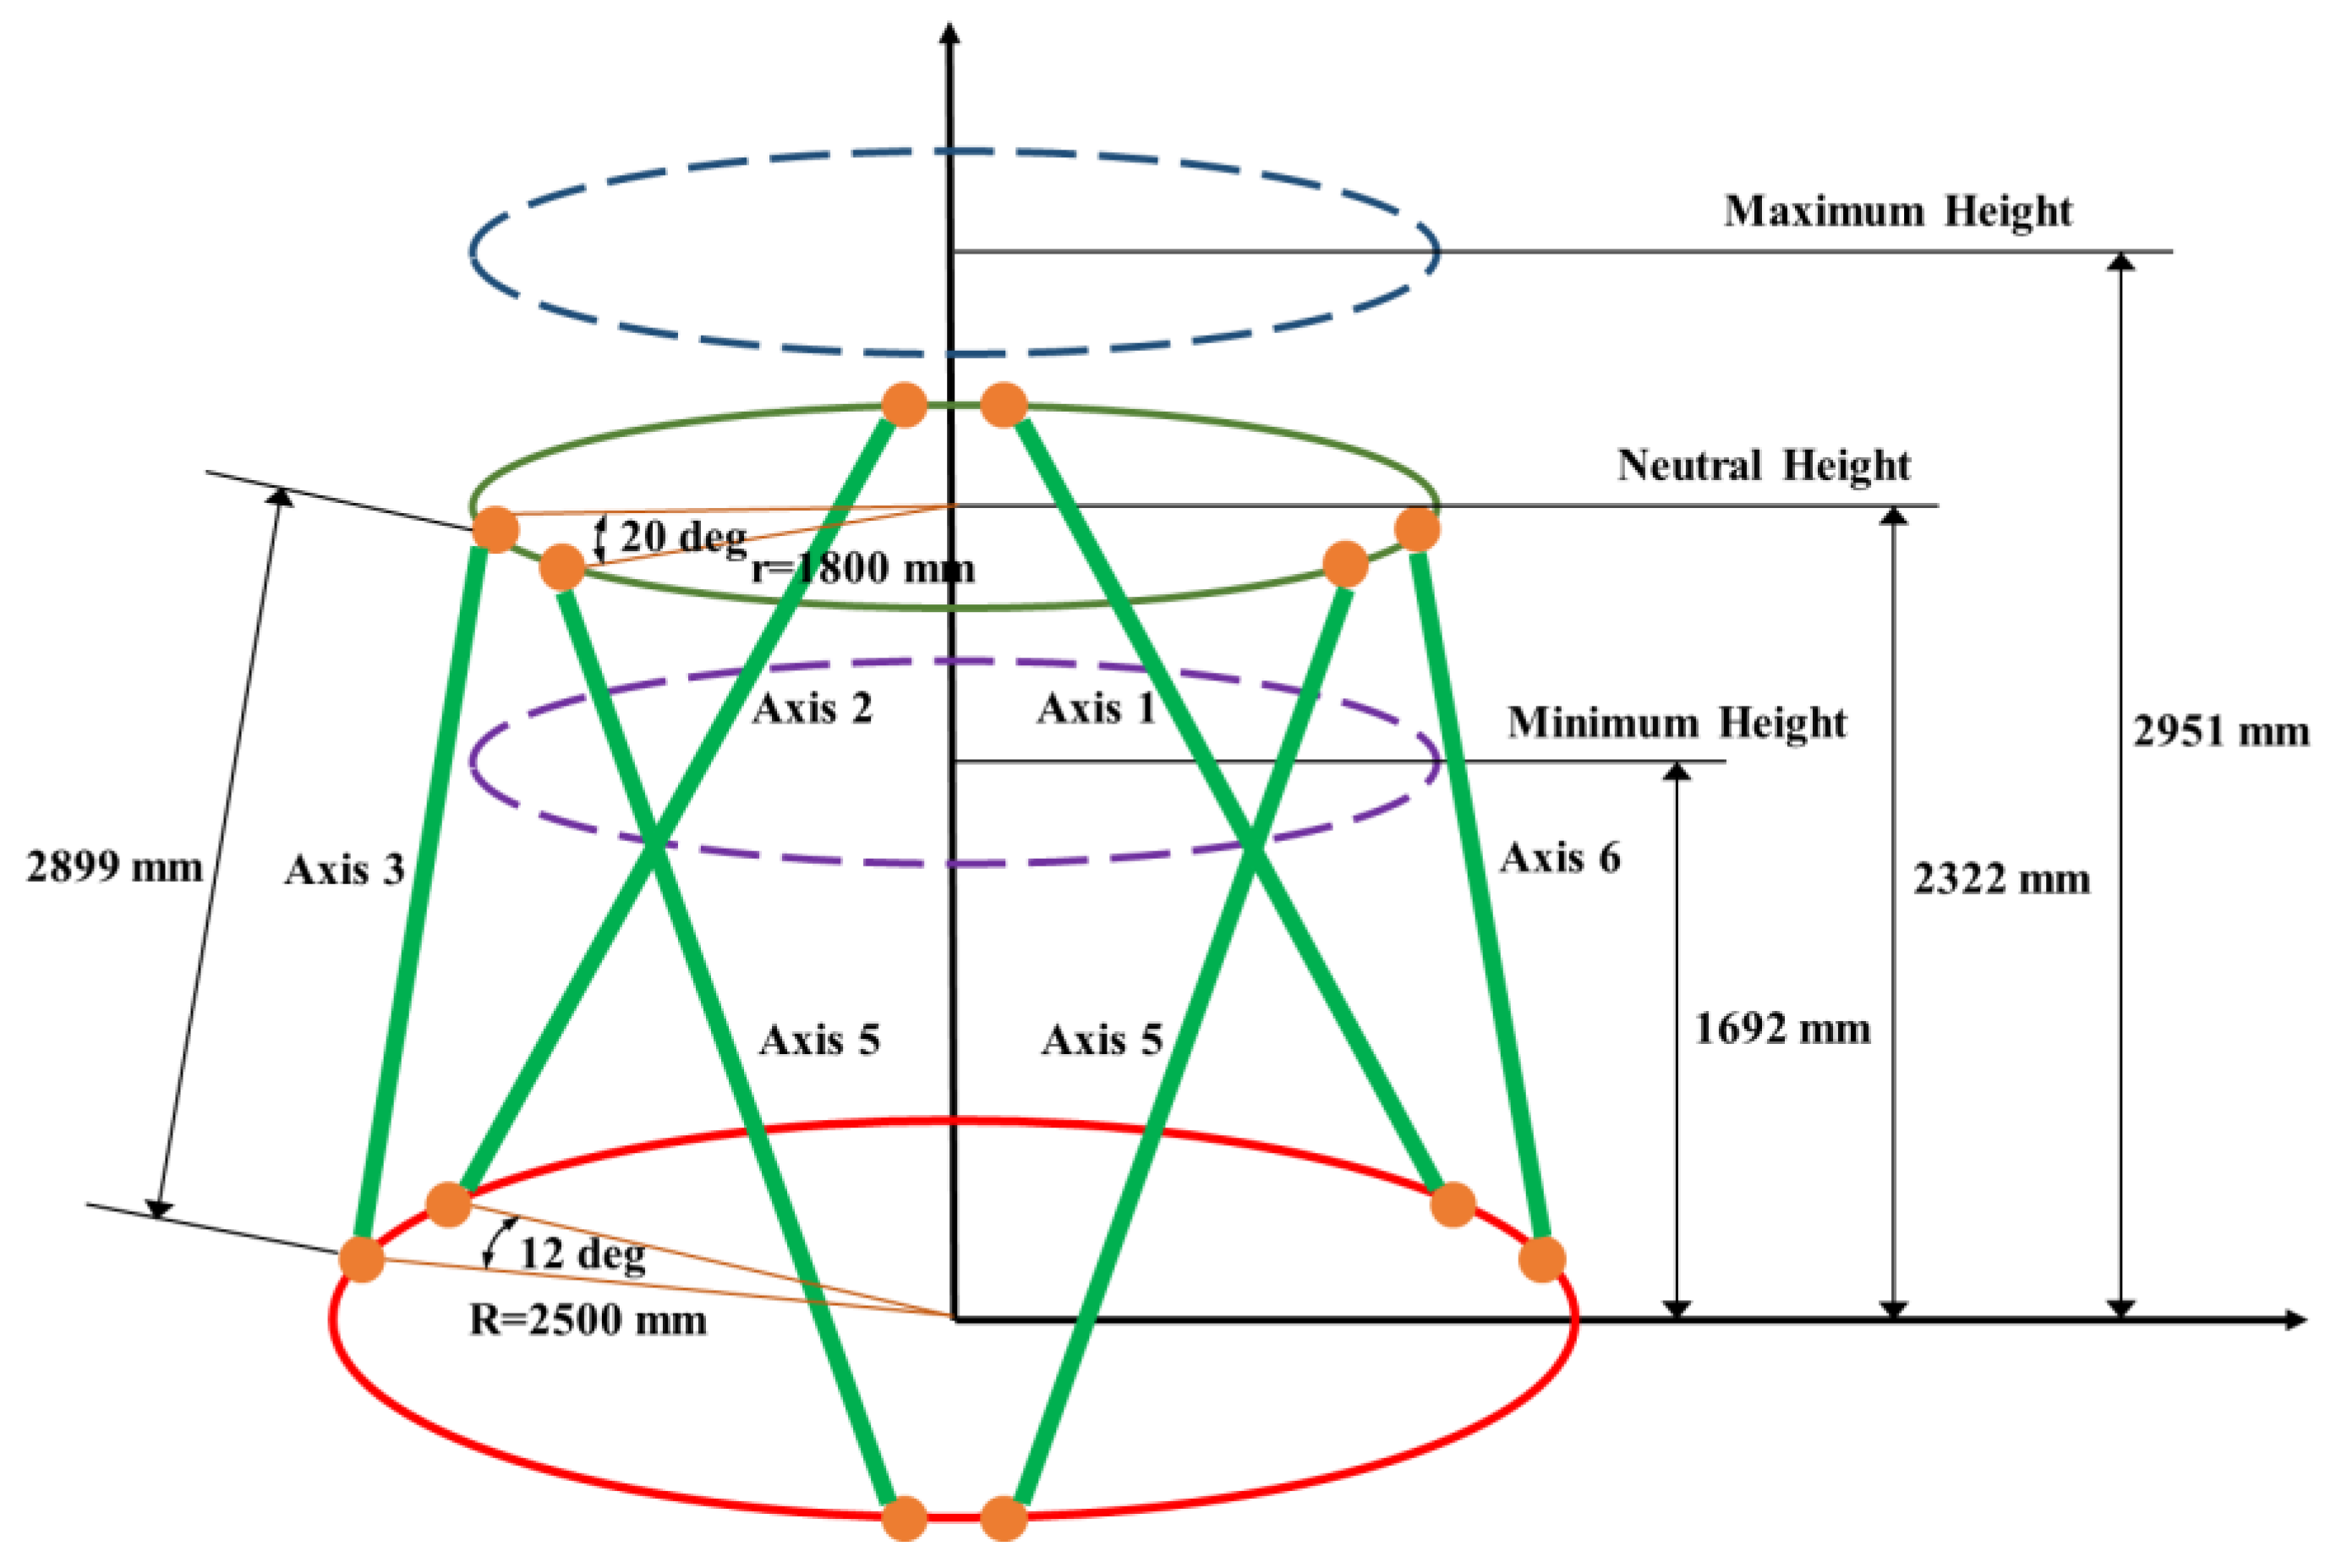
The 6DOF (Degrees of Freedom) motion platform creates the translational and rotational motion of the dome system for the driver to feel the motion sensation as if the driver is in the real driving. The overall weight of the entire dome system is about 5.5 ton including a car cabin, a driver and additional five occupants, the spherical screen, the dome structure, the top plate of the motion platform, projectors and the ceiling structure. The motion platform used for the KAAS system is originally designed for 7-ton payload, and it is capable of accelerating the 5.5-ton dome system over 0.5 g in any direction. The top plate of the motion platform has maximum 2.9 m height. Figure 7 shows the coordinates of the motion platform. Figure 8 shows the dimensions of the motion platform. The kinematic limit ranges of the motion platform are presented in Table 1.
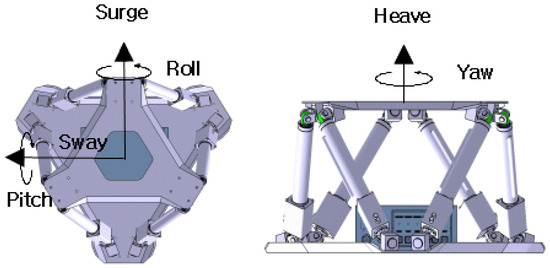
Figure 7.
Coordinates of the motion platform.
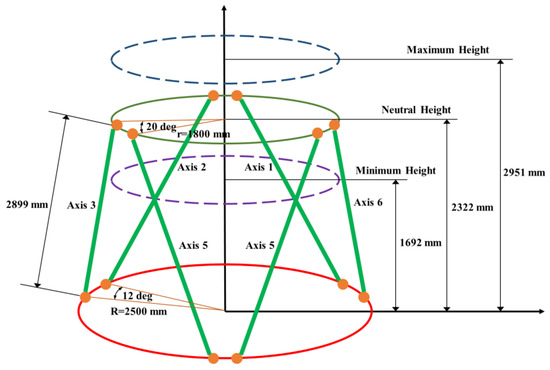
Figure 8.
Dimensions of the motion platform.

Table 1.
Kinematic limit range of the motion platform.
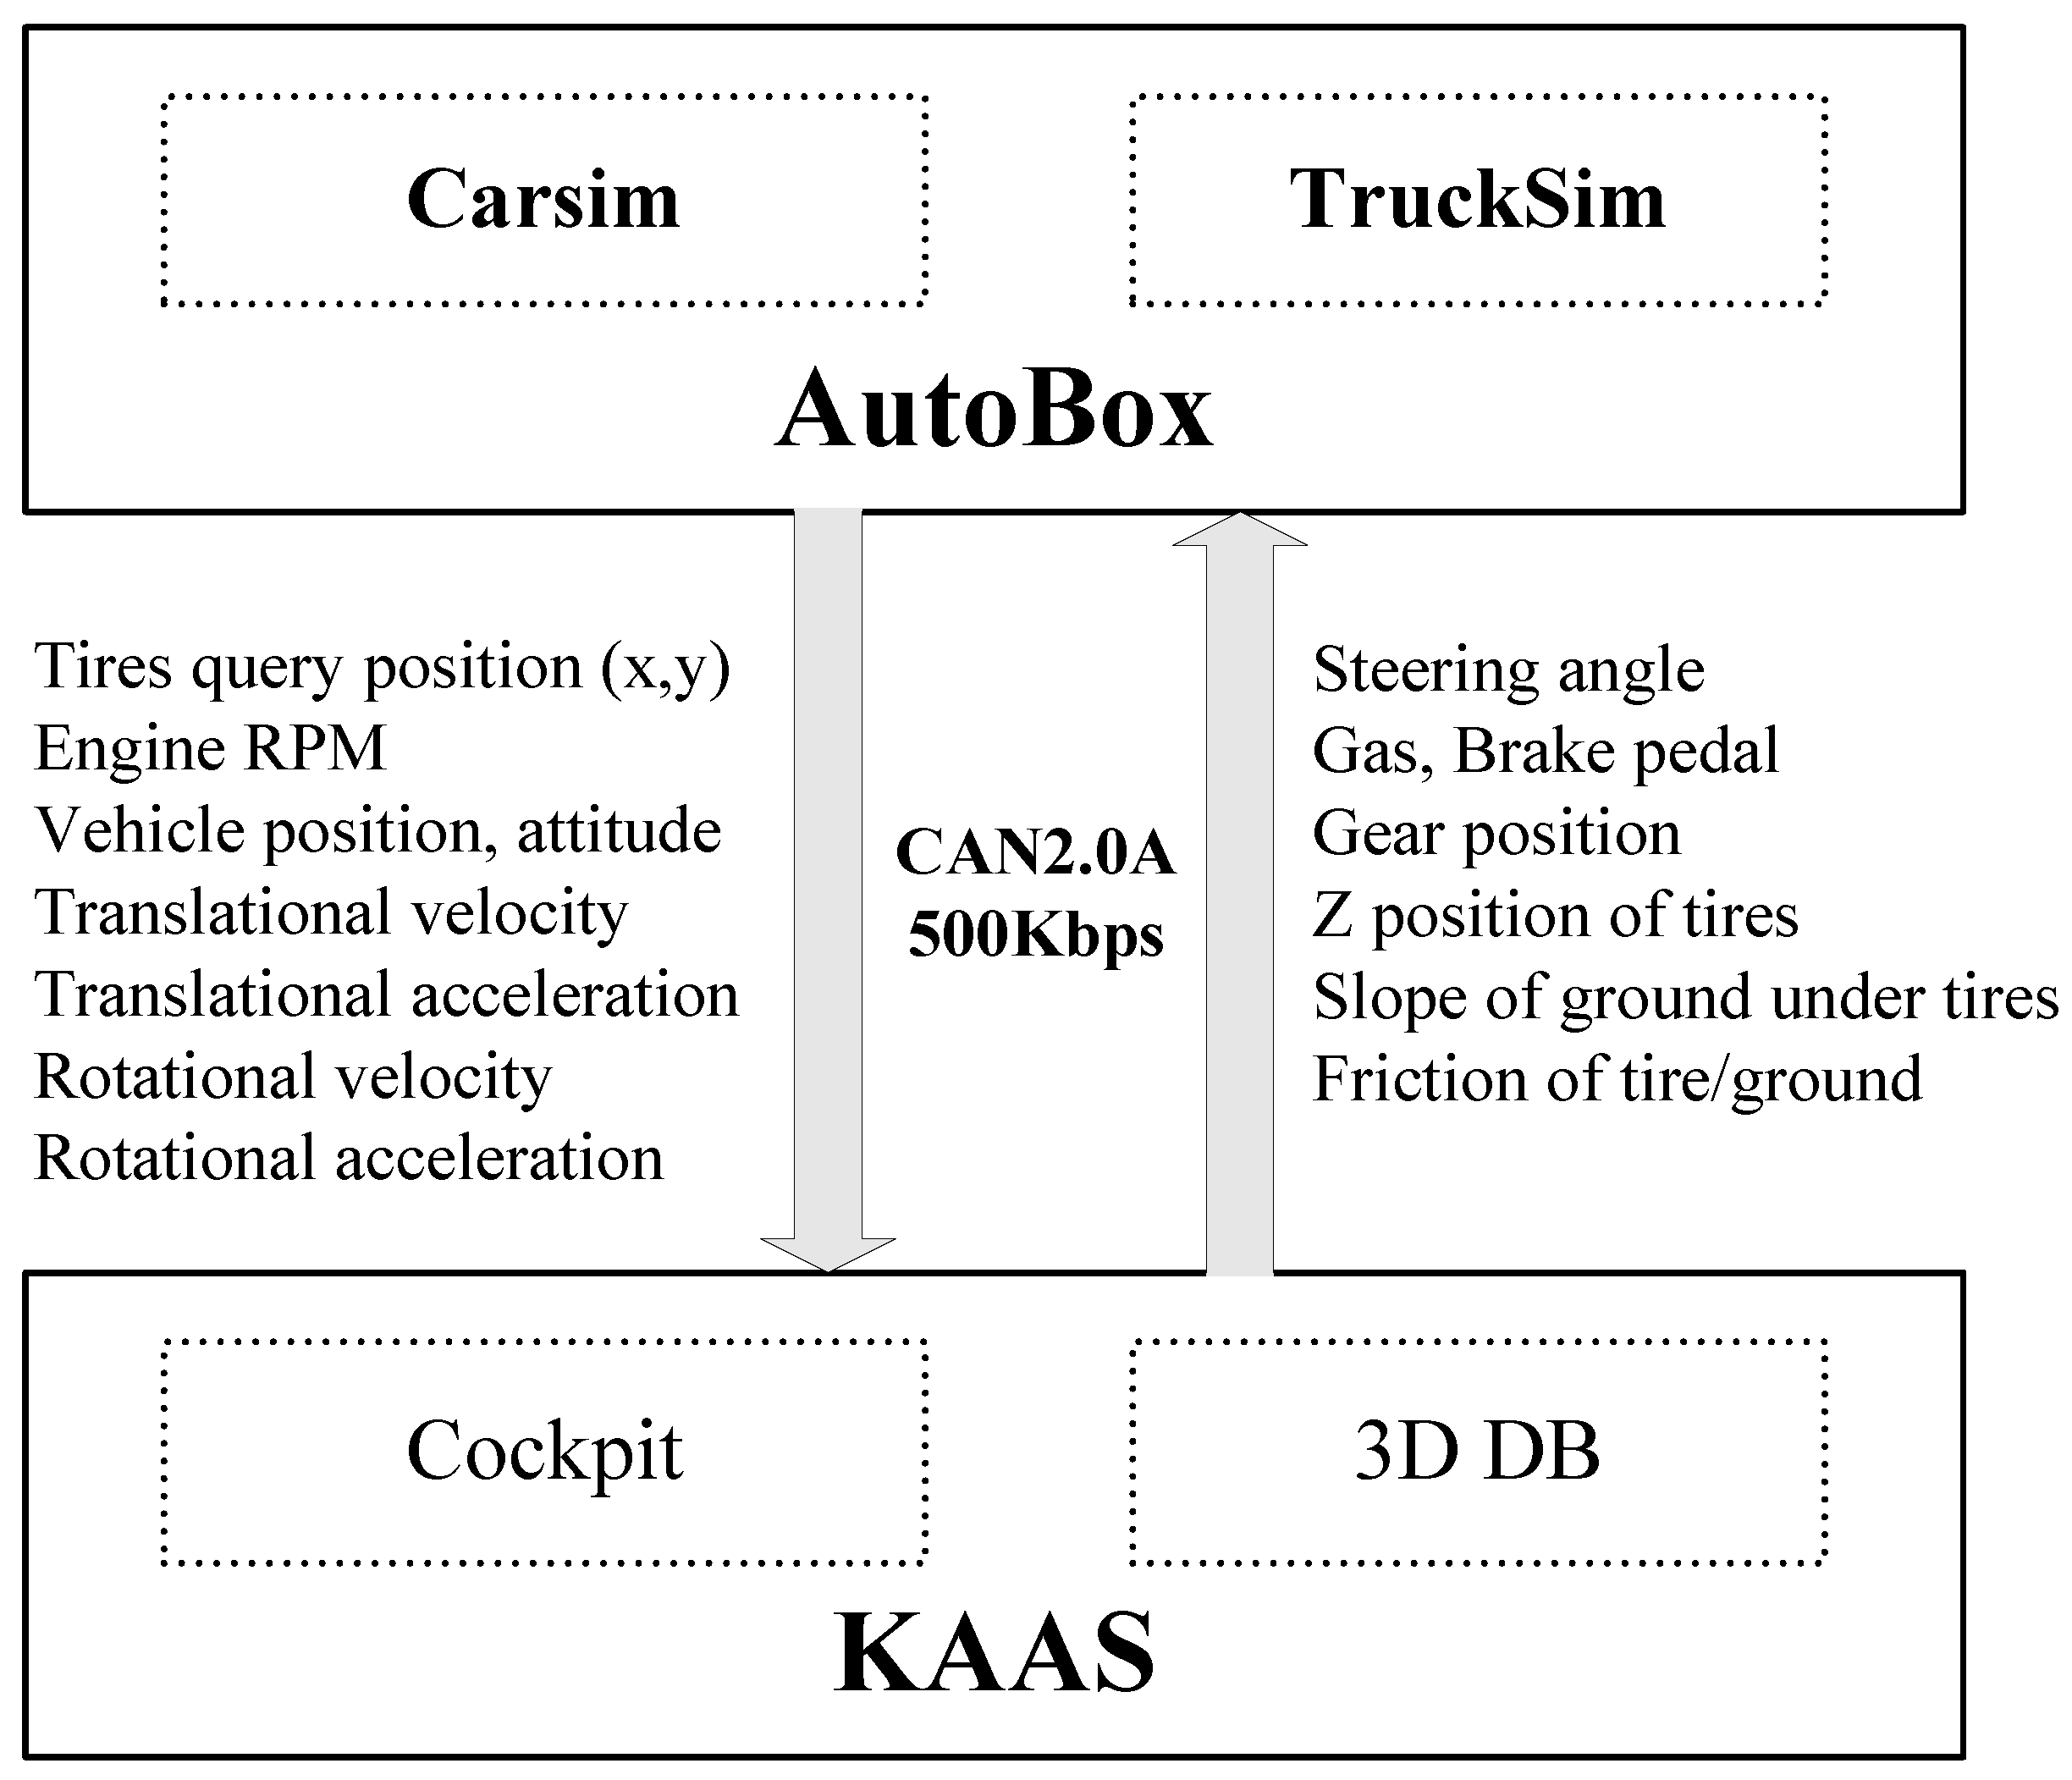
The commercial vehicle dynamics models are integrated with the KAAS. CARSIM and TRUCKSIM developed by the Mechanical Simulation Corporation are the popular commercial software packages that predict the performance of vehicles in response to various chassis controls related to steering, throttle, brakes, clutch and shifting in a given environment such as road geometry, coefficients of friction and wind.
To operate CARSIM and TRUCKSIM in the real-time mode, an AutoBox platform of the dSPACE Corporation is necessary. The KAAS communicates with CARSIM (TRUCKSIM) through CAN 2.0A (500 Kbps) interface of the AutoBox. Figure 9 shows data exchange for integrating the KAAS and CARSIM (TRUCKSIM).
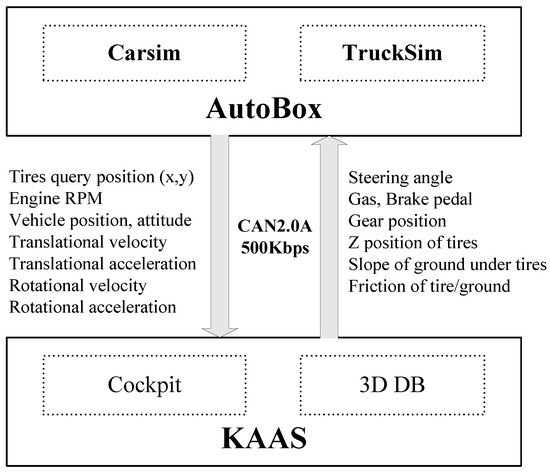
Figure 9.
Data communication between the KAAS and CARSIM (TRUCKSIM).
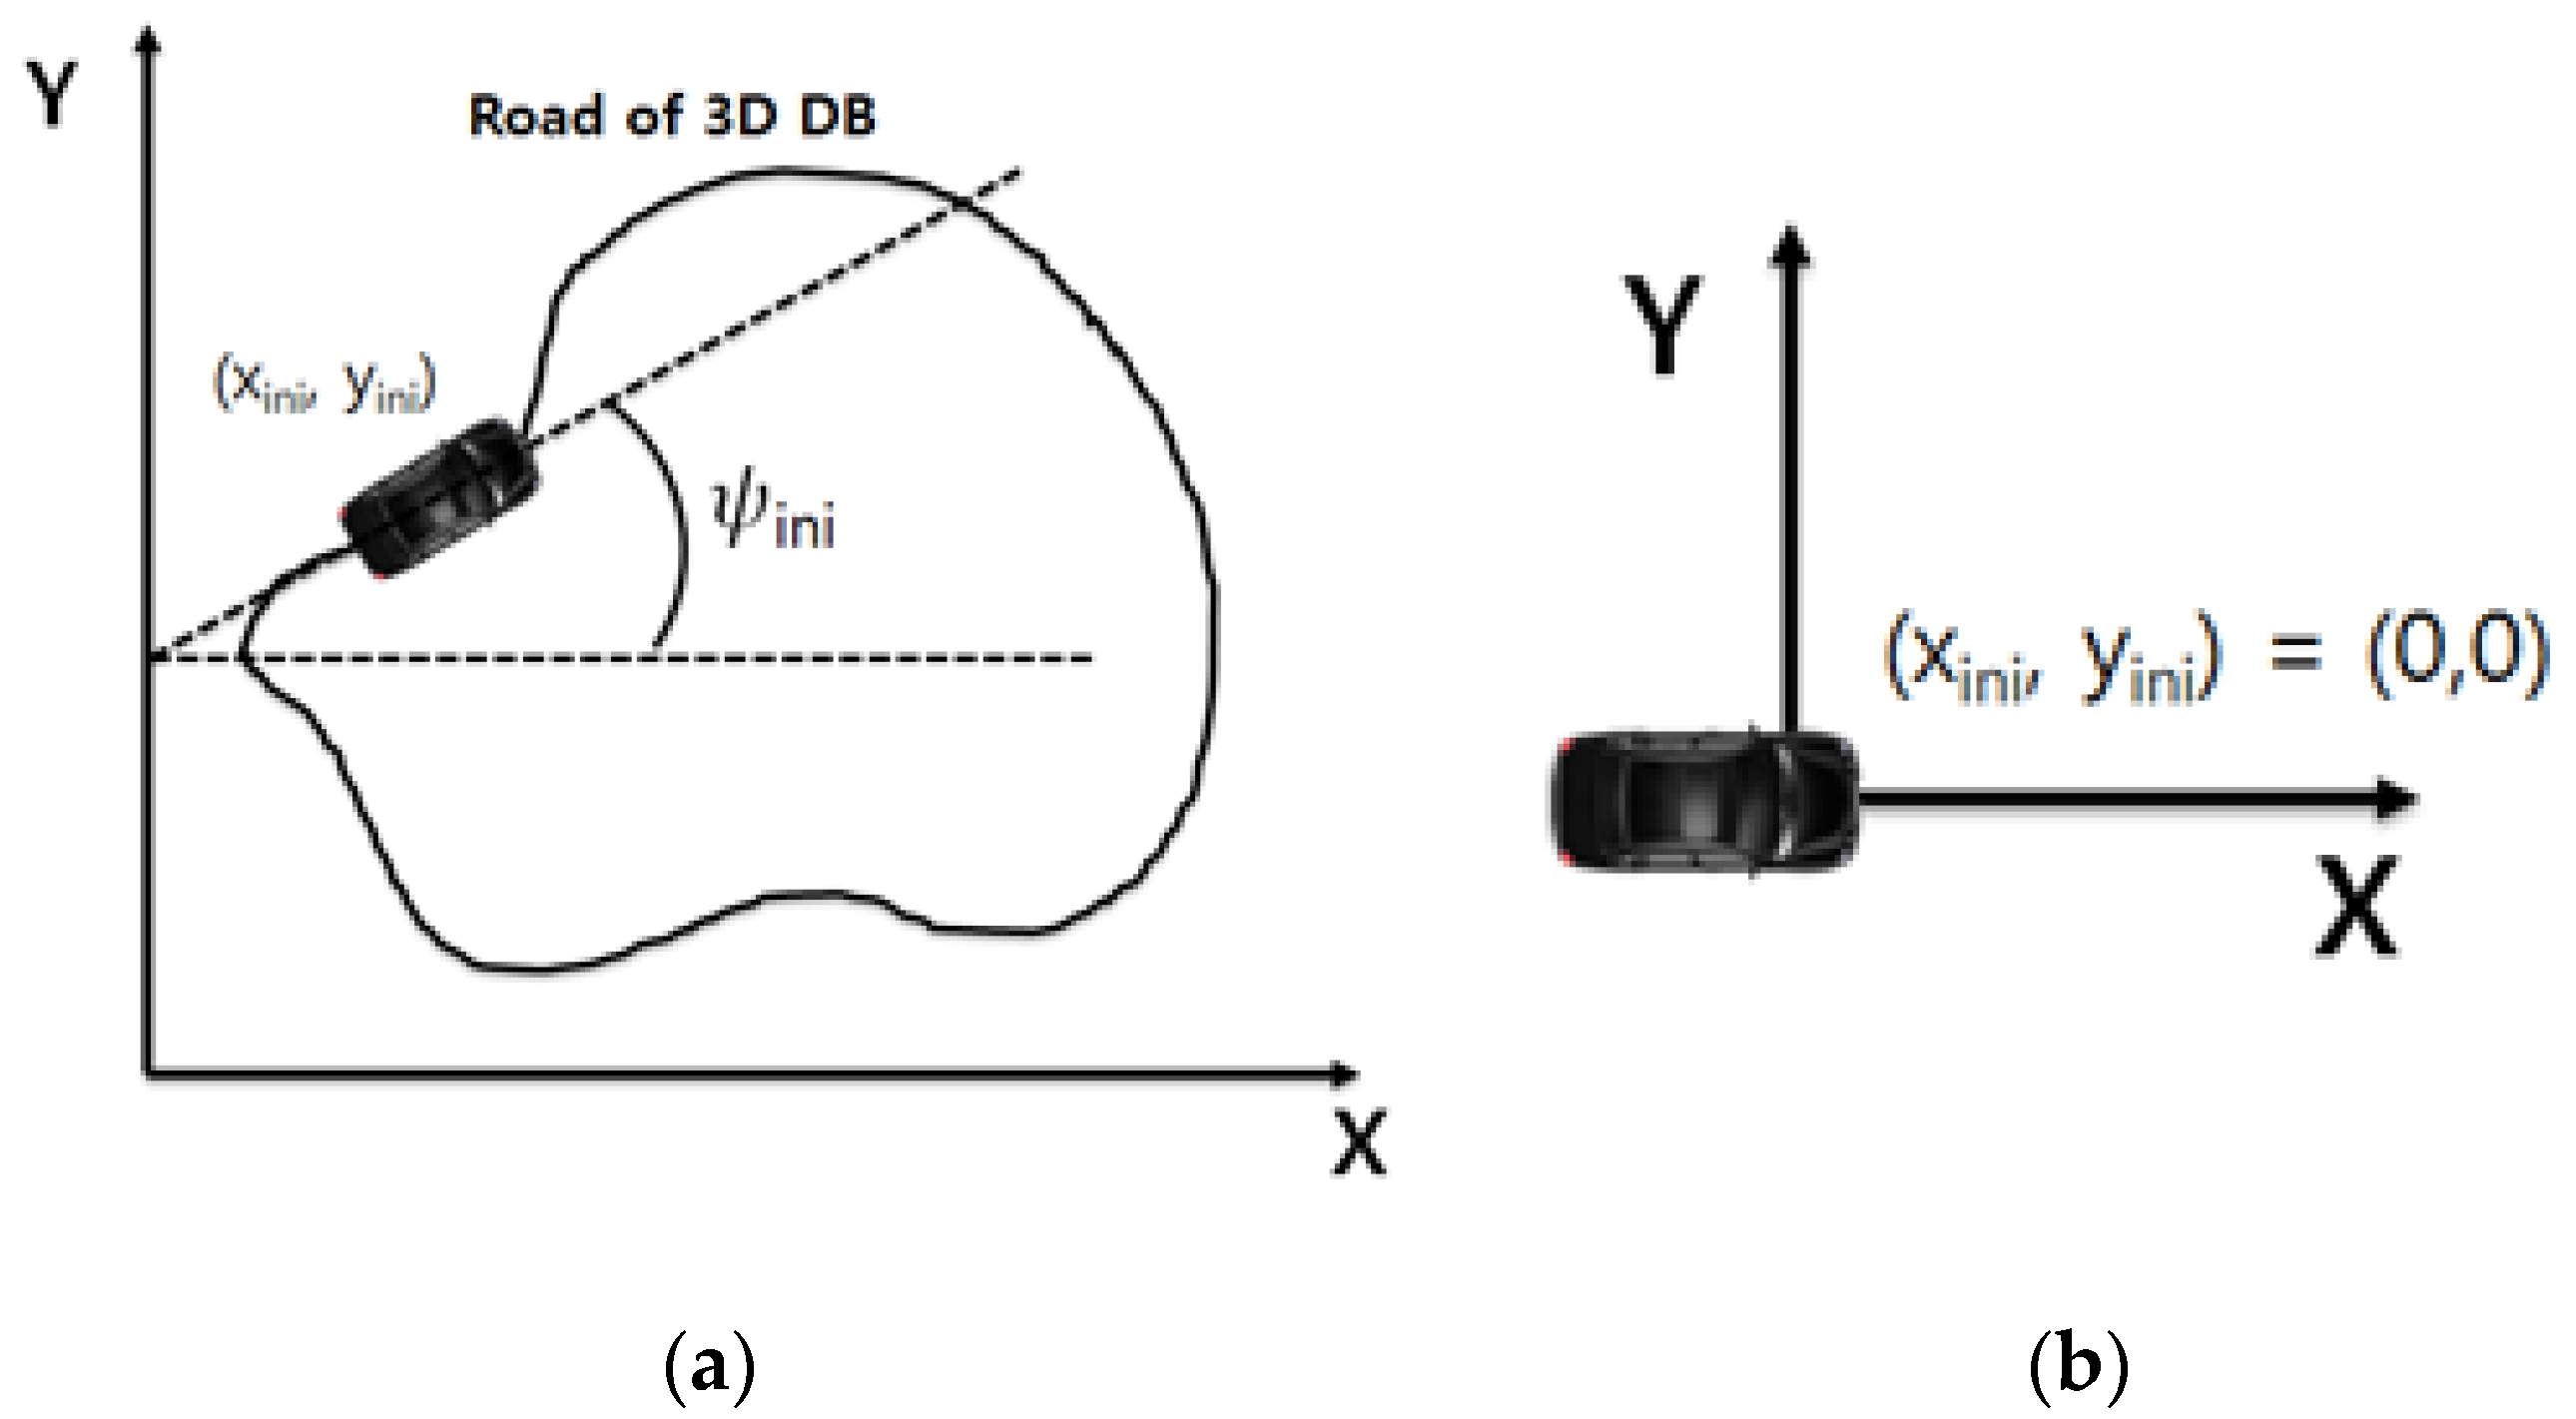
Because CARSIM (TRUCKSIM) and the KAAS use the different coordinate systems, the real-time coordinate transformation from CARSIM (TRUCKSIM) to the KAAS is required. At the start time of simulation, CARSIM (TRUCKSIM) vehicle is always located at origin point (0, 0) in its own coordinate system. The vehicle model of the KAAS can be located everywhere in 3D virtual space according to the setting of the KAAS operator. Therefore, the vehicle model of the KAAS has the initial heading angle and initial position data (xini, yini) with respect to the CARSIM (TRUCKSIM) coordinate system. Thus, these differences are compensated in the coordinate transformation. Figure 10 shows the coordinate systems of the KAAS and CARSIM (TRUCKSIM). The coordinate transformation is represented by the following equations.
where is the vehicle position in the KAAS coordinate system, is the initial vehicle position (constant value) in the KAAS coordinate system, is the initial heading angle of the vehicle in the KAAS coordinate system and is the vehicle position in the CARSIM (TRUCKSIM) coordinate system.
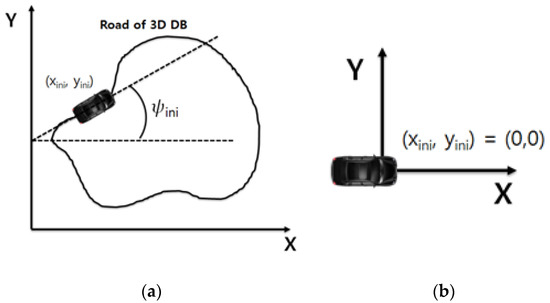
Figure 10.
Coordinate systems of (a) the KAAS and (b) CARSIM (TRUCKSIM).
4.2. Human Sensation Model
Humans feel translational motion by detecting specific forces in their otolith and rotational motion by detecting rotational angular acceleration in vestibular [3,4,5,17]. The specific force detected in an otolith is obtained by subtracting acceleration of gravity from translational acceleration, such as
where is translational acceleration, and is the acceleration of gravity.
Human sensory organ is modeled with a spring-mass-damper system. The transfer function of the otolith system [3,4,5,17] is written in
where are, respectively, a long-time constant, short-time constant of the otolith and the time constant related to phase caused by the communication process in the nervous system. The characteristic of frequency response has good perception in the band of 0.01~0.5 Hz. Table 2 shows the parameters of the otolith model [3,4,5,17].
Table 2.
Parameters of the otolith model.
The transfer function of the vestibular system [3,4,5,6,18] is expressed as follows.
where and are, respectively, a long-time constant, a short-time constant of the vestibular and the time constant related to the phase caused by the communication process in a nervous system. The characteristic of frequency response has good perception in the band of 0.01~0.5 Hz. The parameters of the vestibular model [3,4,5,17] are shown in Table 3.
Table 3.
Parameters of the vestibular model.
The motion sensation, which is recognized from otolith and vestibular perception model without any signal processing, such as in the washout algorithm, can be assumed it is the same as the motion sensation of the actual vehicle. The specific force, in Equation (14), can be transformed into the following equation in the coordinate system at the center of the seat.
where is translational acceleration in a driver’s seat coordinate system, and is the acceleration of gravity in a driver’s seat coordinate system.
The specific force in a driver’s seat coordinate system [3,4,5,6] is defined as
4.3. Results of Simulation
For the performance evaluation of the proposed washout algorithm, simulation was performed based on the human sensation model. The simulation used the vehicle dynamic data generated in situations such as left/right, uphill/downhill, slalom and rapid acceleration and deceleration driving and the cutoff frequency of both the high-frequency and low-frequency filters is 0.01 Hz and the calculation period is 2 ms. The reason why the cutoff frequency is set to 0.01 Hz is that the response characteristics of the human sensation model function are best between 0.01 Hz and 0.1 Hz. Figure 11, Figure 12 and Figure 13 show simulation configurations to derive the motion sensation of the real vehicle, the motion sensation of the classical washout algorithm and the motion sensation of the proposed washout algorithm, respectively. The input data required for the simulation are generated by KAAS (KATECH Automotive Driving Simulator), a vehicle driving simulator developed by KATECH (Korea Automotive Technology Institute) [4,5].
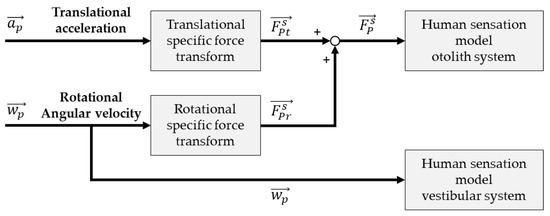
Figure 11.
Simulation diagram for the motion sensation in actual vehicle.
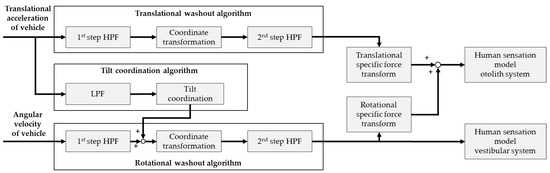
Figure 12.
Simulation diagram for the motion sensation by the classical washout algorithm.
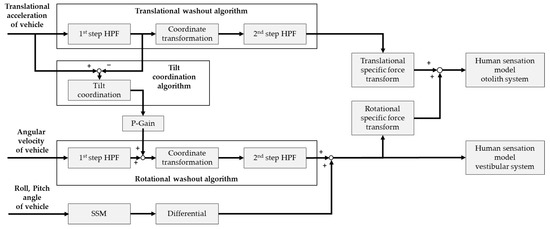
Figure 13.
Simulation diagram for the motion sensation by the proposed washout algorithm.
Table 4 represents correlation coefficient between the motion sensation of the actual vehicle and motion sensation of classical washout algorithm and proposed washout algorithm. The closer the correlation coefficient value is to one, the more similar it can be to the actual motion sensation.
Table 4.
Correlation coefficient with motion sensation of the real vehicle.
The specific gravity gain was set to 0.6 and 0.9, and the simulation is performed with various values up to 0.2, 0.5, 0.7 and 1 for the scale parameter k of the subregion scale method. In most situations, it can be seen that the sense of motion is improved compared to the classical washout algorithm, and in particular, performance of the rotational motion sensation of the new tilt coordination algorithm can be improved by applying the specific force gain and subregion scale method. That is, while improving the translational motion sensation, it is possible to guarantee a certain level of rotational motion sensation.
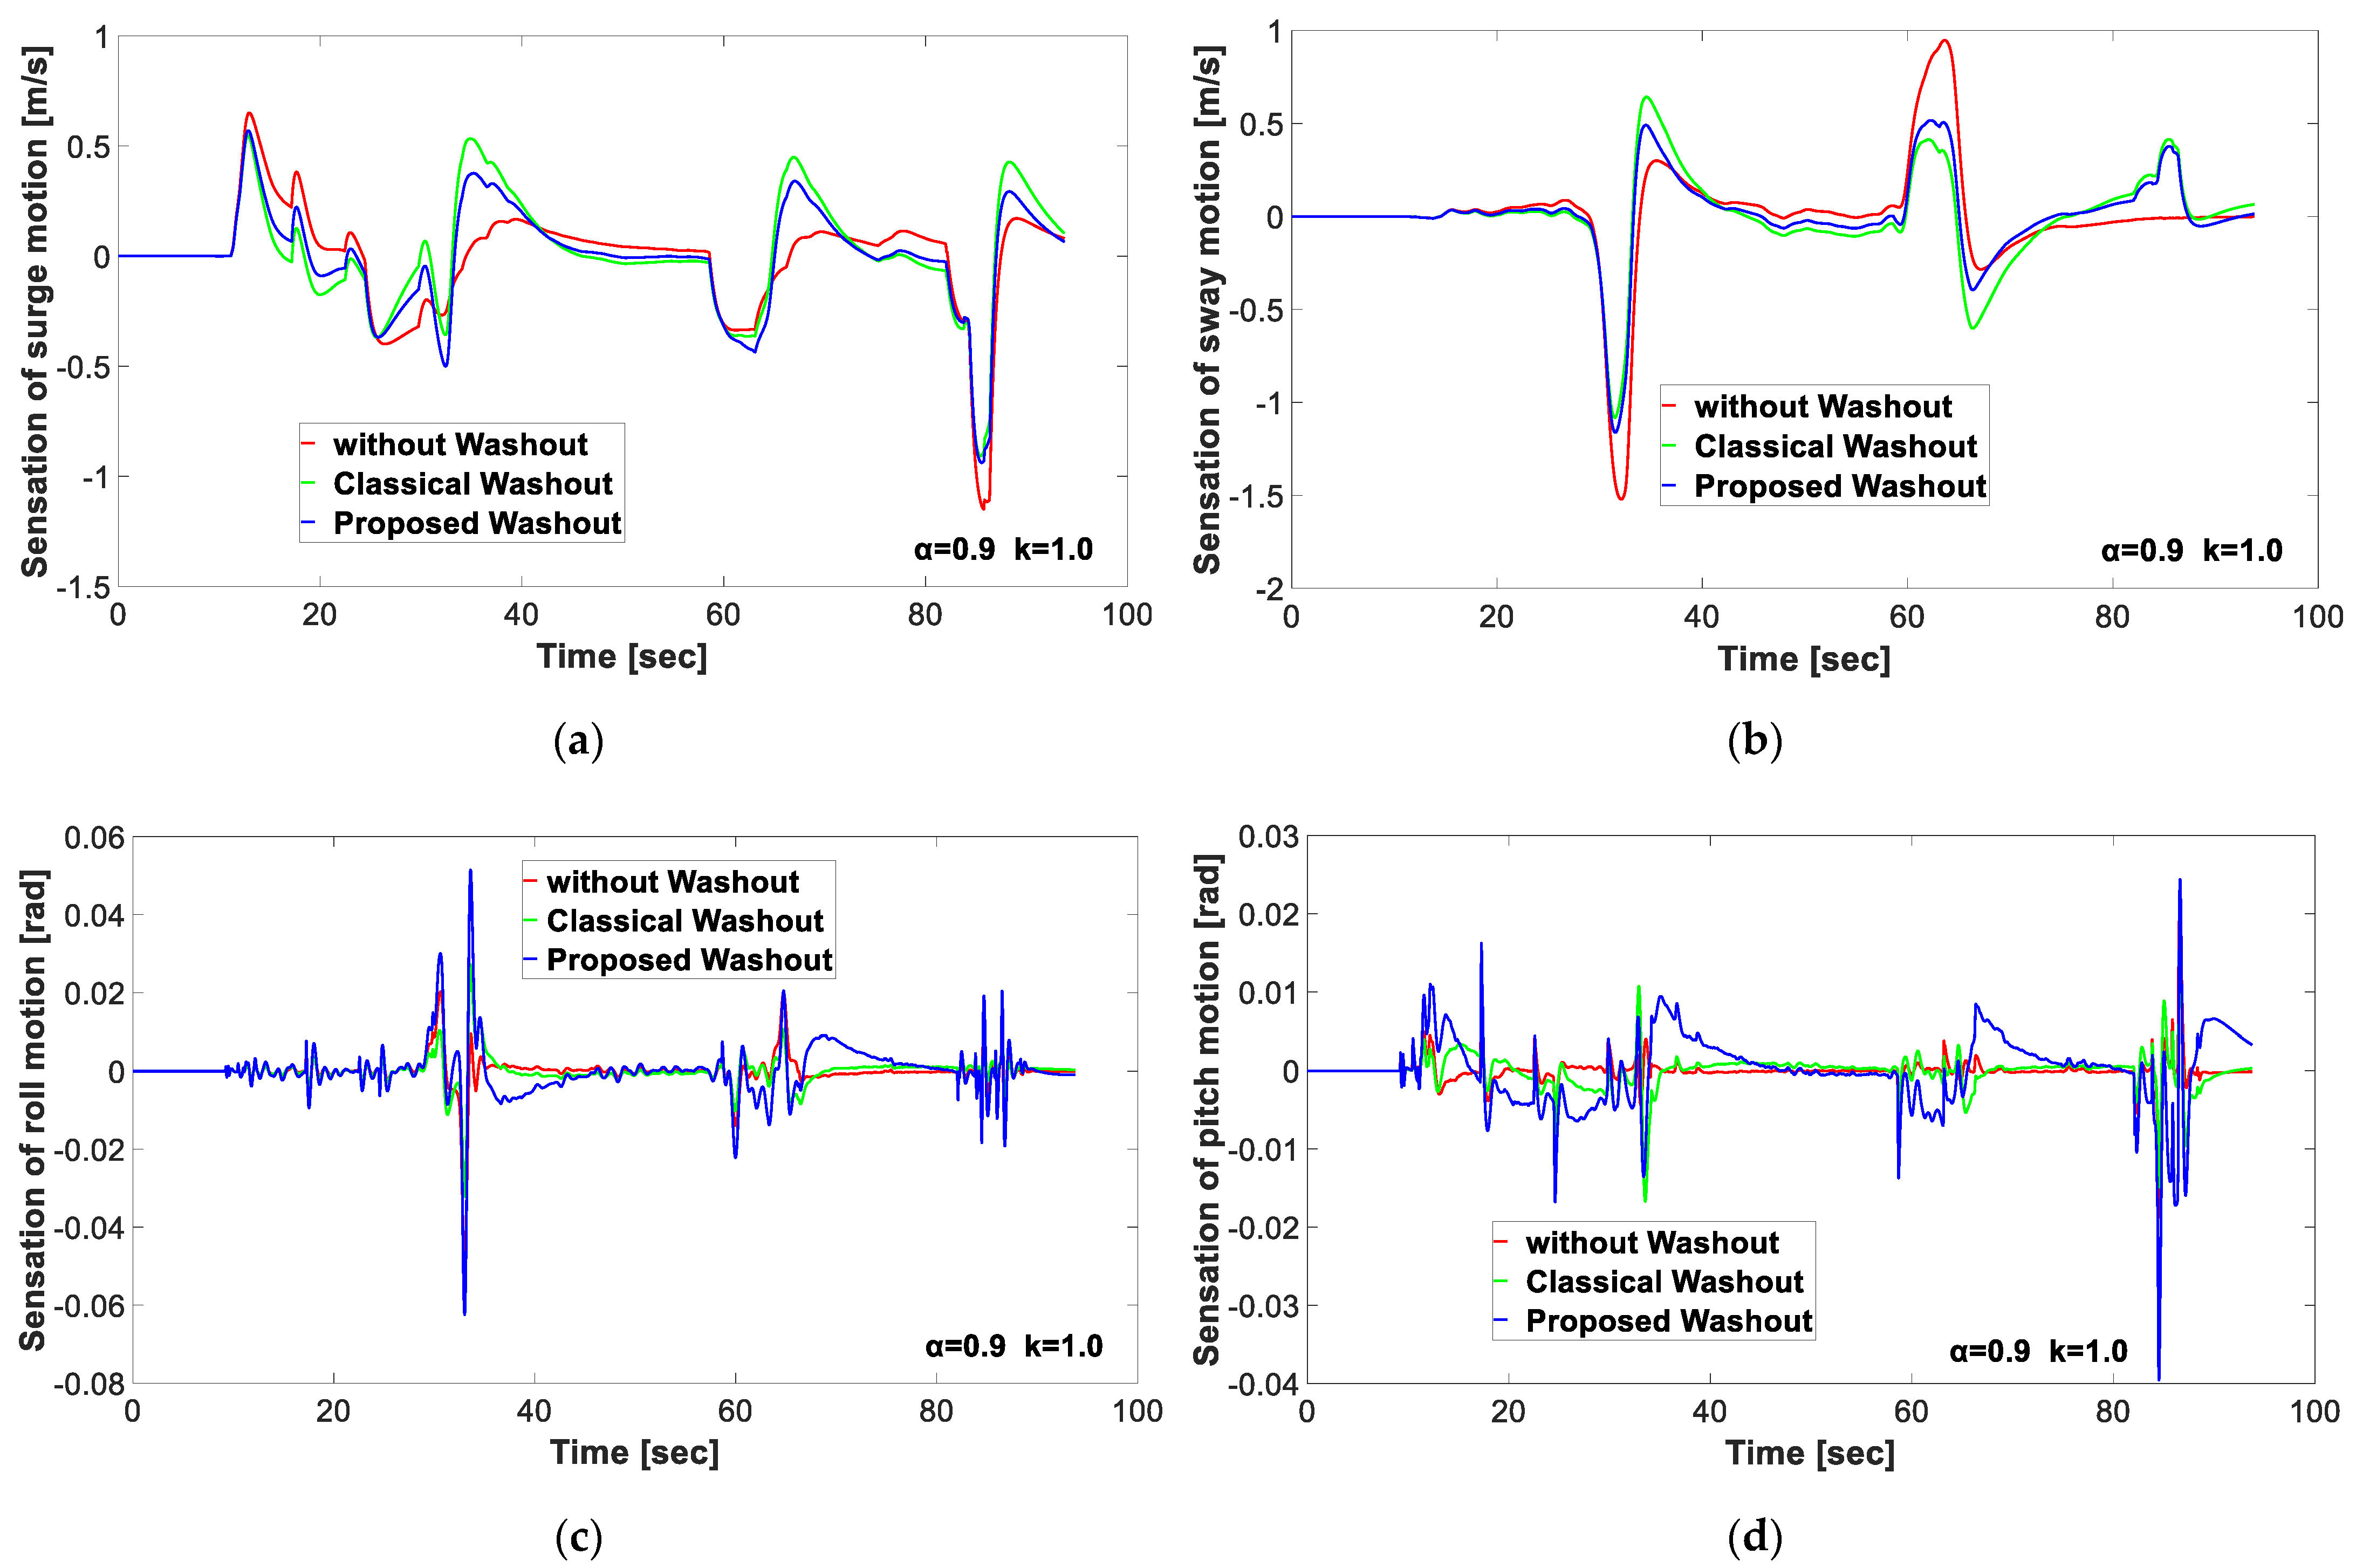
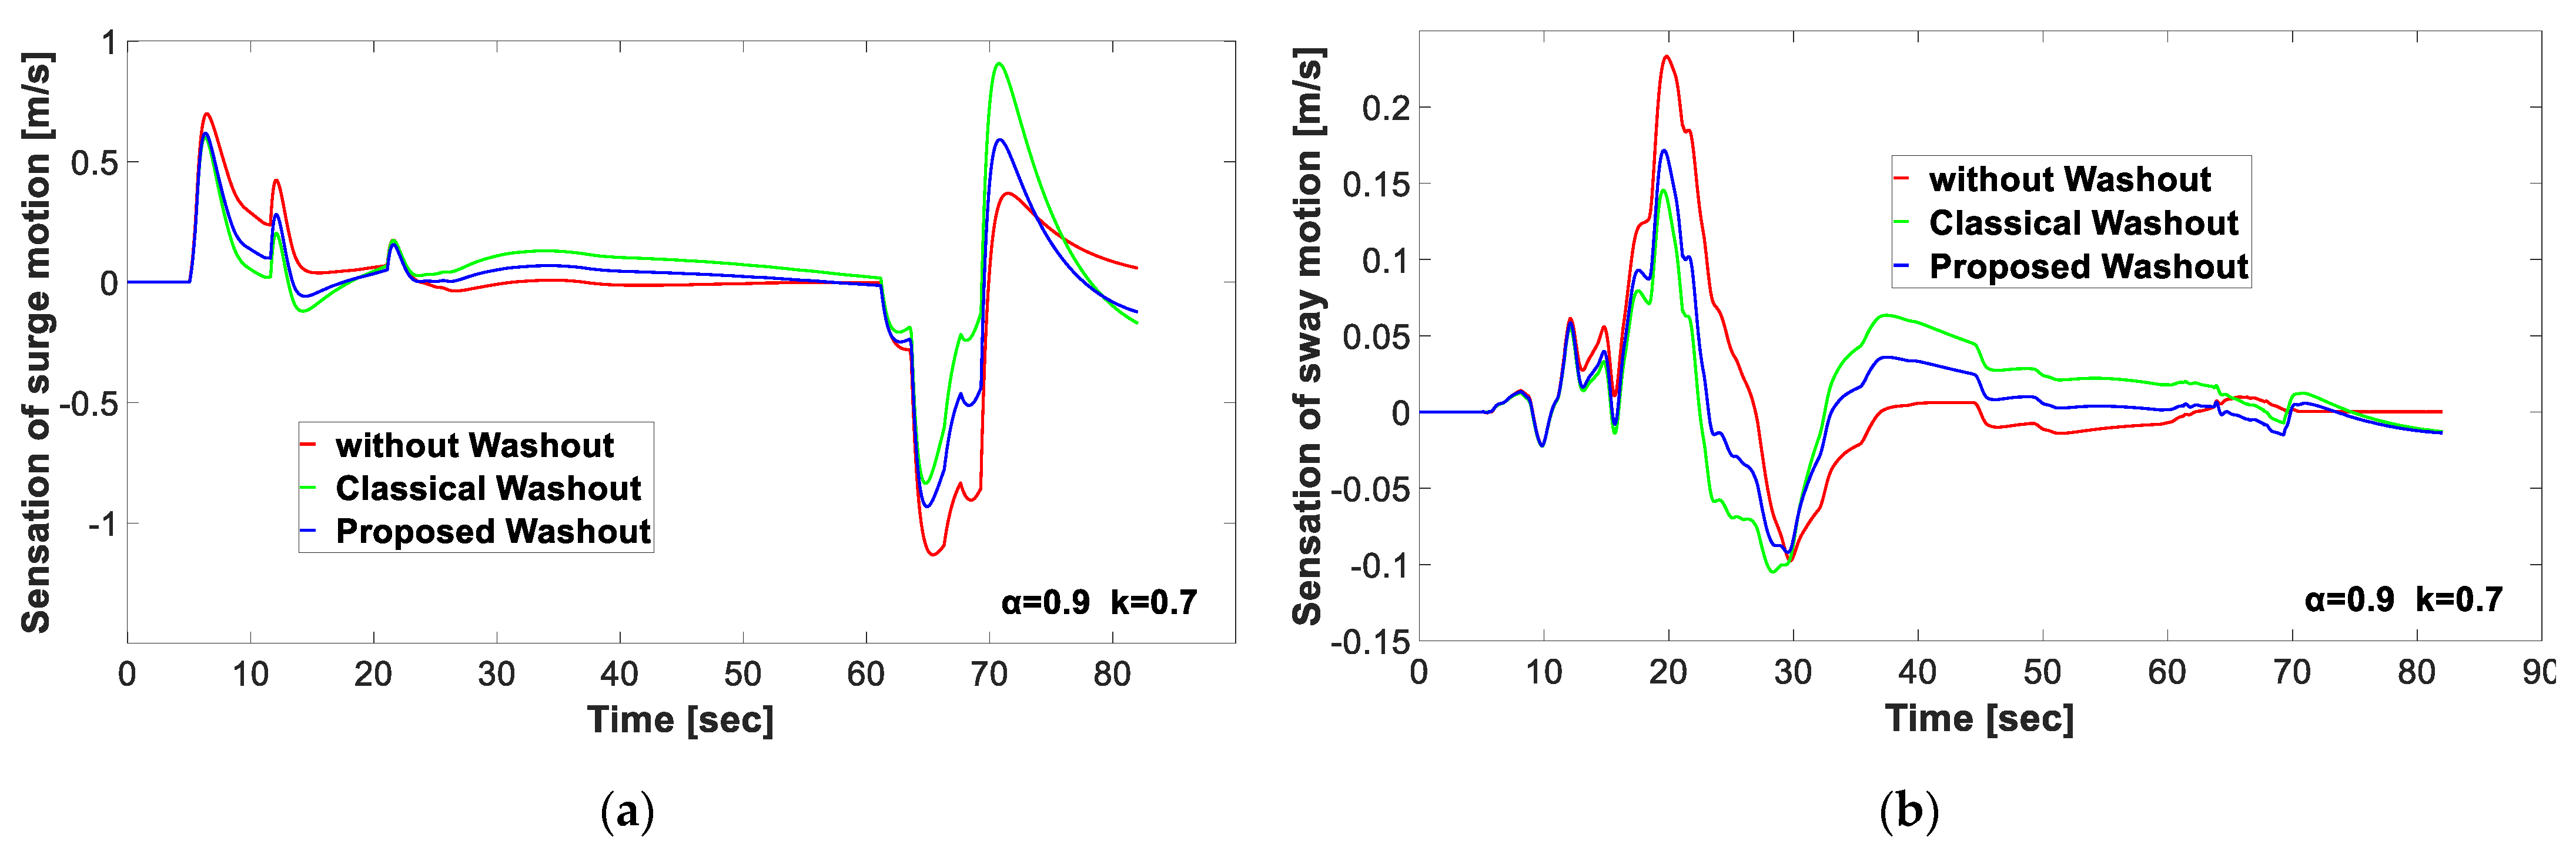
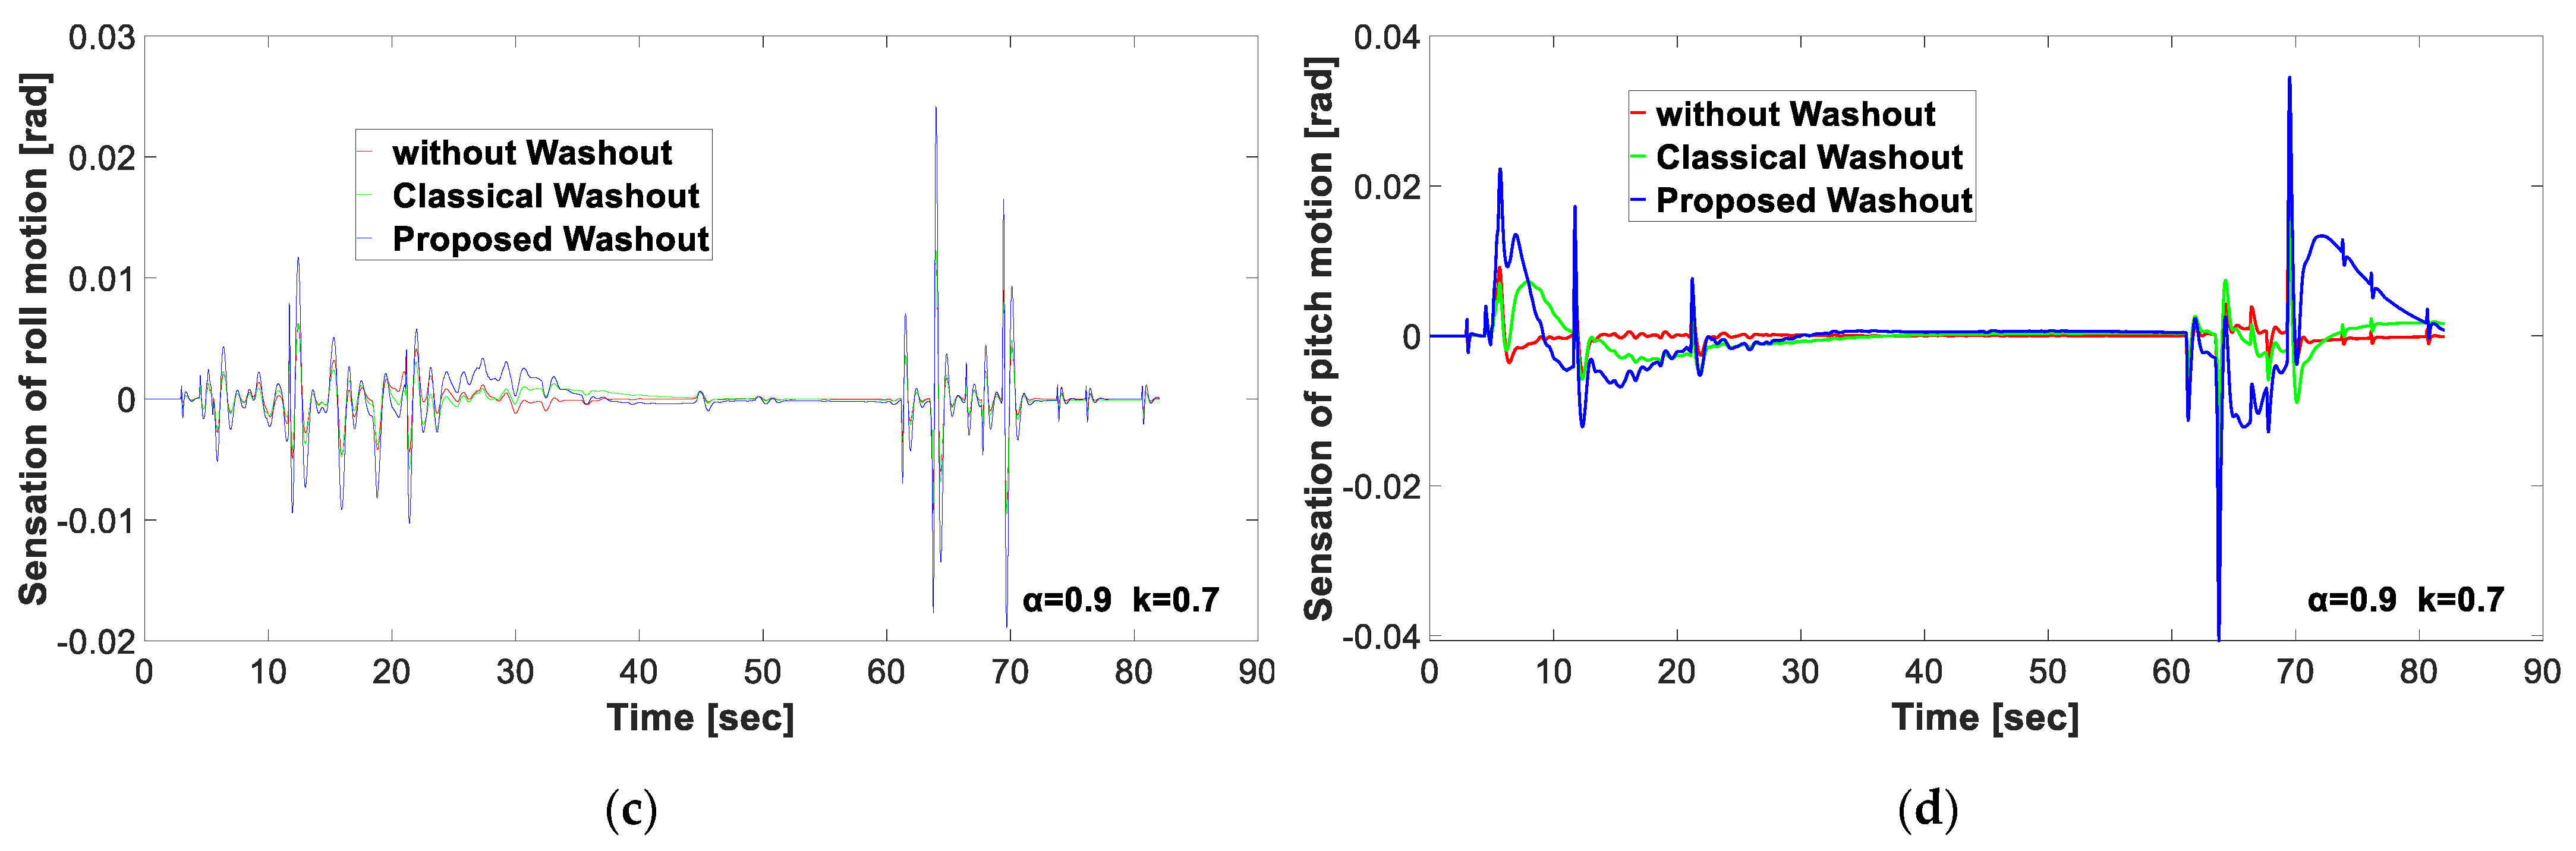
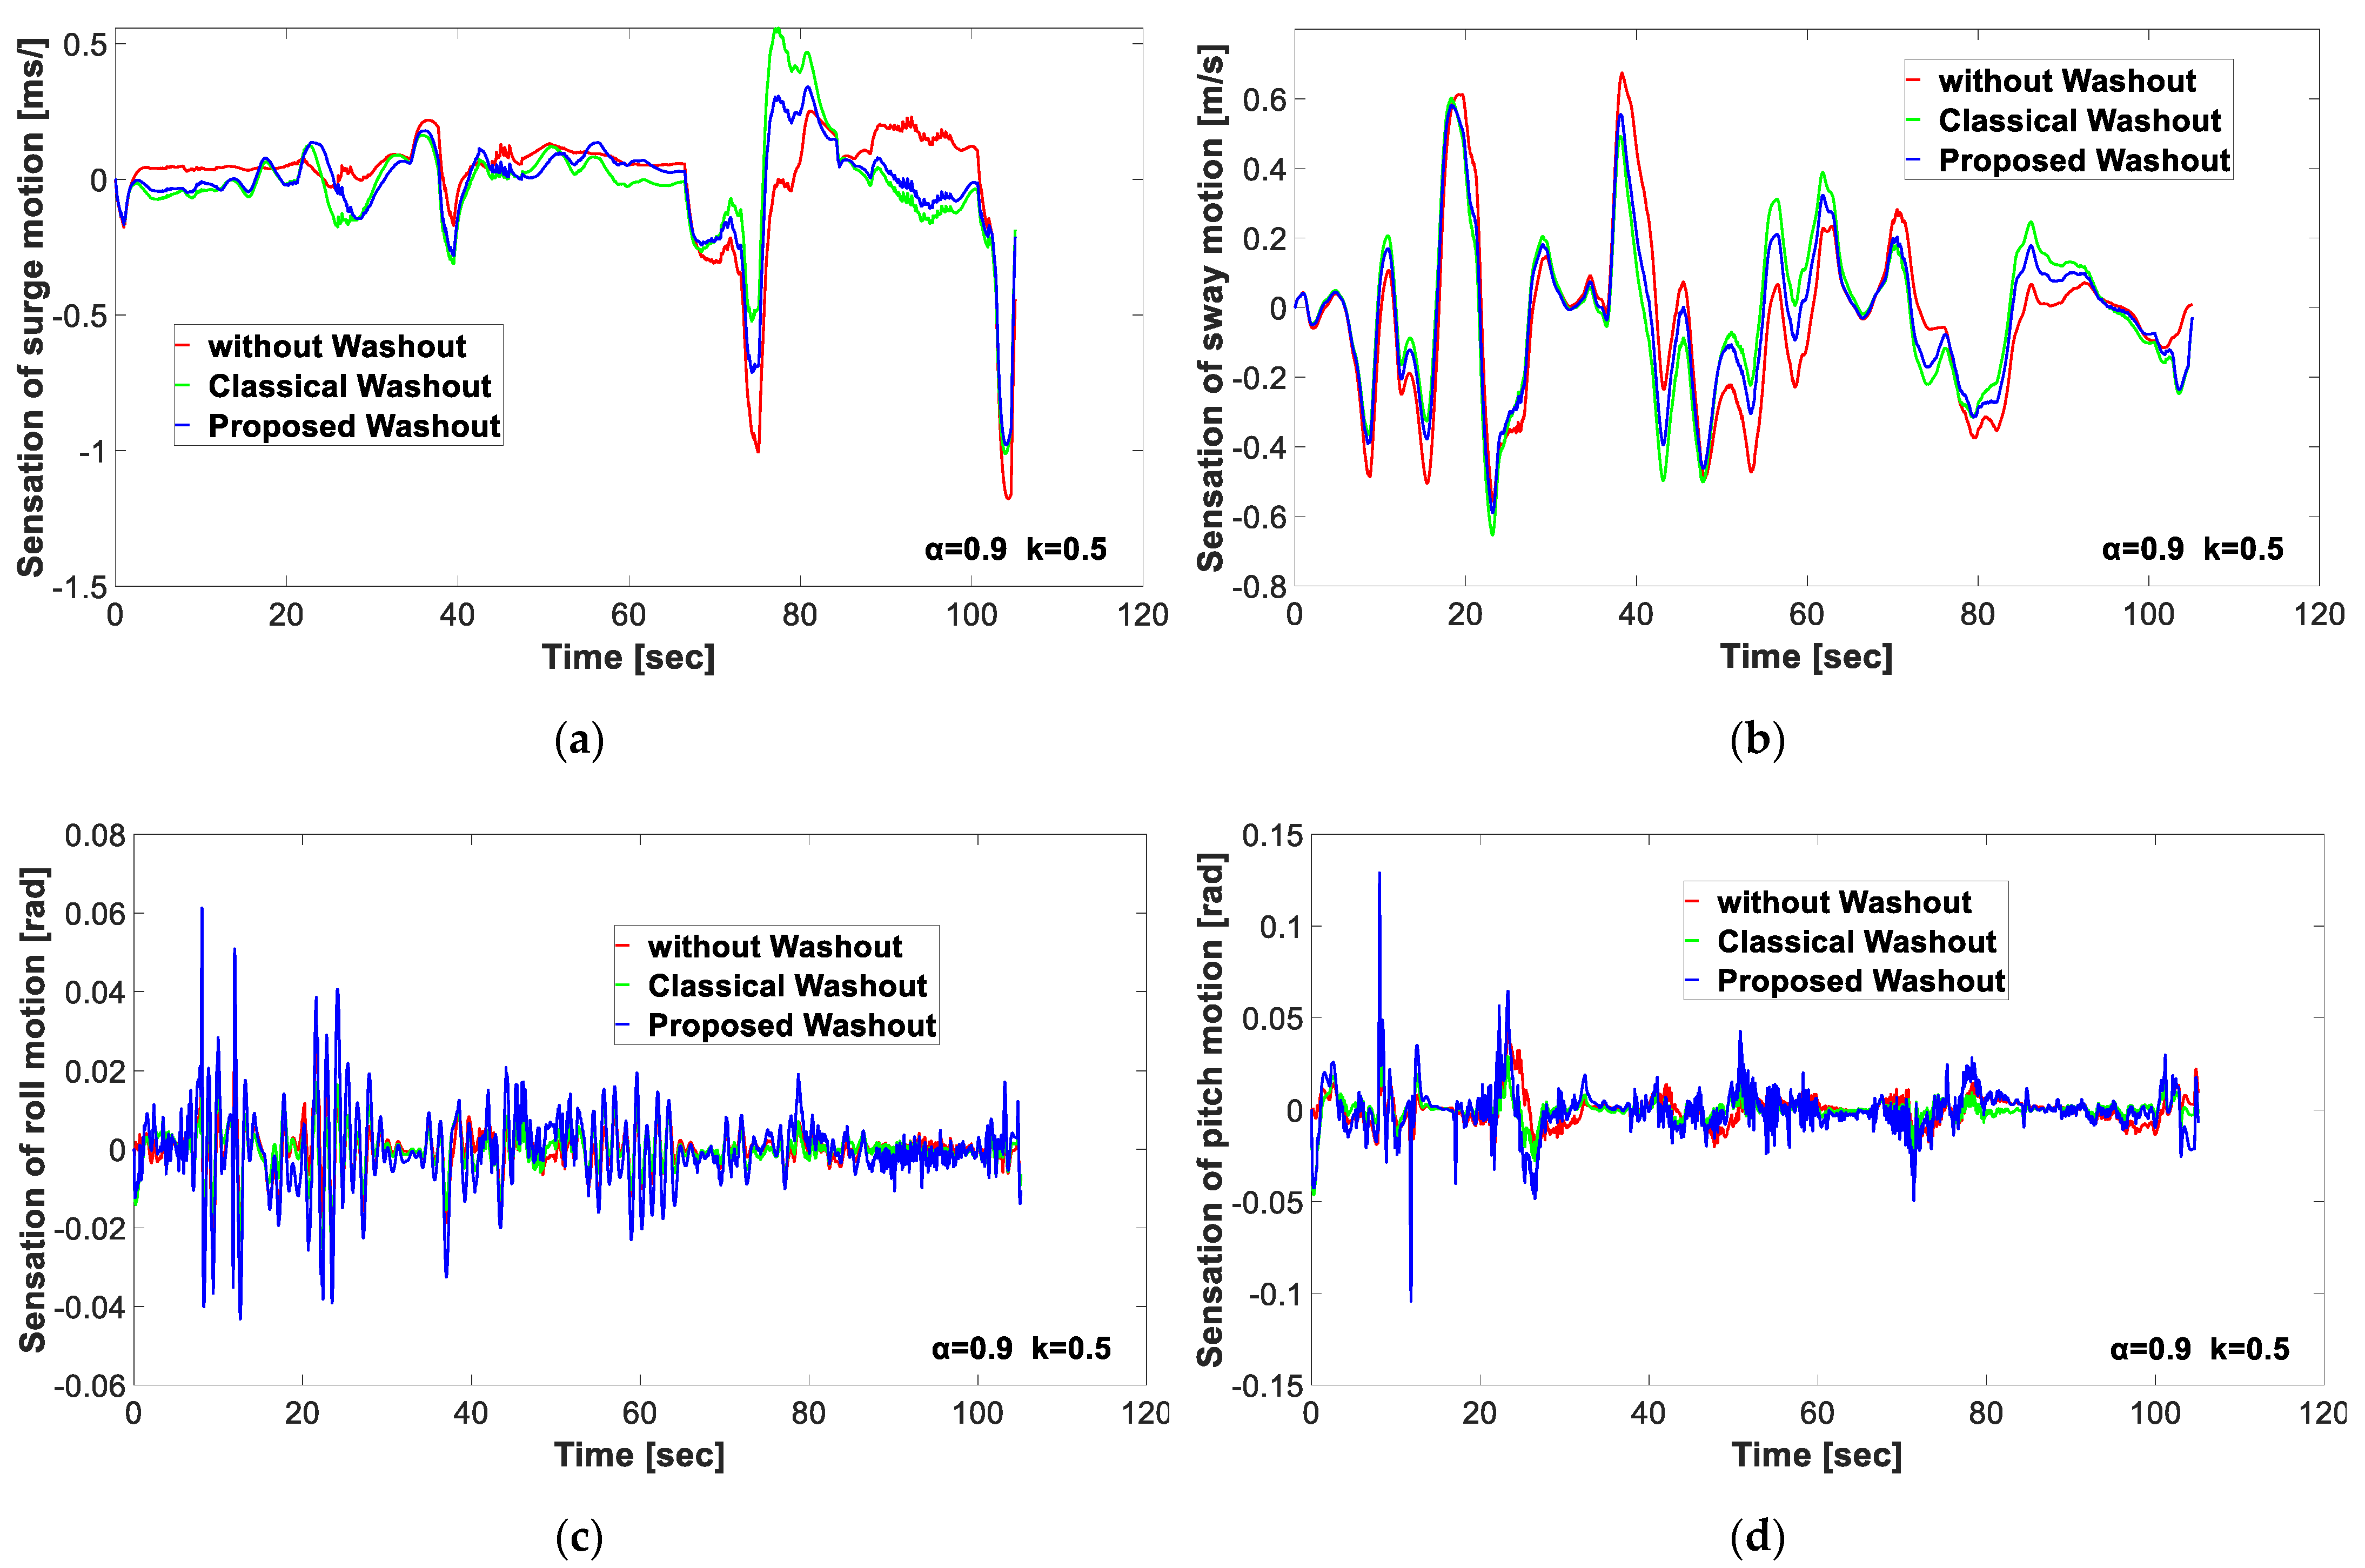
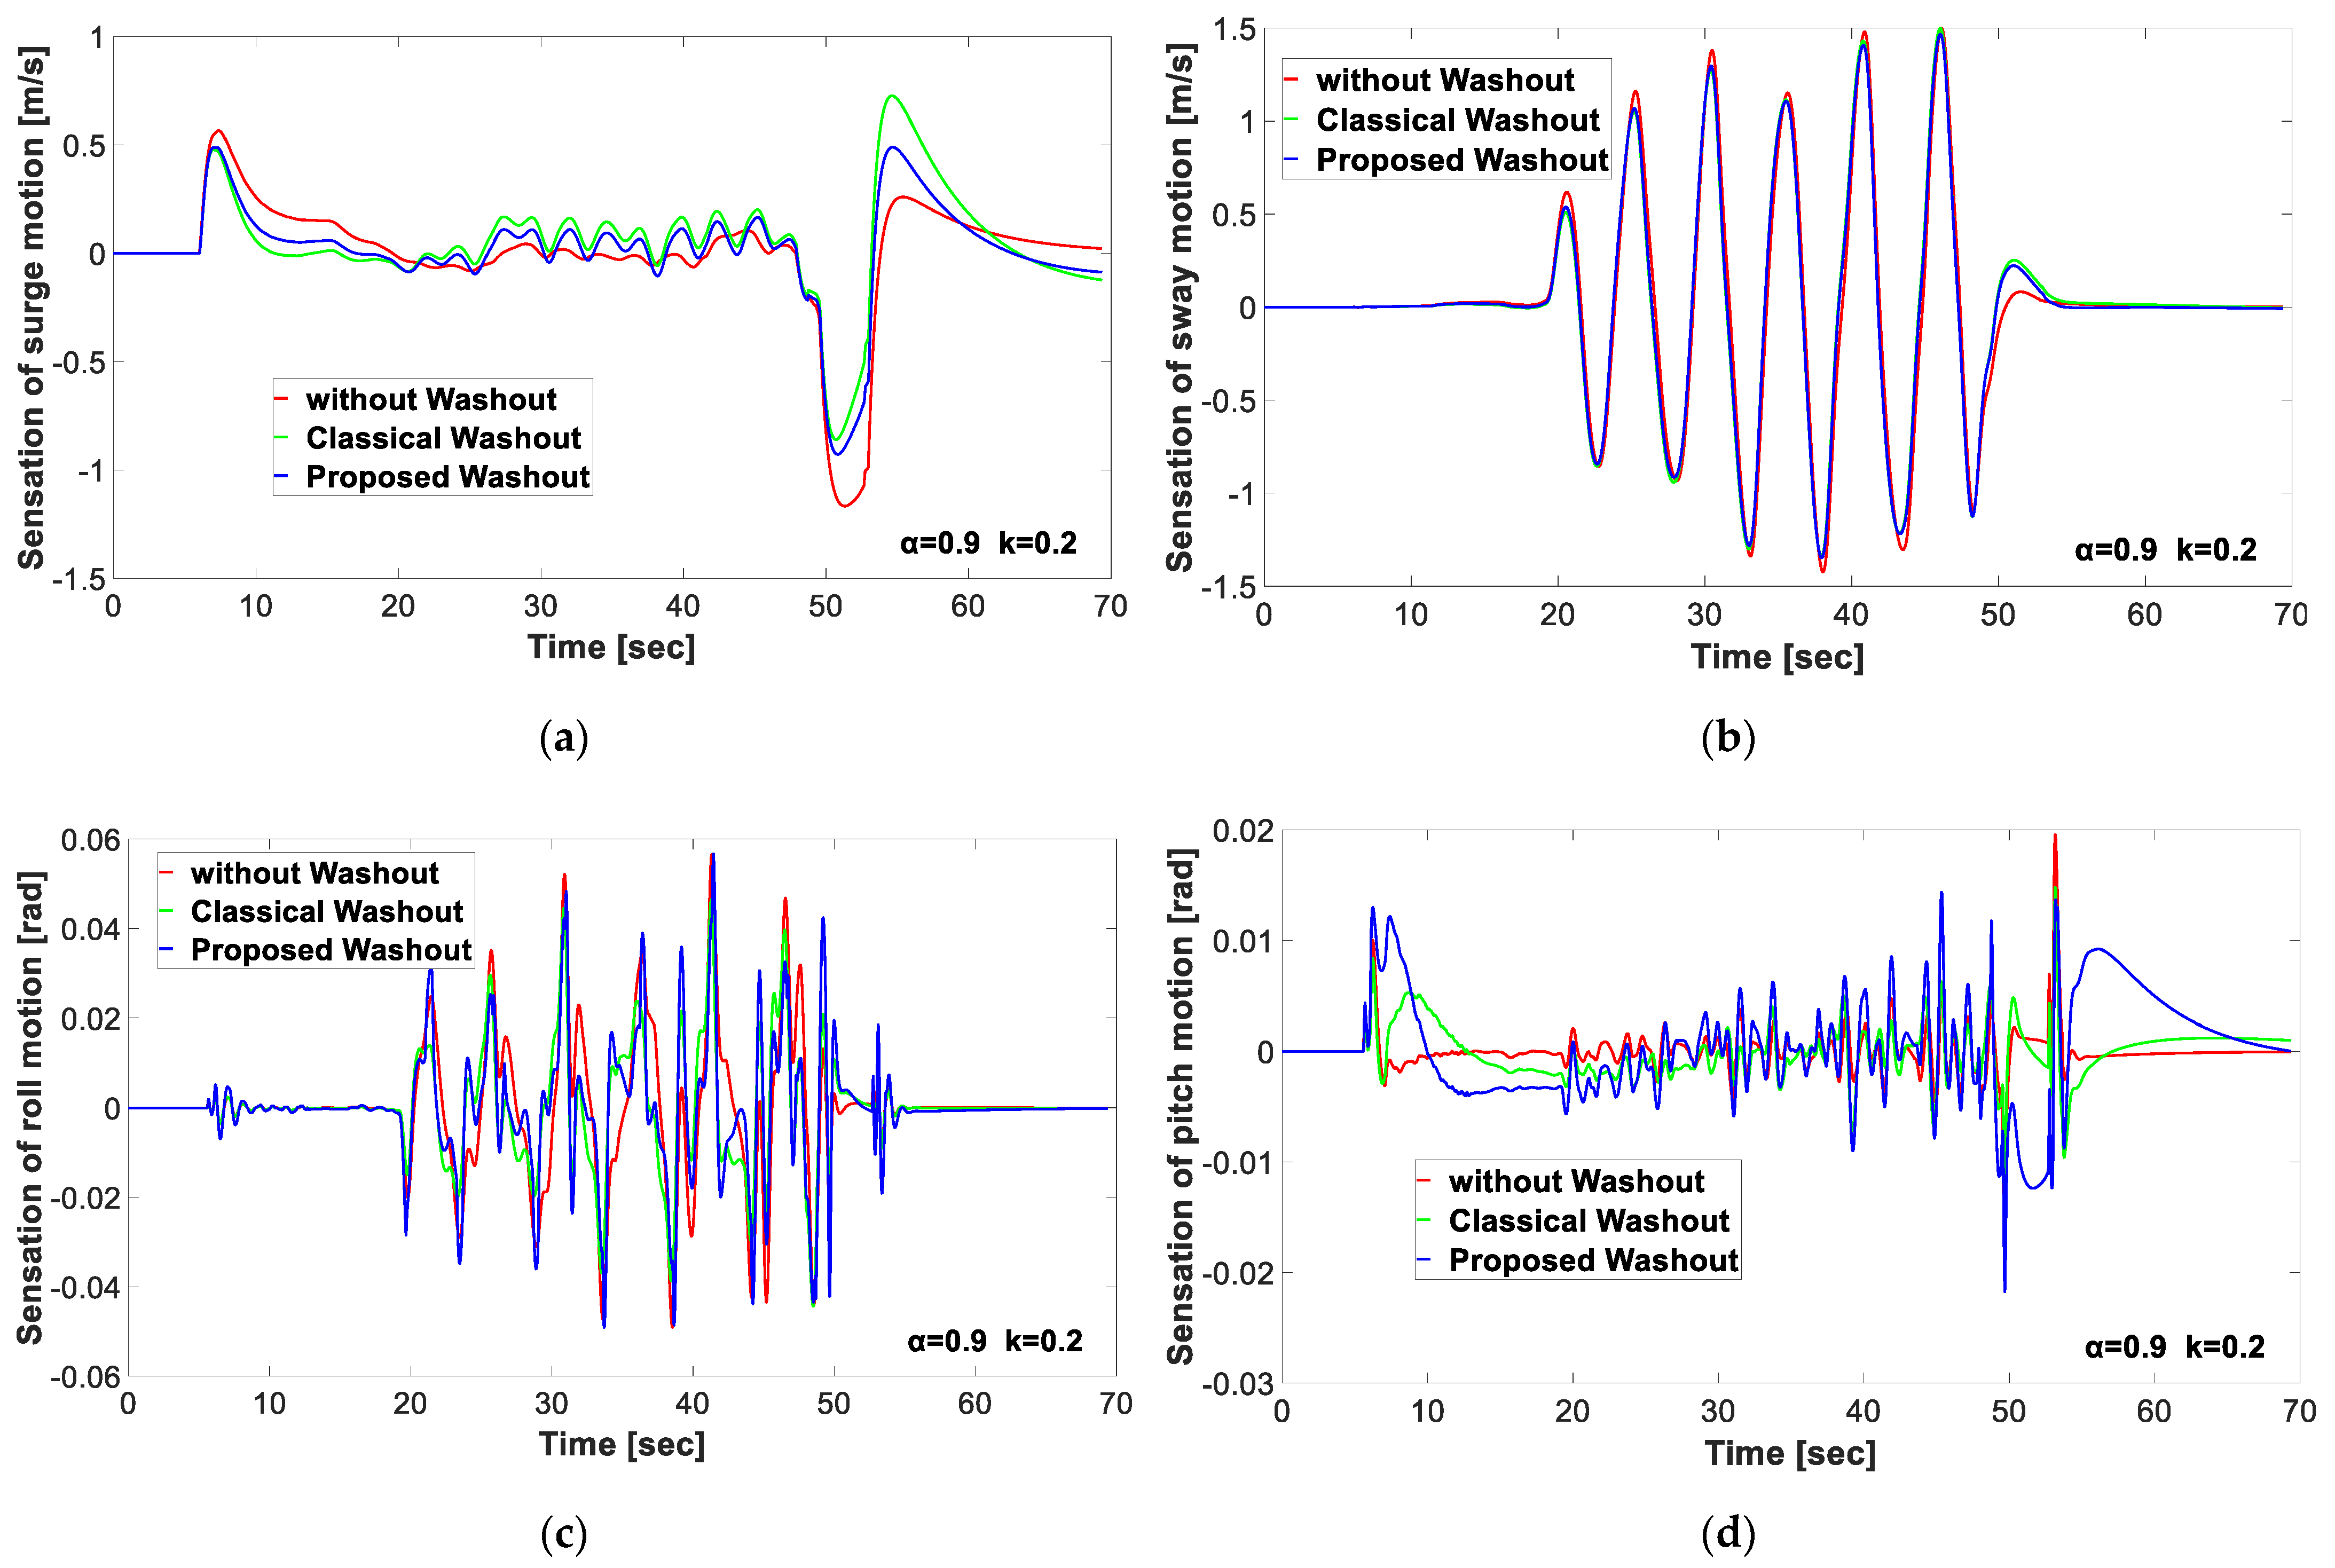
Figure 14, Figure 15, Figure 16 and Figure 17 are graphs that express the sense of translation and rotation of the x and y axes in the case of left and right turn driving, rapid acceleration and deceleration driving, slope road driving and slalom driving, respectively. The black line represents the motion sensation felt by the actual vehicle, the green line represents the classical washout algorithm and the blue line represents the proposed washout algorithm.
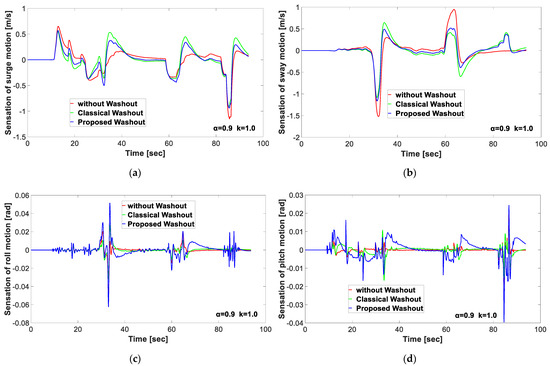
Figure 14.
Motion sensation in the case of left–right turn driving. (a) Motion sensation of surge direction. (b) Motion sensation of sway direction. (c) Motion sensation of roll direction. (d) Motion sensation of pitch direction.
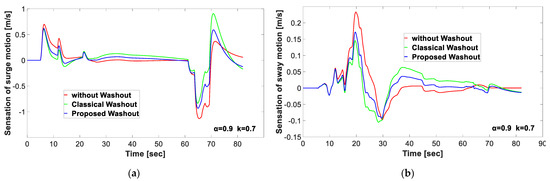
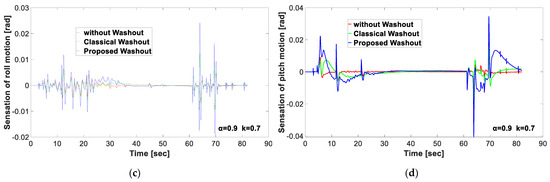
Figure 15.
Motion sensation in the case of rapid acceleration–deceleration driving. (a) Motion sensation of surge direction. (b) Motion sensation of sway direction. (c) Motion sensation of roll direction. (d) Motion sensation of pitch direction.
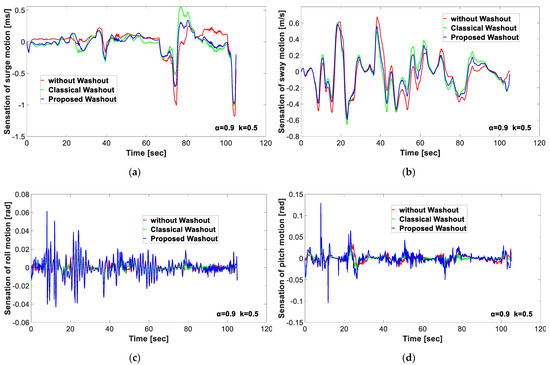
Figure 16.
Motion sensation in the case of slope road (uphill/downhill) driving. (a) Motion sensation of surge direction. (b) Motion sensation of sway direction. (c) Motion sensation of surge direction. (d) Motion sensation of sway direction.
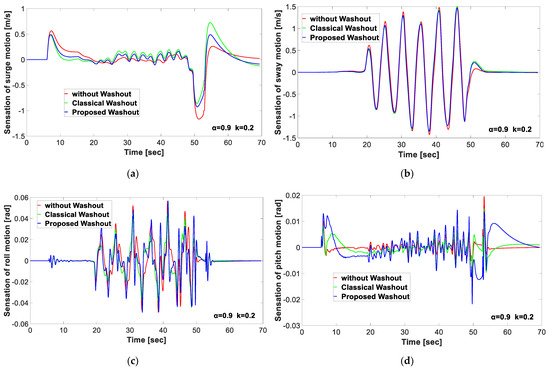
Figure 17.
Motion sensation in the case of slalom driving. (a) Motion sensation of surge direction. (b) Motion sensation of sway direction. (c) Motion sensation of surge direction. (d) Motion sensation of sway direction.
5. Discussion
To evaluate the performance of the proposed washout algorithm, the correlation coefficient between the motion sensation without washout algorithm and the motion sensation when each washout algorithm was applied was compared in various driving situation. It can be said that the closer the correlation coefficient is to one, the closer the motion sensation is to real motion sensation.
The proposed washout algorithm is simulated by setting specific force gains to 0.6 and 0.9 and applying various scale gains within the subregion scale method to prevent the rotational motion sensation from being degraded. As a result, it can be seen that the rotational motion sensation is significantly improved while maintaining the improved translational motion sensation by the new tilt coordination washout algorithm. Figure 14, Figure 15, Figure 16 and Figure 17 show the motion sensation results of real vehicles, classic washout algorithms and proposed algorithms in various driving situations. In each Figure, (a) and (b) represent the translational motion sensation in the surge and swing directions, and (c) and (d) represent the rotational motion sensation in the roll and pitch directions, respectively. For a more quantitative performance analysis, the correlation coefficient between the actual vehicle’s motion sensation and the motion sensation of each washout algorithm was calculated and presented in Table 4, and the closer it is to one, the more similar it is to the actual motion sensation. It can be seen that the new tilt coordination algorithm improves the translational motion sensation compared to the classical washout algorithm, while the rotational motion sensation is extremely deteriorated. In this case, the specific force gain applied to the new tilt coordination algorithm is one.
It can be seen that the smaller the specific force gain, the less the improvement of the translational motion sensation is, but the deterioration of the rotational motion feeling can be prevented. Therefore, when experimenting with driving scenarios where rotational motion sensation is more important, setting the specific force gain to a small value will provide a more improved motion sensation to the passenger. In addition, even if the scale gain in SSM is applied at a small value of 0.2, the rotational motion sensation is significantly improved compared to the new tilt coordination washout algorithm, and as the scale gain increases, the rotational motion sensation is improved beyond the classic washout algorithm, but the degree of decline in the translation motion sensation is negligible. For the scenario applied in this paper, when k is a value between 0.5 and 0.7, the greatest effect is shown, and when it increases from 0.7 to 1, the degree of improvement of the rotational motion sensation is insignificant. Therefore, if the scale gain in SSM is large, the angle at which the simulator motion system should be driven increases, so applying the appropriate scale gain and specific force gain can provide an optimal motion sensation in consideration of the driving scenario and kinematic limit of the motion system.
6. Results
In this paper, we proposed the new tilt coordination algorithm with specific force gain and subregion scale method with various scale values to overcome the poor translational motion sensation of the classical washout algorithm and the poor rotational motions sensation of the new tilt coordination algorithm. The proposed washout algorithm was evaluated by simulation using the human sensation model; it was verified that the motion sensation of the proposed washout algorithm is like that of the human sensation model. The specific force gain algorithm is one of the effective methods to improve the rotational motion sensation while maintaining the translational motion sensation.
In addition, by mathematically analyzing the scale parameters used in the subregion scale method, we presented a criterion for selecting scale parameters considering the kinematic limit of the motion system and maximum output value of the vehicle tilt angle. The advantages of the proposed washout algorithm are simpler than optimal control, fuzzy, generic algorithm, etc., and simple tunning allows us to provide improved motion sensation over the classical and new tilt coordination washout algorithm.
Author Contributions
Conceptualization, M.-S.K.; methodology, M.-S.K.; software, S.-J.K.; validation, S.-J.K.; formal analysis, S.-J.K.; investigation, S.-J.K.; resources, S.-J.K.; data curation, S.-J.K.; writing—original draft preparation, M.-S.K.; writing—review and editing, M.-S.K.; visualization, S.-J.K.; supervision, M.-S.K.; project administration, M.-S.K.; funding acquisition, M.-S.K. All authors have read and agreed to the published version of the manuscript.
Funding
This work was partly supported by the research grant of the Kongju National University in 2022 and Korea Evaluation Institute of Industrial Technology (KEIT) grant funded by the Korea Government (MOTIE) (No. 20018448, Development of Demand-responsive Automated Valet Parking and Service Technology).
Institutional Review Board Statement
Not applicable.
Informed Consent Statement
Not applicable.
Data Availability Statement
Data are contained within the article.
Conflicts of Interest
The authors declare no conflict of interest.
References
- Houda, T.; Beji, L.; Amouri, A.; Mallen, M. Handiski Simulator Performance Under PSO-based Washout and Control Parameters Optimization. Nonlinear Dyn. 2022, 110, 649–667. [Google Scholar] [CrossRef]
- Son, K.; Choi, K.; Eom, S. Human Sensibility Ergonomics Approach to Dynamics-Based Vehicle Simulator. Trans. Korean Soc. Automot. Eng. 2002, 10, 123–131. [Google Scholar] [CrossRef]
- Kang, E.; You, K.; Lee, M. Development of a Washout Algorithm for a Vehicle Driving Simulator Using New Tilt Coordination and Return Mode. J. Inst. Control. Robot. Syst. 2004, 10, 634–642. [Google Scholar]
- Moon, Y.; Kim, M.; Kim, K.; Lee, M. Improvement of Washout Algorithm for Vehicle Driving Simulator. J. Inst. Control. Robot. Syst. 2009, 15, 823–830. [Google Scholar]
- Kim, M.; Moon, Y.; Kim, G.; Lee, M. Partial Range Scaling Method based Washout Algorithm for a Vehicle Driving Simulator and Its Evaluation. Int. J. Automot. Technol. 2010, 11, 269–275. [Google Scholar] [CrossRef]
- Carr, P.; McKissick, B. Analysis Procedures and Subjective Flight Results of a Simulator Validation and Cue Fidelity Experiment; NASA Technical Memorandum 88270; Ames Research Center: Edwards, CA, USA, 1988.
- Samji, A.; Reid, L. The Detection of Low-Amplitude Yawing Motion Transients in a Flight Simulator. IEEE Trans. Syst. Man Cybern. 1992, 22, 300–306. [Google Scholar] [CrossRef]
- Schwarz, C. Two Mitigation Strategies for Motion System Limits in Driving and Flight Simulators. IEEE Trans. Syst. Man Cybern. Part A Syst. Hum. 2007, 37, 562–568. [Google Scholar] [CrossRef]
- Sivan, R.; Ish-Shalom, J.; Huang, J. An Optimal Control Approach to the Design of Moving Flight Simulators. IEEE Trans. Syst. Man Cybern. 1982, 12, 818–827. [Google Scholar] [CrossRef]
- Song, J.; Jung, U. Washout Algorithm with Fuzzy-Based Tunning for a Motion Simulator. J. Mech. Sci. Technol. 2003, 17, 221–229. [Google Scholar]
- Wang, S.; Fu, L. Predictive Washout Filter Design for VR-based Motion Simulator. In Proceedings of the IEEE International Conference on Systems, Man and Cybernetics, The Hague, The Netherlands, 10–13 October 2004. [Google Scholar]
- Nehaoua, L.; Amouri, A.; Arioui, H. Classic and Adaptive Washout Comparison for a Low Cost Driving Simulator. In Proceedings of the 2005 IEEE International Symposium on, Mediterrean Conference on Control and Automation Intelligent Control, Limassol, Cyprus, 27–29 June 2005. [Google Scholar]
- Cho, Y.; Kim, H.; Kim, I.; Woo, J.; Kim, J. Fast design of the QP-based optimal trajectory for a motion simulator. J. Mech. Sci. Technol. 2007, 21, 1973–1985. [Google Scholar] [CrossRef]
- Chen, S.; Fu, L. An Optimal Washout Filter Design with Fuzzy Compensation for a Motion Platform. In Proceedings of the 18th World Congress, The International Federation of Automatic Control, Milano, Italy, 28 August–2 September 2011. [Google Scholar]
- Beghi, A.; Bruschetta, B.; Maran, F. A real time implementation of MPC based Motion Cueing Strategy for driving simulators. In Proceedings of the 51st IEEE Conference on Decision and Control, Maui, HI, USA, 10–13 December 2012. [Google Scholar]
- Asadi, H.; Mohamed, S.; Nelson, K.; Nahavandi, S.; Zadeh, D.; Oladazimi, M. An Optimal Washout Filter Based on Genetic Algorithm Compensators for Improving Simulator Driver Perception. In Proceedings of the DSC 2015 Europe Germany, Tübingen, Germany, 16–18 September 2015. [Google Scholar]
- Asadi, H.; Mohamed, S.; Nahavandi, S. Incorporating Human Perception With the Motion Washout Filter Using Fuzzy Logic Control. IEEE/ASME Trans. Mechatron. 2015, 20, 3276–3284. [Google Scholar] [CrossRef]
- Asadi, H.; Mohammadi, A.; Mohamed, S.; Lim, C.; Khatami, A.; Khosravi, A.; Nahavandi, S. A Particle Swarm Optimization-based Washout Filter for Improving Simulator Motion Fidelity. In Proceedings of the IEEE International Conference on Systems, Man, and Cybernetics, Budapest, Hungary, 9–12 October 2016. [Google Scholar]
- Asadi, H.; Mohamed, S.; Lim, C.; Nahavandi, S. Robust Optimal Motion Cueing Algorithm Based on the Linear Quadratic Regulator Method and a Genetic Algorithm. IEEE Trasactions Syst. Man Cybern. Syst. 2017, 40, 238–254. [Google Scholar] [CrossRef]
- Asadi, H.; Lim, C.; Mohamed, S.; Nahavandi, D.; Nahavandi, S. Increasing Motion Fidelity in Driving Simulators Using a Fuzzy-Based Washout Filter. IEEE Trasactions Intell. Veh. 2019, 4, 298–308. [Google Scholar] [CrossRef]
- Qazani, M.; Asadi, H.; Bellmann, T.; Mohamed, S.; Lim, C.; Nahavandi, S. Adaptive Washout Filter Based on Fuzzy Logic for a Motion Simulation Platform With Consideration of Joints’ Limitation. IEEE Trans. Veh. Technol. 2020, 69, 12547–12558. [Google Scholar] [CrossRef]


Publisher’s Note: MDPI stays neutral with regard to jurisdictional claims in published maps and institutional affiliations. |
© 2022 by the authors. Licensee MDPI, Basel, Switzerland. This article is an open access article distributed under the terms and conditions of the Creative Commons Attribution (CC BY) license (https://creativecommons.org/licenses/by/4.0/).