Article

Influence of Masonry Infill Wall Position and Openings in the Seismic Response of Reinforced Concrete Frames

by
Abdelghaffar Messaoudi
1,
Rachid Chebili
1,
Hossameldeen Mohamed
2 and
Hugo Rodrigues
3,*
1
Laboratory of Research in Civil Engineering, University of Biskra, Biskra 07000, Algeria
2
Faculty of Engineering, Aswan University, Aswan 81528, Egypt
3
RISCO-Civil Engineerig Departament, University of Aveiro, 3810-193 Aveiro, Portugal
*
Author to whom correspondence should be addressed.
Appl. Sci. 2022, 12(19), 9477; https://doi.org/10.3390/app12199477
Submission received: 29 August 2022 / Revised: 15 September 2022 / Accepted: 16 September 2022 / Published: 21 September 2022

Abstract

:
It is now widely recognized that the masonry infill frame used in reinforced concrete structures (RC) greatly enhances both the rigidity and strength of the surrounding frame. The lateral loading behavior of this RC frame is different from the frame without infill, although the structural contribution of infill walls is discarded in many countries, including Algeria. This paper aims to focus on the effect of openings and the effect of changing the distribution of masonry panels on the global behavior of buildings. For this, a pushover analysis is carried out to evaluate the seismic performance and assess the behavior of infilled RC, and to study the results related to capacity curve, inter-story drift and energy. The results obtained show that the effect of the openings and changing of the distribution of masonry panels can drastically change the overall behavior of the structures regarding enhancing strength capacities and energy absorption. Noticeable remarks in terms of distributing masonry panels within a frame are observed and several recommendations concerning the present practice might be important to be considered.

1. Introduction

Reinforced concrete (RC) structures with masonry infills are common around the globe, including in countries with medium/high seismic hazards [1,2,3]. The Mediterranean Sea countries are a distinct example of these countries, including Algeria. Even though the ability of infill walls to carry lateral loads during earthquakes are obviously seen in several post-earthquake investigations (e.g., see [4], among others) and by several numerical and experimental studies [5].
During an earthquake, infill walls may take a large part of the seismic force in the initial stages, however, with the increase in seismic demand and with the consequent damage to the infill panels, the capacity to sustain the force is reduced suddenly and the global building behavior may change. Therefore, the influence of the walls on the local and global behavior of the structure and their contribution to the capacity and stiffness remains dependent on the characteristics of these walls and on the failure distribution.
In the last years, several studies have been conducted to reduce the impact of an earthquake on RC structures at the building scale using base isolation [6,7] or smart dissipating devices for example [8], or with local strategies at the infill panel level, such as seismic infill wall isolation [9,10,11,12], however, this advanced technique is not available yet in the current practice.
In Algeria, the use of masonry is limited; it is often used only as filling material in the construction of RC buildings. In analysis, masonry’s influence on building behavior is commonly neglected. The seismic building code, RPA [13], recommends a global failure mechanism, obtained by designing these self-stable structures in such a way that the plastic hinges are formed in the beams rather than in the columns, to dissipate by plastic deformations, a maximum of seismic energy without collapsing. However, considering the design procedures and the available infill typologies, the questions generally asked relate to the influence of the infill masonry walls on the structure’s building strength and energy dissipation capacity, its way of undergoing post-elastic deformations, its initial stiffness and the failure mechanisms.
Nevertheless, unfortunately, in Algeria, there are practically no standards concerning the behavior of infill masonry walls. Masonry infill walls have a very complex behavior due to the materials’ heterogeneity and the almost artisanal techniques associated with its production, making it a very variable material that is difficult to standardize.
The present work aims to study the seismic behavior of RC structures, considering the influence of the presence of openings, and the position of these infill walls on the seismic behavior of RC frame structures. For this, considered a six-story frame with three bays of the same length was considered. This frame is part of a building supposed to be in a zone of high seismicity (zone III according to RPA 99/2003 version) [13,14].
The secondary objective is to study the variability of the presence of infill walls and their effect on the structural response, whereby 15 models were selected from the structure previously studied, considering the variation in the presence of building walls in each case. After designing the frame according to the RPA 99/2003 [13] version and BAEL 91 [14], non-linear static analyses (pushover) were carried out on the frame with different infill wall configurations. At the end of these post-elastic analyses, a discussion of the results is carried out, emphasizing the variation of the parameters, such as the base shear of the frame and the lateral displacements of floors.

2. Modelling of Infills Masonry

Typically, two modelling strategies are found to simulate the behavior of infill frames for non-linear analyses, macro-modelling and micro-modelling approaches. The former approach refers to the use of a struts system to simulate the infill walls. On other hand, the latter approach refers to detailed simulation of the involved components of infilled RC frames using continuum finite elements. The use of the macro modelling approach is seen as more efficient for the analysis type that involves a series of analyses, such as performance-based earthquake engineering applications [15].
Malick and Severn (1967) [16] and Malick and Garg (1971) [17] proposed the first finite element method (FEM) for analyzing portal frames with infills. An accurate representation of the interface conditions between the infill and the frame was required to solve the problem. The infill walls were modelled using linear elastic finite elements of rectangular type with two degrees of freedom at each of the four nodes, while the frame was represented using bar elements disregarding the axial deformation.
Mahrabi et al. (1994) [18] proved experimentally that the loss of lateral stiffness in frames with masonry infill resulted mainly from horizontal and diagonal cracking in the infill panels. They also indicated that distributed cracking models could not correctly represent the diagonal cracking observed in masonry infill panels.
Lourenco and Rots (1997) [19] developed a model of elastoplastic behavior for the interface element. They showed their model’s ability to capture the masonry wall’s behavior in terms of sheer, peak loading and post-peak behavior by comparing their results with experimental results on masonry walls.
Oliveira and Lourenco (2004) [20] developed a material model to describe the cyclic behavior of the interface element. A continuous 8-node element in-plane stress is used to simulate the elements of the masonry walls. Also, they established a comparison between the static cyclic test results and their simulation ones on three infill walls (without frames). Moreover, they demonstrated that their model could capture the energy dissipation, stiffness degradation and deformation of masonry panels.
Koutromanos et al. (2011) [21] used an improved distributed crack model and the interface of one of the cohesive cracks to capture the cyclic behavior of a frame with infill walls. Furthermore, they compared their results with the quasi-static tests. They obtained an important match between the experimental results and the numerical simulation regarding hysteretic behavior and failure mechanism. Since the first attempts to model the effect of masonry panels on reinforced concrete frame structures, conceptual and experimental observations have shown that substituting these walls with an equivalent compression diagonal with appropriate geometric and mechanical characteristics can give an adequate response to the good behavior of the composite.
Polyakov (1960) [22] proposed the possibility of replacing the infill walls in each frame with an equivalent diagonal strut for bracing (Figure 1a). This idea was also adopted by Holmes (1961) [23], where the infill wall was replaced by a compression diagonal attached to the frame of the same material with the same thickness and a width of 1/3 the length of the diagonal. The third concept was adopted independently of the rigidities of the structure and the infill wall.
Smith (1962) [24] and Smith and Carter (1970) [25] related the width of the equivalent diagonal to the contact length between the structure and the infill wall using an analytical equation taken from the equation for the free beam on elastic soil under concentrated load. Based on the contact length between the structure and the infill walls, they expressed the contact length as a function of the parameter λ (relative stiffness parameter of the infill element) a h = π 2 λ h to account for variation in Young’s modulus of infill walls. Safford Smith and Carter expressed the relative given in the Equation:
λ = E w t s i n 2 θ 4 E c I h w 3    
where Ew: is Young’s modulus of the infill, t: is the thickness of the infill panel, hw: is the height of the infill wall, I: is the moment of inertia of the column, E: is Young’s modulus of concrete and θ: is the angle between the diagonal and the horizontal. Then, Mainstone (1971) [26] and Mainstone and Weeks (1970) [27] proposed two equations for the width of the equivalent diagonal as a function of λh based on the results of experimental tests carried out on reinforced concrete frames with masonry infill wall.
w l = 0.1 λ h 0.3 ,             w d = 0.175 λ h 0.4
These Equations have been adopted by FEMA 273, FEMA 306 and ASCE-41.
Saneinejab and Hobbes (1995) [28] also tested frames with infill to predict the non-linear behavior of infill panels. They modified the equivalent diagonal model with a bilinear model to account for its low ductility. This bilinear model predicts the initial stiffness Ke, the initial force Fcr and the maximum load Fmax. This model has been developed based on experimental tests and finite element simulations of steel frames with masonry infills.
To understand the non-linear behavior of structures with infill, Zernic and Gostic [29] proposed an empirical equation, which was modified by Dolsec and Fajfar (2008) [30] to calculate the ultimate shear resistance of panels of masonry infill walls:
F m a x = 0.818 L i m t w F t p C 1 ( 1 + C 1 2 + 1 )   Avec   C 1 = 0.925 L i m H i n
El-Dakhakhni et al. (2003) [31] developed a three-parallel strut model to recreate the proper moment diagram in a filled frame with infill due to the frame–infill interaction and to capture the failure mechanisms adequately (Figure 1b).
To consider the top-down shear failure mechanism of the infill panels, Crisafulli (2007) [32] proposed another model with a double link in each direction and a third link which is a spring, acting only according to the diagonal to account for shear from the top to bottom of the panel (Figure 1c). A simplified macro-model suggested by Rodrigues et al. [33] is an upgrade of the equivalent bi-diagonal compression strut model used to model the non-linear behavior of infill masonry walls exposed to cyclic loads and confirmed with obtained experimental data. The structure is specified by four stiff support strut elements and one non-linear hysteretic center support strut element in each brick panel (Figure 1d). An infill’s behavior in one direction is influenced by how the in-plane damage is distributed, and this macro-model considers that. As a result, a more realistic representation of structural response and energy dissipation is provided by the suggested model.
Figure 1. Macro Models for masonry infill walls: (a) single strut model, (b) Three Diagonal model (based on [31]) (c) Proposed multi-strut model [32], (d) Macro-model proposed by Rodrigues et al., 2010) [33].
Applsci 12 09477 g001

3. Case Study

3.1. Description of the Building Structure

To assess the effect of the infill panels, considering the presence of openings and the change in the distribution of masonry walls on the vulnerability of RC buildings, a residential building was selected as a representative case study. The building has the plan dimensions of 17.4 m × 13.1 m, which consists of 4.3 × 4.3 m modules (longitudinal and transverse direction, respectively), with a story height equal to 3 m. The building was designed according to the Algerian code (RPA2003) [1].
Twenty-four 2D models were generated in the software OpenSees (Mckenna, Fenves, et al., 2000) [27], one without infill walls herein designated Bare Frame (BF) model and another one with infill panels distributed along the building’s façades (Full Frame (FF)) model. Also, eight different models with different opening ratios (the reduction factor is from 10% to 90%) were generated, and thirteen models differ in the distribution of the infill walls. The masonry unit selected for the infill panels is hollow clay horizontal bricks 15 cm thick, representing Algeria’s most common masonry units. Once the main objective of the study was established as the assessment of the in-plane influence of the infill masonry walls in the seismic response of RC frames, only a 2D frame was considered. Nevertheless, it is recognized that the out-of-plane behavior can change the structural response and an irregular distribution in plan could also develop a torsional response of the building.
The RC frames are defined as part of a residential structure, the architectural plan view of the typical floor, shown in Figure 2a and the structural system, shown in Figure 2b. The frame of the vertical axis 5 between the horizontal axes AD, referred to herein as frame F5A-D, is the frame considered for the vulnerability analysis. The structures were designed for gravity loads to simulate a design situation where a global vertical load of 5.25 kN/m2 plus a variable load of 2 KN/m2 was considered. Table 1 shows the mechanical parameters of the chosen materials, and Table 2 shows the cross-section data for frames F5A-D.

3.2. RC Element Modelling

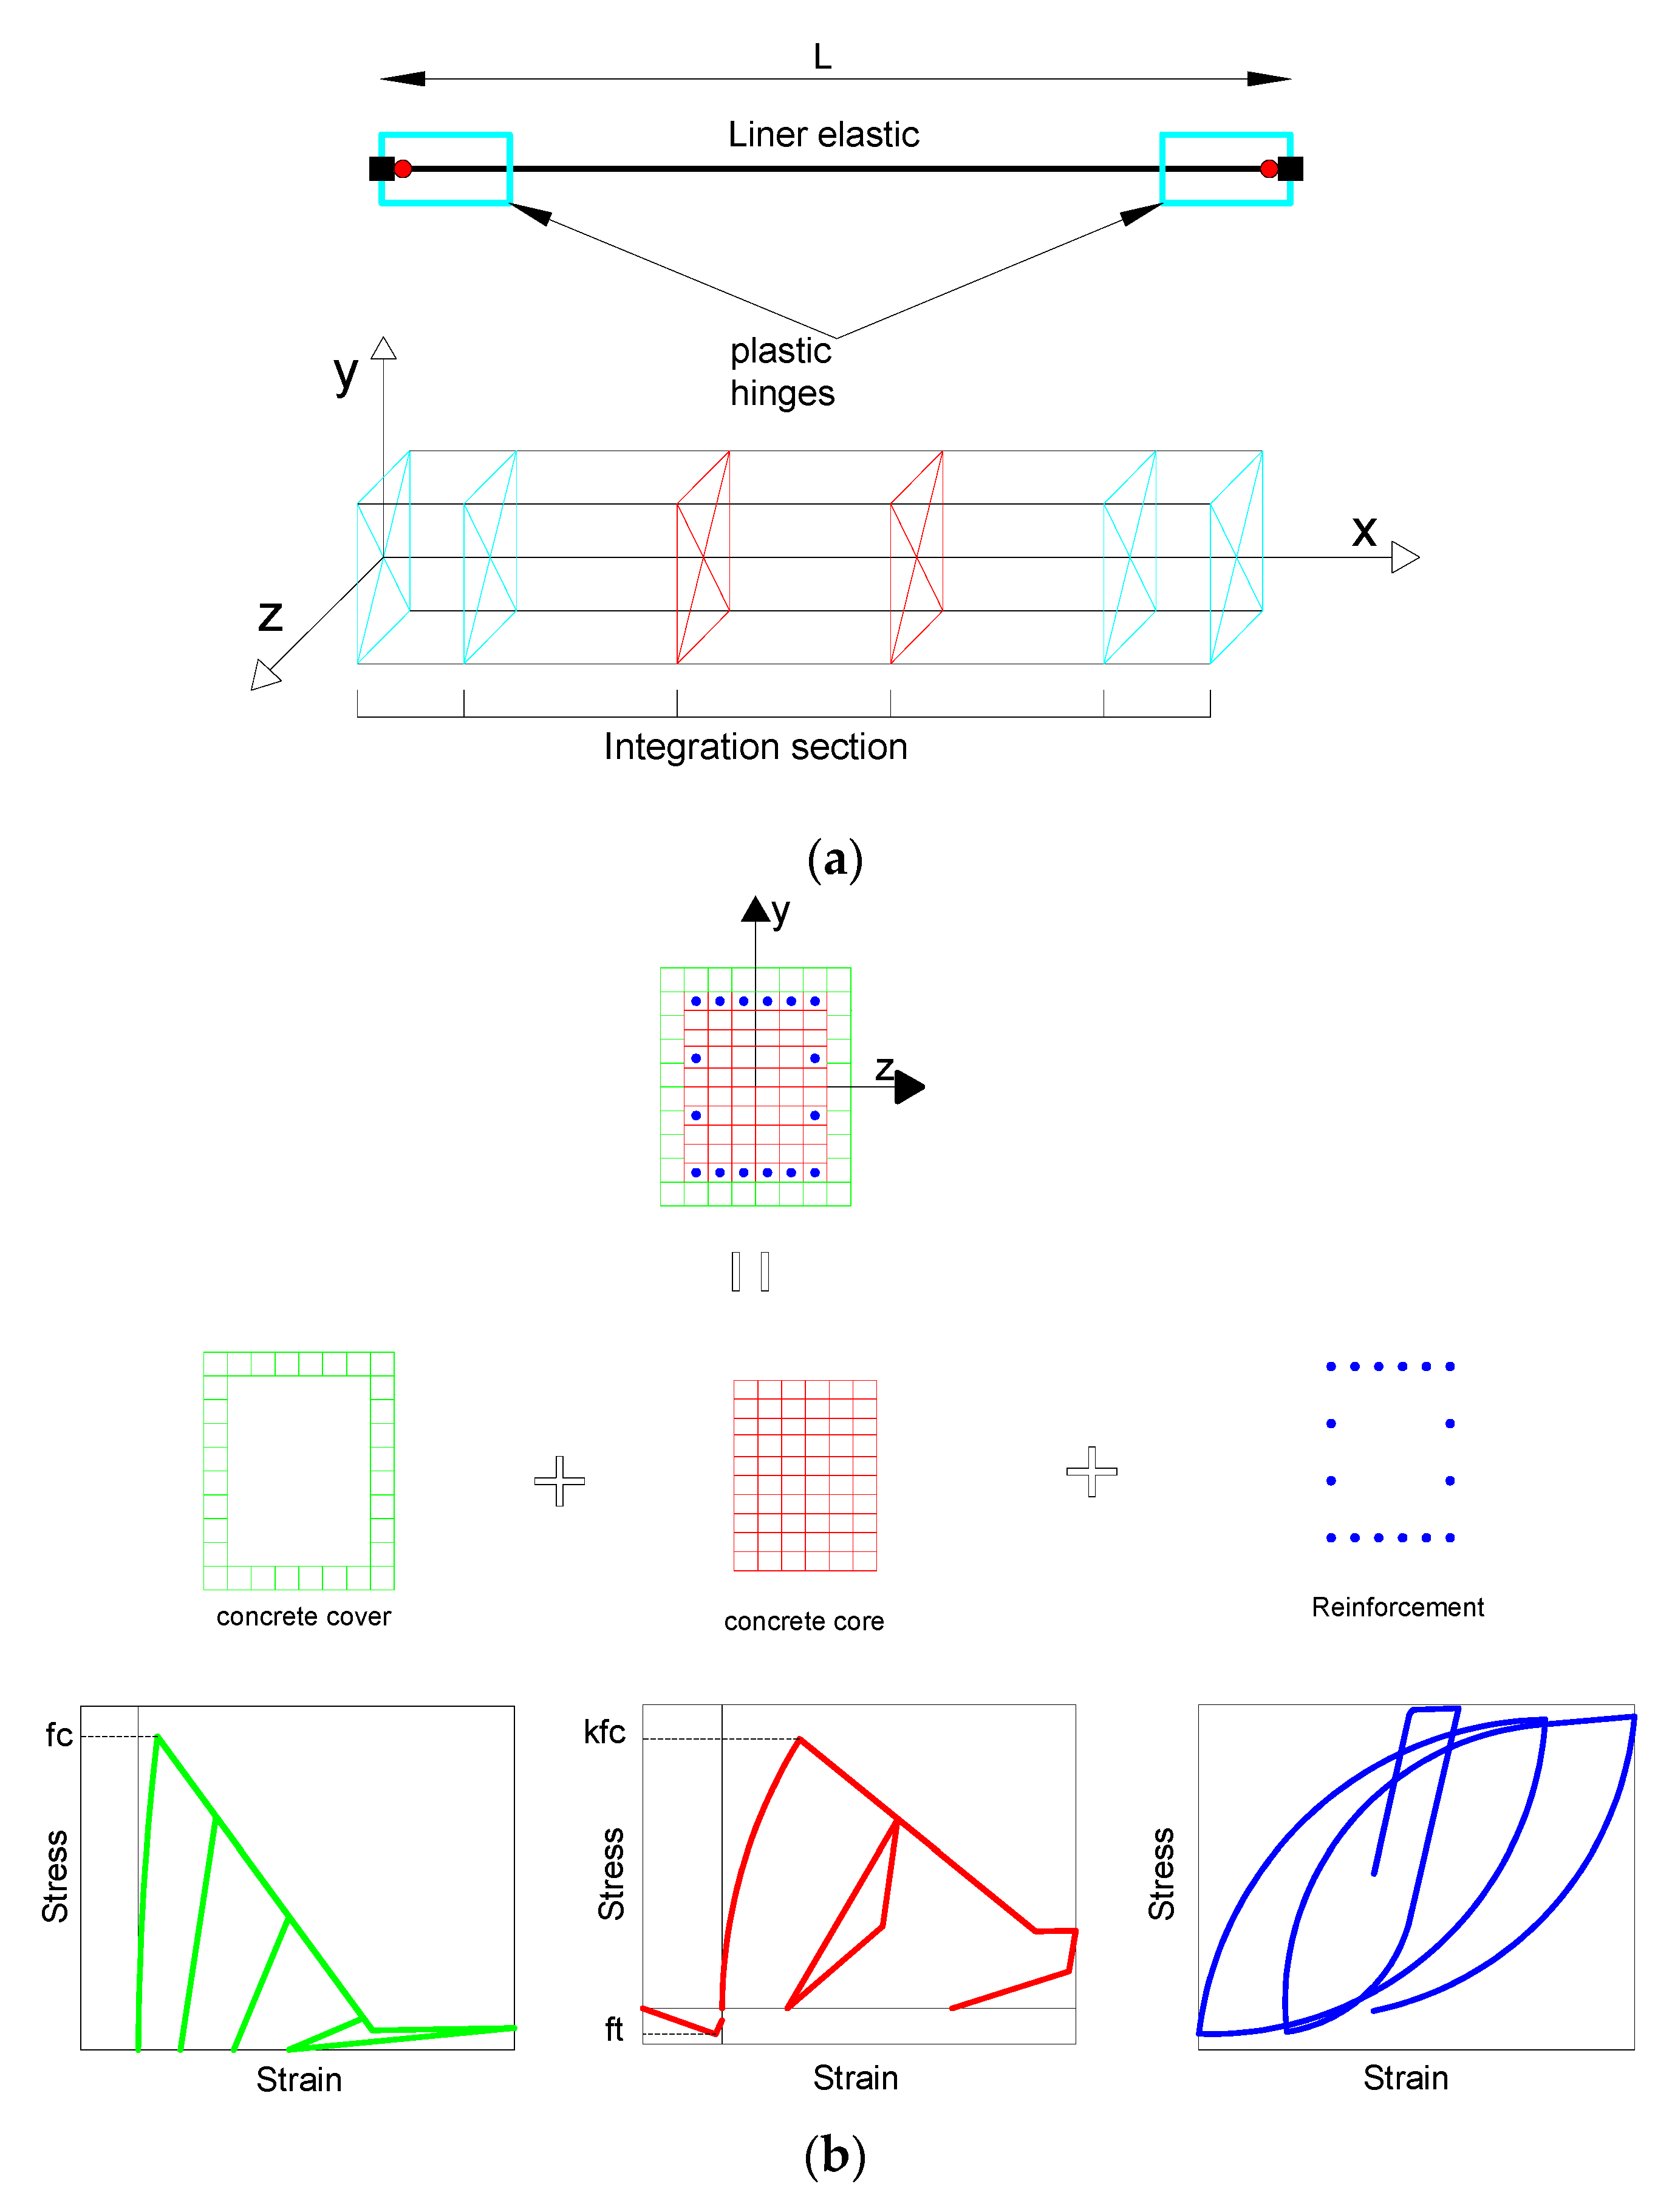
OpenSees software [34] provides a straightforward platform to model structural elements’ reliably and flexibly [35]. Furthermore, its ability to integrate with other software to input or postprocess data is prominent. As such, the numerical models were generated using OpenSees software. Figure 3 shows an overall description of the adopted modelling strategy for the RC elements. As can be seen, a beam with hinges element from OpenSees element library was used to model the RC elements. This element has the capability to specify plastic hinge lengths at the element ends. By using Modified Radau Hinge Integration method [36,37], two-point Gauss integration is used on the element interior, while two-point Gauss–Radau integration is applied over lengths of two hinges. In order to accommodate any extended plasticity beyond the hinge zones, fiber sections were also considered in the central part of the element. The length of hinges at the end of each element has been quantified using the following proposal [38]:
l p = 0.08 l e + 0.022 d b   f y    
where l e is the length of the element, d b   is the diameter of the longitudinal steel rebar and fy is the yield strength of the used steel in MPa.
As can be seen in Figure 3b the RC section was discretized in three different materials to accommodate the expected behavior of each ingredient of the RC. For the cover, where the concrete has no confinement, a zero tensile concrete model known as Concrete01 has been used. On other hand, to account for the effect of steel stirrups, the confined ratio has been considered for the middle region. The modified concrete strength has been used to define the concrete parts confined by stirrups. Concrete02 model in OpenSees was used to model the confined concrete with a tensile strength of 10% of the compressive strength of the concrete. Longitudinal rebars were modelled using the uniaxial Giuffre–Menegotto–Pinto model [39] with isotropic hardening, known as Steel02 in OpenSees. Eventually, in order to account for beam–column connection, a rigid end-offset joint model was applied for the beam–column joints [40]. The lengths of the rigid parts were considered to be half of the depth of the perpendicular element.

3.3. Infill Walls

The infills were modelled using a single compressive strut element with an area evaluated based on the expression that is proposed by Hendry 1990 [41], using the constitutive model for masonry, which matches the shape of the Concrete01 constitutive model. The constitutive model proposed by Hendry [41] is given by the following expression:
σ m = f m [ 2 ε m ε c r m ( ε m ε c r m ) 2 ]
where ε m and σ m are the compressive strain and the corresponding compressive stress of the masonry, respectively, f m is the maximum compressive strength of the masonry and εcrm is the compressive strain at the onset of failure, which, according to [30], ranges from 0.0015~0.002. In these analyses, the value of εcrm was 0.002 in all models.
Partially infilled RC frame can be defined as the RC frame with an infill wall that has an opening (e.g., window, door or any construction opening). The existence of such openings affects the ability of infill wall to distribute loads and, therefore, reduces the panel’s stiffness, ultimate strength and capacity for dissipating energy. Based on the existing experimental tests, different proposals were found to model the partially infilled walls. These proposals can be categorized into two main groups [42]; single/multiple diagonal strut system with a reduced strength [43,44] and truss configurations that consist of several crossed struts, e.g., see [45,46,47]. Given that the latter modelling strategy comes with a high computational cost [42], the former strategy was found more common in use in the literature. As such, several proposals are found in the literature to quantify the reduction factor to count for the infill walls (e.g., see among others [42,47,48,49]). These models account for different parameters of the opening such as size, aspect ratio, type and position. Based on the assessment of the reliability of the existing models, Mohamed and Romão [42] presented a new model that showed adequacy performance compared to the other models. In this study, this model will be used to quantify the reduction factor.

4. Methodology

4.1. Methodology

The main aim of the present study is to study the effect of the openings of infill panels and to analyze the variation of the presence of infill walls in the RC structure on the overall response of the building, which will provide interesting information concerning these values when the collapse of buildings occurs during a seismic event. For this, static non-linear analysis (pushover analysis) was carried out to extract these results and assess the impact of the infill masonry walls on the non-linear static behavior of the structure.
A set of 24 frames were defined. In the first stage, the effect of the openings was studied. Then, a reduction factor from 0% to 100% in all the panels (0% representing BF, 10%, 20%, 30%, 40%, 50%, 60%, 70%, 80%, 90% and 100% representing FF) on the behavior and capacity of the building by studying the capacitance curve, Maximum Inter-Story Drift (ISD max), and energy of each building was considered.
The second stage the study focuses different infill wall arrangements, and, consequently, the effect of the difference in the percentage of their contribution to the structural response of the studied buildings. From the infill walls, especially in the case of the soft story, the levels of performance under the influence of lateral loads were assessed and the effect of these distributions on seismic behavior was determined. All studies discussed in this paper are summarized in Table 3.
Pushover analysis were used, which generally refers to non-linear static procedures applied to evaluate the seismic performance of existing structures and the design of new buildings [50], and is presented in several recent seismic regulations and guidelines [51,52,53]. Pushover analysis is performed by using a series of inelastic static analyses on the building using a preselected lateral loading mode, based on the first vibration mode of the structure, or the equivalent static lateral loading modes in the seismic regulations.

4.2. Effect of Infill Openings on the Global Response

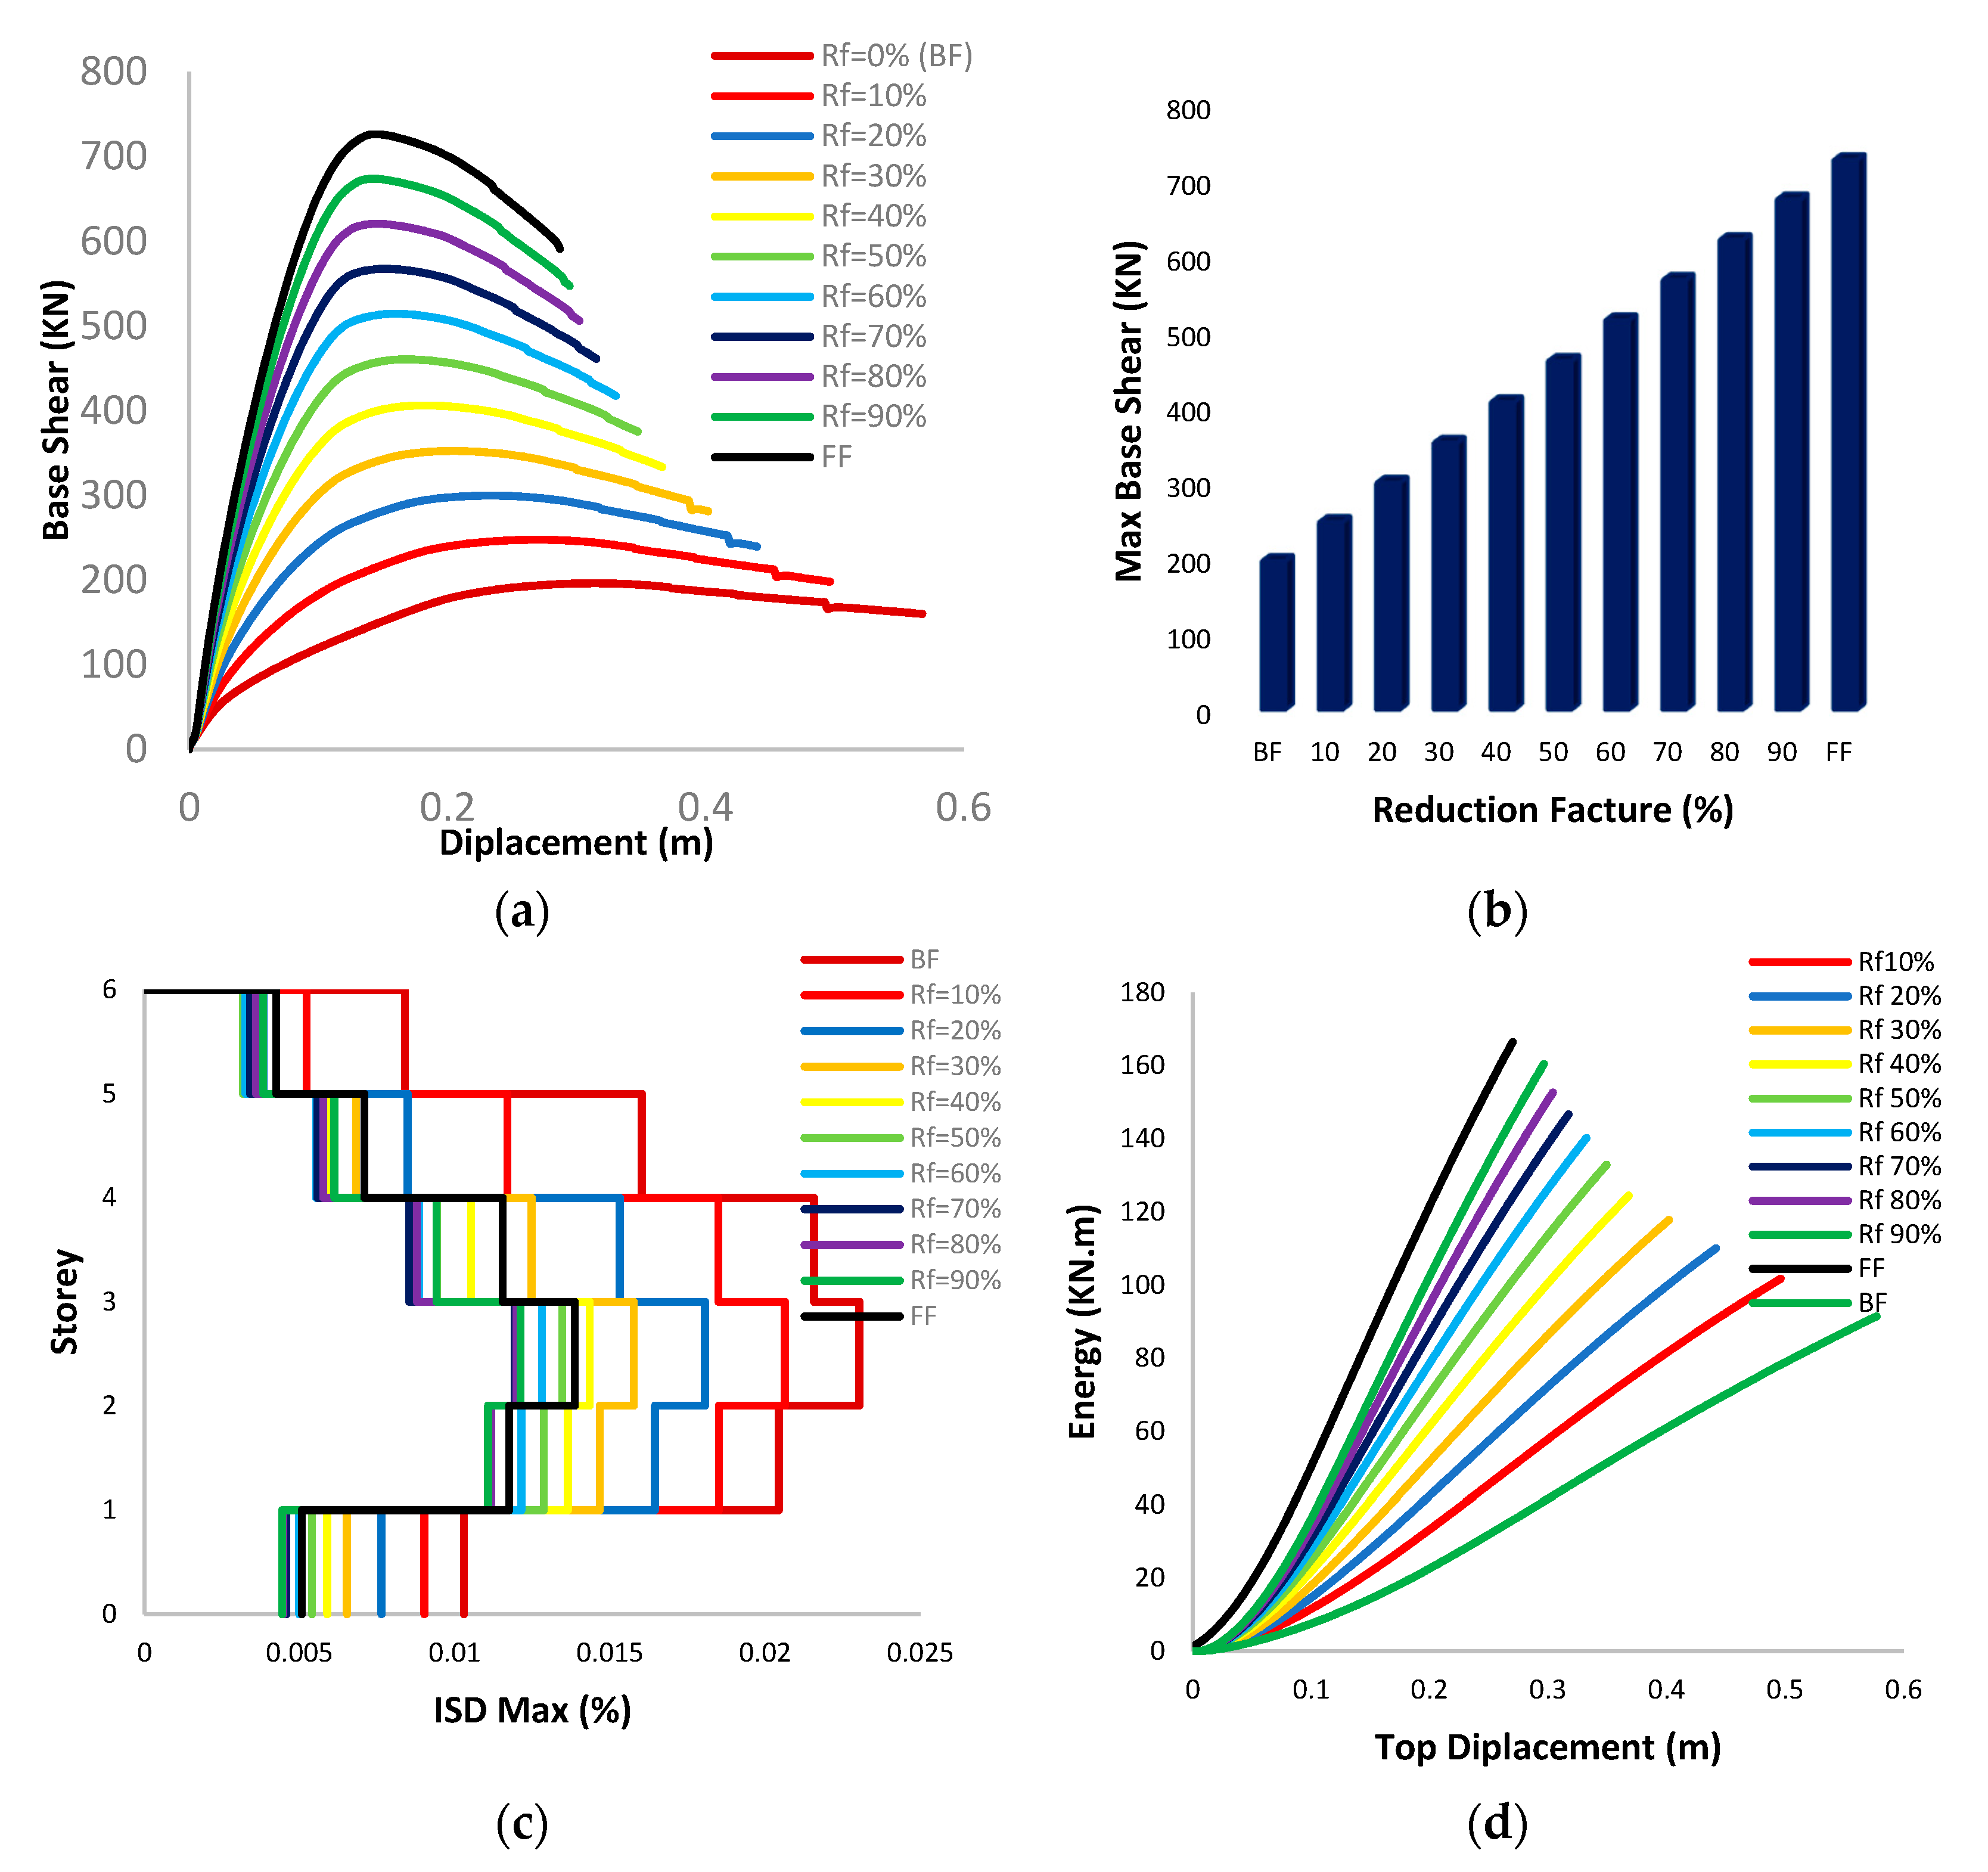
To study the effect of openings in the infill walls on the overall response of the building, the opening sizes were adjusted to obtain a range of reduction factors between 10–90%. The 6-story building models with a brick clay masonry with a thickness of 0.15 m and compressive strength value of 3500 KPa have been studied to evaluate the effect of openings on the determination and evaluation of base shear displacement, inter-story drift and energy absorption. The capacity curves, the maximum base shear, the inter-story drift profile for maximum strength and the energy until the convectional collapse are presented in Figure 4.
From the obtained results, stiffness increase can be observed, as shown in Table 4, compared to the bare frame. A high increase in the lateral stiffness of the buildings was recorded between 247–26%, according to the difference in the value of the reduction factor between 10% and 90%. Also, a decrease in the top displacement values was achieved by an estimated percentage of 54.31–13.77%, according to the difference in the reduction factor, and this is explained by the effect of the contribution ratio of the filling walls in increasing the lateral stiffness of the buildings and decreasing the displacement through the presence of walls.
The effect of the reduction ratio on the increase in the lateral stiffness is due to the difference in the percentage of the contribution of the infill walls, as the presence of openings in the filling walls negatively affects the contribution ratio, and thus, impacts the percentage of the increase in the lateral stiffness of the building.
Also, looking at the energy compared to the bare frame, a significant increase that varies according to the values of the reduction factor can be observed, where, for example, an increase in the energy absorbed concerning the reduction factor was 20%, 40%, 60% and 80% estimated at 20.3%, 36.07%, 53.28% and 66.90%, respectively. This discrepancy in the increase in energy is explained by the difference in the percentage of the contribution of the infill walls, which is directly affected by the value of the reduction factor.
Also, by looking at the recorded values of the maximum inter-story drift, it was noted that a significant decrease in the ISD is 11.2–47.39% for buildings with a reduction ratio between 10% and 90%. This discrepancy in the decrease is explained by the effect of the values of the reduction factor on the contribution ratio of building walls, and thus, the variance in increasing buildings’ rigidity.

4.3. Influence of the Presence of Infill in the Global Response

The present part of the paper aims to study the effect of the reinforced concrete frame with infill walls with different distributions and to monitor the impact of the different distribution of these walls on the strength and ductility of the concrete frame, using a macro model to represent the infill wall in the analytical study, which facilitates the process of analysis and study of effect. This can be related to the infill arrangement in new buildings or even due to the changes that occur during the building life.
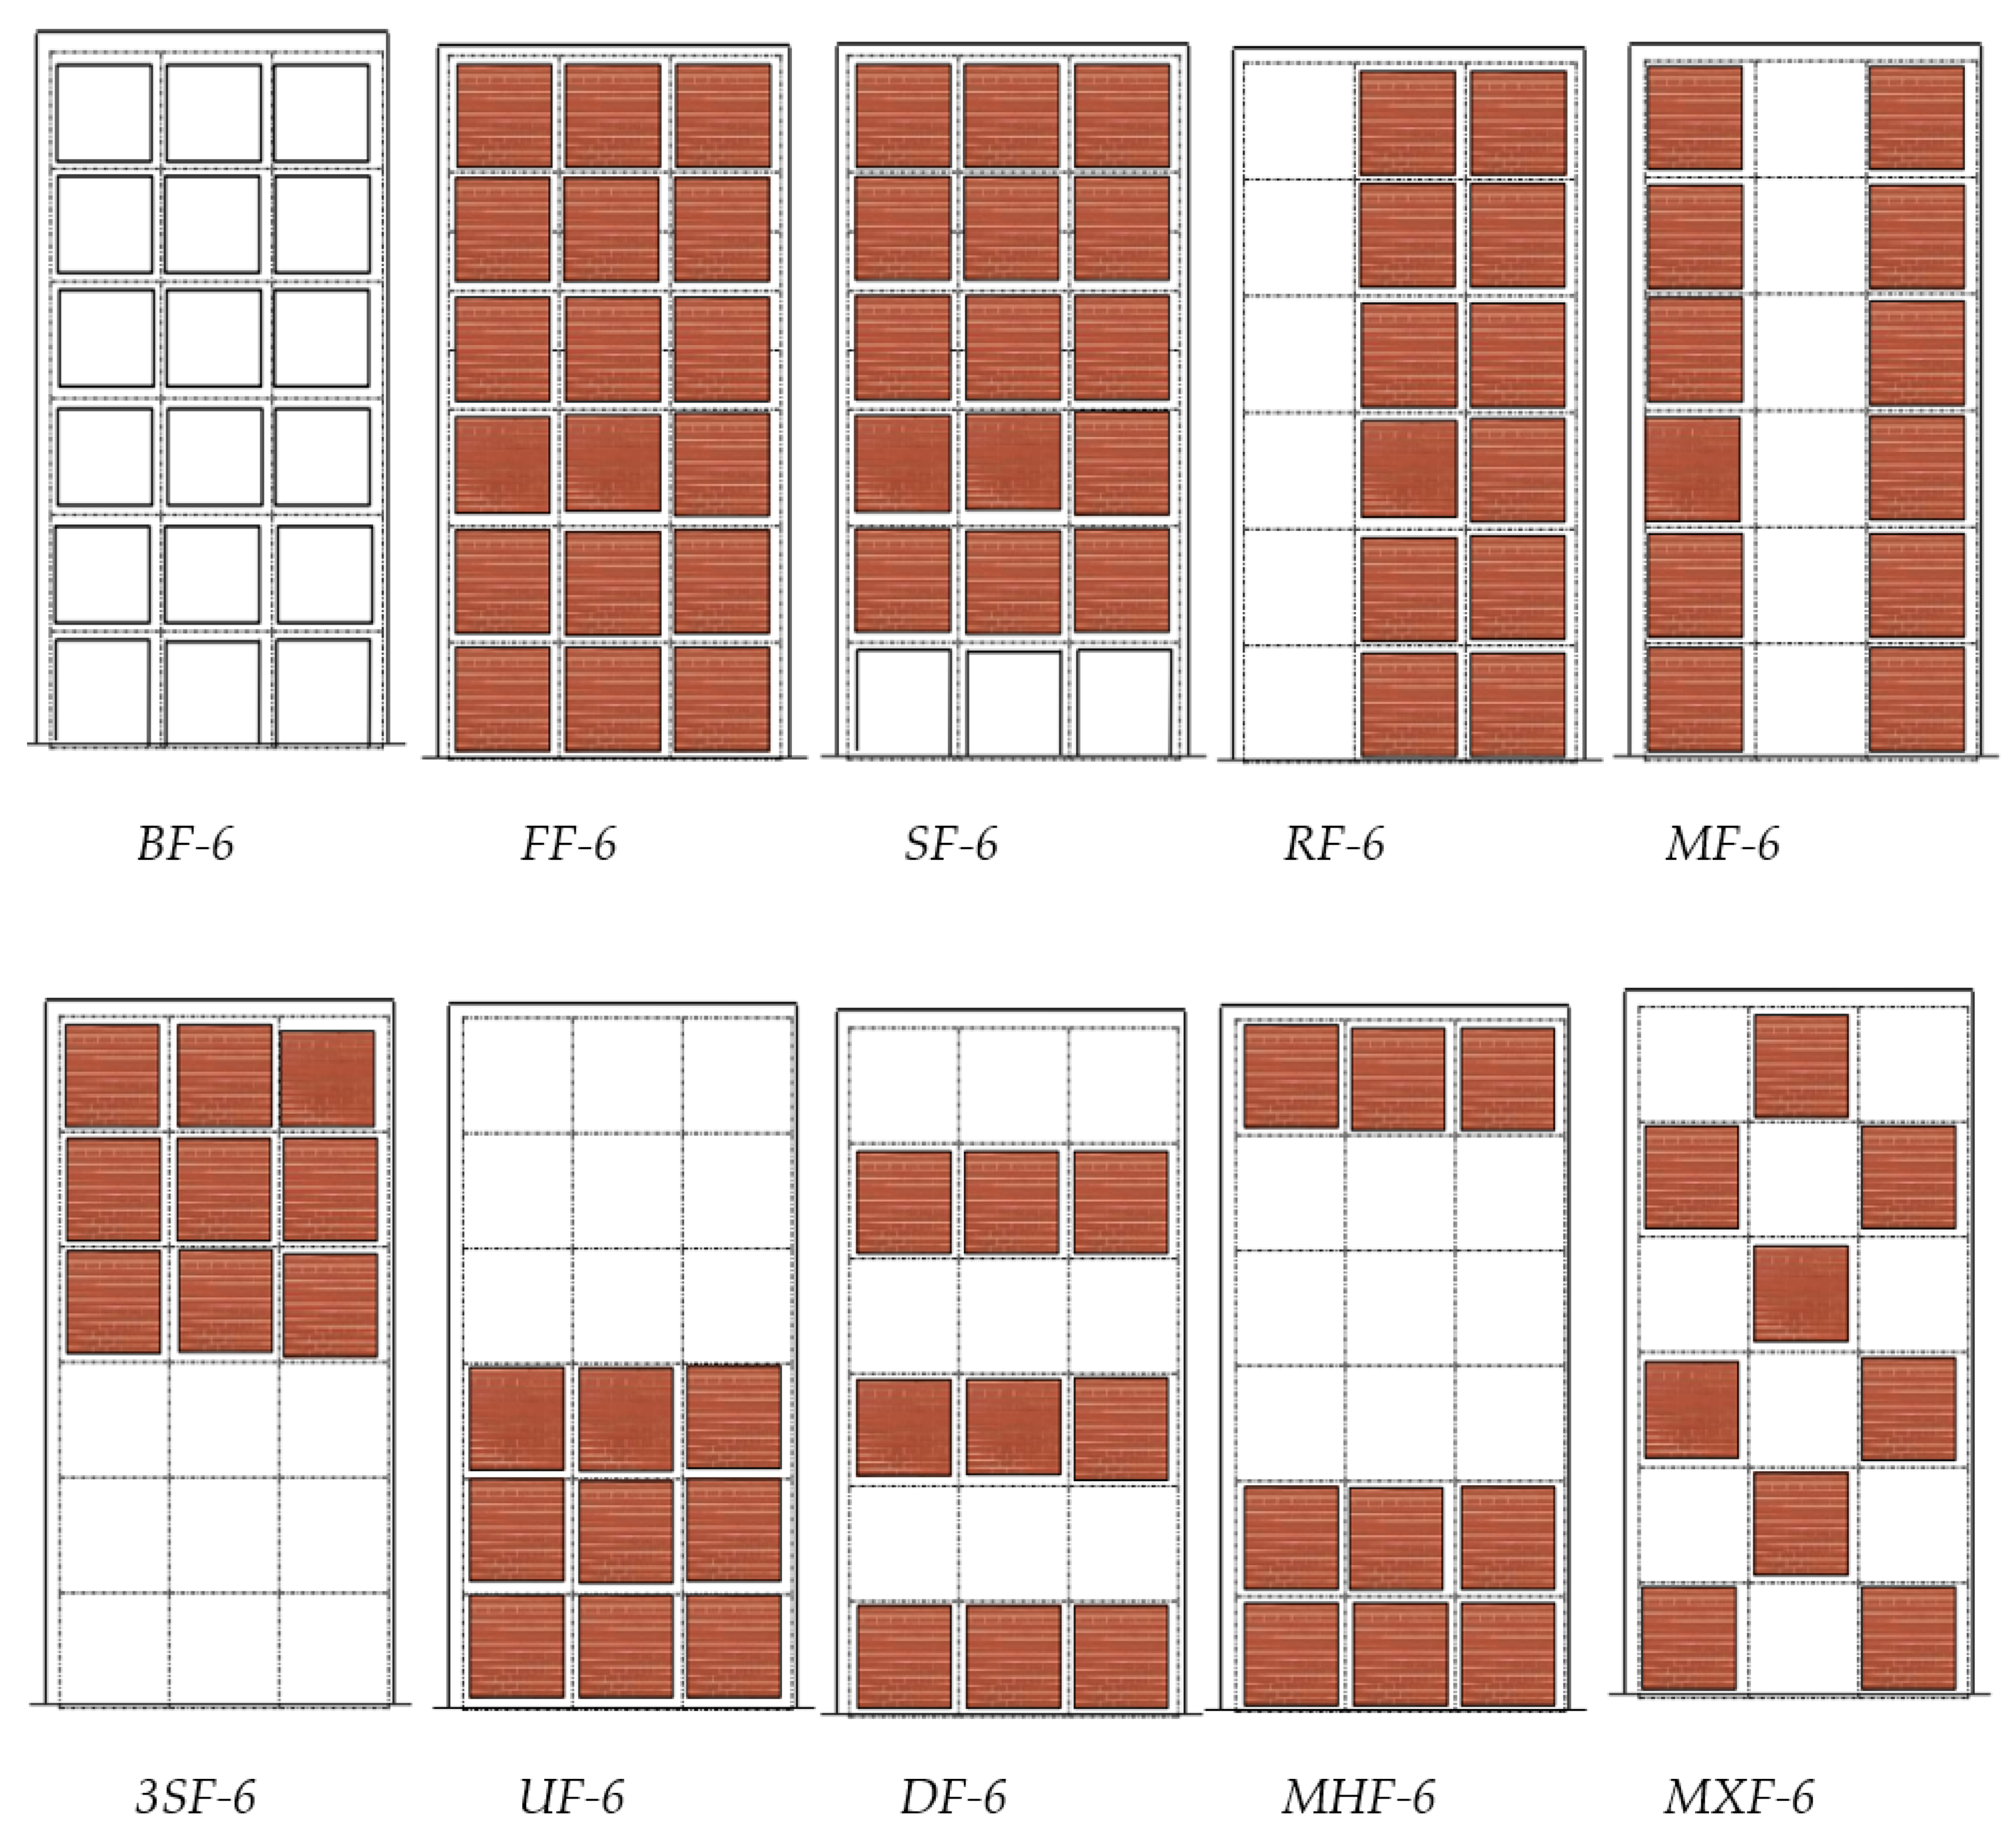
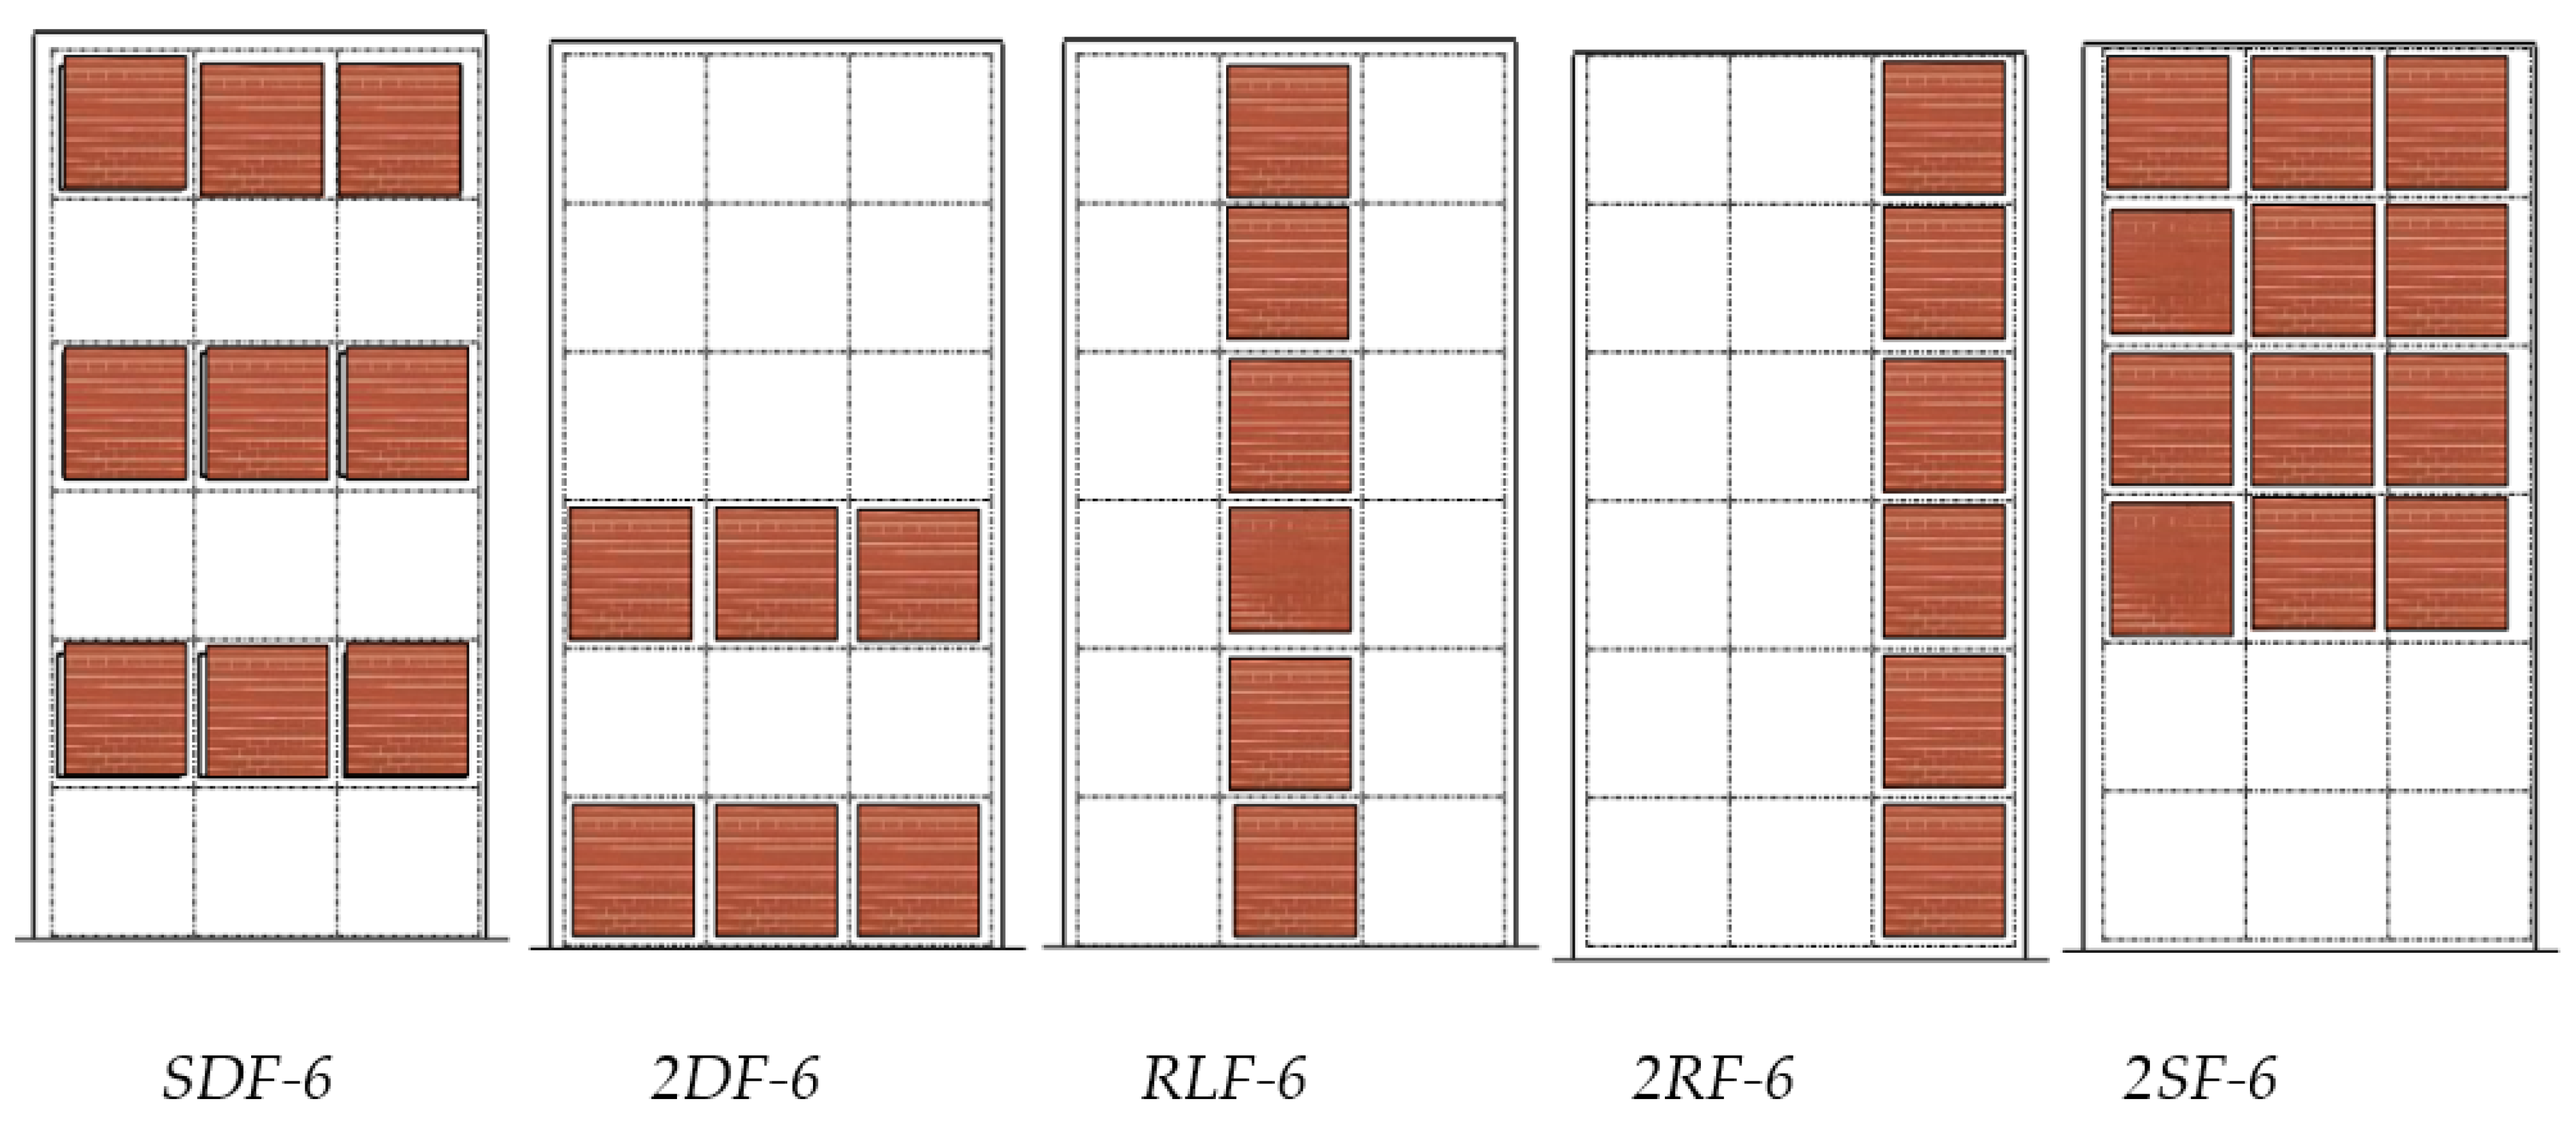
The models developed as shown in Figure 5 are: (1) frame without infill (BF); (2) building with masonry infill (FF); (3–5) building with masonry infill except for the ground, second, third story (SF), (2SF), (3SF); (6) building completely infilled except along the first bays (RF); (7) building fully infilled except along the middle bays (MF); (8) building infilled except along the first and third bay (RLF); (9) building fully infilled except along the first and second bay (2RF); (10) model of building filled in with masonry without infill on the 4th, 5th, 6th stories (UF); (11) building model filled in with masonry without infill on the 2nd, 4th, 6th stories (DF). (12) building model filled in with masonry without infill on the 1st, 3rd, 5th stories (SDF); (13) model of building filled in with masonry without infill on the 2nd, 4th, 5th, 6th stories (2DF); (14) model of building filled in with masonry without infill on the 3rd, 4th, 5th stories (MHF); (15) buildings infilled randomly (MXFF).
In the following, the results of the progressive pushover analyses performed, in the longitudinal X direction, on the 15 models presented in Figure 6, are presented and discussed. In addition, the evaluation of the effect of the presence of the infill and the flexible story and their height locations on the non-linear responses of reinforced concrete portal frame buildings is examined and compared.
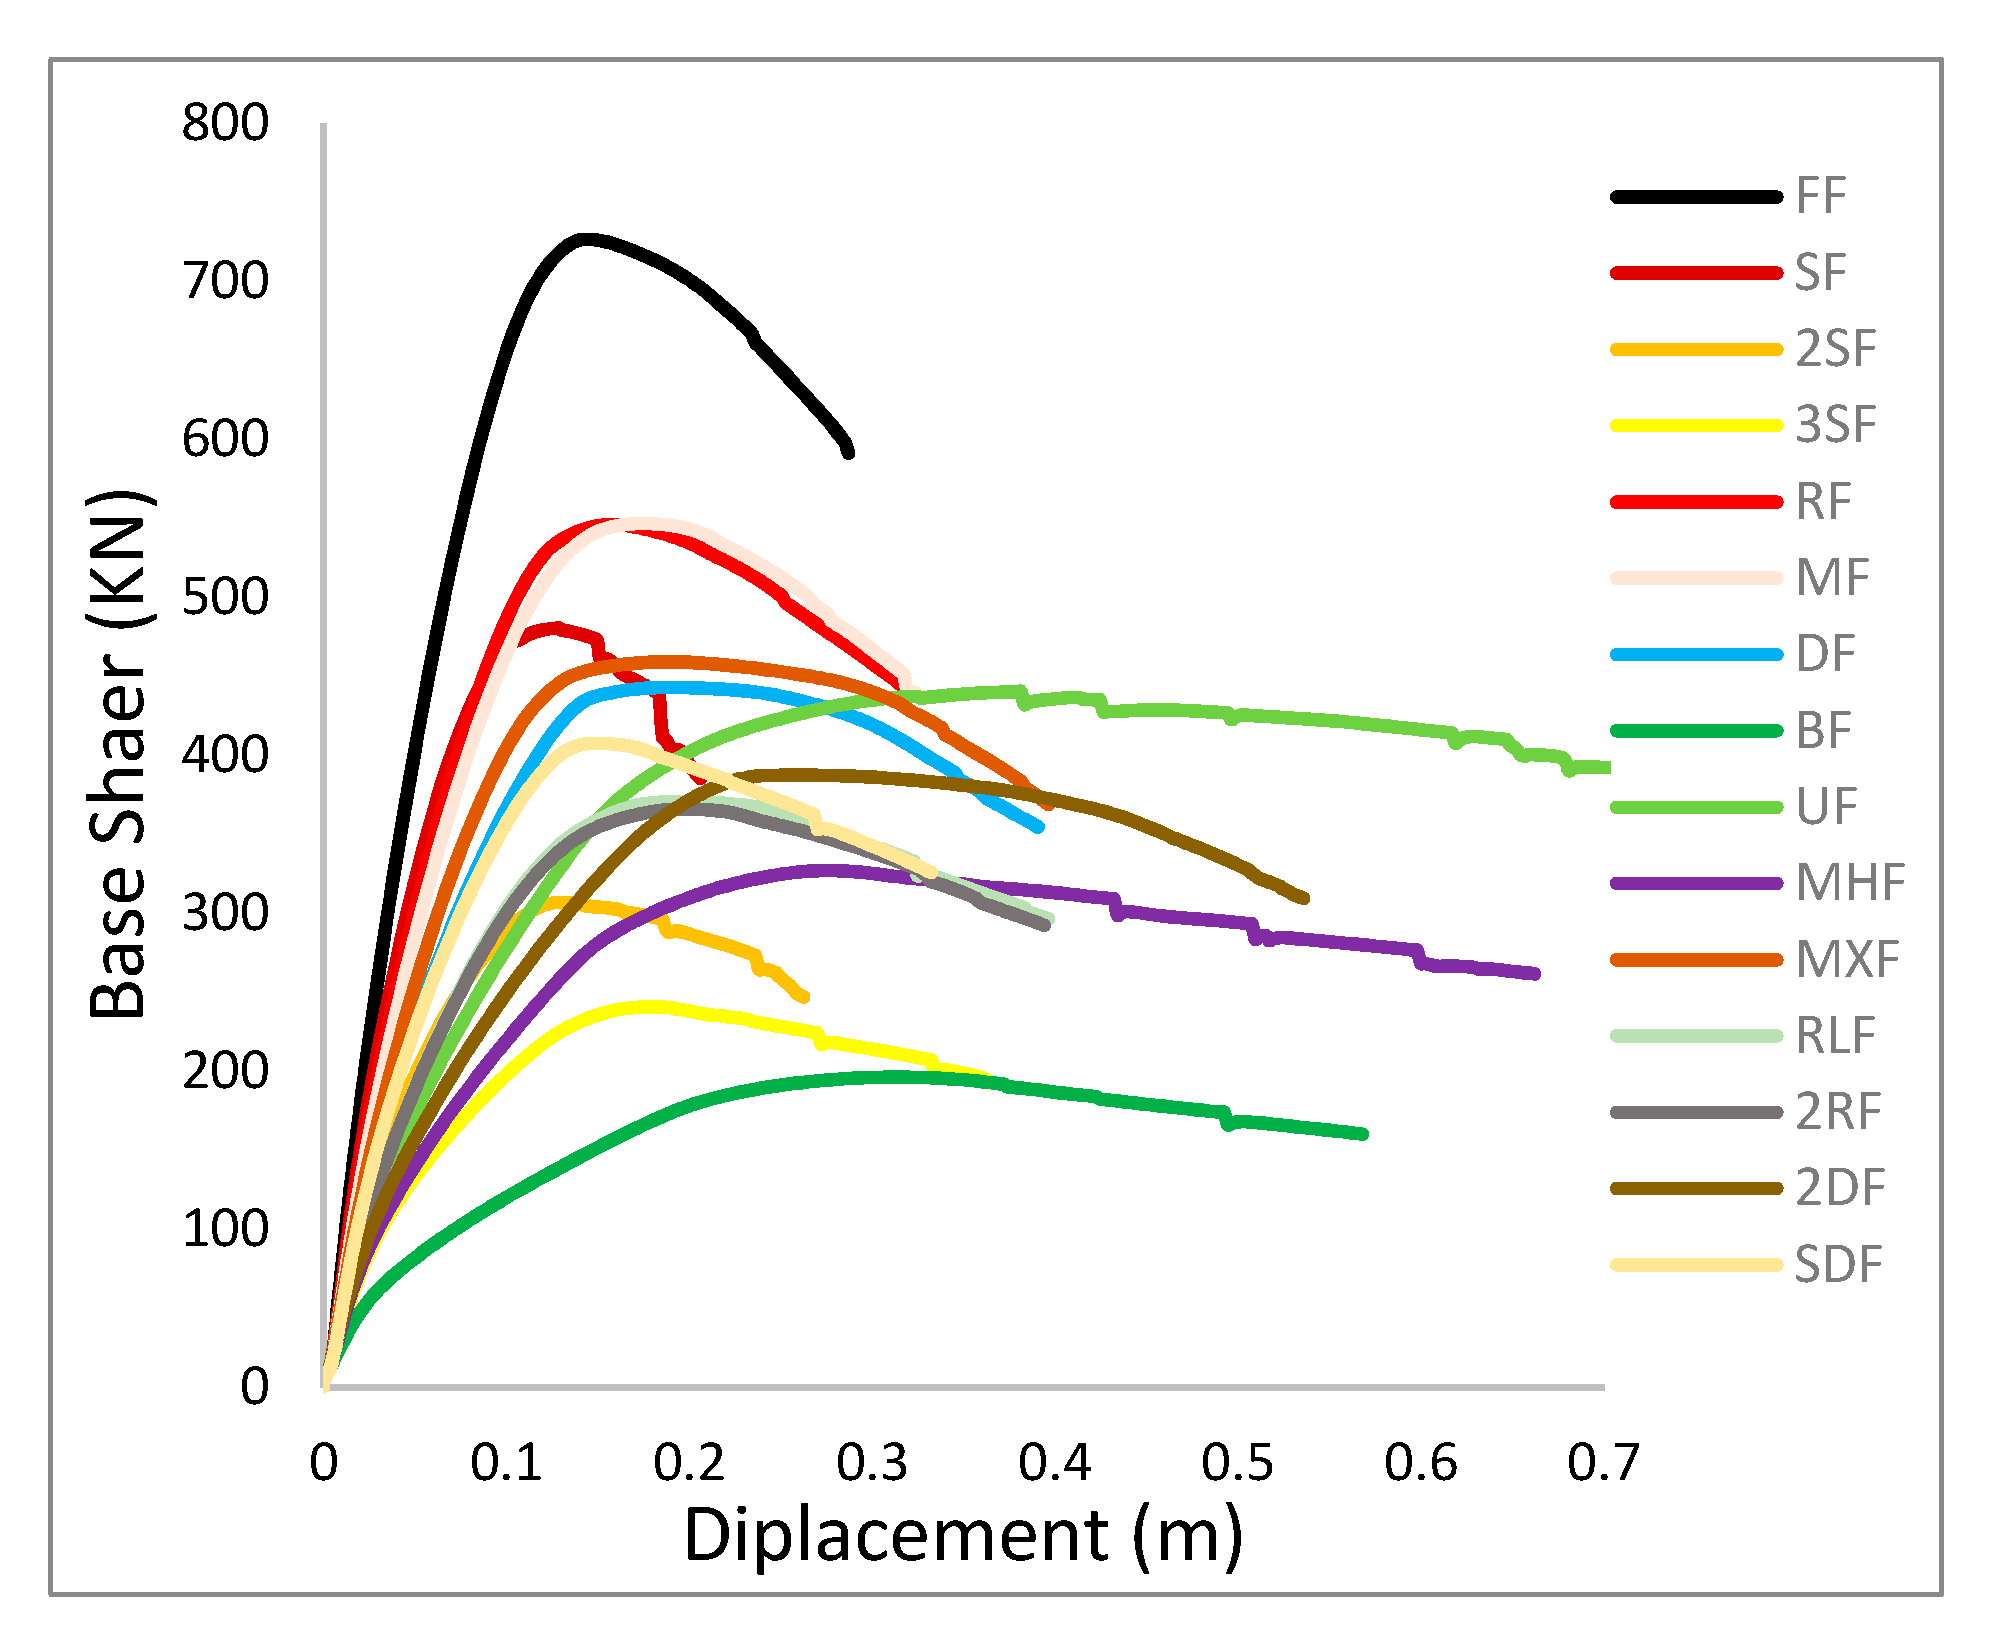
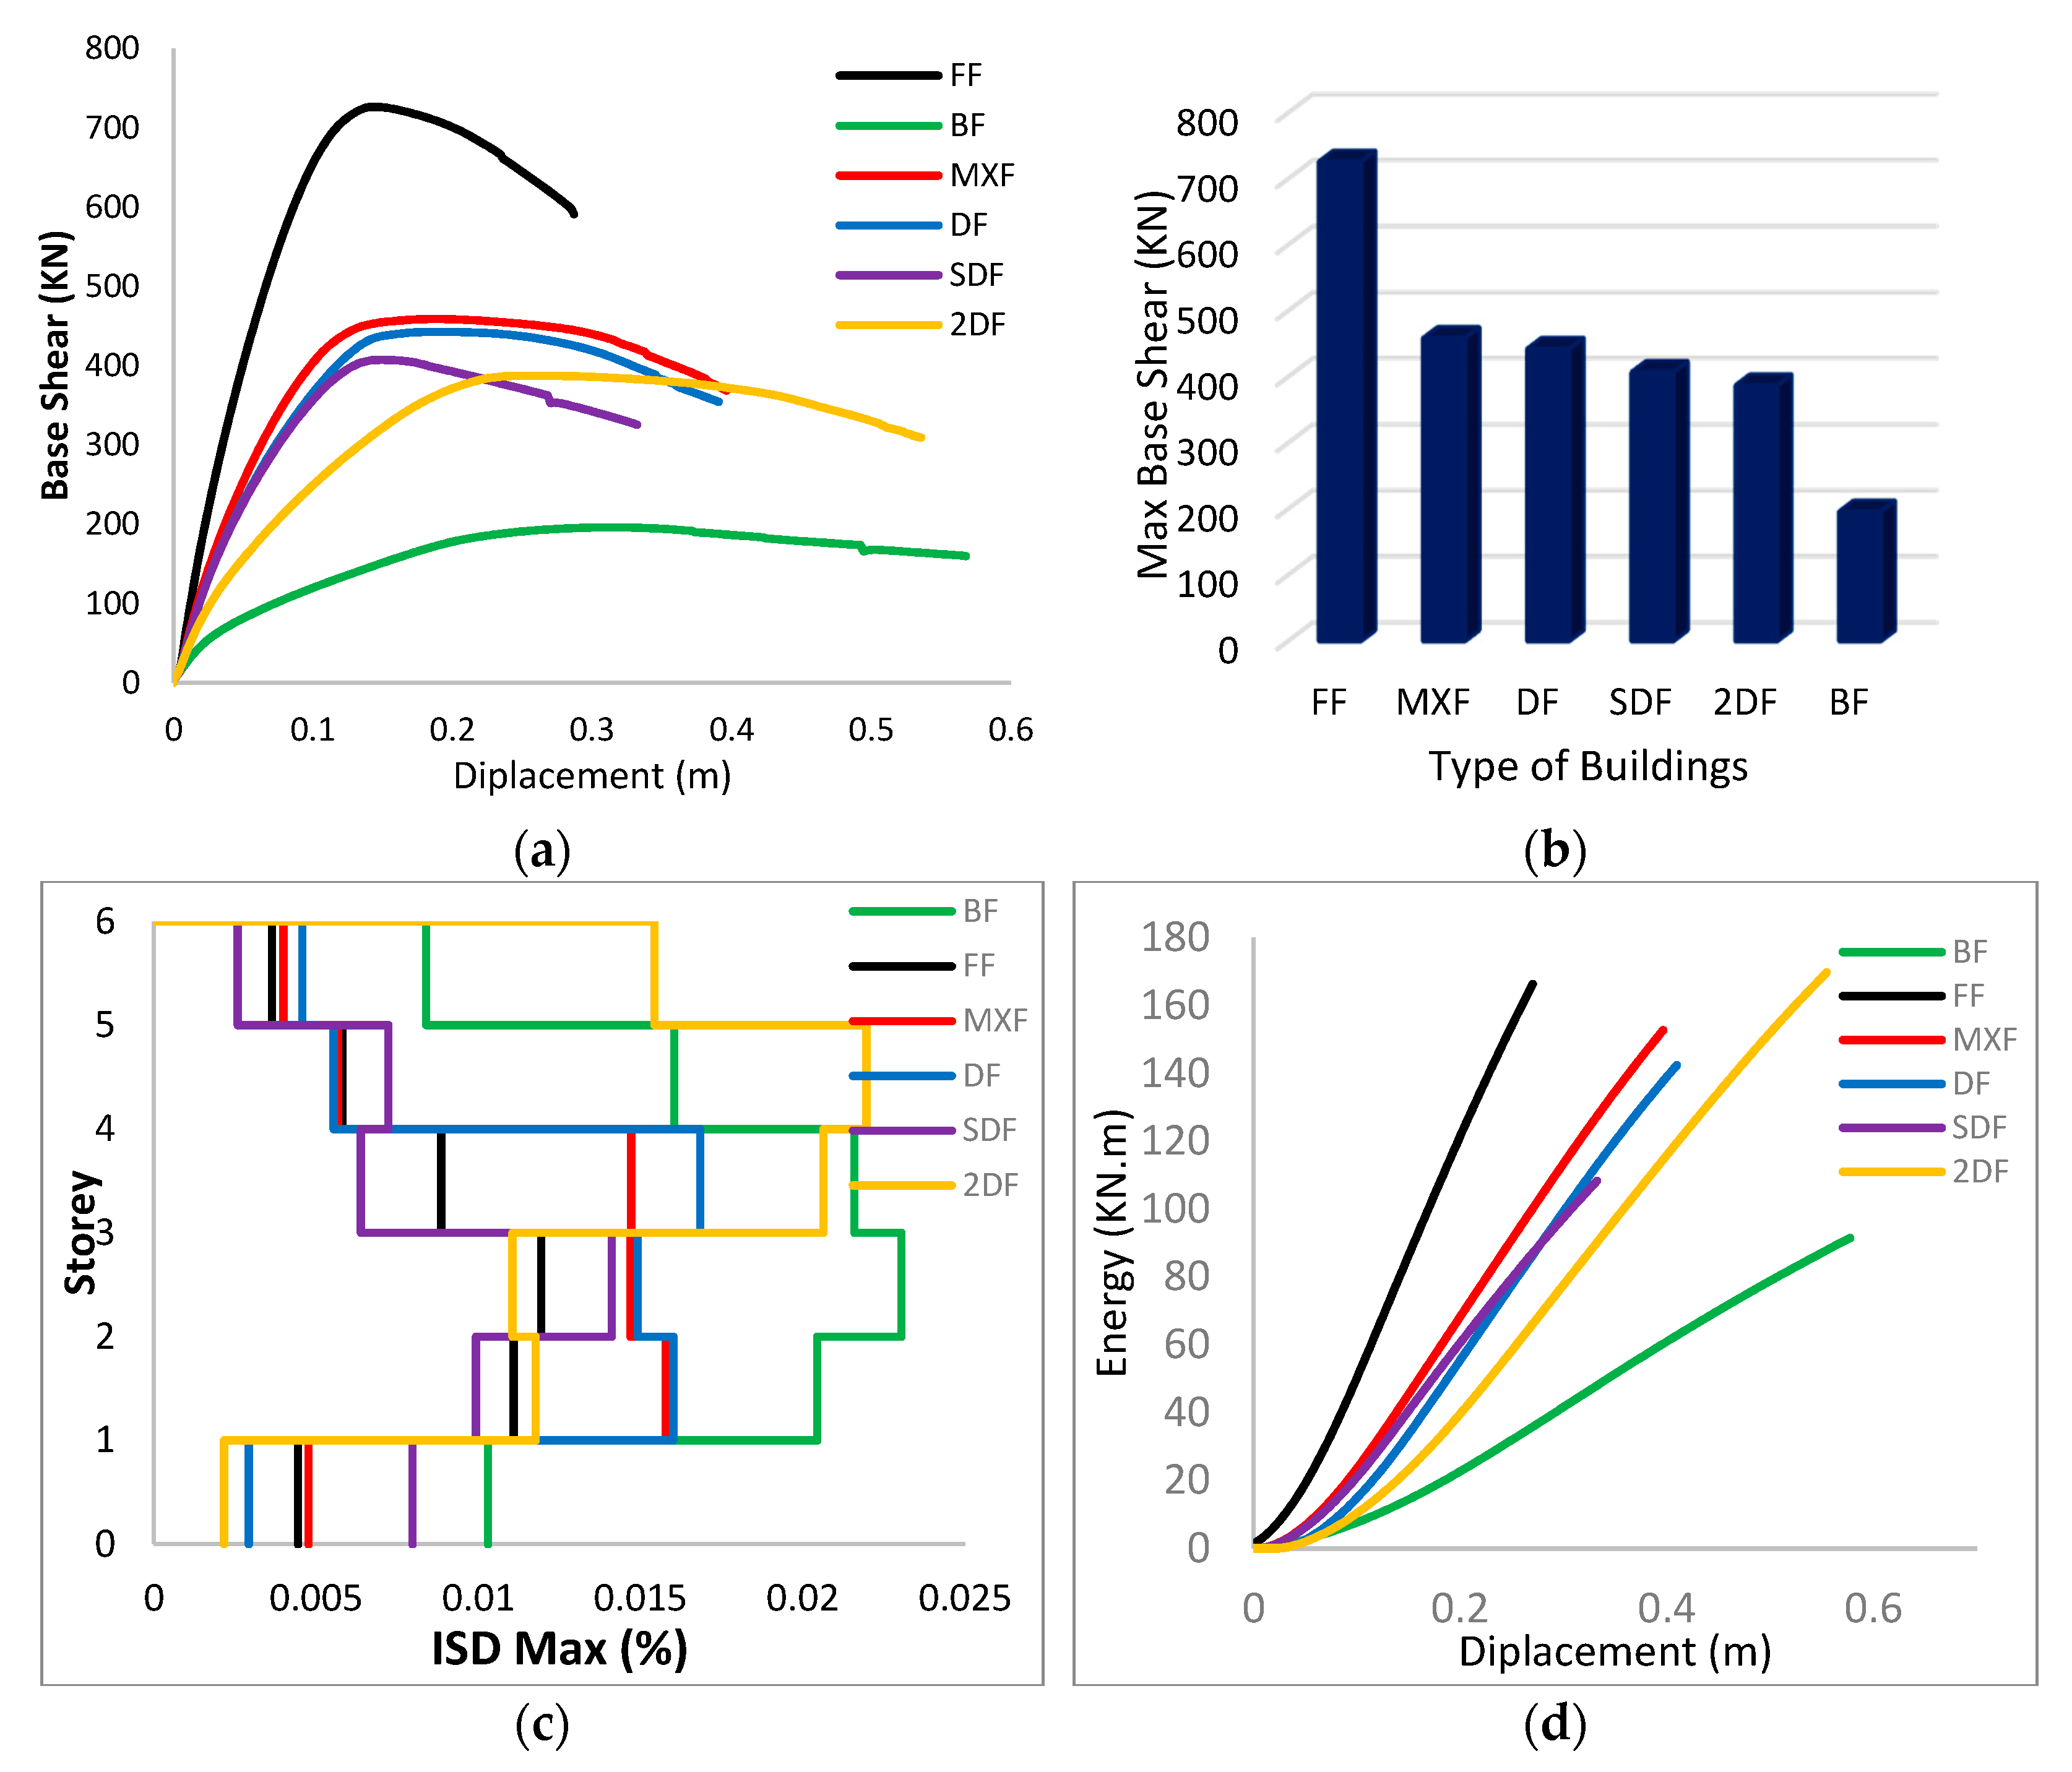
Figure 6 shows the capacity curve of the study’s buildings; as a first observation, a fundamental difference can be noted directly in the structural response of the studied cases from the other cases that represent the bare frame and the infilled frame, as the lateral shift was accompanied by a deviation from centralization after the force subsides, which highlights the negative effect of the heterogeneous distribution of building walls.
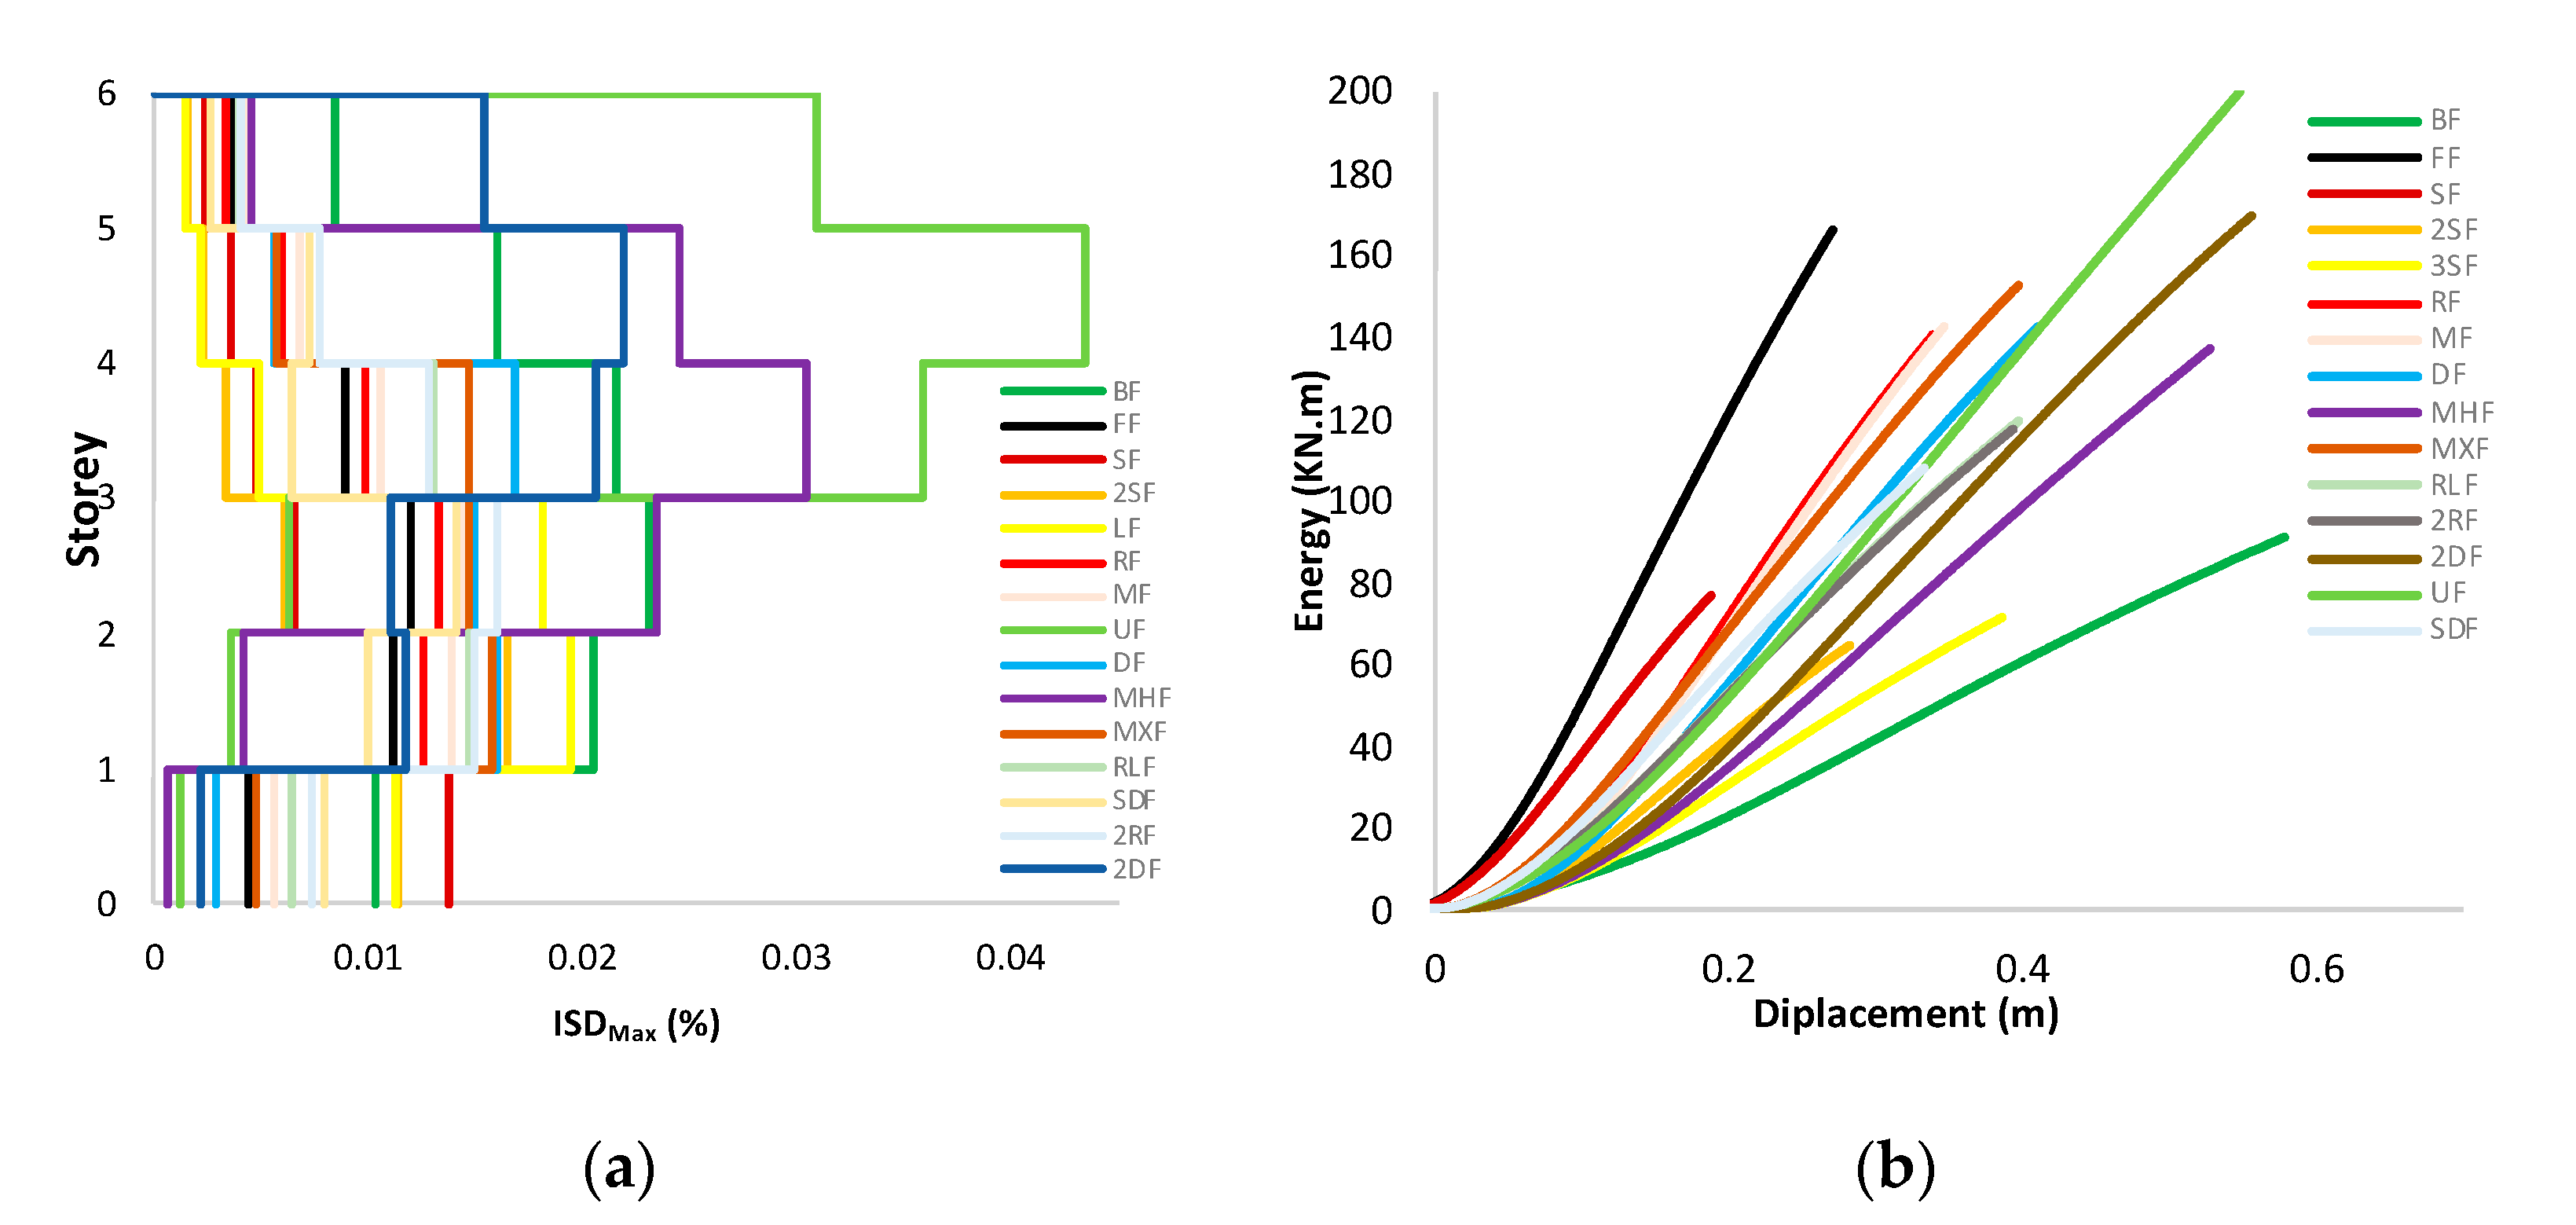
Figure 7a shows the structural response of the maximum ISD for each story for the cases studied and Figure 7b shows the damping plastic deformational energy in each model. It was observed that the infill walls participated in the frame’s energy damping in all models.
A great disparity between the proportions of the ISD values in the studied models appears as a result of the heterogeneity of the distribution of the infill walls in the frame, as the maximum ISD values in the infill frame model did not exceed 0.012 m, while none of the maximum ISD values in the rest of the models were less than 0.015 m to 0.045 m, even the bare frame, which is considered the least rigid, in which the story displacements did not exceed the 0.023 m limit.
Table 5 shows the values of maximum top displacement, maximum base shear, maximum inter-story drift and the energy of the plastic deformation damping by the building for the models studied.
For the studied models, the approved output values (base shear, top displacement, ISDMax, energy) were attributed to the corresponding values in the bare frame model to obtain a direct comparison between each case and the case in the bare frame, in addition to the ability to compare between each of the cases of infill wall with the other cases of infill, as shown in Table 6.
It is difficult to observe the differences between the infill models, so the comparison was made in a more effective way, considering the base of the bare frame values and the models were divided into groups that converge on the type of effect as shown in the following Table 7.

4.3.1. Case N°:1

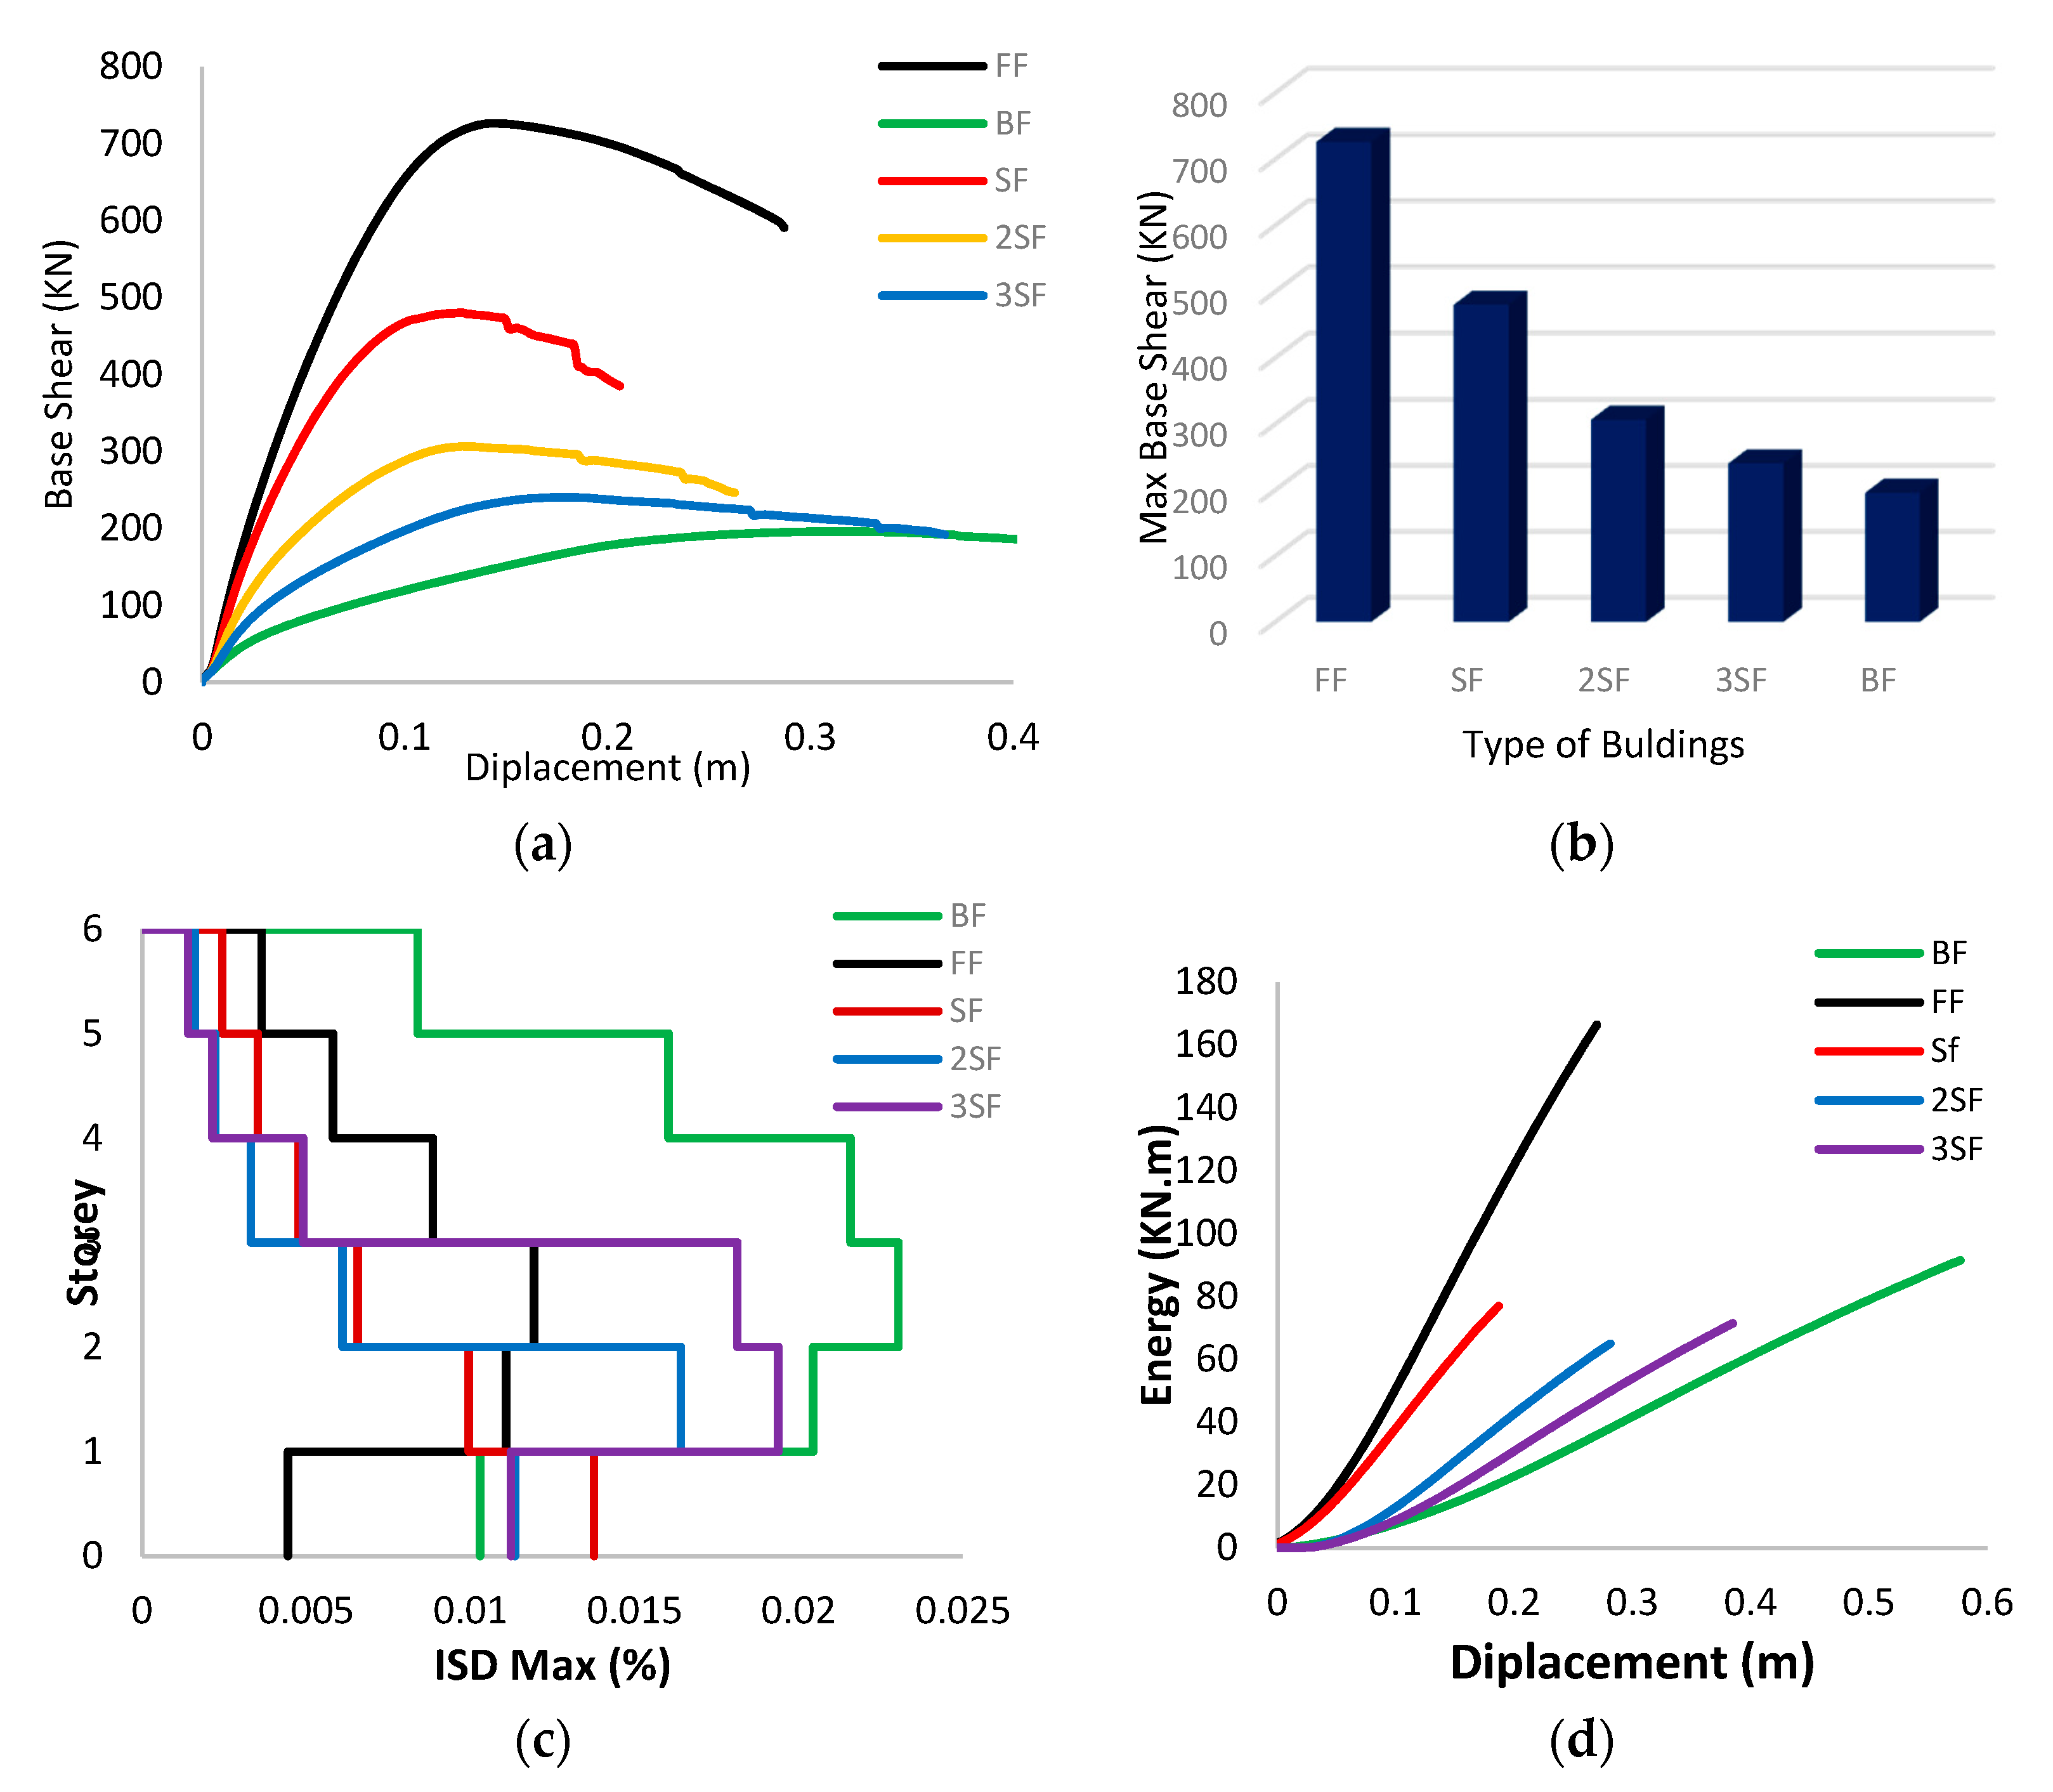
From Figure 8, which represents the capacity curve Figure 8a, the maximum base shear values Figure 8b, the maximum ratio ISD Figure 8c and the energy absorbed curve of the building Figure 8d, it can be noted that regarding the full frame, there was a significant increase in the base shear, reaching more than double 278%, while the top displacement of the building decreased by 54%, and this indicates a significant increase in the lateral stiffness of the structure.
Also, looking at the percentage of energy absorbed by the full infill, a relative height of 82% was recorded. This indicates that the source of energy that the structure added is through the infill walls. Also, the ISD max is small, indicating homogeneity in the origin’s behavior. In the three SF, 2SF and 3SF models, and referring to Figure 8 and Table 7, it is noted that the displacement ratio decreased by 59%, 59% and 43%, while the percentage of the base shear increased by 150%, 60% and 25% for SF, 2SF and 3SF, respectively, and the rate of energy absorbed by the origin decreased by 29%, 22% 16%, and this is due to the absence of masonry walls in the soft story and the low transmission, especially at the breaking point corresponding to 80% of the base shear, which explains the contribution of the infill walls to energy absorption being very little and the occurrence of collapse at a lower displacement.
It is also noted that the maximum ISD on the first story is relatively large and increases with the increase of the soft stories, where an increased rate of 15.97%, 37.82% and 63.03% was achieved compared to the full frame.

4.3.2. Case N°:2

From Figure 9, which represents the capacity curve Figure 9a, the maximum base shear Figure 9b, the maximum ISD Figure 9c, and the energy absorbed curve of the building Figure 9d, it can be noted that:
For the frame RF and MF, a significant increase in the lateral stiffness, around 184%, was observed for each of the buildings when compared to the bare frame, and a decrease in the displacement for maximum strength ratio by 50% and 45%, respectively, was observed, due to the presence of the infill walls in the first and second bays for structure RF and the first and third bays for building MF.
Additionally, for the RLF and 2RF buildings, half the percentage increase in the global stiffness of the buildings RF and MF compared to the bare frame estimated at 93% and 90% and a decrease in the transmission ratio by 38% and 37%, respectively, due to the low percentage of the contribution of the infill walls in the two buildings and their impact on the overall response of the building due to the presence of these walls at the level of the first bays in building RF, and the pedestal in the building MF, were recorded. This is explained by the effect of the presence of infill walls in the building on the increase in the strength of buildings and displacement reduction.
Also, looking at the percentage of energy absorbed by the buildings compared to the bare frame, a significant increase of around 54% and 56% for the RF and MF buildings and 31% and 28% for the two buildings, RLF, 2RF, respectively, was recorded, and this is due to the percentage of the infill walls’ contribution to the increase in energy scattering.
It can be also highlighted that there is a significant decrease in the maximum Inter-Story Drifts in the RF and MF buildings compared to the bare frame by an estimated percentage of 43% and 37%, respectively, and an equal percentage estimated at 30% for the two buildings, RLF and 2RF. This is explained by the effect of the proportion of the contribution of the infill walls to reducing the maximum ISD values through the increase in the stiffness of the buildings.

4.3.3. Case N°:3

From Figure 10, which represents the capacity curve Figure 10a, the maximum base shear values Figure 10b, the maximum ISD ratio Figure 10c, and the energy absorbed curve of the building Figure 10d, it can be observed that:
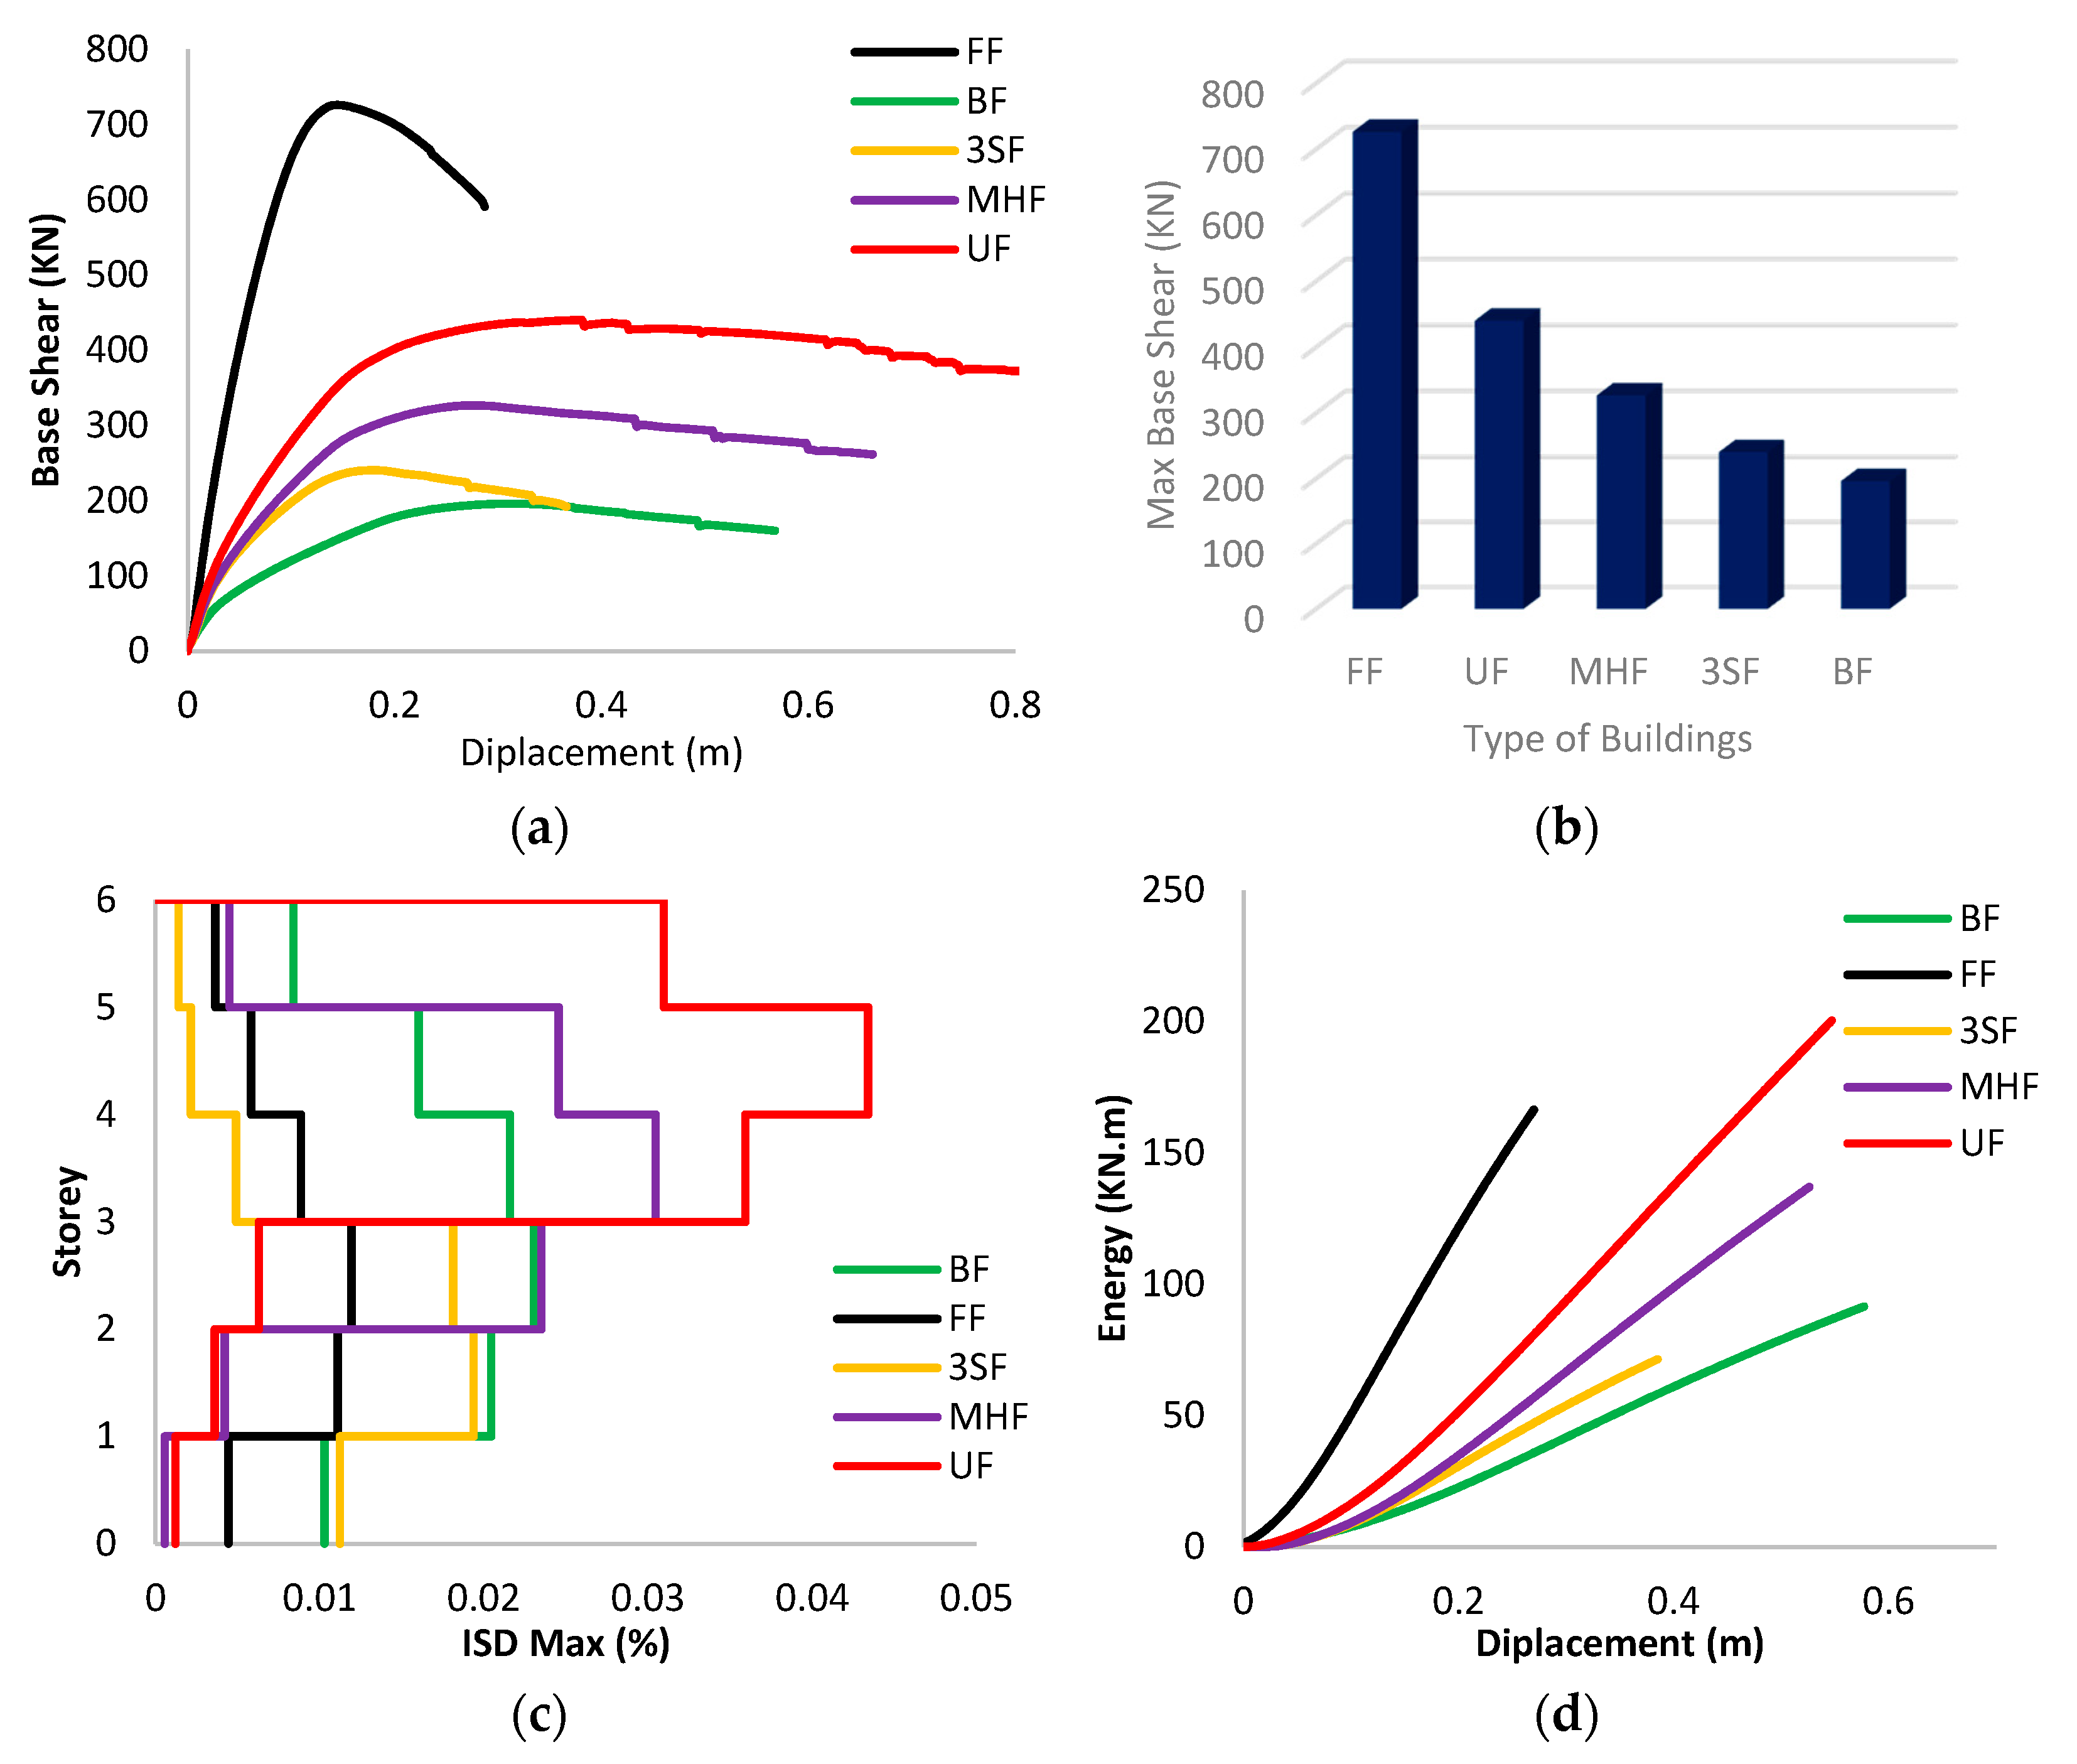
For the building 3SF, a decrease in the base shear value of up to 66% compared to the infilled frame was found. In comparison, there was an increase in the upper displacement ratio of 25%, and this is due to the absence of infill walls in the first three stories and the beginning of a mechanical collapse of the bare stories, as well as for the UF frame, a decrease in the base shear value by 39% due to the absence of infill walls in the last three stories was observed, which led to a decrease in the severity of the building. However, the effect of this is a significant increase of 166% in the top displacement of the building, and this is due to the building gaining softness at the level of the last three stories that do not contain infill walls. For the MHF frame, a significant decrease in the maximum base shear estimated at 54% was observed. As for the top displacement, a significant increase was noticed, estimated at 92%, due to the absence of filling walls on the third, fourth and fifth stories.
Also, considering the percentage of energy absorbed by the building compared to the bare frame, a large height of 118% was recorded for the UF building due to the presence of masonry walls in the first three stories and a mechanical occurrence that forms plastic hinges in the last three stories, and this indicates that the source of damping energy is due to the infill walls in the first place and the plastic hinges that are formed before collapsing in the second.
As for the MHX building, a significant increase in energy absorbed was recorded, estimated at 50%, due to the infill walls on the first, second and last stories. Its absence in the rest of the stories gave the building ductility. It confirmed that the source of energy that is extinguished by the building is through the infill walls in the first stories and plastic hinges that are formed before the collapse of the building.
A big increase in the maximum ISD ratio in the UF and MH building compared to the filled frame by 264% and 156%, respectively, was observed, and this is explained by the absence of filling walls on the three floors of each building, which gave the building softness at the level of these stories.

4.3.4. Case N°:4

From Figure 11, which represents the capacity curve Figure 11a, the maximum base shear values Figure 11b, the maximum ratio ISD Figure 11c, and the energy absorbed curve of the building Figure 11d, it can be noted:
For the building 3SF, a decrease in the base shear value of up to 66% compared to the infilled frame was found. In comparison, an increase in the upper displacement ratio by 25% was recorded, and this is due to the absence of infill walls in the first three stories and the beginning of a mechanical collapse of the bare stories. Additionally, for the UF frame, a decrease in the base shear value by 39% was recorded due to the absence of infill walls in the last three stories, which led to a decrease in the severity of the building. However, the effect of this is a significant increase by 166% in the top displacement of the building, and this is due to the building gaining softness at the level of the last three stories that do not contain infill walls. For the MHF frame, a significant increase in the maximum base shear was observed, estimated at 54%. As for the top displacement, a significant increase was noted, estimated at 92% due to the absence of filling walls on the third, fourth and fifth stories.
Also, considering the percentage of energy absorbed by the building compared to the bare frame, a large height of 118% was recorded for the UF building due to the presence of masonry walls in the first three stories and a mechanical occurrence that forms plastic hinges in the last three stories, and this indicates that the source of damping energy is due to the infill walls in the first place and the plastic hinges that are formed before collapsing in the second.
As for the MHX building, a significant increase in the absorbed energy was recorded, estimated at 50%, due to the infill walls on the first, second and last stories. Its absence in the rest of the stories gave the building ductility. It confirmed that the source of energy that is extinguished by the building is through the infill walls in the first stories and plastic hinges that are formed before the collapse of the building.
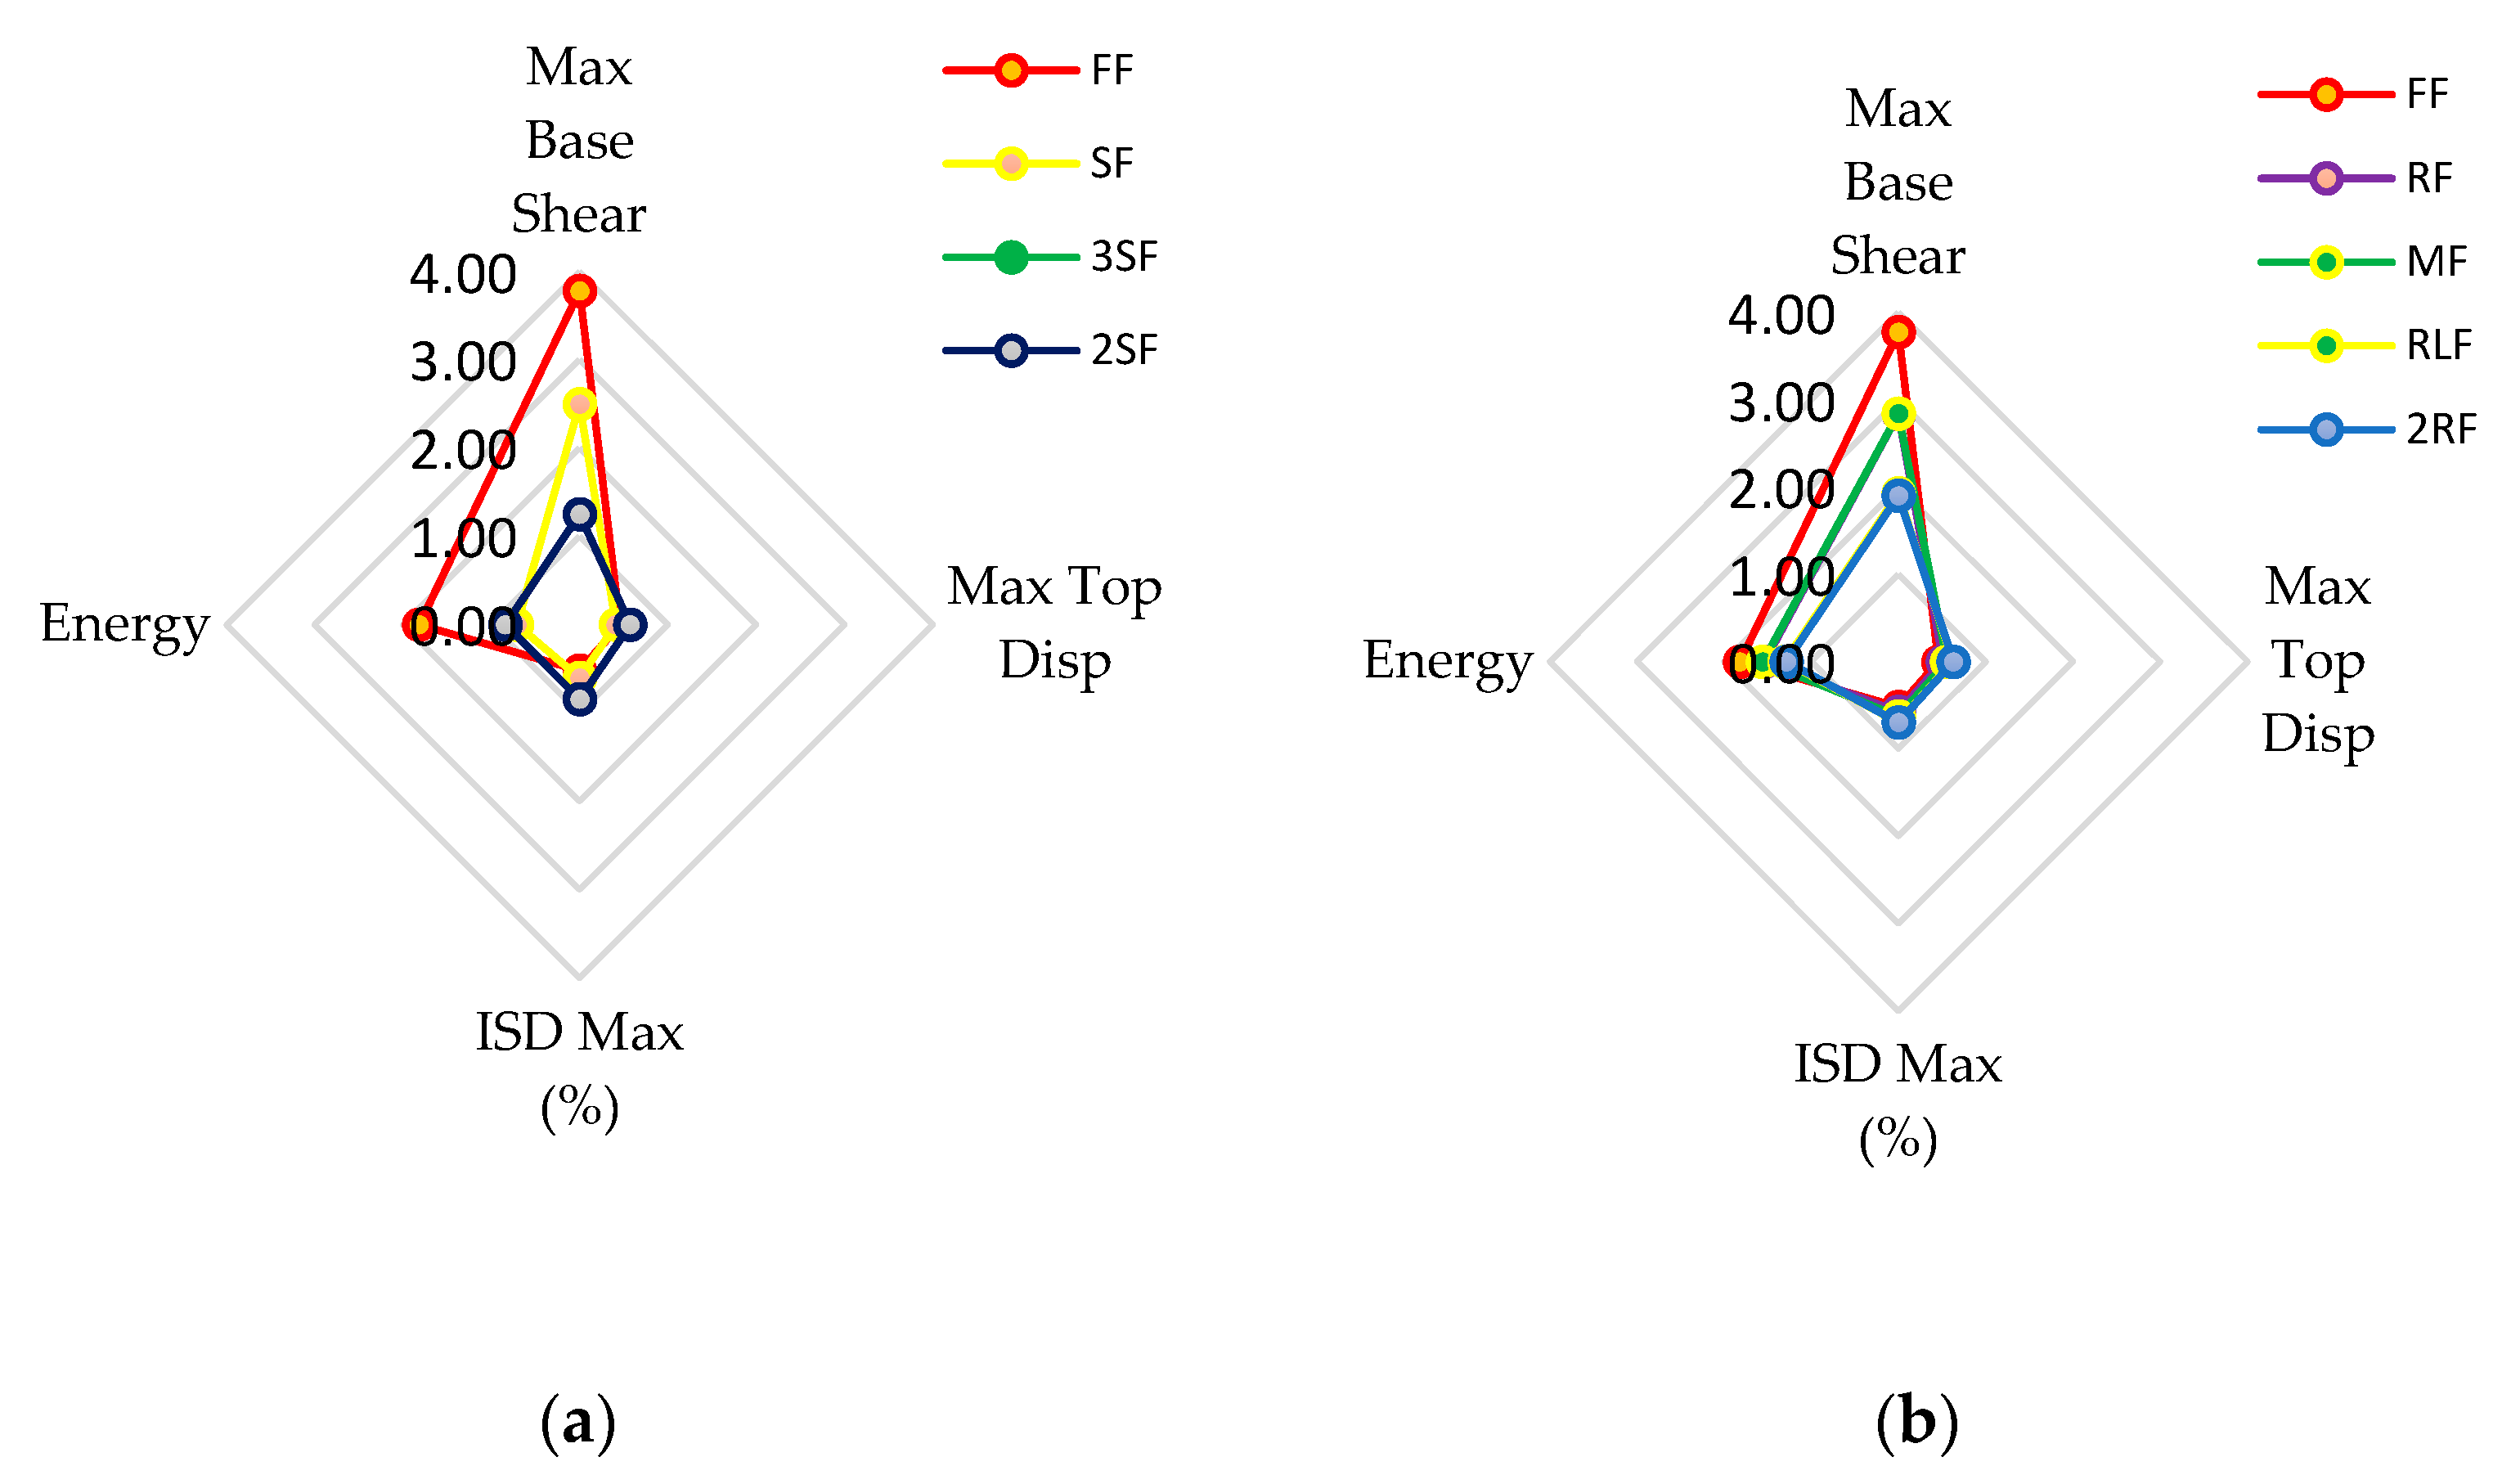
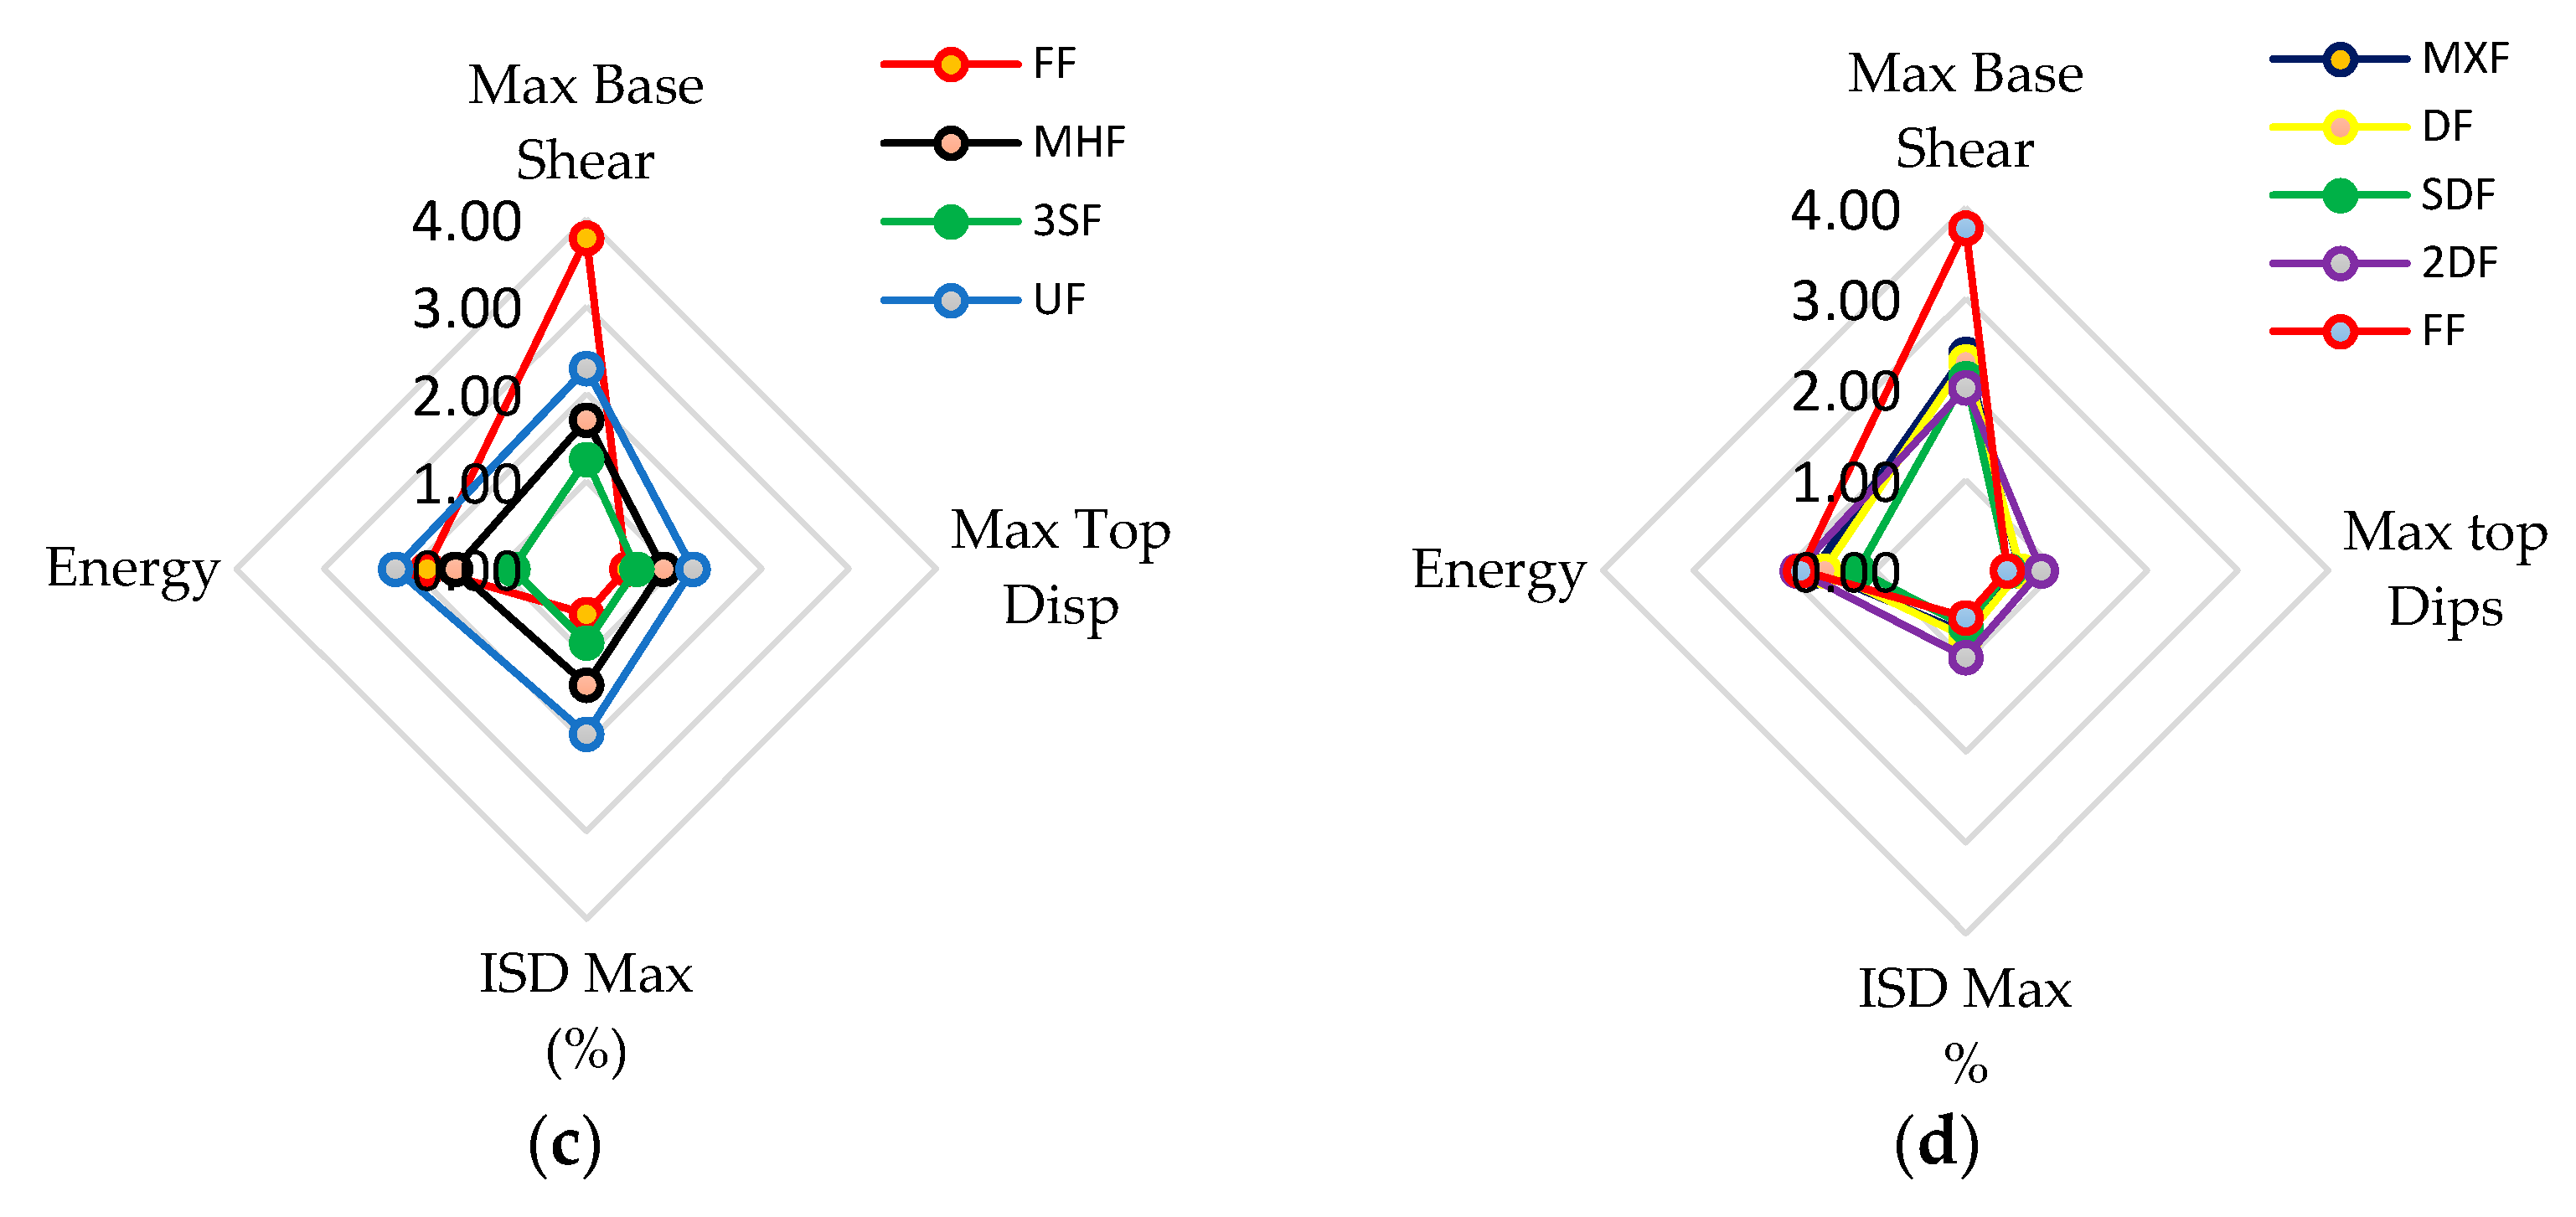
A significant increase was also observed in the maximum ISD ratio in the UF and MH building compared to the filled frame by 264% and 156%, and this is explained by the absence of filling walls on the three floors of each building, which gave the building softness at the level of these stories. Each line of Table 1 was represented with an axis on a diagram shown in the following Figure 12, where as long as the output values of these lines are relative to the output values of the bare frame, there will be no discrepancy that prevents us from noticing the resulting differences between all the outputs at once and in one table, as shown in the figures.

5. Final Remarks

In recent years, with the observation of damage reported to buildings during earthquakes, research efforts have been devoted to studying the effect of the infill walls on the structural response of multi-story buildings, where the studies have confirmed that the presence of infill walls may affect or interfere with the behaviors of the construction system during an earthquake. However, even though a vast body of research has addressed the interactive behaviors between infill and RC frames, few studies have examined the effects of the irregular distribution of infill walls over the height of buildings. Therefore, it may be necessary to study the impact of this interference to find out the extent of its impact on the behaviors of the building when an earthquake occurs.
This study aims to conduct an analytical study to verify the effect of the variability of the presence of infill walls on the behavior of these buildings on the lateral loads, and important results were drawn regarding the distribution of these walls in multi-story buildings, which may be better taken into consideration in the future. The main conclusions that can be drawn from this study can be summarized as follows:
  • The results of the pushover analysis show an increase in the initial stiffness and resistance capacity for the full infill frame compared to the bare frame, despite the brittle failure modes of the masonry wall. The presence of masonry walls has a significant effect on the observed collapse mechanism.
  • The size of the openings in the infill walls has a significant influence on the stiffness. Generally, it decreases as the size of the opening increases, indicating that the decrease in stiffness is more important than the decrease in mass.
  • The infill panels increase the lateral stiffness of the frames, the presence of openings reduces the lateral stiffness of the frame, and with the increase in the size of the openings, the deformation capacity increases; in general, the bare frame shows better ductility than the infill walls frame; this can be attributed to the brittle behavior of masonry infill panels.
  • It appears on the one hand that the masonry increases the lateral load-bearing capacity and reduces the deformation demand, which can reduce the damage in the structures; on the other hand, an irregular distribution of the masonry can result in the relatively fragile behavior of the structure. The failure modes of the bare frames are distributed over the height of the structures; in the case of the infilled frames, the failure modes are concentrated in the lower levels.
  • The infill walls distributed homogeneously over the entire height of the building, such as FF, or the alternating distribution over the entire height of the building leads (as an example: RF, MF), to an increase in the stiffness of the structural system, and thus, a decrease in the desired ductility in the disposal of the structure before reaching the collapse.
  • The ratio of the contribution of the infill walls affects the energy damping, as changing the distribution of the infill walls over the entire height of the building would increase the amount of energy absorbed by the buildings, by controlling the collapse mechanism associated with the shape of this distribution (how plastic hinges are formed).
  • The change in the distribution of infill walls, while maintaining their number in the building, has a major role in changing the percentage of building walls’ contribution to bearing the base shear.
  • The change in the number of masonry infill walls in the building plays a major role in changing the values of the contribution ratio, as the percentage of the building walls’ contribution to bearing the base shear increases with the increase in the number of masonry walls in the building.
  • The percentage of building walls’ contribution to the bearing of the base shear is mainly related to the number and distribution of the filling walls.
From the results obtained, it appears that the infill masonry walls must be considered in a non-linear analysis because they tend to drastically modify the seismic response of structures, and it is desirable that in future versions of the RPA, specific provisions be dedicated to the effects of infill. Future research work should be done to consider the irregular distributions of the infill masonry walls in the plan, with 3D models, to understand the influence of the irregular distribution of infill masonry walls in the torsional behavior of the buildings.

Author Contributions

Conceptualization, A.M., R.C., H.M. and H.R.; methodology, A.M., R.C., H.M. and H.R.; validation, A.M., H.M.; formal analysis, A.M.; investigation, A.M., R.C. and H.M.; writing—original draft preparation, A.M.; writing—review and editing, R.C., H.M. and H.R.; supervision, A.M. and H.R. All authors have read and agreed to the published version of the manuscript.

Funding

The first author acknowledged the financial support of the Algerian Ministry of Higher Education and Scientific Research. Exceptional National Program 2019/2020, through the PhD grant (PNE 675, 2020, Portugal).

Conflicts of Interest

The authors declare no conflict of interest.

References

  1. Uva, G.; Porco, F.; Fiore, A. Appraisal of masonry infill walls effect in the seismic response of RC framed buildings: A case study. Eng. Struct. 2012, 34, 514–526. [Google Scholar] [CrossRef]
  2. Uva, G.; Raffaele, D.; Porco, F.; Fiore, A. On the role of equivalent strut models in the seismic assessment of infilled RC buildings. Eng. Struct. 2012, 42, 83–94. [Google Scholar] [CrossRef]
  3. Gong, M.; Zuo, Z.; Wang, X.; Lu, X.; Xie, L. Comparing seismic performances of pilotis and bare RC frame structures by shaking table tests. Eng. Struct. 2019, 199, 109442. [Google Scholar] [CrossRef]
  4. Romão, X.; Costa, A.; Paupério, E.; Rodrigues, H.; Vicente, R.; Varum, H. Field observations and interpretation of the structural performance of constructions after the 11 May 2011 Lorca earthquake. Eng. Fail. Anal. 2013, 34, 670–692. [Google Scholar] [CrossRef]
  5. Mohamed, H.; Xavier, R. Robust calibration of macro-models for the in-plane behav-ior of masonry infilled RC frames. J. Earthq. Eng. 2021, 25, 407–433. [Google Scholar] [CrossRef]
  6. Mazza, F.; Mazza, M. A Numerical Model for the Nonlinear Seismic Analysis of Three-Dimensional RC Frames. In Proceedings of the 14th World Conference on Earthquake Engineering, Beijing, China, 12–17 October 2008. [Google Scholar]
  7. Mazza, F. Base-isolation of a hospital pavilion against in-plane-out-of-plane seismic collapse of masonry infills. Eng. Struct. 2020, 228, 111504. [Google Scholar] [CrossRef]
  8. Rayegani, A.; Nouri, G. Application of Smart Dampers for Prevention of Seismic Pounding in Isolated Structures Subjected to Near-fault Earthquakes. J. Earthq. Eng. 2020, 26, 4069–4084. [Google Scholar] [CrossRef]
  9. Memari, A.M.; Aliaari, M. Seismic Isolation of Masonry Infill Walls. In Proceedings of the Structures Congress 2004, Nashville, TN, USA, 22–26 May 2004. [Google Scholar] [CrossRef]
  10. Tsantilis, A.V.; Triantafillou, T.C. Innovative seismic isolation of masonry infills using cellular materials at the interface with the surrounding RC frames. Eng. Struct. 2018, 155, 279–297. [Google Scholar] [CrossRef]
  11. Jin, W.; Zhai, C.; Kong, J.; Liu, W.; Zhang, M. In-plane and out-of-plane quasi-static tests on RC frames with a new type of frame-isolated infills. Eng. Struct. 2021, 246, 113079. [Google Scholar] [CrossRef]
  12. Lyu, H.; Deng, M.; Han, Y.; Ma, F.; Zhang, Y. In-plane cyclic testing of full-scale reinforced concrete frames with innovative isolated infill walls strengthened by highly ductile concrete. J. Build. Eng. 2022, 57, 104934. [Google Scholar] [CrossRef]
  13. Centre de National Recherche Appliquee En Genie Parasismique. Regles Parasismiques Algeriennes RPA 99/Version 2003; Edition CGS; Centre de National Recherche Appliquee En Genie Parasismique: Alger, Algeria, 2003. [Google Scholar]
  14. Centre Scientifique et Technique du Batiment. Règles Techniques de Conception et de Calcul des Ouvrages et Constructions en Béton armé, Suivant la Méthode des états Limites: Règles BAEL 91, Révisées 99; Centre Scientifique et Technique du Batiment, Eyrolles: Paris, France, 2001; ISBN 978-2-212-10013-6. [Google Scholar]
  15. Dias-Oliveira, J.; Rodrigues, H.; Asteris, P.G.; Varum, H. On the Seismic Behavior of Masonry Infilled Frame Structures. Buildings 2022, 12, 1146. [Google Scholar] [CrossRef]
  16. Mallick, D.V.; Severn, R.T. The Behaviour of Infilled Frames under Static Loading. Proc. Inst. Civ. Eng. 1967, 38, 639–656. [Google Scholar] [CrossRef]
  17. Mallick, D.; Garg, R. Effect of Openings on the Lateral Stiffness of Infilled Frames. Proc. Inst. Civ. Eng. 1971, 49, 193–209. [Google Scholar] [CrossRef]
  18. Mehrabi, A.B.; Shing, P.B. Performance of masonry- infilled RC frames under in-plane lateral loads: Analytical modeling. In Proceedings of the NCEER Workshop on Seismic Response of Masonry, San Francisco, CA, USA, 4–5 February 1994. [Google Scholar]
  19. Lourenco, P.B.; Rots, J.G. Multisurface Interface Model for Analysis of Masonry Structures. J. Eng. Mech. 1997, 123, 660–668. [Google Scholar] [CrossRef]
  20. Oliveira, D.; Lourenço, P. Implementation and validation of a constitutive model for the cyclic behaviour of interface elements. Comput. Struct. 2004, 82, 1451–1461. [Google Scholar] [CrossRef]
  21. Koutromanos, I.; Stavridis, A.; Shing, P.B.; Willam, K. Numerical modeling of masonry-infilled RC frames subjected to seismic loads. Comput. Struct. 2011, 89, 1026–1037. [Google Scholar] [CrossRef]
  22. Polyakov, S.V. On the interaction between masonry filler walls and enclosing frame when loaded in the plane of the wall. Transl. Earthq. Eng. 1960, 2, 36–42. [Google Scholar]
  23. Holmes, M. Steel Frames with Brickwork and Concrete Infilling. Proc. Inst. Civ. Eng. 1961, 19, 473–478. [Google Scholar] [CrossRef]
  24. Smith, B.S. Lateral Stiffness of Infilled Frames. J. Struct. Div. 1962, 88, 183–199. [Google Scholar] [CrossRef]
  25. Smith, B.S.; Carter, C.; Mallick, D. Discussion. A Method of Analysis for Infilled Frames. Proc. Inst. Civ. Eng. 1970, 46, 229–231. [Google Scholar] [CrossRef] [Green Version]
  26. Mainstone, R.J. Summary of Paper 7360. On The Stiffness and Strengths of Infilled Frames. Proc. Inst. Civ. Eng. 1971, 49, 230. [Google Scholar] [CrossRef]
  27. Mainstone, R.J.; Weeks, G.A. The Influence of a Bounding Frame on the Racking Stiffnesses and Strengths of Brick Walls. In Proceedings of the 2nd International Brick Masonry Conference, Building Research Establishment, Watford, UK, 12–15 April 1970; pp. 165–171. [Google Scholar]
  28. Saneinejad, A.; Hobbs, B. Inelastic Design of Infilled Frames. J. Struct. Eng. 1995, 121, 634–650. [Google Scholar] [CrossRef]
  29. Žarnić, R.; Gostič, S. Masomy infilled frames as an effective structural sub-assemblage. In Seismic Design Methodologies for the Next Generation of Codes; Routledge: New York, NY, USA, 2019; pp. 335–346. [Google Scholar]
  30. Dolšek, M.; Fajfar, P. The effect of masonry infills on the seismic response of a four-storey reinforced concrete frame—A deterministic assessment. Eng. Struct. 2008, 30, 1991–2001. [Google Scholar] [CrossRef]
  31. El-Dakhakhni, W.; Elgaaly, M.; Hamid, A.A. Three-Strut Model for Concrete Masonry-Infilled Steel Frames. J. Struct. Eng. 2003, 129, 177–185. [Google Scholar] [CrossRef]
  32. Crisafulli, F.J.; Carr, A.J. Proposed macro-model for the analysis of infilled frame structures. Bull. N. Z. Soc. Earthq. Eng. 2007, 40, 69–77. [Google Scholar] [CrossRef]
  33. Rodrigues, H.; Varum, H.; Costa, A. Simplified Macro-Model for Infill Masonry Panels. J. Earthq. Eng. 2010, 14, 390–416. [Google Scholar] [CrossRef]
  34. McKenna, F. OpenSees: A Framework for Earthquake Engineering Simulation. Comput. Sci. Eng. 2011, 13, 58–66. [Google Scholar] [CrossRef]
  35. O’Reilly, G.J.; Sullivan, T.J. Modeling Techniques for the Seismic Assessment of the Existing Italian RC Frame Structures. J. Earthq. Eng. 2017, 23, 1262–1296. [Google Scholar] [CrossRef]
  36. Scott, M.H.; Ryan, K.L. Moment-Rotation Behavior of Force-Based Plastic Hinge Elements. Earthq. Spectra 2013, 29, 597–607. [Google Scholar] [CrossRef]
  37. Scott, M.H.; Fenves, G.L. Plastic Hinge Integration Methods for Force-Based Beam–Column Elements. J. Struct. Eng. 2006, 132, 244–252. [Google Scholar] [CrossRef]
  38. Paulay, T.; Priestly, M.J.N. Seismic Design of Reinforced Concrete and Masonry Buildings, 1st ed.; John Wiley & Sons, Inc.: New York, NY, USA, 1992; p. 744. [Google Scholar]
  39. Menegotto, M.; Pinto, P.E. Method of analysis for cyclically loaded R.C. plane frames including changes in geometry and non-elastic behaviour of elements under combined normal force and bending. IABSE reports. Available online: https://www.e-periodica.ch/digbib/view?pid=bse-re-001:1973:13::9#90 (accessed on 29 April 2022).
  40. Mondal, G.; Jain, S.K. Lateral Stiffness of Masonry Infilled Reinforced Concrete (RC) Frames with Central Opening. Earthq. Spectra 2008, 24, 701–723. [Google Scholar] [CrossRef]
  41. Hendry, A. Structural Masonry; Macmillan: Houndmills, UK, 1990; ISBN 978-1-349-14829-5. [Google Scholar] [CrossRef]
  42. Mohamed, H.; Romão, X. Analysis of the performance of strut models to simulate the seismic behaviour of masonry infills in partially infilled RC frames. Eng. Struct. 2020, 222, 111124. [Google Scholar] [CrossRef]
  43. Decanini, L.D.; Liberatore, L.; Mollaioli, F. Strength and stiffness reduction factors for infilled frames with openings. Earthq. Eng. Eng. Vib. 2014, 13, 437–454. [Google Scholar] [CrossRef]
  44. Asteris, P.G.; Cotsovos, D.M.; Chrysostomou, C.Z.; Mohebkhah, A.; Al-Chaar, G.K. Mathematical mi-cromodeling of infilled frames: State of the art. Eng. Struct. 2013, 56, 1905–1921. [Google Scholar] [CrossRef]
  45. Hamburger, R.O.; Chakradeo, A.S. Methodology for seismic capacity evaluation of steel-frame buildings with infill unreinforced masonry. In Mitigation and Damage to the Built Environment; U.S. Central United States Earthquake Consortium (CUSEC): Memphis, TN, USA, 1993; pp. 173–182. [Google Scholar]
  46. Thiruvengadam, V. On the natural frequencies of infilled frames. Earthq. Eng. Struct. Dyn. 1985, 13, 401–419. [Google Scholar] [CrossRef]
  47. Tripathy, D.; Singhal, V. Estimation of in-plane shear capacity of confined masonry walls with and without openings using strut-and-tie analysis. Eng. Struct. 2019, 188, 290–304. [Google Scholar] [CrossRef]
  48. Anil, Ö.; Altin, S. An experimental study on reinforced concrete partially infilled frames. Eng. Struct. 2007, 29, 449–460. [Google Scholar] [CrossRef]
  49. Mughal, U.A.; Qazi, A.U.; Ahmed, A.; Abbass, W.; Abbas, S.; Salmi, A.; Sayed, M.M. Impact of Openings on the In-Plane Strength of Confined and Unconfined Masonry Walls: A Sustainable Numerical Study. Sustainability 2022, 14, 7467. [Google Scholar] [CrossRef]
  50. Chopra, A.K.; Goel, R.K. Capacity-Demand-Diagram Methods for Estimating Seismic Deformation of Inelastic Structures: SDF Systems, Report No. PEER-1999/02; Pacific Earthquake Engineering Research Center, University of California: Berkeley, CA, USA, 1999.
  51. Niewiarowski, R.W.; Rojahn, C. Seismic Evaluation and Retrofit of Concrete Buildings SEISMIC SAFE-TY COMMISSION State of California Products 1.2 and 1.3 of the Proposition 122 Seismic Retrofit Practices Improvement Program; 1996. Available online: https://www.atcouncil.org/pdfs/atc40toc.pdf (accessed on 29 April 2022).
  52. CEN. EN 1998-3: Eurocode 8: Design of Structures for Earthquake Resistance–Part 3: Assessment and Retrofitting of Buildings; European Committee for Standardization: Brussels, Belgium, 2005. [Google Scholar]
  53. FEMA 356. Prestandard and Commentary for the Seismic Rehabilitation of Buildings; Federal Emergency Management Agency: Washington, DC, USA, 2000. [Google Scholar]
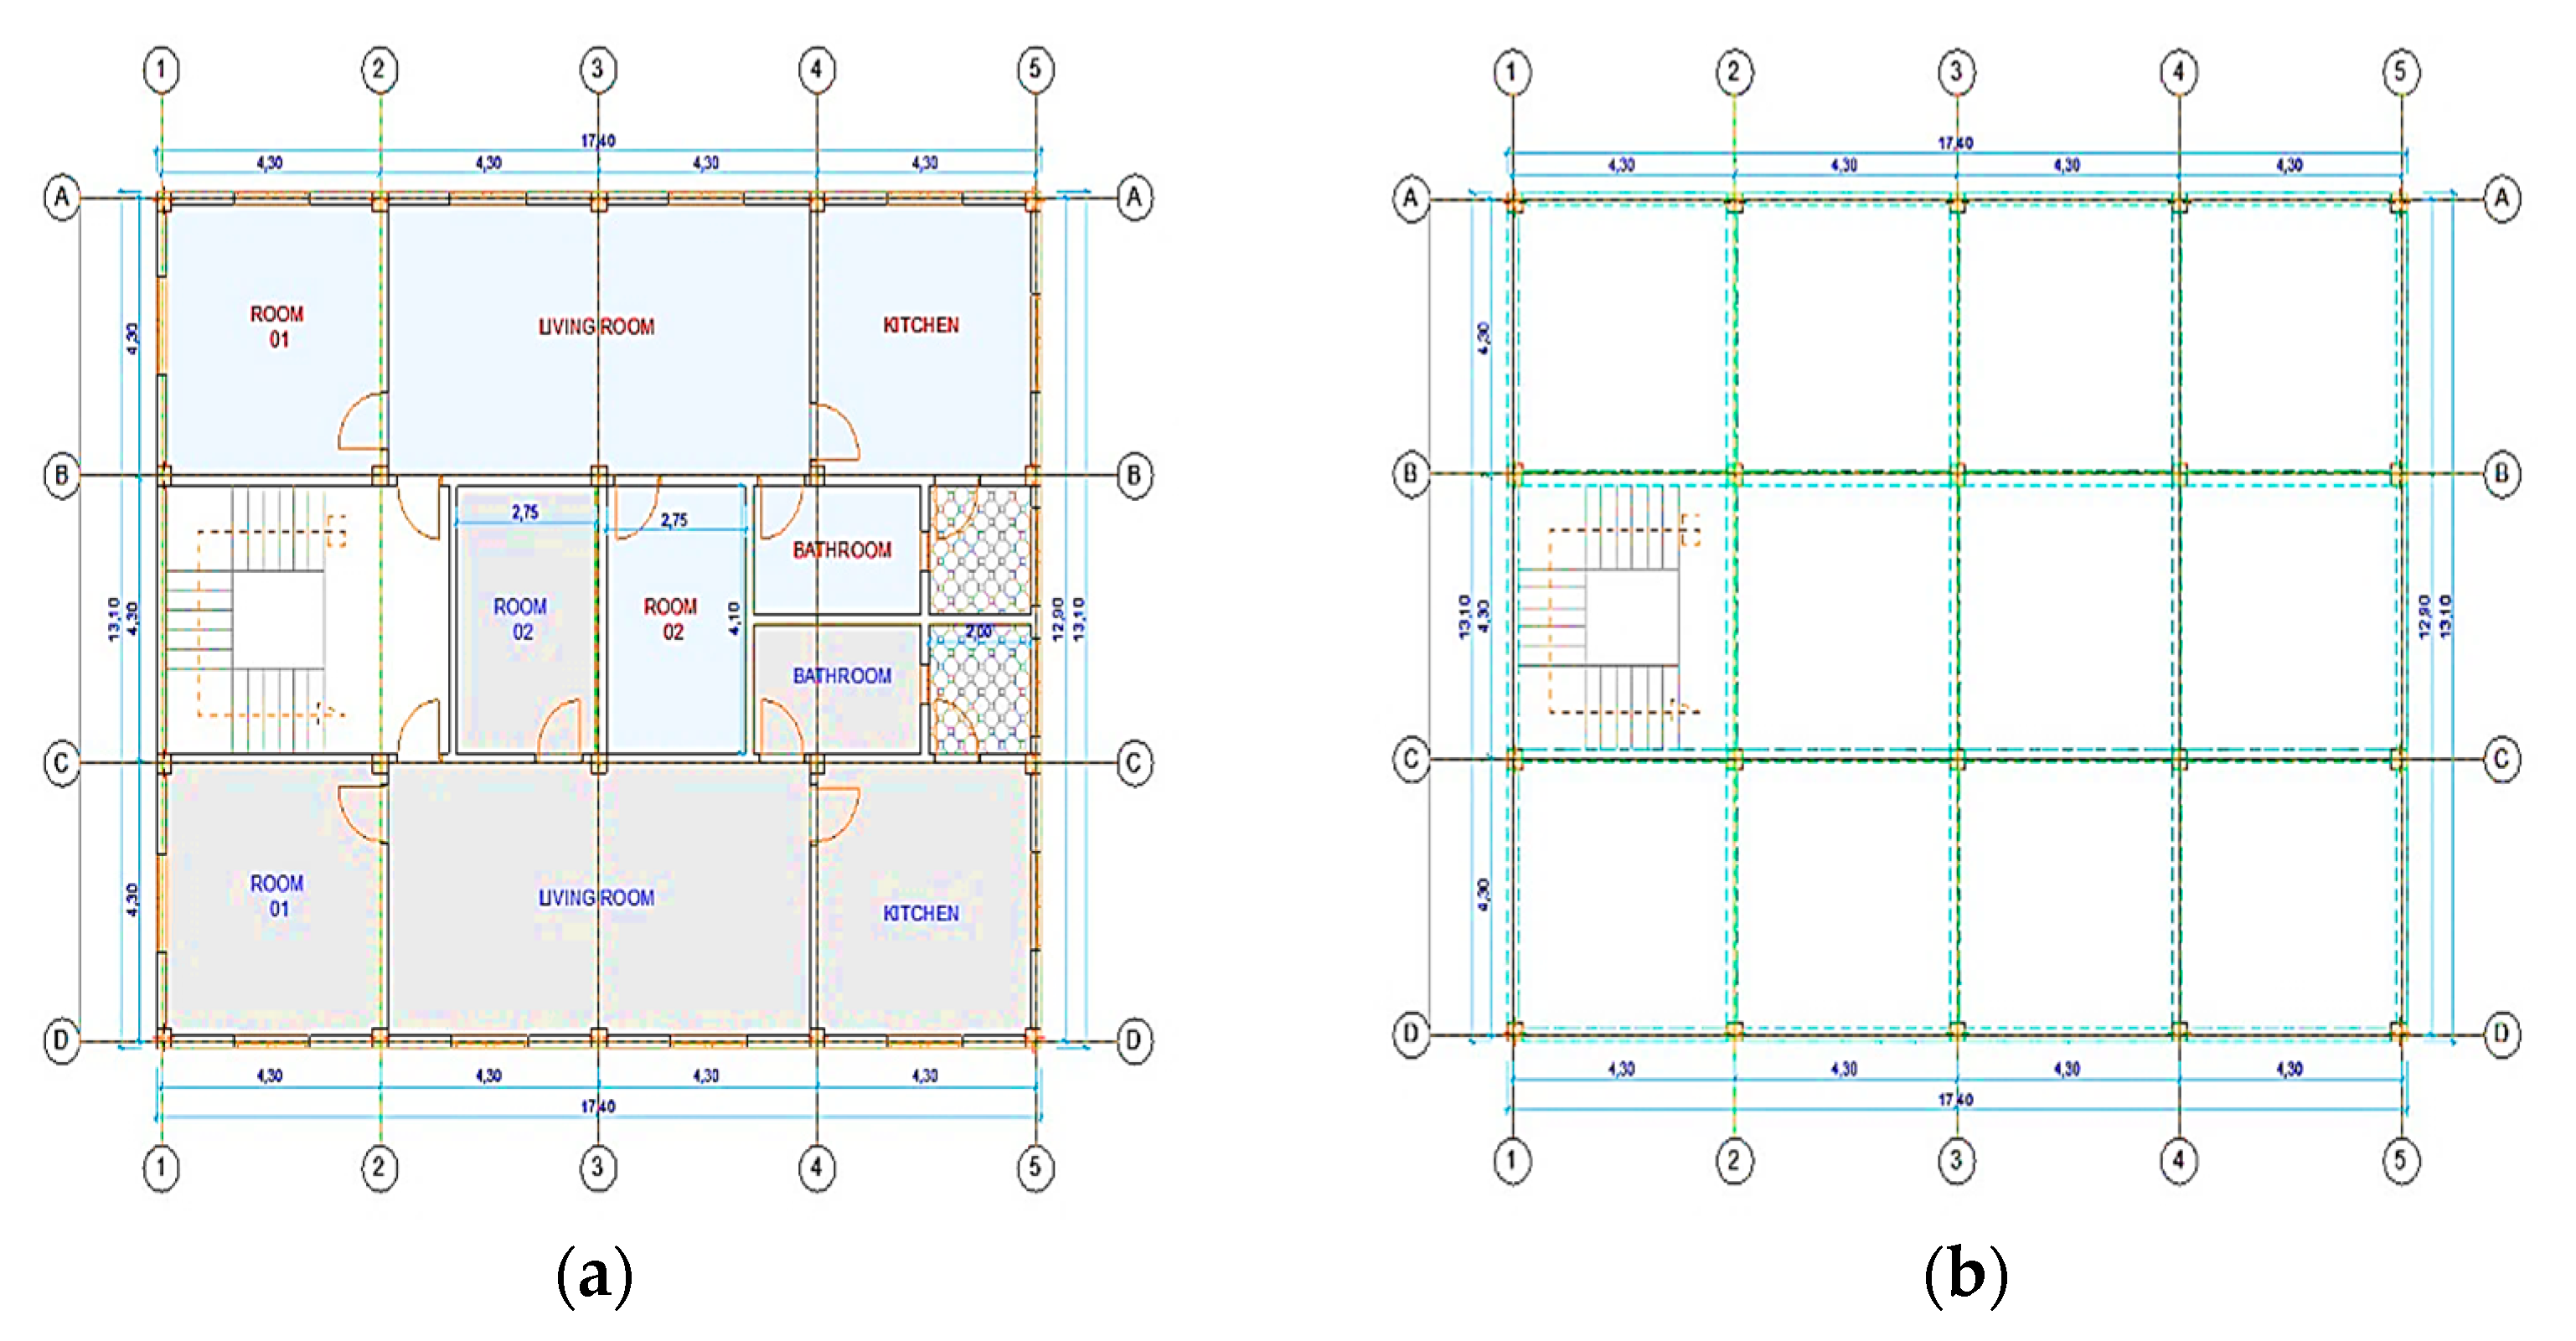
Figure 2. Typical plan view for the considered building: (a) architectural plan, (b) structural system showing the considered frame (all dimensions in m).
Applsci 12 09477 g002
Figure 3. Adopted strategy for modelling RC elements. (a) Beam with hinge element general description. (b) Fiber section discretization. i. unconfined concrete (Concrete01) ii. confined concrete (concrete02) iii. Steel material (steel02).
Applsci 12 09477 g003
Figure 4. Represents (a) the capacity curve, (b) the maxillary base shear values, (c) the maximum ISD, (d) the energy absorbed curve of the building.
Applsci 12 09477 g004
Figure 5. The models with the distribution of the different infill walls.
Applsci 12 09477 g005aApplsci 12 09477 g005b
Figure 6. Pushover curves of the models studied.
Applsci 12 09477 g006
Figure 7. The structural response: (a) maximum ISD for each story for the cases studied; (b) plastic deformational energy in each model.
Applsci 12 09477 g007
Figure 8. Case N°:1: (a) the capacity curve, (b) the maxillary base shear values, (c) the maximum ISD, (d) the energy absorbed curve of the building.
Applsci 12 09477 g008
Figure 9. Case N°:2: (a) the capacity curve, (b) the maxillary base shear values, (c) the maximum ISD, (d) the energy absorbed curve of the building.
Applsci 12 09477 g009
Figure 10. Case N°:3: (a) the capacity curve, (b) the maxillary base shear values, (c) the maximum ISD, (d) the energy absorbed curve of the building.
Applsci 12 09477 g010
Figure 11. Case N°:4 (a) the capacity curve, (b) the maxillary base shear values, (c) the maximum ISD, (d) the energy absorbed curve of the building.
Applsci 12 09477 g011
Figure 12. Radar diagrams to compare the studied results in the four cases. (a) Study Case N°:1, (b) Study Case N°:2, (c) Study Case N°:3, (d) Study Case N°:4.
Applsci 12 09477 g012aApplsci 12 09477 g012b
Table 1. Mechanical properties of the materials.
Concrete
Fc (MPa)
SteelInfill Panel Material
Yield Stress
σ Y (MPa)
Elastic Modulus
E (GPa)
Brick Unit Compressive
Strength fbrick (MPa)
Mortar Compressive Strength fmortat (MPa)
25.0522.0190.02.710.0
Table 2. Cross-section details for frame.
Columns Beams
AxisSection
(cm2)
SteelSection
(cm2)
Reinforcement
StartMiddleEnd
UpperLowerUpperLowerUpperLower
A30 × 308 ∅1525 × 404 ∅124 ∅124 ∅124 ∅124 ∅124 ∅12
B30 × 308 ∅1525 × 404 ∅124 ∅124 ∅124 ∅124 ∅124 ∅12
C30 × 308 ∅1525 × 404 ∅124 ∅124 ∅124 ∅124 ∅124 ∅12
D30 × 308 ∅1525 × 404 ∅124 ∅124 ∅124 ∅124 ∅124 ∅12
E30 × 308 ∅1525 × 404 ∅124 ∅124 ∅124 ∅124 ∅124 ∅12
F30 × 308 ∅1525 × 404 ∅124 ∅124 ∅124 ∅124 ∅124 ∅12
Table 3. Study summary.
No.AcronymMasonry TypeFm (MPa)Thickness (cm)Full FramePartial FrameVariation Presence of Infill
1BF//////
2FFHB152.715Applsci 12 09477 i001
3FW10HB152.715 Applsci 12 09477 i001
4FW20HB152.715 Applsci 12 09477 i001
5FW30HB152.715 Applsci 12 09477 i002
6FW40HB152.715 Applsci 12 09477 i001
7F5W50HB152.715 Applsci 12 09477 i003
8FW60HB152.715 Applsci 12 09477 i001
9FW70HB152.715 Applsci 12 09477 i004
10FW80HB152.715 Applsci 12 09477 i001
11FW90HB152.715 Applsci 12 09477 i005
12SFHB152.715
132SFHB152.715
143SFHB152.715
15RFHB152.715 Applsci 12 09477 i001
16MFHB152.715 Applsci 12 09477 i006
17UFHB152.715 Applsci 12 09477 i001
18DFHB152.715 Applsci 12 09477 i007
19MHFHB152.715 Applsci 12 09477 i001
20MXFHB152.715 Applsci 12 09477 i008
21RLFHB152.715 Applsci 12 09477 i001
222RFHB152.715 Applsci 12 09477 i009
232DFHB152.715 Applsci 12 09477 i001
24SDFHB152.715 Applsci 12 09477 i010
Applsci 12 09477 i001—type of infill distribution.
Table 4. Summary of the obtained results: the values of maximum top displacement, maximum base shear, maximum inter-story drift and the energy for all models are attributed to their corresponding values in the bare frame model.
ModelsBase Shear (KN)Ration (%)Max Top Displacement (m)Ratio (%)ISD Max (%)Ratio (%)Energy (KN.m)Ratio (%)
BF196.21/0.313/0.023/91.45/
Rf = 10%247.726.24%0.2699−13.77%0.02098−8.78%101.7211.23%
Rf = 20%299.7252.75%0.234−25.24%0.0188−18.26%110.0120.30%
R f= 30%352.4579.63%0.205−34.50%0.0172−25.22%117.828.81%
Rf = 40%406.17107.01%0.183−41.53%0.0155−32.61%124.4436.07%
Rf = 50%460.63134.76%0.168−46.33%0.0141−38.70%132.8945.31%
Rf = 60%514.44162.19%0.16−48.88%0.0136−40.87%140.1753.28%
Rf = 70%567.75189.36%0.151−51.76%0.0129−43.91%146.56560.27%
Rf = 80%620.75216.37%0.145−53.67%0.0124−46.09%152.6366.90%
Rf = 90%673.99243.50%0.143−54.31%0.0121−47.39%160.4375.43%
FF726.34270.19%0.143−54.31%0.0119−48.26%166.4582.01%
Table 5. The values of maximum top displacement, maximum base shear, maximum inter-story drift and the energy of the plastic deformation damping for the models studied.
ModelsBase Shear
(KN)
Max Top
Displacement (m)
ISD Max
(%)
Energy
(KN.m)
BF192.210.3130.023091.45
FF726.340.1430.0119166.45
SF480.360.1280.013864.92
2SF306.850.1280.016471.39
3SF240.740.1790.019476.89
RF545.830.1580.0132140.57
MF546.470.1730.0144142.45
UF440.130.3810.0434199.52
DF442.90.190.0168142.47
MHF326.950.2750.0305137.02
MXF459.040.1870.0158152.76
RLF370.610.1940.016119.5
2RF365.880.1970.016117.34
2DF387.450.260.022169.79
SDF407.450.1490.0141108.31
Table 6. The values of maximum top displacement, maximum base shear, maximum inter-story drift and the energy for all models are attributed to their corresponding values in the bare frame model.
ModelsBase Shear
(KN)
Max Top
Displacement (m)
ISD Max
(%)
Energy
(KN.m)
FF3.780.460.521.82
SF2.500.410.600.71
2SF1.600.410.710.78
3SF1.250.570.840.84
RF2.840.500.571.54
MF2.840.550.631.56
UF2.291.221.892.18
DF2.300.610.731.56
MHF1.700.881.331.50
MXF2.390.600.691.67
RLF1.930.620.701.31
2RF1.900.630.701.28
2DF2.020.830.961.86
SDF2.120.480.611.18
Table 7. Summary of case studies.
Study Case No°:1Study Case No°:2Study Case No°:3Study Case No°:4
Applsci 12 09477 i022
BF
Applsci 12 09477 i023
BF
Applsci 12 09477 i024
BF
Applsci 12 09477 i025
BF
Applsci 12 09477 i026
FF
Applsci 12 09477 i027
FF
Applsci 12 09477 i028
FF
Applsci 12 09477 i029
FF
Applsci 12 09477 i030
SF
Applsci 12 09477 i031
RF
Applsci 12 09477 i032
3SF
Applsci 12 09477 i033
MXF
Applsci 12 09477 i034
2SF
Applsci 12 09477 i035
MF
Applsci 12 09477 i036
UF
Applsci 12 09477 i037
DF
Applsci 12 09477 i038
3SF
Applsci 12 09477 i039
RLFF
Applsci 12 09477 i040
MHF
Applsci 12 09477 i041
SDF
Applsci 12 09477 i042
2RF
Applsci 12 09477 i043
2DF
Publisher’s Note: MDPI stays neutral with regard to jurisdictional claims in published maps and institutional affiliations.