Abstract
Calligraphy (the special art of drawing characters with a brush specially made by the Chinese) is an integral part of Chinese culture, and detecting Chinese calligraphy characters is highly significant. At present, there are still some challenges in the detection of ancient calligraphy. In this paper, we are interested in the calligraphy character detection problem focusing on the calligraphy character boundary. We chose High-Resolution Net (HRNet) as the calligraphy character feature extraction backbone network to learn reliable high-resolution representations. Then, we used the scale prediction branch and the spatial information prediction branch to detect the calligraphy character region and categorize the calligraphy character and its boundaries. We used the channel attention mechanism and the feature fusion method to improve the detection effectiveness in this process. Finally, we pre-trained with a self-generated calligraphy database and fine-tuned with a real calligraphy database. We set up two groups of ablation studies for comparison, and the comparison results proved the superiority of our method. This paper found that the classification of characters and character boundaries has a certain auxiliary effect on single character detection.
1. Introduction
With the increasing prosperity of Sinology research, there has been some research on Chinese character recognition [1,2,3,4,5,6,7]. Calligraphy, as one of the “four arts” in ancient China, has been the cultural essence of the Chinese nation for thousands of years. The appreciation of calligraphy works of art can promote the inheritance and development of calligraphy. The systematic recognition of calligraphy characters can provide a great degree of assistance for calligraphy appreciation.
Calligraphy character detection is an essential task in the process of character recognition. The goal of text detection is to detect the text area in the picture, which can be used to identify words. The output of general target detection [8,9] displays the position and area of animals, water cups, mobile phones, and other objects in the picture. However, as a particular form of target detection in computer vision, the input of text detection is a picture containing text, and the purpose is to predict the area where the text is located and obtain the mark of the boundary box. Compared to the general target detection, the text has different font color and background characteristics, apparent differences in text size, diverse and irregular shapes and directions, etc. Thus, the target detection algorithm cannot be directly used in text detection.
General text detection methods are divided into two categories: traditional text detection methods and text detection methods based on deep learning.
Traditional methods are usually bottom-up, first detecting and classifying characters and then grouping them into words by empirical rules, such as stroke width transform (SWT) [10], maximally stable extremal (MSER) [11], Edge Boxes [12], etc. The resistance of traditional text detection methods to interference is weak, and the detection effect is limited. The shape of the text, layout, and other reasons will cause significant interference in the detection of text. Therefore, the traditional text recognition methods do not work well in detecting calligraphic characters.
In recent years, with the continuous progress of deep learning technology, a large number of breakthrough achievements based on deep convolution neural networks (CNN) [13], deep belief networks(DBN) [14], and other deep models have emerged in the field of computer vision [15,16]; appropriate methods have been gradually applied to the field of handwriting character detection [17], especially in the field of Chinese character detection [18,19,20], and have also been applied to calligraphy style recognition [21,22].
However, there are still some problems with calligraphic character detection. The training data used for text detection often uses the labeling method of the external bounding box of the text area, which will make the algorithm suffer from two problems when predicting. (1) When the text areas are too small to be close to each other, the network is easy to cause sticking. It cannot accurately split its boundaries because, after many convolution and pooling operations of the network, the high-level features have high semantics and low resolution, resulting in the loss of image detail information in the prediction map. (2) Significant differences exist in the distribution of characters in different languages and text areas. When detecting Chinese characters with left and right structures or upper and lower structures, non-text pixels cause “excessive segmentation” due to accurate classification.
For the above questions, this paper adopted the semantic segmentation method suitable for multi-scale problems, put forward a multi-font calligraphy character detection method based on scale estimation from accurate calligraphy character area segmentation and calligraphy character area scale estimation, and then obtained the calligraphy character area features according to the feature mapping. Our contribution is proposing a calligraphy character region representation that predicts the calligraphy character region boundary as independent spatial information to solve the problem of detecting individual characters in calligraphic works that contain multi-scale characters, which will play a great role in the subsequent analysis of Chinese calligraphy, such as the recognition of calligraphy and painting style features.
2. Related Works
2.1. Convolutional Neural Networks (CNN)
With the development of deep learning, most character recognition tasks are completed by CNN. These methods have high accuracy for character recognition in complex scenes. Text recognition methods based on deep learning can be divided into two types: local-based methods and global-based methods.
Similar to most traditional methods, local-based methods first try to locate the position of each character, then recognize them and synthesize all characters into text strings. Wang et al. [23] drew lessons from computer vision’s general target detection method and used character confidence and the spatial constraint relationship between characters to obtain the possible text detection and recognition results. However, the algorithm has limitations and can only be used for horizontal character detection and recognition.
The global-based method is to recognize the string as a whole. For example, Jaderberg et al. [24] took a word as a class and then transformed the recognition problem into an image classification problem. The experiment was divided into two parts: the candidate box detection part and the character recognition part. The first part first detected all possible text regions and then filtered out non-text candidate boxes through a random forest classifier to ensure the accuracy of text detection; the second part read the whole image into the CNN network and directly completed the character recognition process at one time.
2.2. Training of CNN
The training process of the convolutional neural network is shown in Figure 1. At the beginning of training, we needed to define the learning rate, the maximum number of iterations, and the iteration stop threshold to control the gradient descent speed and randomly initialize the weight parameters in the network. In the network training phase, the forward propagation algorithm is mainly used to calculate the data output after passing through the network. The network output and the cost function are calculated to obtain the output layer error. When the error does not reach the set iteration stop expectation, the back-propagation algorithm based on the gradient descent method is used to transmit the error back and update the network weight parameters, repeat the above process until the iteration stops, output the weight parameters, and complete the network training.
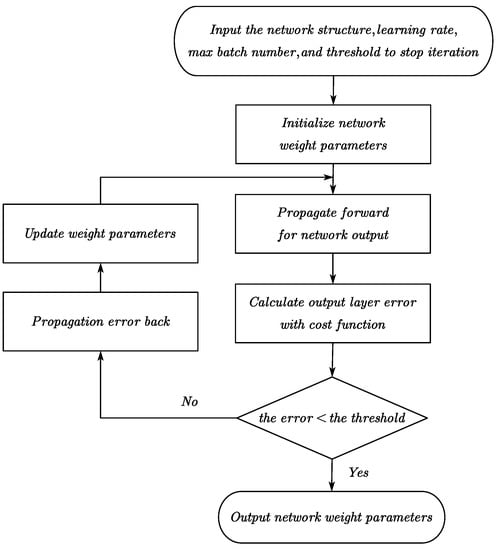
Figure 1.
Training process of CNN.
2.3. High-Resolution Net (HRNet)
HRNet [25] was initially designed for human pose estimation and can be well used in the experiment of semantic segmentation. Unlike traditional semantic segmentation networks, HRNet connects high-resolution and low-resolution subnetworks in parallel so that the network can always maintain the characteristics of high-resolution.
The switching unit of HRNet constitutes the whole network, and its primary function is to complete the conversion and series connection of different resolution features. HRNet outputs characteristic maps of four different resolution sizes using a series of switching units. The switching unit of HRNet is shown in Figure 2.
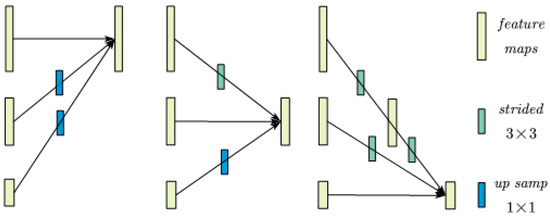
Figure 2.
The switching unit.
3. Methods
3.1. Calligraphy Character Region Segmentation
This paper proposes a new calligraphy character region representation for accurate calligraphy character region segmentation, which takes the calligraphy character region boundary as a vital attribute of segmenting the calligraphy character region. It can accurately separate similar small calligraphy character targets and effectively estimate the calligraphy character lines of any direction, shape, and language. For calligraphy character region scale estimation, the correlation between image resolution and calligraphy character region scale is fully considered. The feature expression of the calligraphy character region at different scales is enhanced through image pyramid input, and the scale of the calligraphy character region is estimated to integrate the detection results in different resolution prediction images.
The calligraphy character detection network is divided into the feature extraction backbone network, the scale prediction branch, and the spatial information prediction branch. The first part extracts high-resolution details and powerful semantic information. The second part conducts the preliminary detection of calligraphic characters, estimates the size of the calligraphy character area, and provides a basis for the subsequent spatial information prediction. The third part completes the task of classifying calligraphic characters, character boundaries, and backgrounds by predicting the boundaries of calligraphic character areas as independent spatial information, which means detecting individual characters. Finally, the character’s position is located by calculating the bounding box of each character area.
3.1.1. Calligraphy Character Feature Extraction Backbone Network
To improve the accuracy of spatial information prediction, HRNet was used in this paper, which can obtain a high-resolution representation of the backbone network of feature extraction. Most serial networks recover high-resolution features layer by layer from low-resolution features and recover lost information through a hop connection. Unlike that, HRNet ensures that all resolution feature layers are connected in parallel by gradually adding low-resolution feature layers and ensures that all feature layers have high-resolution detail information and strong semantic information through multi-scale feature fusion. The backbone network for feature extraction is shown in Figure 3.
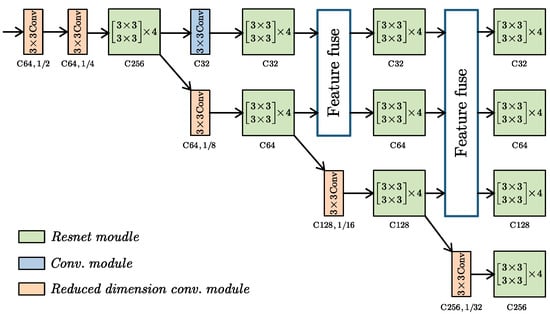
Figure 3.
Feature extraction backbone network structure diagram.
To save the memory overhead and reduce computation, the input image first enters the two-layer dimension reduction convolution module, which contains a 3 × 3 convolution layer, a batch normalization layer, and an ReLU activation function layer. Then, the output features are sent to convolution phase I. To optimize the deep network better, the convolution phase I adopts four bottleneck residual modules in Resnet, which can ensure residual learning and reduce the calculation cost.
Before entering convolution phase II, the output of convolution phase I generates two branches. One branch reduces the number of channels in the feature layer through the convolution module but keeps the resolution unchanged. The other branch generates a low-resolution feature layer through the reduced-dimension convolution module. In convolution stage 2, four Resnet basic residual modules are used to extract the features of each branch. Then, the two feature branches output in the second stage conduct multi-scale feature fusion to improve feature details and semantic information simultaneously.
Convolution stage III is similar to stage II, but three feature branches conduct multi-scale feature fusion. After two multi-scale feature fusions, all feature branches maintain high-resolution detail and strong semantic information. Finally, the network outputs four characteristic maps with different resolutions and accesses the subsequent scale and spatial information predictions.
In the multi-scale feature fusion stage, it needs to be converted because the feature layer resolution differs from the number of channels. Specifically, the given input characteristic layers are X1, X2, ···, Xn after fusion, the output characteristic layers are Y1, Y2, ···, Yn subscript indicates the number of layers, and the input and output of the same number of layers maintain the same scale and several channels. The fused output is:
In the formula, and are the down-sampling and up-sampling of features, respectively. The fusion method used in this chapter is shown in Figure 4. The up-sampling operation is the nearest neighbor interpolation method, while the down-sampling uses the 3 × 3 convolution operation with a step size of 2 according to the multiple of the scale difference of the feature layer.
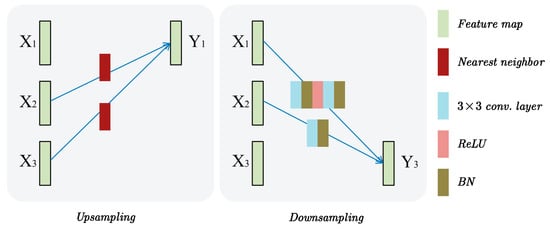
Figure 4.
Schematic diagram of up-sampling and down-sampling between different feature layers in the multi-scale feature fusion stage.
3.1.2. Scale Prediction Branch
Figure 5 shows the scale prediction branch. It is composed of a feature connect module (FCM), chain residual pooling (CRP), and residual convolution module (RCM). The purpose of FCM is to fuse information from different stages. The purpose of CRP is to extract background semantic information. For multi-font calligraphy character detection algorithms, the difference in character distribution under different scales affects the performance of multilingual calligraphy character detection. Therefore, this paper added a scale prediction branch to the detection network to estimate the size of the calligraphy character area and provide a basis for the fusion of subsequent multi-scale detection results. This paper transformed the scale estimation from the regression problem to the category-based segmentation problem. According to the proportion, the calligraphy character area is divided into three categories: large, medium, and small. With the background, four types of pixel-level prediction maps are output.
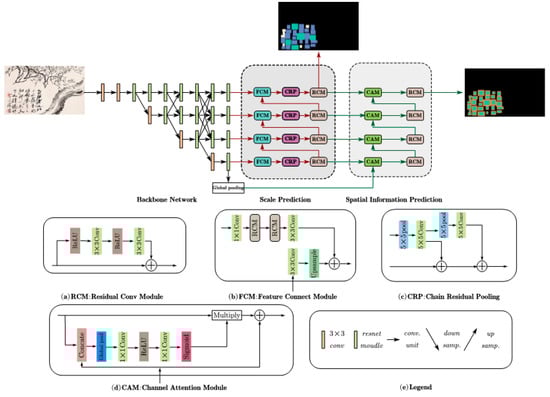
Figure 5.
Calligraphy character detection network. In the output feature map of scale prediction, green, blue and white represent three character maps of different sizes: large, medium and small. In the output feature map of spatial information prediction, green represents the character core region, and orange represents the character boundary.
There are two advantages of scale estimation for the calligraphy character region. (1) The size estimation and background judgment of the calligraphy character region for each pixel in the prediction map can be used as the coarse segmentation of the calligraphy character region at the same time. Since the hidden layer is shared with subsequent detection tasks, this process can help the model focus on essential features and optimize subsequent detection tasks. (2) The distinguishability of the calligraphy character area scale can improve the accuracy of subsequent spatial information predictions. For example, large-area calligraphy characters and small-area calligraphy characters close to each other can be distinguished according to the scale category.
3.1.3. Spatial Information Prediction Branch
Figure 5 shows the spatial information prediction branch. It comprises the residual convolution module (RCM) and channel attention module (CAM). The purpose of CAM is to locate channels that are more useful for calligraphy character detection from all channels. When small calligraphy character regions close to each other are predicted, the background pixels at the boundary of the calligraphy character region are often incorrectly classified into calligraphy characters, resulting in the inability of two adjacent calligraphy character regions to be accurately distinguished. However, this also shows that these pixels have unique appearance characteristics at the boundary of the calligraphy character area.
Based on this, this paper proposed a calligraphy character region representation that predicts the calligraphy character region boundary as independent spatial information and converts the original text and non-textual segmentation tasks into calligraphy characters, boundaries, and background segmentation tasks. Because the boundary area is smaller than the calligraphy character area, the network needs a more accurate spatial resolution. Therefore, this paper used a calligraphy character area spatial prediction sub-network to further expand the receptive field and enrich the calligraphy character area context information by adding the channel attention module [26].
3.2. Loss Function
This paper transformed the calligraphy character detection problem into a three-classification problem. For this, this paper used the softmax function training model. The formula is Equation (3).
Its output is [y1, y2, y3], in which y1, y2, and y3 respectively represent the probability of calligraphy character, boundary, and background. Then, this paper calculated the output’s cross-entropy and the sample’s actual labels, as in Equation (4).
Finally, the loss is the average of the output of Equation (4).
3.3. Character Region Extraction
The process of character extraction is to analyze the spatial information prediction map and determine the scope of the character area. The algorithm in this paper divides the character area into the core area and the character boundary area and can easily separate the two adjacent character areas through the core area. However, because the character core area is small, calculating the external bounding box through the character core area can not accurately locate the character area, and the boundary areas of two adjacent characters are fused, which is also not conducive to distinguishing.
Therefore, to solve the above problems, this chapter used a boundary region separation algorithm based on a breadth-first search, as shown in Algorithm 1. First, based on the character core area in the spatial information prediction graph, the initial connected area can be extracted, where n represents the number of connected areas. Figure 6b shows the two initial character core areas, marked with green and blue respectively and marked with “1”, while the boundary area is marked with orange and marked with “2”. Next, the breadth-first search algorithm continuously searches and fuses the pixels in the boundary region. This process is only for the pixels in the boundary region. During this process, the fused pixel will change its mark to “3”. When two of the character areas encounter the same pixel, as shown in the red box in Figure 6b, the algorithm adopts the first come, first serve strategy. Finally, after all the boundary region pixels are searched and fused, the external bounding boxes of each connected region are calculated, and the final detection results are obtained.
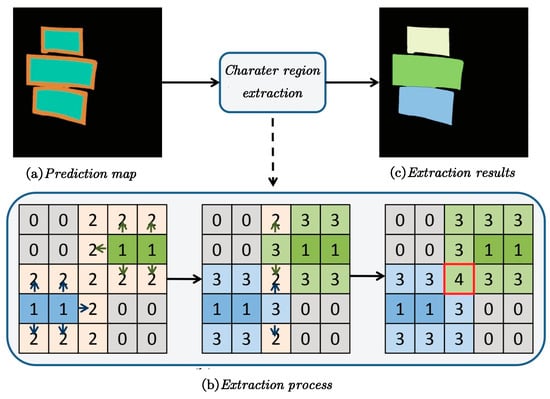
Figure 6.
Shared boundary character region extraction schematic. The meaning of color is the same as that in Figure 5.
| Algorithm 1 Character region extraction based on the breadth-first search algorithm |
| Input: Character core area C, boundary area B Output: Character area D 1. function EXTRACTCHARACTER(C, B) 2. initialize character region pixel set T, boundary region pixel set R, and queue Q 3. for core area pixels do 4. put and its label into T, and put the boundary area pixels into R 5. queue all pixels in C 6. end for 7. while do 8. queue one pixel P from the front end of Q 9. find p adjacent pixels Q 10. if then 11. put the labels of q and p in T and delete q from R 12. queue b 13. end if 14. end while 15. analyze T, where the same label set outputs D 16. return D 17. end function |
4. Experiment and Results
4.1. Database
Currently, there is no mature dataset of Chinese calligraphy, so this article used two self-built datasets. The first dataset was a random generation of calligraphy works from text-free background images, poems, and fonts, which was used for pre-training. The second dataset was collected by high-definition scanning or camera photographing masterpieces of calligraphy and painting, which was used for fine-tuning. Because of the significant differences in calligraphy styles of different authors, this paper collected the calligraphy works of three authors as fine-tuning samples. They are Qi Baishi, Zhang Daqian, and Xu Beihong.
The first database was generated with poems, background images, and different font packages. Firstly, we randomly generated binary calligraphy images with poems and fonts. Then, we added its inverted image to the background image. Finally, we smoothed the superimposed image to obtain the data we needed. The total data were about 50,000, of which there were 40,000 for training and 10,000 for validation. The resolution of all images in the database was 512 × 512 × 3. Generation of the simulation database is shown in Figure 7.
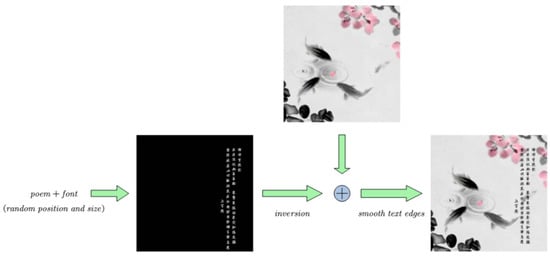
Figure 7.
Generation of the simulation database.
The second database was manually annotated based on the collection of high-definition calligraphy pictures. The total data were about 5000, of which 4000 were for training and 1000 for validation. Examples of high-definition calligraphy database is shown in Figure 8.
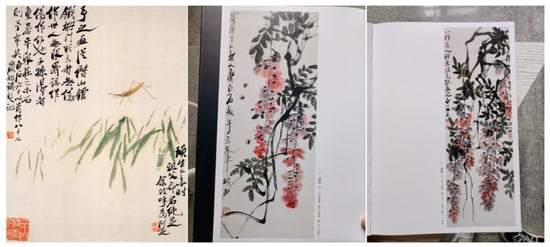
Figure 8.
Examples of high-definition calligraphy database.
4.2. Training Label Generation
In the label generation stage, two labels need to be generated according to the training data annotation: the scale prediction training label and the spatial information prediction training label. According to the annotation information of the training data set, the scale prediction training label is first generated. Its vertex coordinates can be obtained for a character area t, and the shortest edge of the character area can be obtained according to the vertex coordinates. In this chapter, the pixels in the character area of the training label are assigned according to the Formula (5).
In the formula, Ih represents the height of the image. The generated scale prediction training label is shown in Figure 9b. The green area represents the large area marked “1”, the blue area represents the medium area marked “2”, and the white area represents the small area marked “3”.
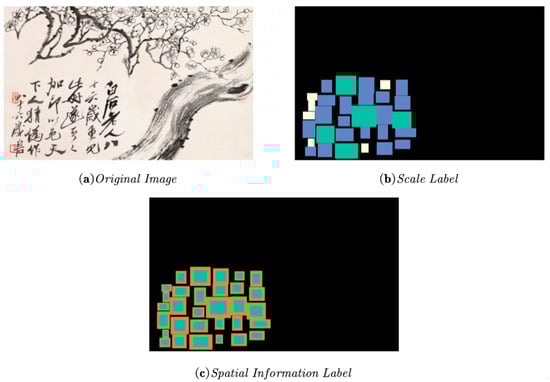
Figure 9.
Schematic diagram of training label generation. The meaning of color is the same as that in Figure 5.
After the scale prediction training label is generated, the offset is calculated according to the short side length M of the character area obtained in the scale prediction training label stage, where is set to 0.1. For a small character area with a short edge of fewer than 20 pixels, when , d is set to 2. Then, the original area is reduced according to the offset, and the reduced area is marked as the character boundary area. The new vertex of the character area is defined as . Finally, values are assigned to the pixels in the character core area and boundary area, respectively. The generated spatial information prediction training label is shown in Figure 9c. The green area represents the character area marked “1”, and the orange area represents the boundary area marked “2”.
4.3. Network Parameter Settings
We trained and tested on NVIDIA GeForce GTX 1080 with TensorFlow 1.14. It runs 0.36 s per image with 1 batch size and 10 epochs.
4.4. Evaluation Criteria
Three indicators were used to evaluate the performance of character detection, including F-measure, Precision, and Recall. Precision measured the consistency between the detected area and the marked area of the test data. The larger the value is, the higher the accuracy is. The recall rate was used to measure the ability of the detection algorithm to detect all marked areas. The higher the value, the smaller the missed detection. F-measure is the harmonic average of precision and recall rate, and the overall performance was evaluated. Moreover, on this basis, we compared the test results with the label information of the test set to verify.
The evaluation standard uses the minimum bounding rectangle as the marking and detection area. Facing the inclined character, the detection area r1 and the annotation area r2 are first rotated to be parallel to the coordinate axis, and then the matching degree between the areas is calculated according to Formula (6).
In the formula, and represent the area of the intersection and union of regions and , respectively. indicates the matching degree between two regions. If the included angle between the detection area and the marked area is less than and the matching degree is more significant than 0.5, the marked area is considered to be successfully detected. The precision p and recall r are shown in Equations (7) and (8):
In the formula, represents the number of successfully detected areas, and represents the number of detected and marked areas. The F-measure f is the harmonic average of precision and recall, as shown in Equation (9).
4.5. Results
Figure 10 shows the pre-training character detection results
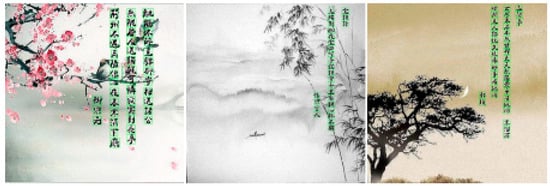
Figure 10.
Pre-training detection results.
Based on the above pre-training, after fine-tuning with database 2, the detection results are shown in Figure 11.
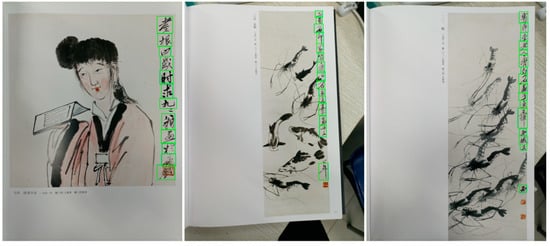
Figure 11.
Detection results.
4.6. Ablation Studies
Two groups of ablation studies were set up in this paper. The first group removed the text boundary and only performed the original text and non-text segmentation tasks. The second group replaced the feature extraction backbone network (HRNet) with ResNet101. Table 1 shows the original method in this paper and the results of two groups of ablation experiments.

Table 1.
Results comparison of ablation studies.
This paper took the calligraphy character region boundary as an essential attribute of segmenting the calligraphy character region so that it will compare their detection effect. The detection precision with boundaries and without boundaries were close, but the recall rate of the former was 95.60%, and the F1 Score of the former was 95.61%, which were significantly higher than the 92.13% recall rate and the 93.83% F1 Score of the latter. Table 1 shows that the recognition effect of increasing the boundary is better than the effect without the boundary. Figure 12 shows a generated calligraphy picture and its calligraphy character detection feature diagram with boundaries and without boundaries, in which we can find calligraphy character detection with boundaries that can distinguish each character in dense calligraphy.
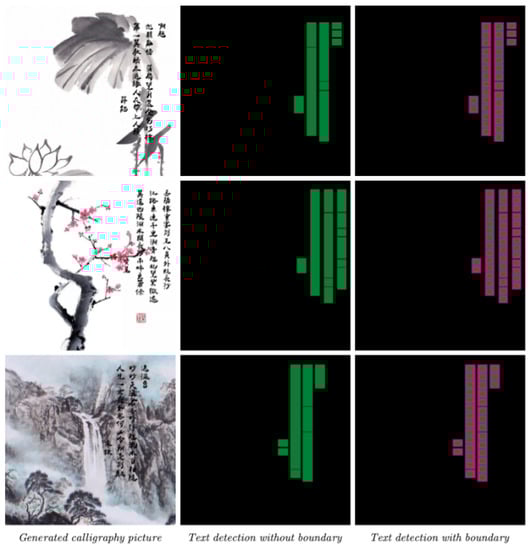
Figure 12.
Comparison of pre-training detection feature diagram.
Furthermore, the prediction rate of the original method was slightly higher than that of the second ablation experiment by 0.7%, the recall rate of the former was 2.58% higher, and the F1 Score was 1.64% higher. In addition to the prediction rate, the other two have considerable advantages.
4.7. Contrast Experiments
To compare the performance of the algorithm, some other algorithms were selected for comparison. See Table 2 for the detection performance of the algorithms in this chapter and other algorithms.
Table 2.
Performance of different text detection algorithms.
It can be seen that the algorithm in this chapter still has a similar performance compared with other advanced methods. This paper algorithm has achieved the highest precision (95.63%) and F1 Score (95.61%). Compared with the other two methods, this algorithm achieved the highest F1 Score while simultaneously ensuring precision and recall rate.
5. Conclusions
After the above analysis, we can conclude that this paper’s method can help to detect calligraphy characters better. In the future, we plan to fine-tune it with more real calligraphy data. We are already studying Optical Character Recognition (OCR) [29] for Chinese calligraphic characters, but for the time being, the amount of data is too small for the training effect to be very satisfactory. In the future, we will make more efforts to improve the training results.
Author Contributions
Conceptualization, X.P. and J.K.; methodology, X.P.; software, J.K.; validation, X.P. and J.K.; formal analysis, J.K.; investigation, X.F.; resources, Y.W.; data curation, X.P.; writing—original draft preparation, J.K.; writing—review and editing, J.K and X.P.; visualization, X.P.; supervision, Y.W.; project administration, Y.W.; funding acquisition, X.F. All authors have read and agreed to the published version of the manuscript.
Funding
This work was partly supported by the National Natural Science Foundation of China under Grant 62,006,191, partly by Shenzhen Science and Technology Program under Grant GJHZ20200731095204013 and partly by the Key RD Program of Shaanxi under Grant 2021ZDLGY15-04.
Informed Consent Statement
Informed consent was obtained from all subjects involved in the study. Written informed consent has been obtained from the patient(s) to publish this paper.
Data Availability Statement
All data included in this study are available upon request by contact with the corresponding author.
Conflicts of Interest
The authors declare no conflict of interest.
References
- Suen, C.Y.; Berthod, M.; Mori, S. Automatic recognition of handprinted characters—The state of the art. Proc. IEEE 1980, 68, 469–487. [Google Scholar] [CrossRef]
- Plamondon, R.; Srihari, S.N. Online and off-line handwriting recognition: A comprehensive survey. IEEE Trans. Pattern Anal. Mach. Intell. 2000, 22, 63–84. [Google Scholar] [CrossRef]
- Cheriet, M.; Kharma, N.; Suen, C.; Liu, C.-L. Character Recognition Systems: A Guide for Students and Practitioners; John Wiley & Sons: Hoboken, NJ, USA, 2007. [Google Scholar]
- Liu, C.L.; Yin, F.; Wang, D.H.; Wang, Q.F. Online and offline handwritten Chinese character recognition: Benchmarking on new databases. Pattern Recognit. 2013, 46, 155–162. [Google Scholar] [CrossRef]
- Tang, X.; Zhang, P.; Du, J.; Xu, Z. Painting and calligraphy identification method based on hyperspectral imaging and convolution neural network. Spectrosc. Lett. 2021, 54, 645–664. [Google Scholar] [CrossRef]
- Pang, B.; Wu, J. Chinese Calligraphy Character Image Recognition and Its Applications in Web and Wechat Applet Platform. In Proceedings of the ACM/IEEE Joint Conference on Digital Libraries in 2020, Virtual, China, 1–5 August 2020; pp. 253–260. [Google Scholar]
- Chen, L. Research and Application of Chinese Calligraphy Character Recognition Algorithm Based on Image Analysis. In Proceedings of the 2021 IEEE International Conference on Advances in Electrical Engineering and Computer Applications (AEECA), Dalian, China, 27–28 August 2021; IEEE: New York, NY, USA, 2021; pp. 405–410. [Google Scholar]
- Jiao, L.; Zhang, F.; Liu, F.; Yang, S.; Li, L.; Feng, Z.; Qu, R. A survey of deep learning-based object detection. IEEE Access 2019, 7, 128837–128868. [Google Scholar] [CrossRef]
- Liu, L.; Ouyang, W.; Wang, X.; Fieguth, P.; Chen, J.; Liu, X.; Pietikäinen, M. Deep learning for generic object detection: A survey. Int. J. Comput. Vis. 2020, 128, 261–318. [Google Scholar] [CrossRef]
- Guan, L.; Chu, J. Natural scene text detection based on SWT, MSER and candidate classification. In Proceedings of the 2017 2nd International Conference on Image, Vision and Computing (ICIVC), Chengdu, China, 2–4 June 2017; IEEE: New York, NY, USA, 2017; pp. 26–30. [Google Scholar]
- Matas, J.; Chum, O.; Urban, M.; Pajdla, T. Robust wide-baseline stereo from maximally stable extremal regions. Image Vis. Comput. 2004, 22, 761–767. [Google Scholar] [CrossRef]
- Zitnick, C.L.; Dollár, P. Edge boxes: Locating object proposals from edges. In Proceedings of the European Conference on Computer Vision, Zurich, Switzerland, 6–12 September 2014; Springer: Cham, Switzerland, 2014; pp. 391–405. [Google Scholar]
- LeCun, Y.; Bottou, L.; Bengio, Y.; Haffner, P. Gradient-based learning applied to document recognition. Proc. IEEE 1998, 86, 2278–2324. [Google Scholar] [CrossRef]
- Hinton, G.E.; Salakhutdinov, R.R. Reducing the dimensionality of data with neural networks. Science 2006, 313, 504–507. [Google Scholar] [CrossRef] [PubMed]
- Wang, X.; Xia, Z.; Peng, J.; Feng, X. Multiorientation scene text detection via coarse-to-fine supervision-based convolutional networks. J. Electron. Imaging 2018, 27, 033032. [Google Scholar] [CrossRef]
- Wang, X.; Feng, X.; Xia, Z. Scene video text tracking based on hybrid deep text detection and layout constraint. Neurocomputing 2019, 363, 223–235. [Google Scholar] [CrossRef]
- Wickramaarachchi, W.U.; Vasanthapriyan, S. Multi-Layer Framed Offline Signature Recognition Algorithm. J. Image Graph. 2015, 3, 11–15. [Google Scholar] [CrossRef][Green Version]
- Zhong, Z.; Jin, L.; Xie, Z. High performance offline handwritten Chinese character recognition using googlenet and directional feature maps. In Proceedings of the 2015 13th International Conference on Document Analysis and Recognition (ICDAR), Tunis, Tunisia, 23–26 August 2015; IEEE: New York, NY, USA, 2015; pp. 846–850. [Google Scholar]
- Yang, W.; Jin, L.; Xie, Z.; Feng, Z. Improved deep convolutional neural network for online handwritten Chinese character recognition using domain-specific knowledge. In Proceedings of the 2015 13th International Conference on Document Analysis and Recognition (ICDAR), Tunis, Tunisia, 23–26 August 2015; IEEE: New York, NY, USA, 2015; pp. 551–555. [Google Scholar]
- Liu, M.; Liu, G.; Liu, Y.; Jiao, Q. Oracle Bone Inscriptions Recognition Based on Deep Convolutional Neural Network. J. Image Graph. 2020, 8, 114–119. [Google Scholar] [CrossRef]
- Wang, Z. Feature Extraction and Identification of Calligraphy Style Based on Dual Channel Convolution Network. Secur. Commun. Netw. 2022, 2022, 4187797. [Google Scholar] [CrossRef]
- Chen, Y.S.; Su, G.; Li, H. Machine Learning for Calligraphy Styles Recognition. 2016. Available online: http://cs229.stanford.edu/proj2016/report/ChenSuLi-Machine%20Learning%20for%20Different%20Calligraphy%20Style%20Recognition-report.pdf (accessed on 22 September 2017).
- Wang, K.; Babenko, B.; Belongie, S. End-to-end scene text recognition. In Proceedings of the 2011 International Conference on Computer Vision, Barcelona, Spain, 6–13 November 2011; IEEE: New York, NY, USA, 2011; pp. 1457–1464. [Google Scholar]
- Jaderberg, M.; Simonyan, K.; Vedaldi, A.; Zisserman, A. Reading text in the wild with convolutional neural networks. Int. J. Comput. Vis. 2016, 116, 1–20. [Google Scholar] [CrossRef]
- Sun, K.; Xiao, B.; Liu, D.; Wang, J. Deep high-resolution representation learning for human pose estimation. In Proceedings of the IEEE/CVF Conference on Computer Vision and Pattern Recognition, Long Beach, CA, USA, 15–20 June 2019; pp. 5693–5703. [Google Scholar]
- Hu, J.; Shen, L.; Sun, G. Squeeze-and-excitation networks. In Proceedings of the IEEE Conference on Computer Vision and Pattern Recognition, Salt Lake City, UT, USA, 18–23 June 2018; pp. 7132–7141. [Google Scholar]
- He, W.; Zhang, X.Y.; Yin, F.; Liu, C.L. Deep direct regression for multi-oriented scene text detection. In Proceedings of the IEEE International Conference on Computer Vision, Venice, Italy, 22–29 October 2017; pp. 745–753. [Google Scholar]
- Zhou, X.; Yao, C.; Wen, H.; Zhou, S.; He, W.; Liang, J. East: An efficient and accurate scene text detector. In Proceedings of the IEEE Conference on Computer Vision and Pattern Recognition, Honolulu, HI, USA, 21–26 July 2017; pp. 5551–5560. [Google Scholar]
- Ceniza, A.M.; Archival, T.K.B.; Bongo, K.V. Mobile Application for Recognizing Text in Degraded Document Images Using Optical Character Recognition with Adaptive Document Image Binarization. J. Image Graph. 2018, 6, 44–47. [Google Scholar] [CrossRef]


Publisher’s Note: MDPI stays neutral with regard to jurisdictional claims in published maps and institutional affiliations. |
© 2022 by the authors. Licensee MDPI, Basel, Switzerland. This article is an open access article distributed under the terms and conditions of the Creative Commons Attribution (CC BY) license (https://creativecommons.org/licenses/by/4.0/).