Article

Quasi-Static Mechanical Properties of Post-Processed Laser Powder Bed Fusion Ti6Al4V(ELI) Parts under Compressive Loading

1
Department of Mechanical Engineering, School of Engineering and Technology, South Eastern University Kenya, Kitui 90201, Kenya
2
Department of Mechanical and Mechatronics Engineering, Central University of Technology, Bloemfontein 9301, Free State, South Africa
3
Centre for Rapid Prototyping and Manufacturing, Faculty of Engineering, Built Environment and Information Technology, Central University of Technology, Bloemfontein 9301, Free State, South Africa
*
Author to whom correspondence should be addressed.
Appl. Sci. 2022, 12(19), 9552; https://doi.org/10.3390/app12199552
Submission received: 19 August 2022 / Revised: 8 September 2022 / Accepted: 20 September 2022 / Published: 23 September 2022

Abstract

:
The Ti6Al4V structures in aircraft and biomedical industries are usually exposed to quasi-static loads. Therefore, understanding the quasi-static behaviour of this alloy manufactured by an additive manufacturing process is paramount. This paper documents an investigation of the quasi-static mechanical properties of various microstructures of heat-treated Ti6Al4V(ELI) parts manufactured by laser powder bed fusion (LPBF). The effects of different quasi-static strain rates on different microstructures of these samples and their strain hardening are also presented. The test samples were produced using an EOSINT M280 direct metal laser sintering (DMLS) machine and, thereafter, subdivided into three major groups, namely samples C, D and E, for high-temperature annealing at different heat treatment strategies. A universal hydraulic testing machine (UTM) was used to carry out tests at strain rates of 0.001 s−1, 0.005 s−1 and 0.1 s−1. The three forms of LPBF Ti6Al4V(ELI) were found to be sensitive to quasi-static strain rate, whereby values of yield and flow stresses in each form of alloy increased with increasing strain rate. The order of the strength at each strain rate from the highest to the lowest was found to be samples C, D and E. The effects of strain rate on flow hardening were found to be significant in samples C and insignificant in samples D and E.

1. Introduction

Laser powder bed fusion (LPBF) is one of the additive manufacturing (AM) technologies that uses laser heat to consolidate materials in atomised powder form, in a layer-by-layer process, to form a three-dimensional component [1]. Like other AM technologies, such as electron beam powder bed fusion (EBPBF), directed energy deposition (DED) and wire arc additive manufacturing (WAAM), the thermal history associated with the process produces parts with multiscale architectures that differ from their wrought and cast counter parts [2]. Elongated grains, metastable phases and macro-scale residual stresses are among the features that characterise parts produced by AM [3]. The heat treatment of AM parts produced by different technologies for alleviation of macro-scale residual stress and decomposition of the metastable phase formed during the process to an equilibrium microstructure has been studied extensively [3,4].
The Ti6Al4V(ELI—extra-low interstitial) alloy parts produced via LPBF have particularly lured interest in the aerospace industry. This is mainly because the technology greatly reduces the buy-to-fly ratio, offers design flexibility, reduces the lead time for production and does not require the making of special tooling [5]. The freeform nature of the technology has also been beneficial for production of medical implants with convoluted shapes, particularly from the Ti6Al4V alloy. Extensive research has been carried out and is still ongoing to assess the quality of the LPBF Ti6Al4V parts for use in the biomedical and aerospace industries, with the prospect of application in the marine and military sectors [5,6,7]. The foremost demand for these additively manufactured parts in these industries are their load-bearing capacity, with their quasi-static, dynamic and fatigue performances being the key mechanical properties under consideration [8,9].
The mechanical properties of materials are fundamentally different at quasi-static strain rates (<102 s−1) compared with those under dynamic conditions (>102 s−1). During quasi-static loading, a state of quasi-static equilibrium is usually maintained as the load is applied very slowly, thus the stiffness of structures loaded this way is not governed by inertia. Furthermore, any element within such a structure has the sum of forces acting on it, approaching zero ( 0 acceleration effect). At dynamic conditions, on the other hand, deformation stresses travel through materials, resulting in different loading states for different regions at any given time and, therefore, large, induced inertia forces that cannot be ignored [10]. It has been shown that materials possess satisfactory ductility under quasi-static loads but may fail at small strains under dynamic loads [11]. However, the strength of materials has been shown to increase under dynamic loads due to the instantaneous pile up of dislocations at yielding [12]. Fatigue analysis is usually performed to discern the satisfactory performance level of structural parts under cyclic loading.
Additively manufactured Ti6Al4V for use in aircraft, military and automobile fields is predominately for quasi-static to high strain rate applications, whilst its use in the medical sector is largely at quasi-static conditions. In this study, the quasi-static mechanical performance of LPBF Ti6Al4V(ELI) was investigated from the aircraft, medical, military and automobile application points of view. The tensile static properties of AM Ti6Al4V have been investigate widely by various researchers [13,14,15,16]. Zhai et al. [13] investigated the ambient temperature tensile and fatigue properties of Laser Engineered Net Shaping (LENS)-produced Ti6Al4V, manufactured with different orientations. The mechanical response of as-built LPBF Ti6Al4V parts were characterised by tensile testing at quasi-static strain rate and ambient temperature by Voisin et al. [14]. Charlotte et al. [15] studied the tensile properties of EBPBF Ti6Al4V parts manufactured using two different themes and built along several orientations. The quasi-static and dynamic properties of as-built Ti6Al4V parts prepared by 3D laser deposition technology and produced with different orientations were investigated in Li et al. [16]. The static tensile properties of AM Ti6Al4V parts exposed to different heat treatment cycles were published in references [17,18,19,20]. The as-built LPBF Ti6Al4V parts are characterised by high process-related residual stresses and a needle-like-shaped α’-acicular martensitic microstructure. These two factors normally cause an increase in hardness and strength of the parts but at a cost of reduction in ductility [18,19]. Thus, to optimise the strength and ductility of LPBF Ti6Al4V for structural application, the parts are exposed to post-process heat treatment [17].
A review of the aforementioned studies suggests that the research has mostly focused on the static mechanical properties of as-built AM Ti6Al4V parts. The influence of build orientation on tensile static properties has also been widely investigated, with studies showing isotropy in these properties of LPBF parts [21,22]. However, the effects of quasi -static strain rates on different microstructures of AM Ti6Al4V(ELI) produced by different post-process heat treatment strategies are lacking in the literature [4,13,14,15,16,17,18,19,20]. Typically, the equilibrium microstructure of the AM Ti6Al4V alloy contains a large amount of α-phase with a hexagonal-closed-packed (HCP) structure and a small fraction of β-phase with a body-centred cubic (BCC) structure [23]. It also exists in different stable microstructures, namely lamellar, equiaxed, bimodal and Widmanstätten microstructures, based on the heat treatment, residence time and the cooling rate adopted [23]. The mechanical performance of Ti6Al4V depends on the type of microstructure as well as the intrinsic microstructural variables, such as crystallographic texture, grain size and levels of defects (mainly dislocation density) [24]. The high cycle fatigue strength and optimal static properties of this alloy have been shown to increase in the order of equiaxed, lamellar and bimodal microstructures [25]. However, intrinsic microstructural parameters, such as fraction and size of primary α in bimodal microstructure, diameter of equiaxed α-grains in equiaxed microstructure and the thickness of α-laths in lamellar microstructure, have been found to have profound influence on these mechanical properties [25,26].
In the present study, the compressive quasi-static mechanical properties of different microstructures of LPBF Ti6Al4V(ELI) at different strain rates were investigated. The as-built samples were first stress relieved to alleviate the macro-scale residual stresses. Subsequently, the stress-relieved microstructure of DMLS Ti6Al4V(ELI) was modified through different heat treatment strategies. Scanning electron microscopy (SEM) was used to study the microstructure and crystallographic texture of the obtained parts. A universal testing machine (UTM) was used to investigate the mechanical behaviour of the different heat-treated microstructures of the alloy at different quasi-static strain rates and at ambient temperature.

2. Materials and Methods

2.1. Materials and Samples Preparation

Cylindrical Ti6Al4V(ELI) test specimens with a diameter of 6 mm and height of 80 mm were manufactured in an EOSINT M280 DMLS machine using gas-atomised spherical powder of Ti6Al4V(ELI) obtained from TLS Technik GmbH. Different levels of interstitial elements are usually present in different grades of Ti6Al4V alloy and generally affect its mechanical properties. The Ti6Al4V(ELI) (grade 23) used in this study is very similar to Ti6Al4V (grade 5), in addition to that, it contains a reduced level of interstitial elements, which enhances the ductility and toughness of the alloy [27]. As shown in Table 1, the chemical composition of Ti6Al4V(ELI) as received from the supplier (TLS Technik GmbH) complied with the ASTM F3001-14 standard, a specification that establishes the chemical composition of Ti6Al4V(ELI) components manufactured using a full-melt powder bed fusion process [27].
The samples were manufactured in an EOSINT M280 DMLS machine with the set of process parameters as follows: scanning speed 1400 mm/s, laser power 175 W, layer thickness 30 µm, laser beam diameter 80 µm and hatch spacing 100 µm. The back-and-forth raster scanning strategy was employed in the manufacturing of samples for use in this study. The strategy generally uses stripe patterns in each layer that shift at an angle of 67° in the next layer. This scanning strategy is illustrated schematically in Figure 1. During the manufacturing process, the layers were at first offset by 100 µm from the external edges to form an internal region. This internal region was first scanned with laser energy using the strategy described in Figure 1. The region between the outer and the offset borders was then scanned. This manufacturing strategy ensures reduction in defects near the surface of the samples, as well as improving the surface finish of parts produced.
The cylindrical rods shown in Figure 2, which were manufactured for use in this study, were subdivided into three major groups for experimental testing, designated in this study as samples C, D and E.
The designations A and B were reserved for as-built and stress-relieved samples, respectively, which were taken to be reference specimens and were not used for experimental analysis in this study. The microstructure of these reference specimens was discussed in detail in the authors’ previous research published in Muiruri et al. [28,29]. Therefore, the microstructure analysis of these reference materials was omitted from this study. At first, the three main groups of specimens were stress relieved in a vacuum furnace while still on the steel platform with support structures. Thereafter, an electrical discharge machine (EBM—wire cutting) was used to cut these specimens from the DMLS machine platform, while at the same time removing the support structures.
Stress relieving to alleviate process-related macro-residual stresses was conducted in a vacuum chamber at a temperature of 650 °C, with a soaking period of 3 h, followed by furnace cooling to ambient temperature. The subsequent high-temperature heat treatment cycles imposed on each group of samples to allow for microstructural transformation are summarised in Table 2. The different controlled cooling rates shown in this table were achieved by switching off the heating elements in the furnace and accelerating an argon gas to the furnace chamber after the residence time elapsed. The detailed reason for the choice of these different heat treatment cycles can be found in the authors’ previous work in Muiruri et al. [29].

2.2. Preparation of Samples for Microstructure Analysis

The heat-treated cylindrical rods were cut into compression test samples, each with a length of 9 mm and diameter of 6 mm. Some of these compression test specimens cut in the region shown in Figure 2 were sectioned across the diameter (along the build orientation) for microstructural characterisation. An electrical discharge machine (wire cutting) was used for cutting these samples. The mounting of these cut specimens then followed, where they were placed in a mounting cylinder together with Multifast resin. The Citopress mounting machine (Struers Cleveland, OH, USA) was used for this work. The free surfaces of the mounted specimens were then plane-grinded on a 320 Grit SiC disc with water as a lubricant before being fine grinded on an MD-Largo surface with a DiaPro-Largo 9 µm diamond suspension followed by an MD-Mol with DiaPro Mol-3 µm diamond suspension. The grinded surfaces were then polished on an MD-Chem surface with colloidal silica (OP-S) and water as a lubricant. The polished surfaces were, thereafter, cleaned under tap water. Some of these surfaces were etched using a solution of Kroll’s reagent for the purpose of revealing the microstructure in secondary electron images (SEI) in an SEM. The other set of surfaces for electron backscatter diffraction (EBSD) analysis in the SEM was not etched, since in this method the grain boundaries are delineated by processing of misorientation from the Euler angle data measured.

2.3. EBSD Data Collection

The crystallographic texture of samples C, D and E was analysed using a JOEL JSM-7001 SEM (JOEL Ltd., Akishima, Japan) that was equipped with an EBDS detector system for EBSD analysis. A grid area of 755 µm by 980 µm on the polished sample surfaces was scanned for the analysis of texture. The orientation distributions of the scanned samples were acquired in the form of Euler angles and stored as (.cft) files for post-processing. Post-processing of the obtained EBSD data was conducted in MTEX toolbox 5.3.2, which is a MATLAB-based toolbox used for post-processing of EBSD data. Maps of the orientation and misorientation distribution were acquired for the three forms of LPBF Ti6Al4V(ELI) alloy. The statistical distribution of the Schmid factor for the dominant slip systems of the α-phase in the three different forms of the alloy was obtained and presented in this study with consideration of the direction of applied quasi-static load. The average width of the α-laths in each microstructure was estimated from maps of grain distribution using the line intercept method as described in the ASTM E112-13 standard [30].

2.4. Quasi-Static Strain Rate Testing

Quasi-static strain rate tests were conducted in an Instron 1342 servo-hydraulic UTM (Norwood, MA, USA) shown in Figure 3 at the Council for Scientific and Industrial Research (CSIR) of South Africa.
The test frame consisted of a two-column, dynamically rated load frame with a calibrated capacity of load of up to 50 kN. The compression tests were executed in rate control, thus generating desired strain rate in the gauge section of a test specimen. The three forms of LPBF Ti6Al4V(ELI) alloy were each tested at strain rates of approximately 0.001 s−1, 0.005 s−1 and 0.1 s−1. To ensure that the end surfaces of the test specimens had a perfect contact with the loading cells during testing, they were faced off on a lathe machine. A set of at least three specimens in each group of the samples was tested at each strain rate and all tests were conducted at ambient temperature. The samples were loaded to give sufficient plastic deformation at each strain rate without necessarily fracturing due to limitations of the testing frame. The deformation features arising from these tests were analysed using SEM.

3. Results and Discussion

3.1. Microstructure and Microtexture Characterisation

The microstructures and distribution of the α-grain boundaries in samples C, D and E, that resulted after the heat treatment cycles presented in Table 2, are presented in Figure 4. As seen in Figure 4a,b, the intermediate heat treatment temperature (800 °C for 2 h), which is far below the β transus temperature (980 °C), transformed the initial α’-acicular microstructure of the as-built samples (whose details are published in the authors’ work in Muiruri et al. [28,29]) into a stable mixture of α + β-phase. The β-phase appears in Figure 4a,c,e as bright regions, while the α-phase appears dark. The β-phase appears in particle-like morphology and is distributed along the grain boundaries of the α-laths. Coarsening of the α-laths is observed in Figure 4c,d for the samples that were heat treated at 940 °C for 2.5 h followed by annealing at 750 °C with a residence time of 2 h. The β-phase is still embedded along the coarsened α-laths but has lamellar morphology in contrast to the particle-like shape shown in samples C. Columnar epitaxial prior β grains elongated parallel to the build orientation are visible in Figure 4b,d for samples C and D, respectively. These columnar prior β grains are related to the continuous heating, rapid cooling rate and solidification associated with the DMLS build process.
As the laser heats the substrate, the Ti6Al4V(ELI) powder is melted and rapidly solidifies as the laser moves away. In this process, small equiaxed grains of prior β-phase grow during solidification since the heating temperature usually exceeds the β-transus temperature. The formed equiaxed grains provide ideal nucleation sites for the subsequent melted layer. Therefore, the equiaxed prior β grains orthogonal to the laser scan direction continue to be nucleated and grow epitaxially from the prior β grains in the previous layer, and the process goes on, causing the columnar growth of β grains parallel to the build orientation as shown in Figure 4b,d.
Since samples E were exposed to heat treatment above the β-transus temperature (1020 °C for 2 h), the columnar epitaxial prior β grains shown in Figure 4b,d were decomposed and replaced by semi-equiaxed and equiaxed prior β grains shown in Figure 4f. The microstructure of samples E seen in Figure 4e has colonies, each containing numerous parallel α-laths, with their sizes restricted by the neighbouring α-colonies. Thick and continuous grain boundary α is also seen in Figure 4e at prior β grain boundaries having a thickness of about 8 µm. It is apparent in Figure 4 that the α-laths were coarser as the heat treatment temperature was increased. A study has shown that the α-grain sizes in the LPBF Ti6Al4V parts heat treated at temperatures below the β-transus temperature (980 °C) were not primarily dependent on the rate of cooling but on the heat treatment temperature in the α + β zone [19]. As the heat temperature treatment increases in this zone, the transformed α-phase nuclei become scattered, and thus the α-laths coarsen to a larger extent during cooling before interaction with other neighbouring laths occurs [17,19]. The cooling rate has a profound effect in LPBF Ti6Al4V parts when cooling from temperatures above the β-transus temperature, where the much faster cooling rate leads to formation of finer α-laths and vice versa [31,32,33]. The optical micrographs of samples C, D and E showing microstructural features on a larger area of these samples can be found in [29]. The volume percentage of β-phase in samples C, D and E was estimated by the X-ray diffraction method in [29] as 3.6%, 6.4% and 6.5%, respectively. For detailed analysis of XRD profiles of samples C, D and E, the reader is referred to the authors’ work in Muiruri et al. [29].
The crystallographic microtexture in the form of orientation distribution maps and local grain/intragranular misorientation maps of different forms of the DMLS Ti6Al4V(ELI) alloy is shown in Figure 5. The microtexture plays a critical role in determining the mechanical performance of Ti6Al4V(ELI) because it impacts the activities and roles of all the slip systems in it.
In Figure 5a,c, the α-laths are seen to have grown from the columnar prior β boundaries toward the interior of the grains. However, most of these α-laths within the same β-grain have a random orientation shown by the colour codes related to specific orientations as represented by the Inverse Pole Figure (IPF) key inserted in each of the micrographs in Figure 5a,c,e. Several orientations or invariants of α-laths can be seen within the same prior β grains in samples C (Figure 5a) and samples D (Figure 5c). These different invariants are related to the β→ α phase transformation during cooling, where twelve definite orientations of α-phase can be precipitated from a single-parent β-grain [30,32]. Nevertheless, a few α-grains of the same elongated prior β grain have orientations that tend to occur more frequently than others, and this is shown by the frequent occurrence of the same colour of these α-laths. Typical examples of these crystals are shown by white arrows in Figure 5a,c. This preference of certain orientations during β→α transformation in Ti6Al4V is attributed to variant selection, of which further details can be found in [34]. The typical orientation map of samples E shown in Figure 5e consists of semi-equiaxed and equiaxed shapes of the prior β grains with different colonies. Each colony consists of parallel α-laths, which have the same crystallographic orientation, as depicted by the similar colour.
Figure 5b,d,f shows the high-angle grain boundaries (HAGBs) represented by the black solid lines and the low-angle grain boundaries (LAGBs)/intragranular structures represented by the orange lines in samples C, D and E, respectively. The HAGBs were set as the boundaries where the misorientation angle between neighbouring laths was 10°, while the LAGBs were set as those with the misorientation angle being < 10°. It is clear from Figure 5b that in some areas the columnar prior β grain boundaries were LAGBs connecting to HAGBs from both ends. The LAGBs were also observed in samples D (Figure 5d), most of which were running across several α-laths. In Figure 5f, the α-laths in most colonies are seen to possess LAGBs between them and HAGBs between different colonies. Additional details on the misorientation angle distribution and proportions of LAGBs and HAGBs in samples C, D and E can be found in the authors’ previous work published in [29].
The grain size distribution in area fraction for various microstructures of LPBF Ti6Al4V(ELI) is presented in the histogram in Figure 6. It is evident in Figure 6a that 50% of the EBSD-scanned area in samples C is occupied by grains, each with an area 5 µm2. The relative fraction area occupied by grains decreases as the grain area increases. About 45% of the EBSD-scanned area in samples D was occupied by grains each with an area of 38 µm2 and, like samples C, the relative fraction area occupied by grains decreases as the grain area increases but up to grains with an area of about 647 µm2. In Figure 5c, samples E showed an opposite trend to the one observed in samples C and D. About 38% of the EBSD-scanned area is occupied by large grains with areas between 14,830 µm2 and 35,090 µm2. One possible reason for this is the growth of the thick and continuous grain boundary α shown in Figure 4e, and large semi-equiaxed colonies each filled with parallel laths of LABGs, consequently forming one large grain. The relative fraction of the area then decreases with the decrease in the area of the grains up to grains with an area of 4703 µm2 and below. The average thickness of the α-laths in samples C, D and E were estimated through the line intercept method as 2.5 µm, 6 µm and 9 µm, respectively.

3.2. Analysis of Schmid Factor for a Load Applied along the Build Direction

The orientation maps of various forms of DMLS Ti6Al4V(ELI) shown in Figure 5 may not necessarily indicate the ease of slip for different deformation systems in the material under load. The Schmid law is commonly used to predict the ease of slip of different slip systems in a material depending on the direction of applied load. For further details on the Schmid law, different deformation mechanisms in α- and β-phases in Ti6Al4V and the use of the MTEX toolbox for statistical analysis of the global Schmid factor, the reader is referred to the authors’ work published in ref. [34]. In this study, the statistical analysis of the global Schmid factor for the three main slip mechanisms of the α-phase in the three different microstructures of LPBF Ti6Al4V(ELI) was conducted based on the loading axis of quasi-static test compression specimens.
The loading axis of the test samples was the same as the build direction during the DMLS process and, together with the second rank stress tensor acting on this axis, is illustrated in Figure 7. Since the volume fraction of the retained β-phase in samples C, D and E is very small (<7%), as stated in Section 3.2, its effect on the deformation of the alloy was ignored, and only the global Schmid factor for the common slip systems in the α-phase was evaluated in this study. Figure 8, Figure 9 and Figure 10 show the statistical distribution of the global Schmid factor for prismatic, basal and pyramidal <α> slip systems in different forms of LPBF Ti6Al4V(ELI) alloy.
It is seen in Figure 8 that 66%, 63% and 43% of α-grains in samples C, D and E, respectively, have their global Schmid factor higher at values in the range of 0.4–0.5 for the basal slip system. Only 33% of grains in samples C and D, and 39% of grains in sample E, have their values of global Schmid factor in the range of 0.4–0.5 for the prismatic slip system, as seen in Figure 9. Moreover, 57% of the grains in the three different groups of DMLS Ti6Al4V(ELI) samples have their global Schmid factor in the upper range for the pyramidal <α> slip system. The difference in the values of critical resolved shear stress (CRSS) between the basal, prismatic and pyramidal <α> slip systems is comparatively small [34]. However, the sequence of ranking for these deformation mechanisms in terms of CRSS from low to high was seen in [34] to be basal, prismatic and pyramidal <α>. The observation made in Figure 8, Figure 9 and Figure 10 and proceeding discussions suggest that the α-grains with high values of Schmid factor in either of the deformation systems are likely to be activated during plastic deformation.

3.3. Quasi-Static Mechanical Properties

Figure 11 shows the measured stress–strain curves of the three microstructures of LPBF Ti6Al4V(ELI) at various levels of quasi-static strain rate and at ambient temperature. The values of yield stress (YS) and ultimate compressive stress (UCS) obtained for the three forms of material at each strain rate is summarised in Figure 12. As seen from these figures, the values of yield and flow stresses increased with an increase in strain rate. However, it is interesting to note that in Figure 11a the effect of strain rate on yield and flow stress was more significant in samples C as compared with samples D and E, especially between the curves for the tests conducted at strain rates of 0.001 s−1 and 0.005 s−1. One possible reason for this observation is the fine microstructure of samples C reported in Figure 4a and Figure 5a. The fine grain sizes in this form of the alloy would lead to a decrease in the distance in which mobile dislocations have to travel before encountering serious obstacles, thereby enhancing the strain sensitivity of the materials.
In other words, dislocations in fine α-laths encounter obstacles such as the grain boundaries and local misorientations observed in Figure 5, generally after travelling only a short distance. This increases the chances of a material to encounter a serious pile-up of dislocation and a consequently high increase in strength as the strain rate increases.
At the same strain rate, the difference in flow stress curves among these different samples seen in Figure 11d–f, and the values of obtained yield and ultimate compressive stresses presented in Figure 12 are considered to be significant. The order of the strength of the material from the highest to the lowest is seen to be in samples C, D and E. This variation in the flow stress curves of these various forms of LPBF Ti6Al4V(ELI) was ascribed to differences in microstructure and microtexture among these samples. The microstructure of samples C presented in Figure 4 and Figure 5 consisted of fine lamellar microstructure with the average thickness of α-laths being 2.5 µm. These α-grains are also randomly oriented as discussed in Figure 5, which hinders slip transfer between neighbouring grains during plastic deformation. Moreso, the microstructure of samples group C largely consisted of α-lath grains, each with an area less than 5 µm2. The small grains are associated with large networks of grain boundaries as seen in Figure 5b, which are barriers to dislocation motion, thus increasing the strength of the materials.
The grain boundary strengthening ( σ d ) is usually described in terms of the well-known Hall–Petch relationship, which is of the form σ d = K h p d 1 2   [35]. The symbol K h p denotes the Hall–Petch constant, which is a material constant that arises due to stress concentration against grain boundaries emanating from accumulation of dislocations. When enough stress is generated against such grain boundaries, dislocation sources are activated in the adjacent grains. For the lamellar type of microstructure shown in Figure 4 and Figure 5, the parameter d is usually taken as the shortest distance that dislocations have to move before encountering obstacles, which is usually the thickness of the α-lath in these microstructures. Thus, taking K h p as 328 M P a μ m 1 2 for Ti6Al4V(ELI) [36], the average thickness of the α-laths noted in Figure 4 and Figure 5 would contribute a stress of about 207.45 MPa, 133.91 MPa and 109.33 MPa to the yield stress, for samples C, D and E, respectively. These values explain the observations made in Figure 10 and Figure 12. It is worth noting that the studies have shown that there is a limit of grain size for which the Hall–Petch relationship can be used [37]. The literature has shown that when the average grain size of a material decreases to approximately 40 nm , the inelastic deformation mechanisms start to change from dislocation-based to grain-boundary-based deformation. The grain boundary deformation mechanisms include grain boundary sliding and dislocation absorption at grain boundaries, which lead to softening and, thus, decrease in flow stress [38,39]. The lower yield and flow stress in samples E was also ascribed to the presence of parallel α-laths, characterised by LAGBs between them as seen in Figure 5f, which could suggest ease of slip transfer between adjacent grains. The strain hardening of the different microstructures of LPBF Ti6Al4V(ELI) at different quasi-static strain rates is summarised in Figure 13.
It is noted in Figure 13 that these different microstructures exhibited noticeable strain hardening at different levels of strain rate, for the larger part of the flow stress curve. From the plotted curves in Figure 13, at the initial stage of plastic deformation, the strain hardening rapidly decreased quasi-linearly with the increase in strain, suggesting that the flow stress increased at a decreasing rate as the level of strain rose at this stage. The strain hardening rate was the highest at the stage of initial plastic strain (0–0.04) as a result of initial high density of free dislocations in these microstructures, and hence high rates of accumulation and multiplication within this range of plastic strain. The strain hardening at this stage was also attributed to the interaction of dislocations amongst themselves or with other defects, such as LAGBs and HAGBs described and discussed in Figure 5b,d,f. The decrease in strain hardening rate with increasing strain was ascribed to the formation of dislocation forests and more ordered dislocation substructures as plastic strain increased [40].
The effects of strain rate on strain hardening was significant in samples C as observed in Figure 13a, where the strain hardening was higher at low strain rate and lower as test strain rate increased. However, as seen in Figure 13b,c, the strain hardening curves of samples D and E, respectively, were largely overlapping at the three quasi-static test strain rates. One possible reason for the observation made for samples C was the fine microstructure and extended large network of HAGBs observed in this material in Figure 5b. As the largest portion of the microstructure in samples C was occupied by grains with small areas (<4.96 µm2), any change in strain rate would cause an instantaneous accumulation of dislocations, increasing the yield stress but at the cost of post-yield strain hardening.
After this early stage of strain hardening, as the plastic deformation progresses, the straining hardening effect is seen to continue decreasing, and eventually maintains a relatively steady state in all test samples and at all test strain rates, as observed in Figure 13a–c. The relatively steady state of strain hardening is due to the balance between dislocation accumulation and dislocation annihilation (balance of strain hardening and softening).
Figure 13d–f shows the effects of microstructure on the strain hardening of DMLS Ti6Al4V(ELI) at strain rates of 0.1 s−1, 0.005 s−1 and 0.001 s−1, respectively. The strain hardening at the initial stage from the highest to the lowest is seen to be in the order of samples C, samples D and samples E. The high extent of strain hardening in samples C is due to the presence of fine α-grains shown in Figure 4 and Figure 5. Generally, the equivalent plastic strain of polycrystalline materials generates a higher density of dislocations, and this effect is more pronounced for materials with reduced average grain size [40]. Due to the relatively large grains in samples D and E as compared with samples C, more time is required to generate dislocations, and therefore results in serious pile-up because a threshold amount of dislocation pile up is needed to result in significant strain hardening.

3.4. Analysis of Deformation Surfaces

To determine failure mechanisms under quasi-static loads for different microstructures of LPBF Ti6Al4V(ELI), microstructural analysis was carried out for samples tested at each strain rate. Figure 14, Figure 15 and Figure 16 show the microstructures of deformed samples and corresponding failure mechanisms. The typical condition of the samples after testing at each strain rate is shown in (d) of each of these figures. Microstructural analysis of these deformed surfaces revealed that adiabatic shear bands (ASBs), shown in each micrograph in these figures, were the primary failure mechanism in the three microstructures of the LPBF Ti6Al4V(ELI) alloy. The ASBs formed in all samples were tested at different strain rates. Adiabatic shear failure is generally thought to dominate the failure of materials loaded at high strain rate [41]. This is due to the fact that during the deformation of materials at high strain rates, inelastic work is transformed into heat, which cannot fully dissipate into the surrounding material during the short period of the plastic flow [42]. This raises the local temperature, causing thermal softening, which at some instance of plastic strain outweighs the flow hardening, and shear instability occurs. A shear localization occurs, forming a narrow shear band such as the ones shown in Figure 14, Figure 15 and Figure 16, when the stress within the shear zone is exceeded by stress in other larger zones of the material [43].
It is apparent from the observations made in Figure 14, Figure 15 and Figure 16 that adiabatic shear deformation for Ti6Al4V is also prominent at quasi-static strain rates, and this has also been reported in other studies on AM material [16,44]. However, the sizes of the ASBs were found to be thicker for the tests conducted at high strain rate for samples C, D and E reported in ref. [45] as compared with the ones reported in Figure 14, Figure 15 and Figure 16 for tests conducted at quasi-static strain rate. The values of the thickness of the ASBs measured from Figure 14, Figure 15 and Figure 16 and those obtained from [45] for tests conducted at two high strain rates for the three microstructures of LPBF Ti6Al4V(ELI) are shown in Table 3.
The results presented in Table 3 follow from the fact that at high strain rates, the peak stresses and corresponding plastic shear strain are higher, thus higher peak temperatures in localised zones are expected, and therefore a wider ASB formation is imminent. The deformed surfaces of samples C and D are characterised by narrow transformed shear bands with cracks propagating along them. The bifurcation of these narrow shear bands is evident in samples D. Both transformed and deformed shear zones are evident in samples E shown in Figure 16b,c. These different shear zones are an outcome of the extent of strain localization occurring during deformation. The transformed narrow zones (ASBs), such as those shown in Figure 14, Figure 15 and Figure 16, are as a result of extensive localised flow, while the deformed shear zones seen in Figure 16b,c, characterised by shearing lamellar laths, are formed as a result of lesser localised flow due to higher ductility of the material. The presence of deformed shear zones in samples E were attributed to the ease of slip, and therefore plastic deformation aided by parallel α-laths in the microstructure shown in Figure 4e and Figure 5e. The thickness of the transformed ASBs in samples E is also seen to remain unchanged as the quasi-static strain rate increases. This was ascribed to earlier formation of deformed adiabatic shear zone in these samples, thus impeding formation of wider transformed ASBs within the tested plastic strain range. However, the difference in thickness of transformed ASBs is conspicuous at high strain rates because such levels of strain rate are known to cause large plastic deformation within a very short period. Similar to samples C and D, the cracks in samples E shown in Figure 16 were seen to initiate and propagate along the ASBs, suggesting that the rupture of these samples would occur due to separation along the ASBs.

4. Conclusions

The quasi-static mechanical properties of various microstructures of LPBF Ti6Al4V(ELI) were presented and discussed in this study, with the following conclusions deduced:
(a)
The orientation of samples C and D consisted of several invariants of α-grains related to β→α phase transformation during cooling. The orientation map of samples E consisted of semi-equiaxed and equiaxed shapes of the prior β grains with various colonies, each consisting of crystals with similar orientation.
(b)
The α-laths in colonies of most semi-equiaxed and equiaxed β-grains in samples E possessed LAGBs between them and HAGBs between different colonies.
(c)
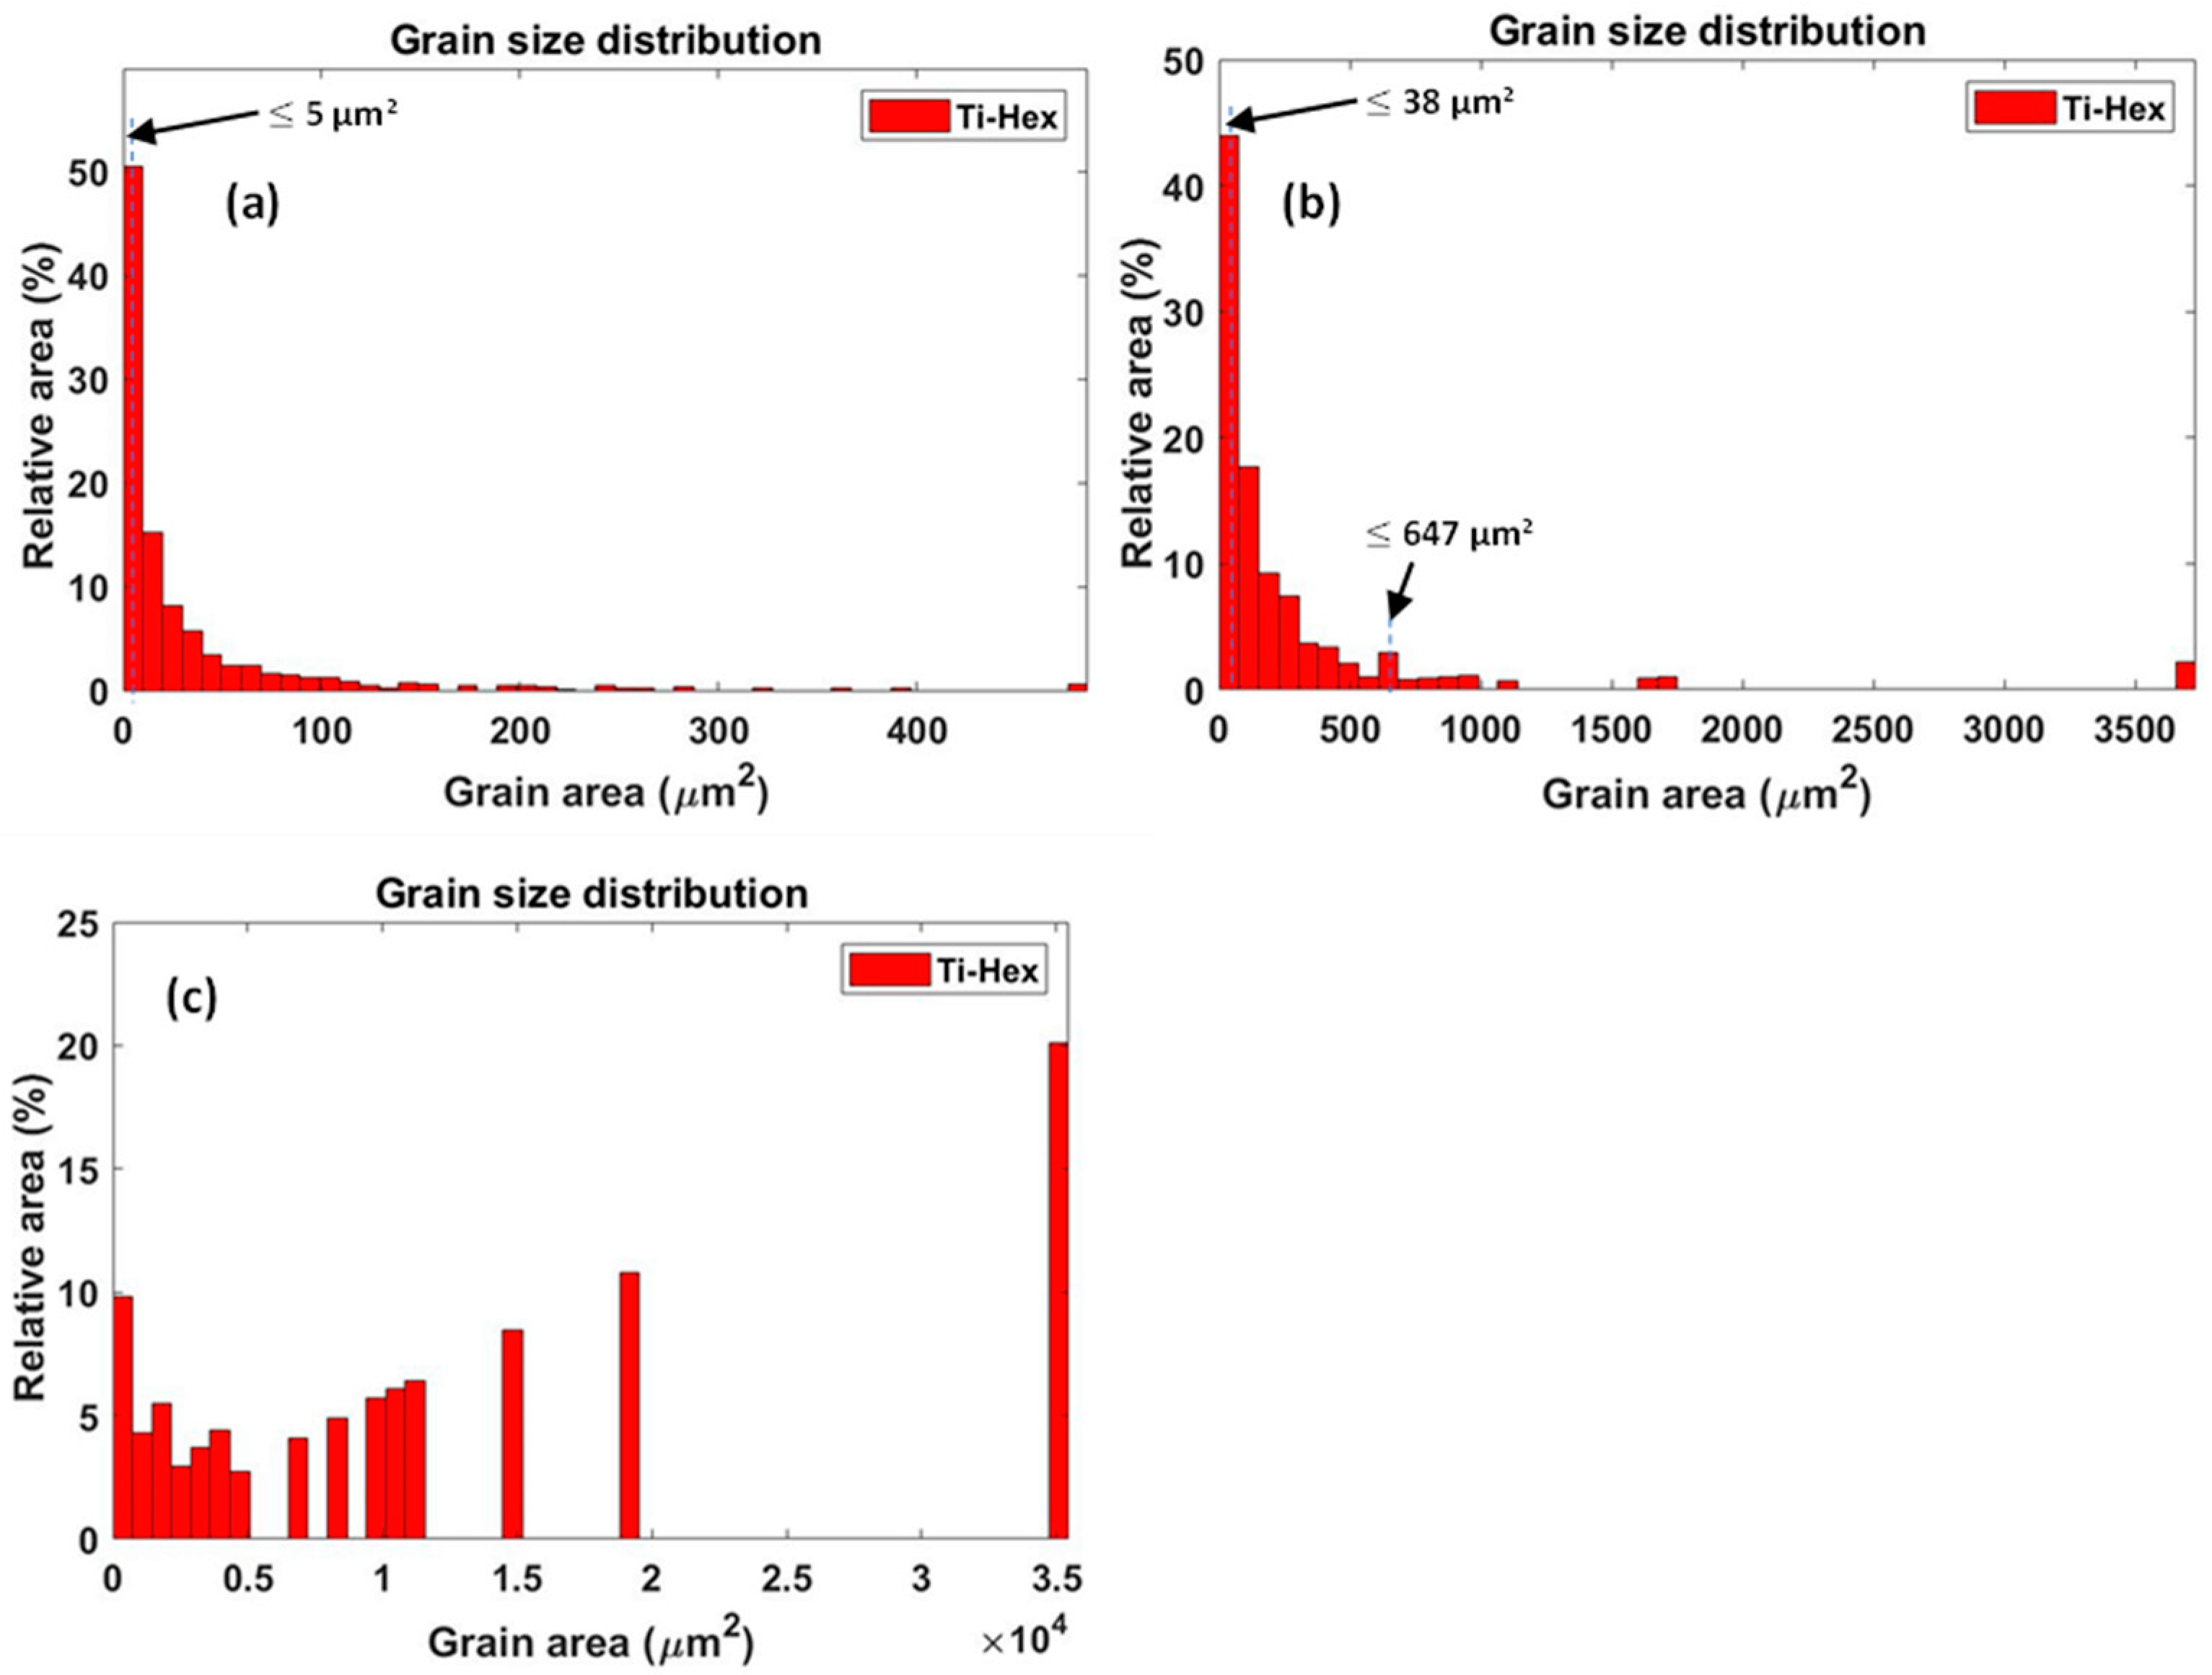
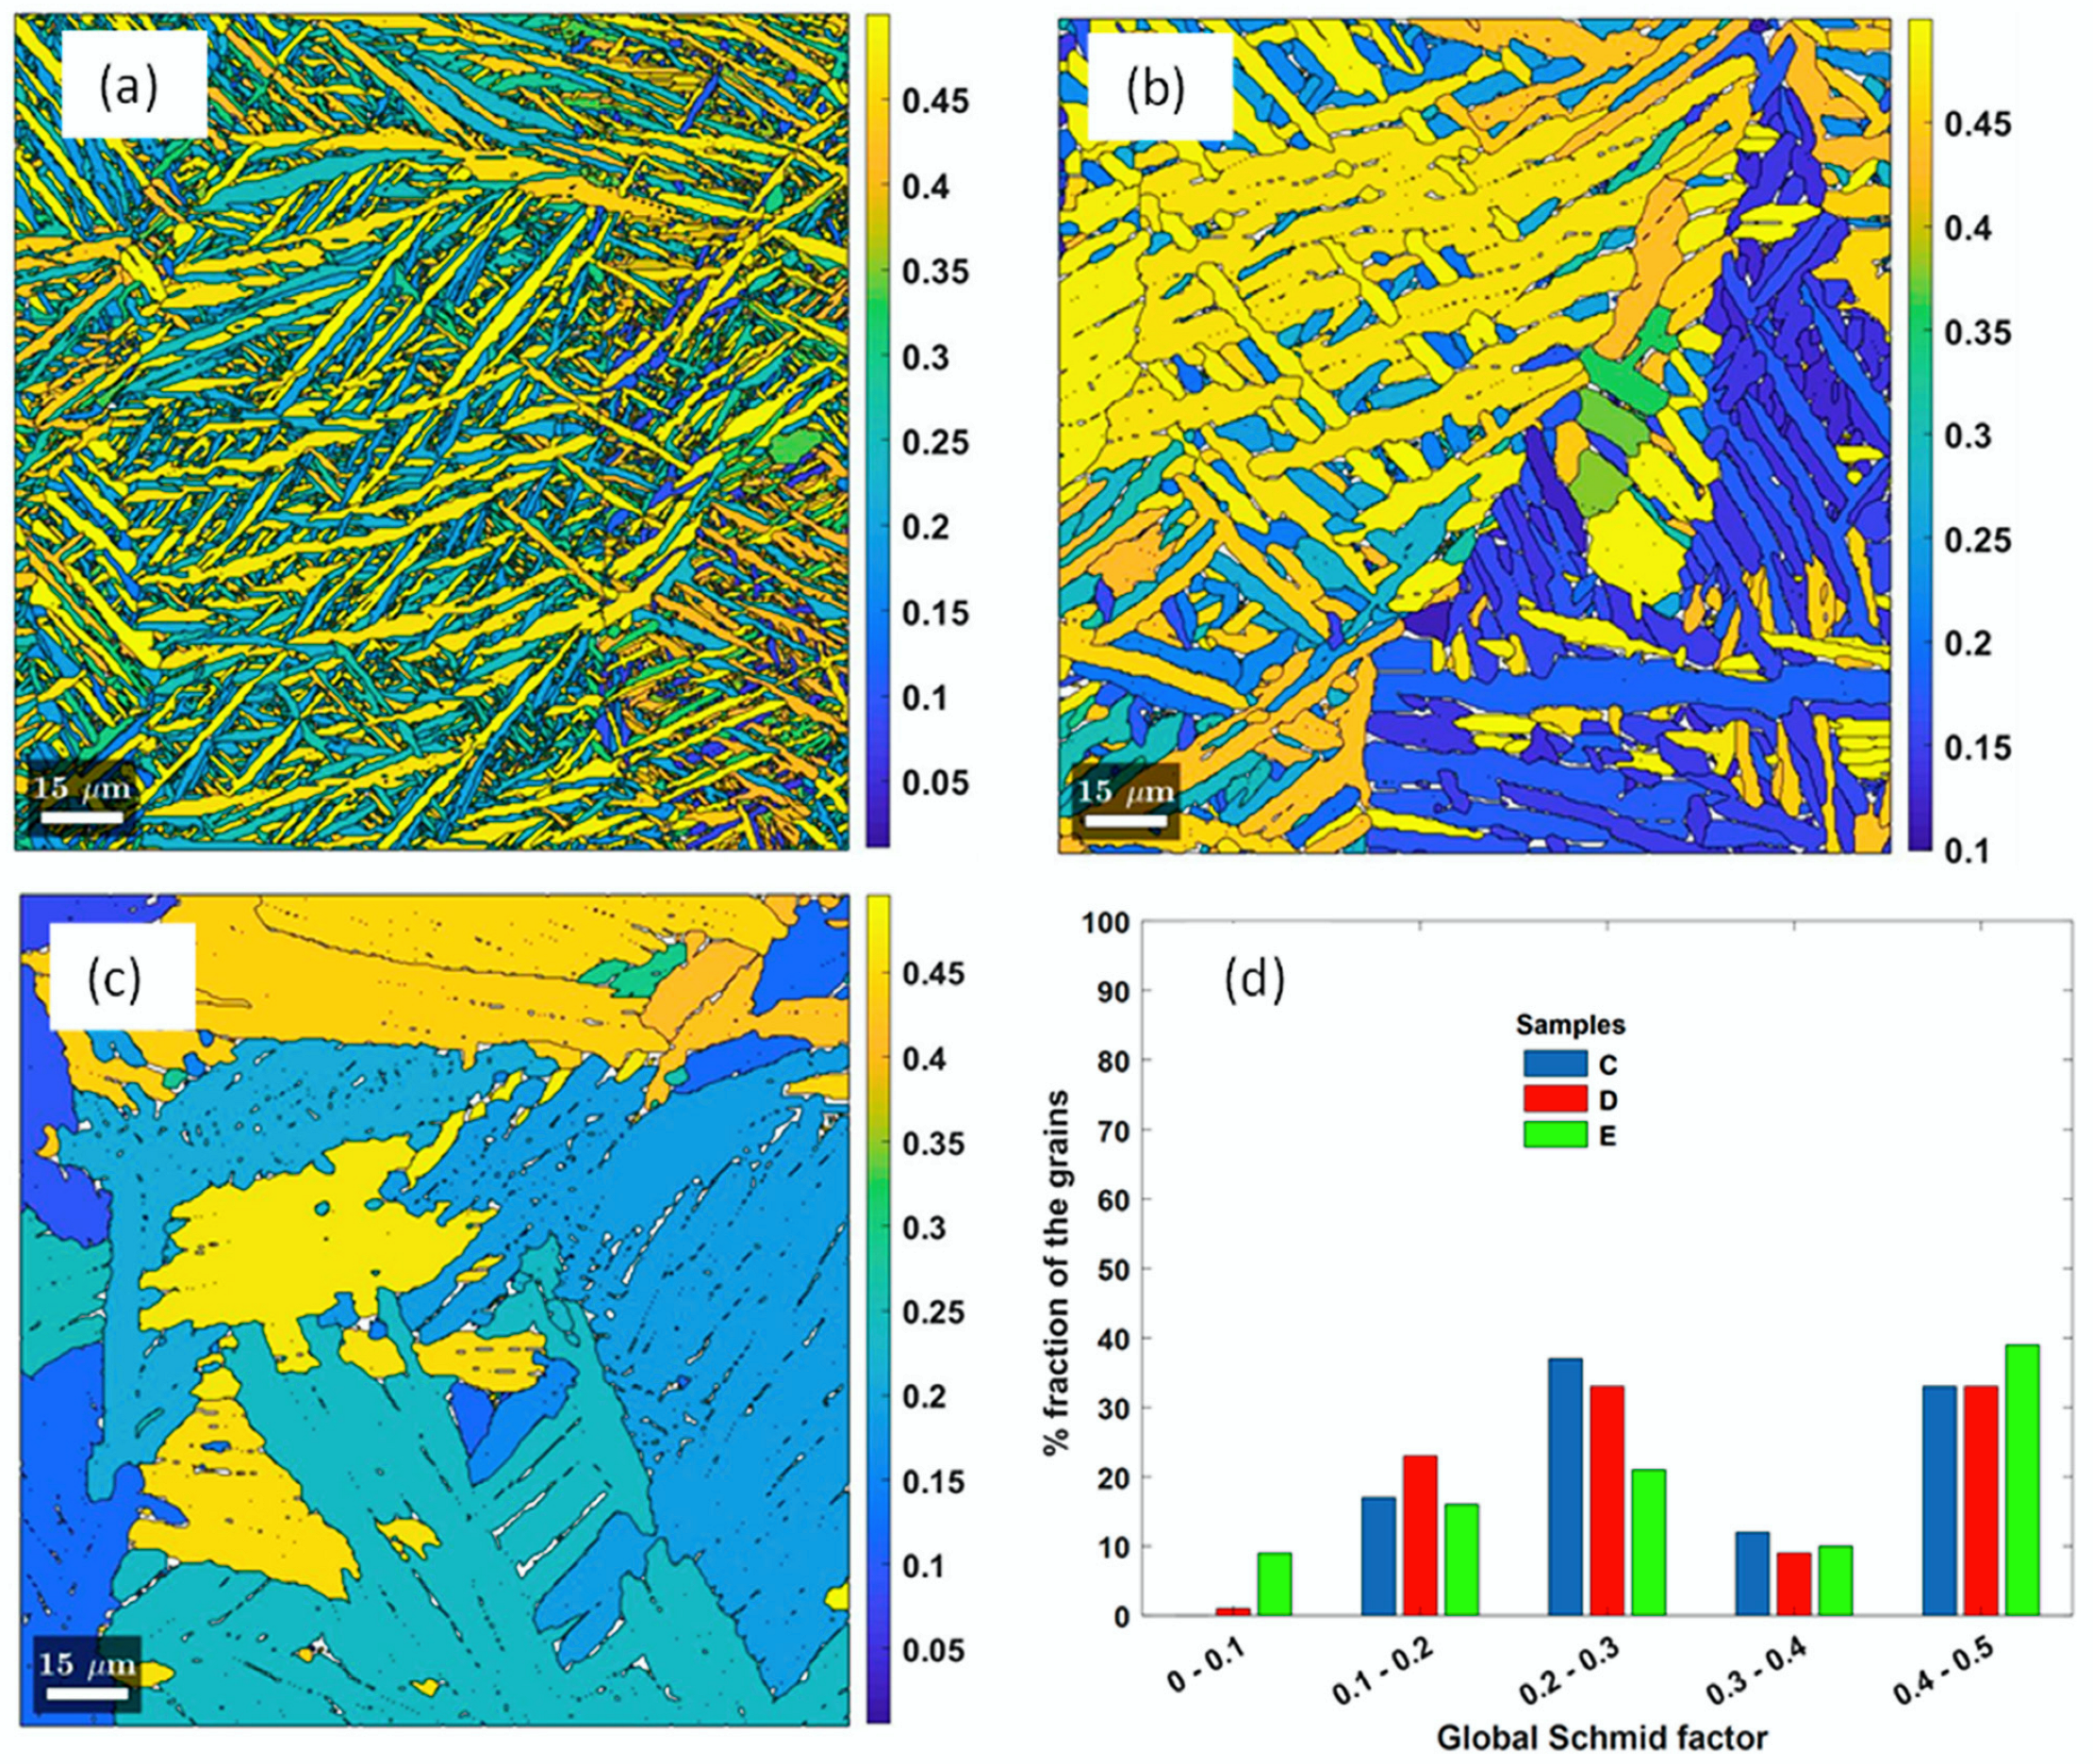
About 50% and 45% of the EBSD-scanned areas in samples C and D were occupied by grains, with individual areas being 5 µm2 and 38 µm2, respectively. About 38% of the EBSD-scanned area in samples E was occupied by large grains with areas between 14,830 µm2 and 35,090 µm2.
(d)
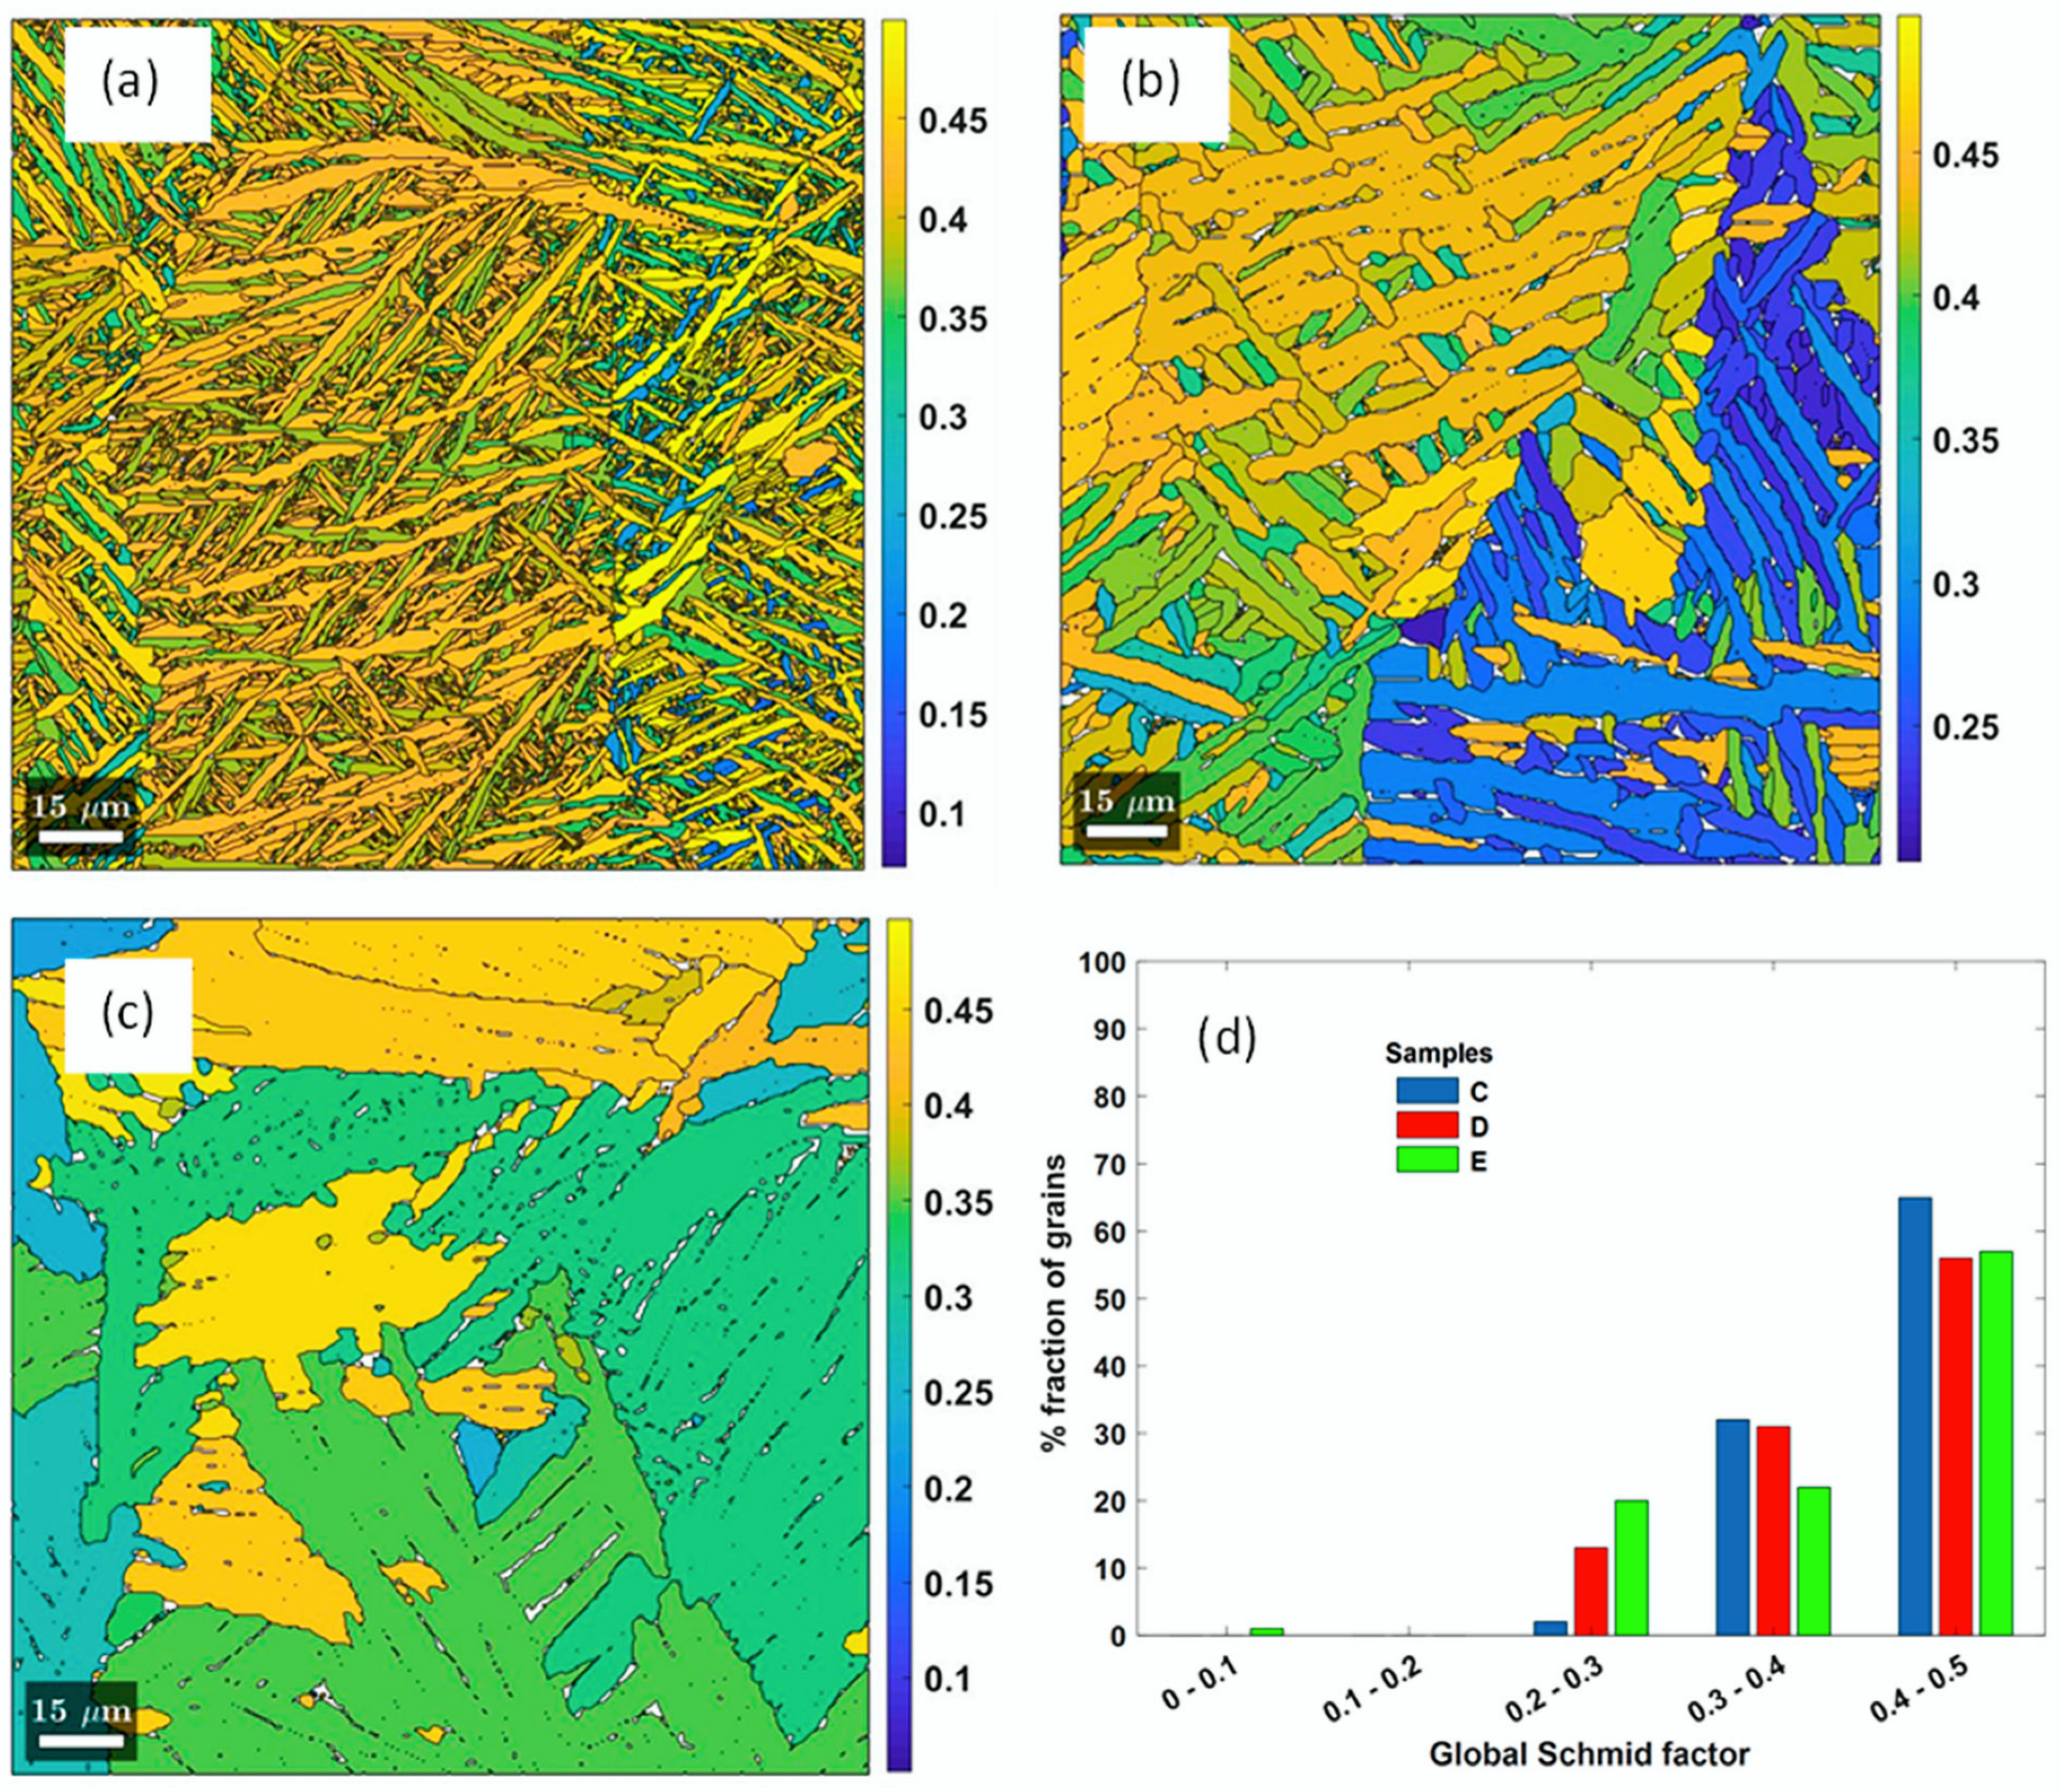
About 66%, 63% and 43% of α-grains in samples C, D and E, respectively, had their global Schmid factor higher at values in the range of 0.4–0.5 for the basal slip system in the direction of application of quasi-static load.
(e)
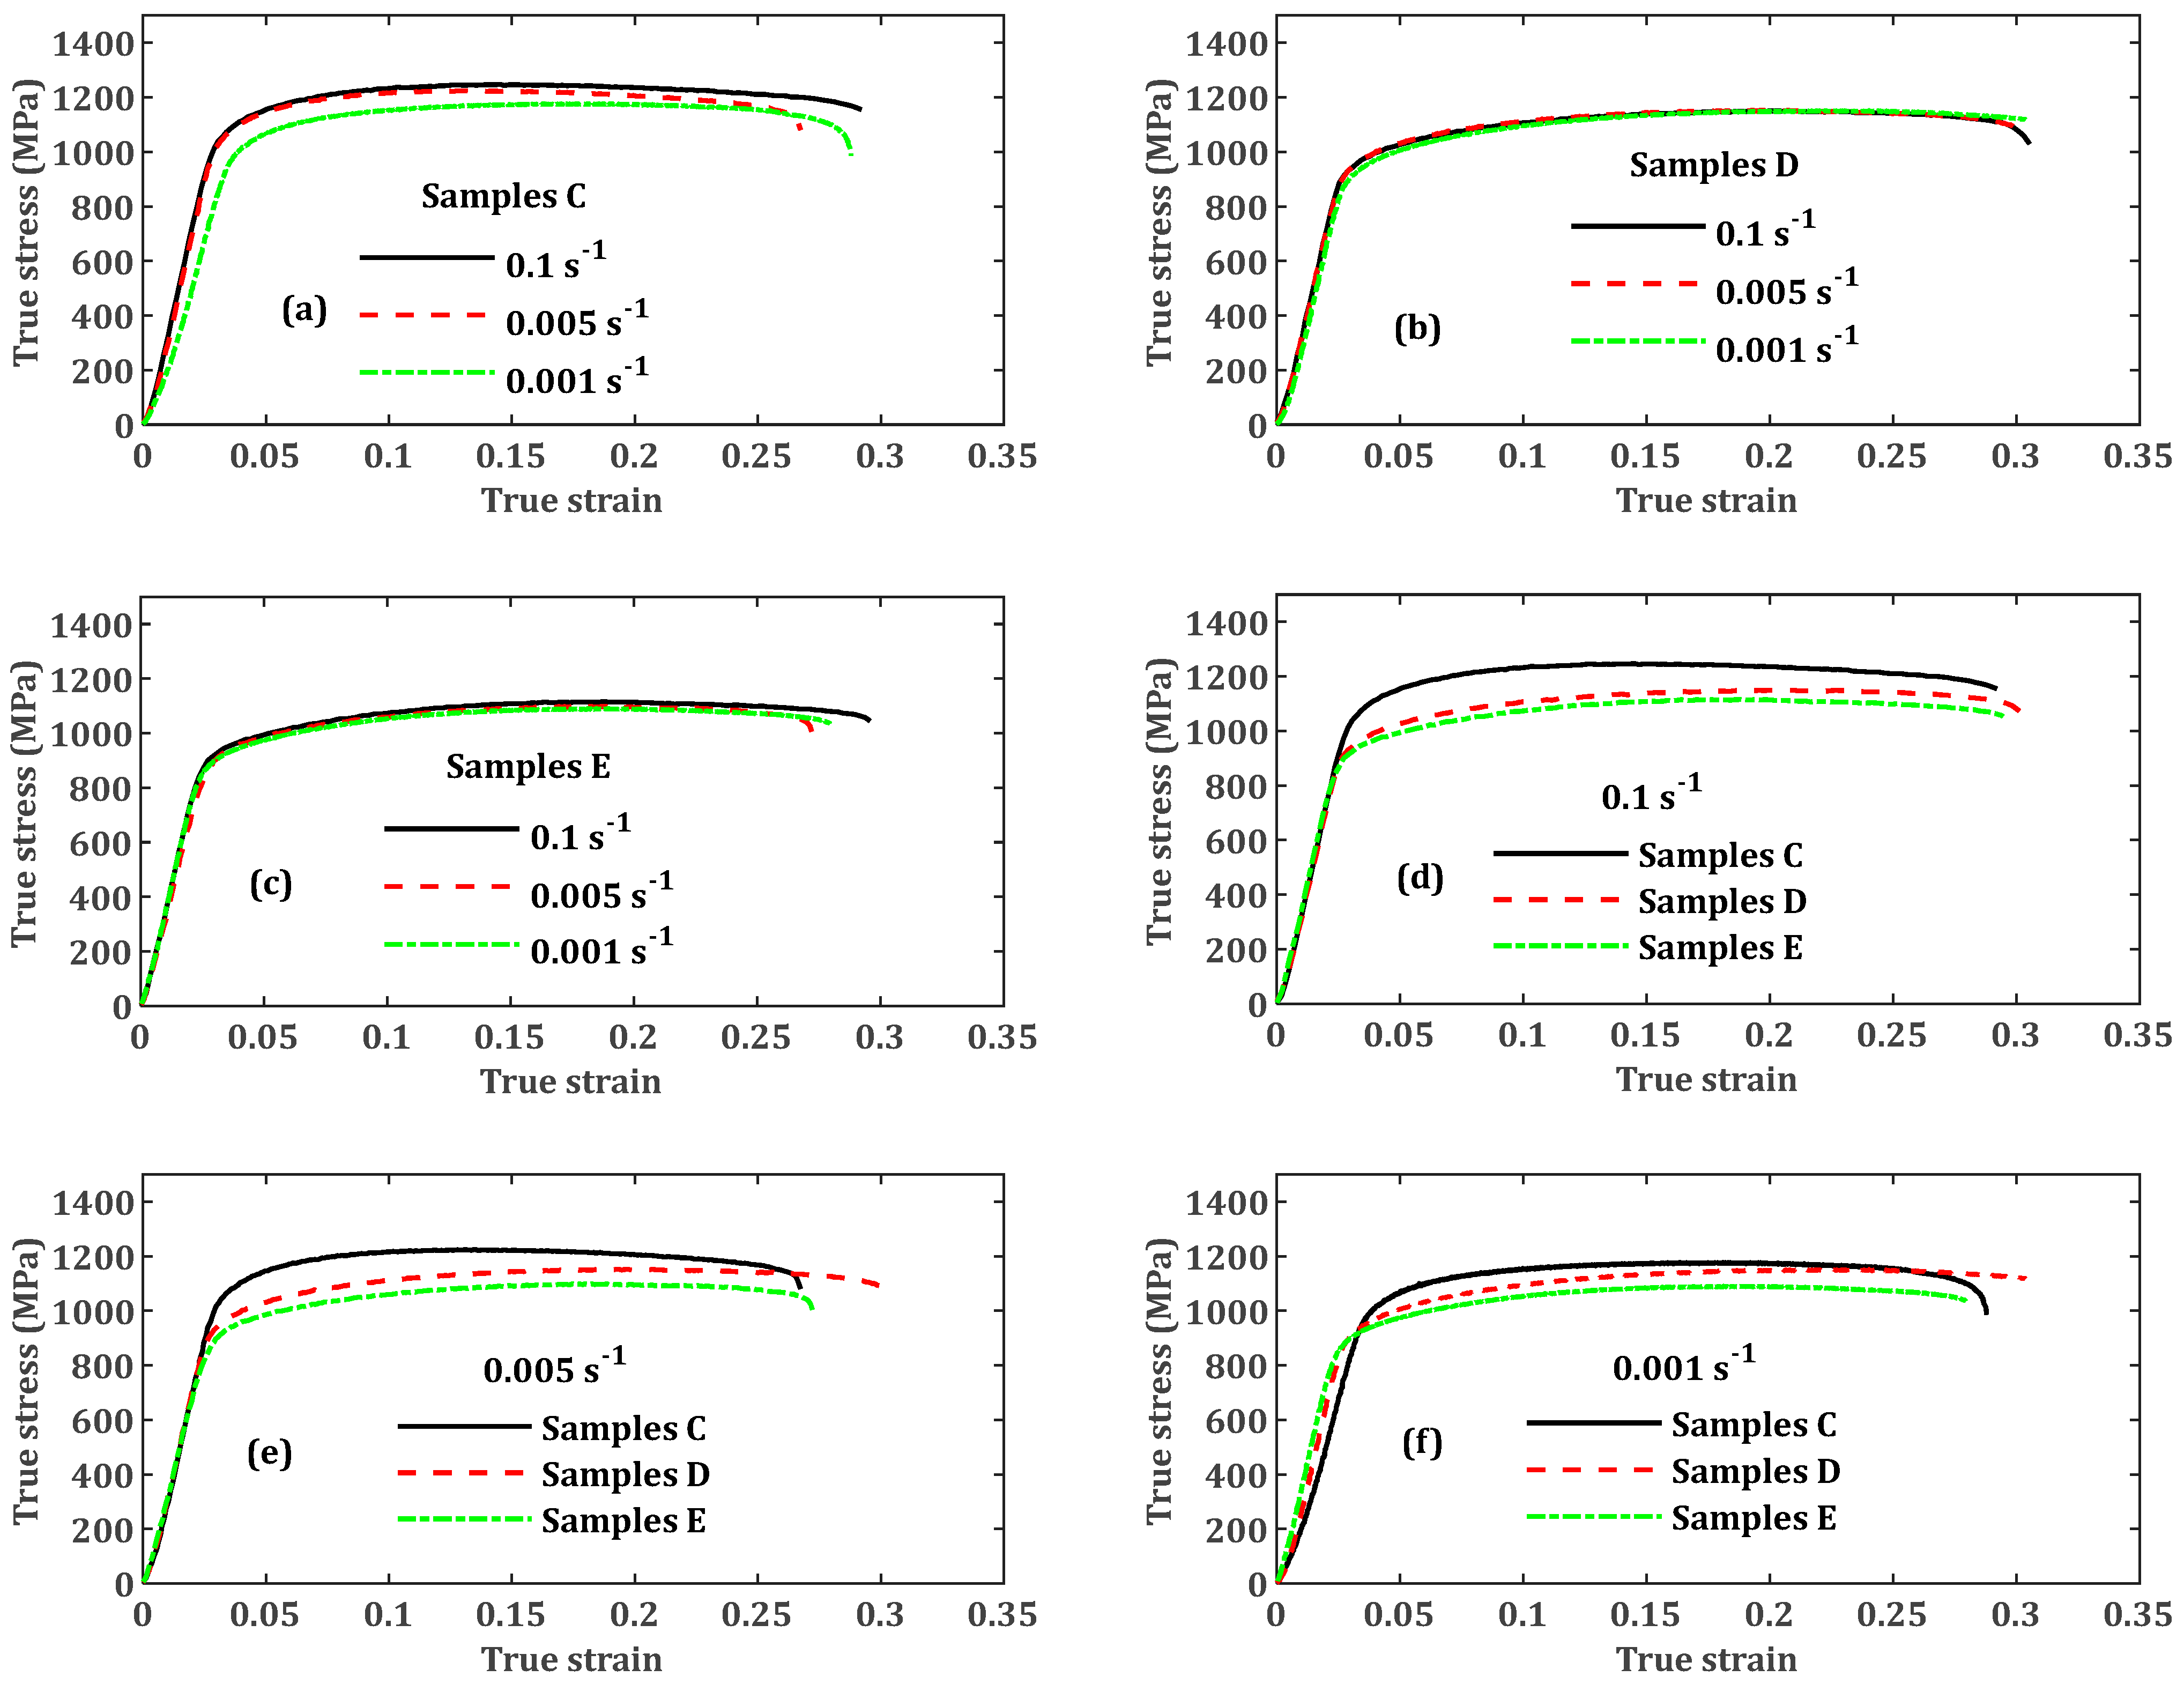
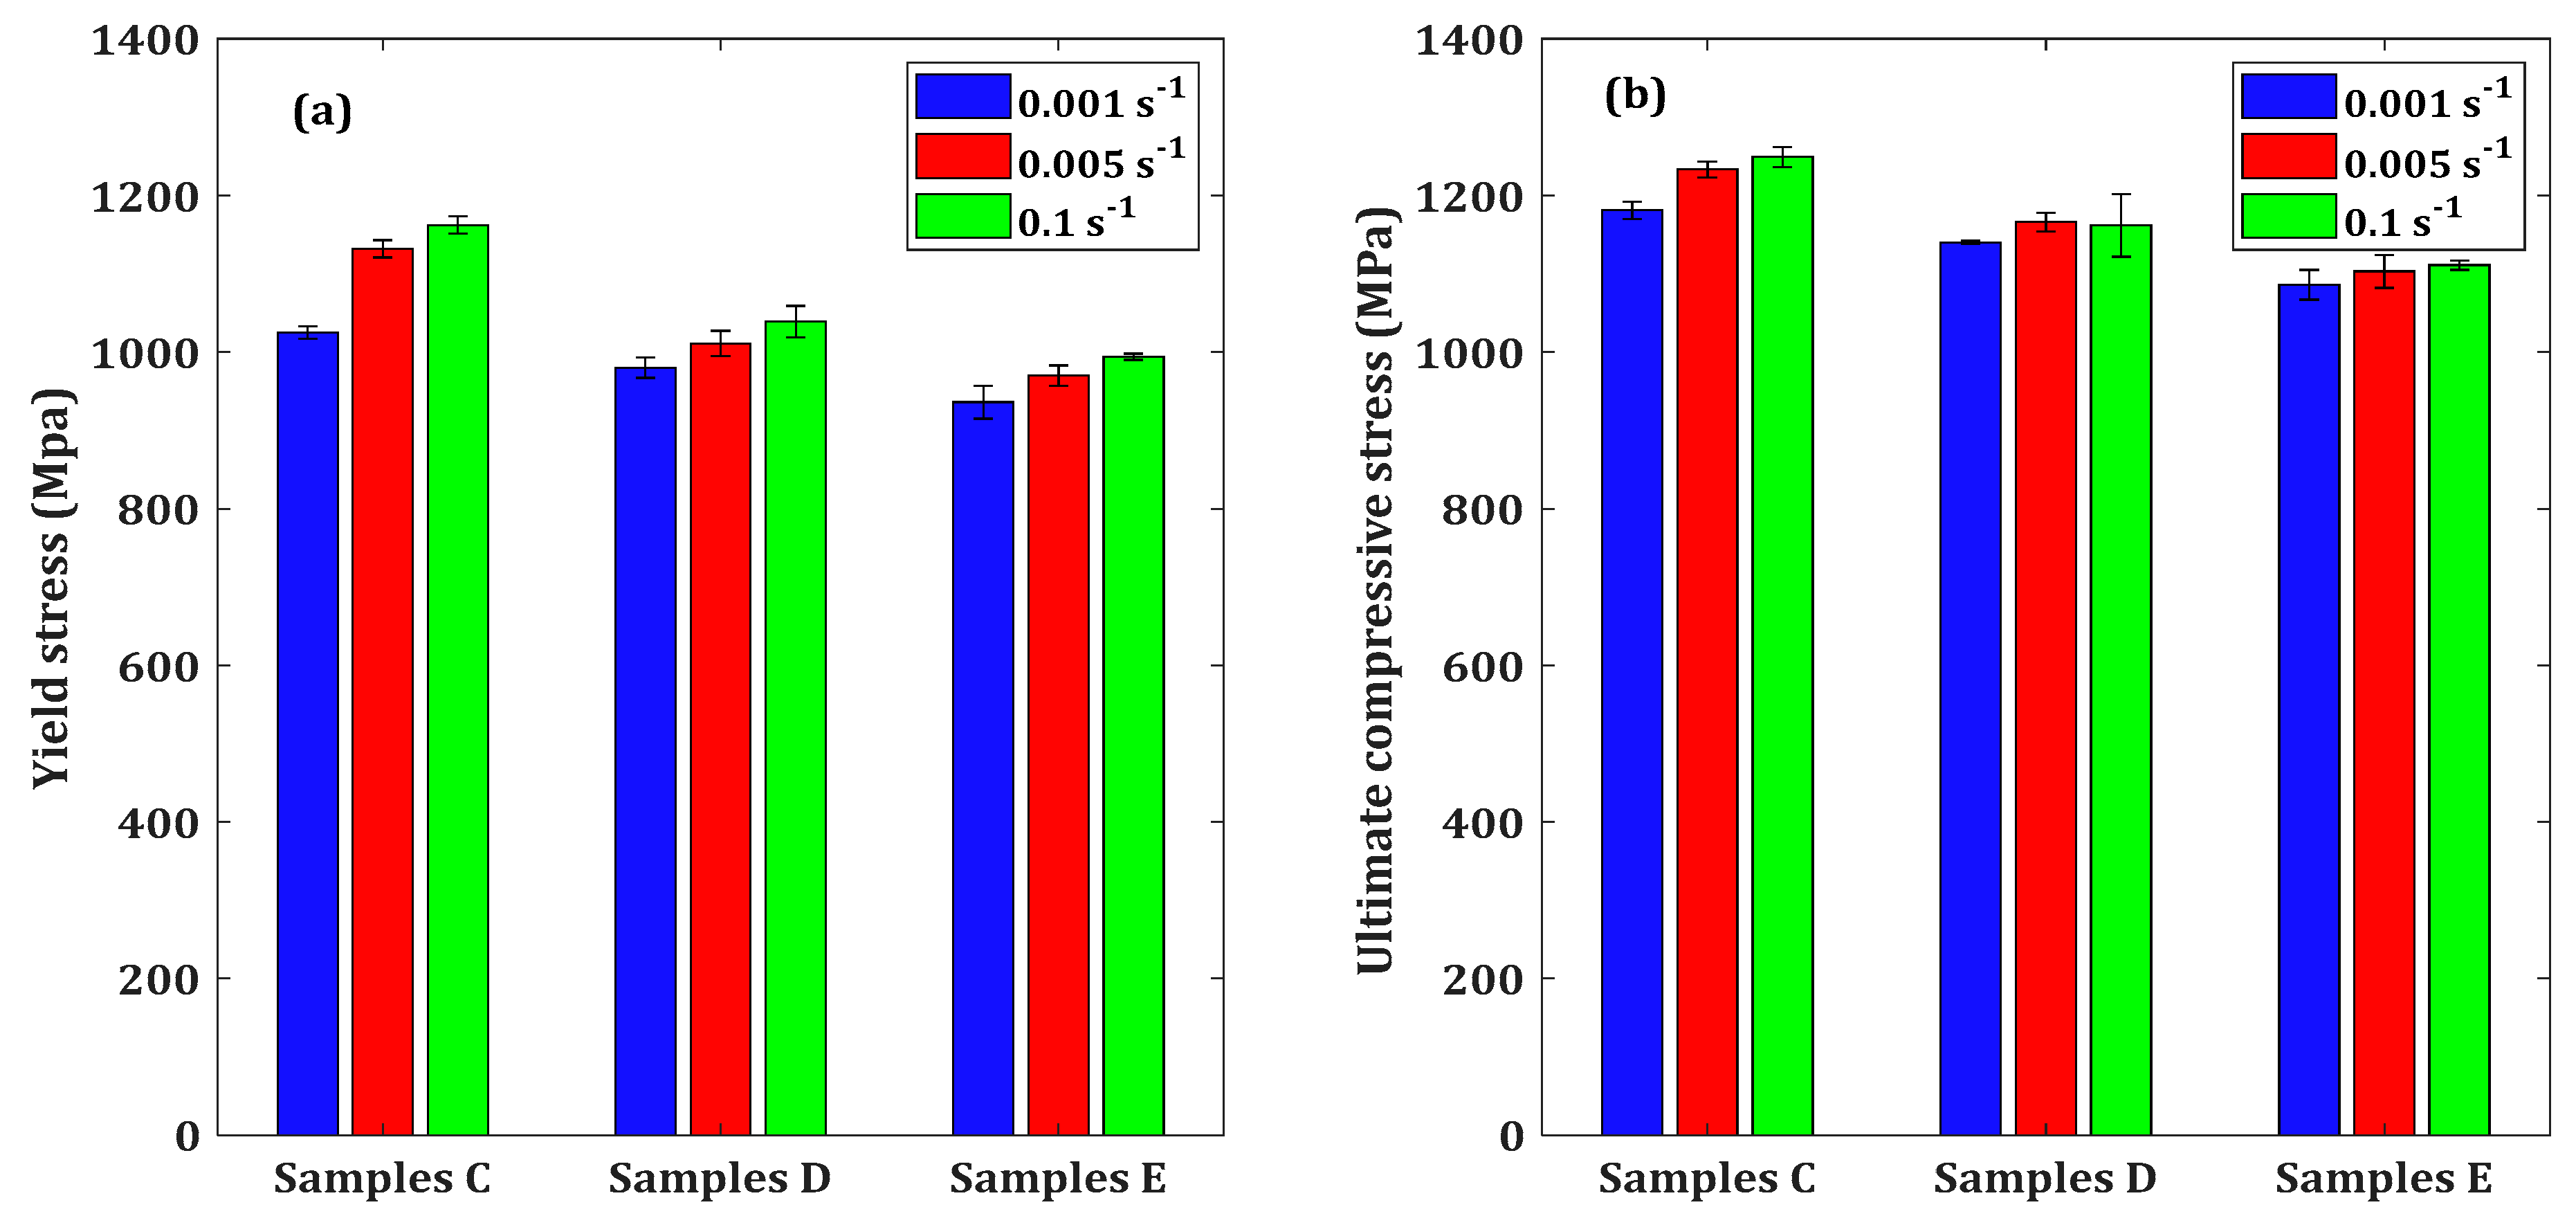
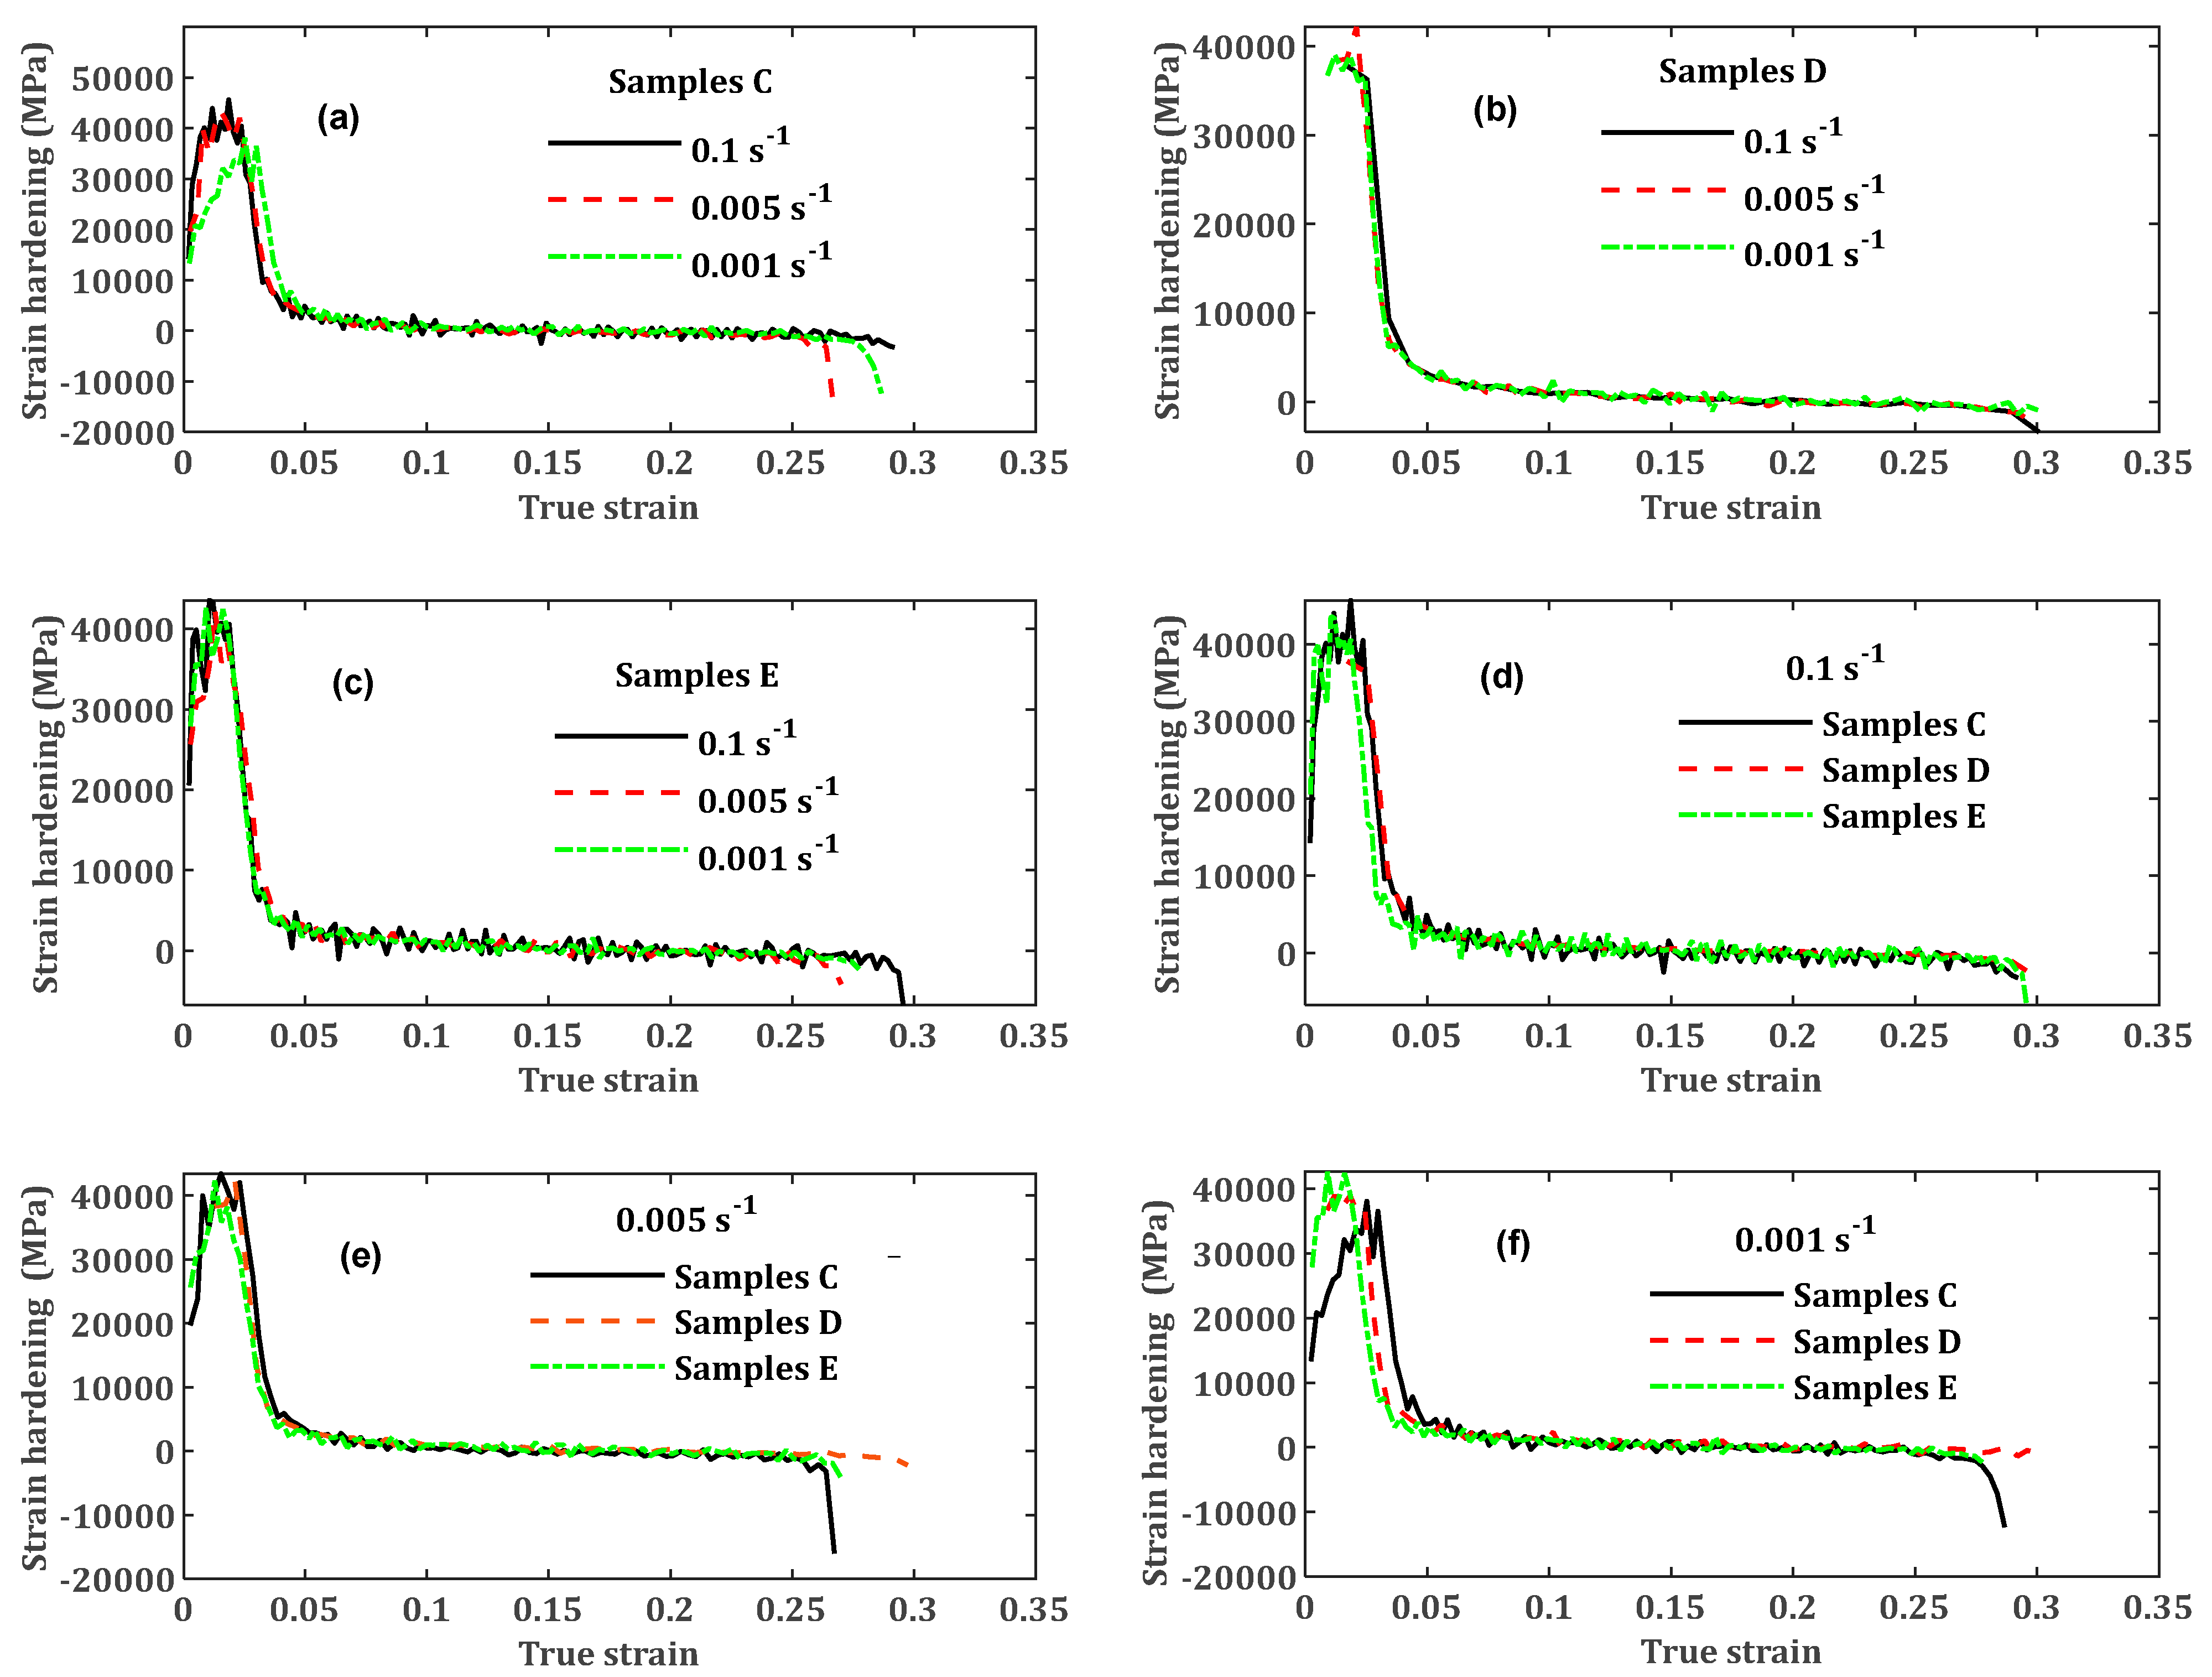
The values of yield and flow stresses for the three different microstructures of LPBF Ti6Al4V(ELI) increased with an increase in quasi-static strain rate.
(f)
The order of the strength of the different forms of LPBF Ti6Al4V(ELI) from the highest to the lowest at different strain rates was seen to be samples C, D and E.
(g)
Various microstructures of LPBF Ti6Al4V(ELI) exhibited noticeable flow hardening at different levels of strain rate for the larger part of the flow stress curve.
(h)
The effects of strain rate on flow hardening were significant in samples C and insignificant in samples D and E.
(i)
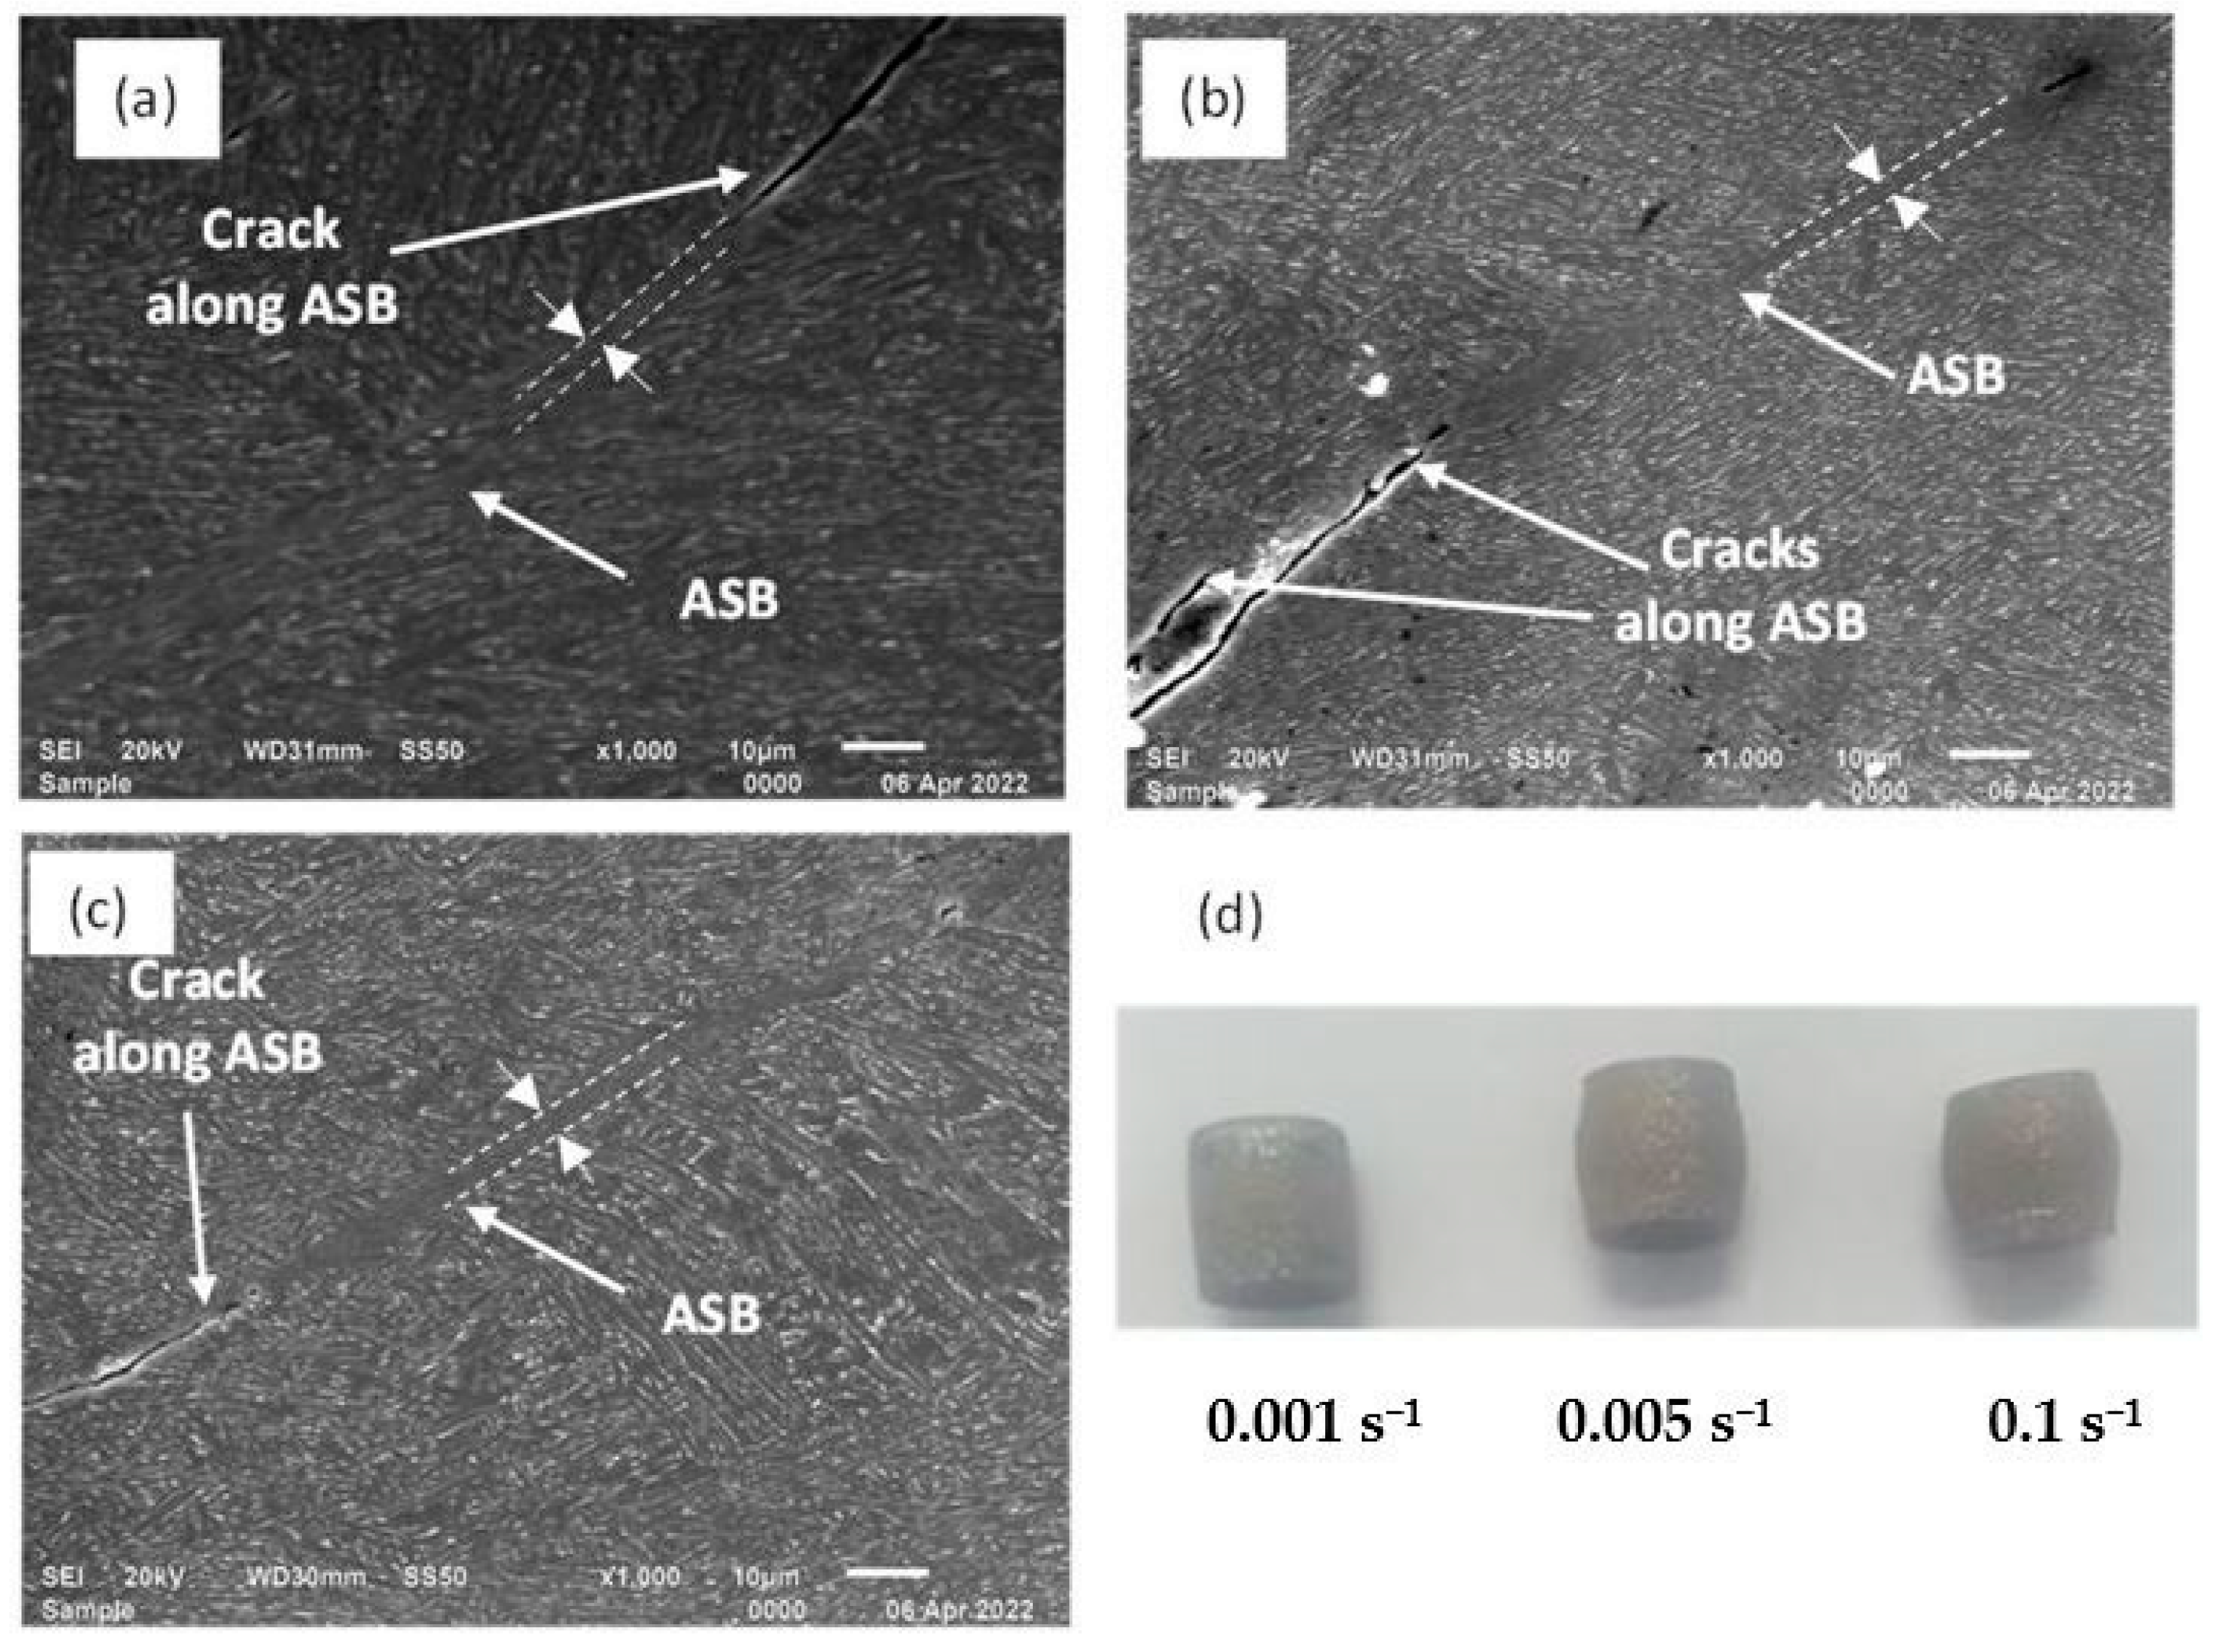
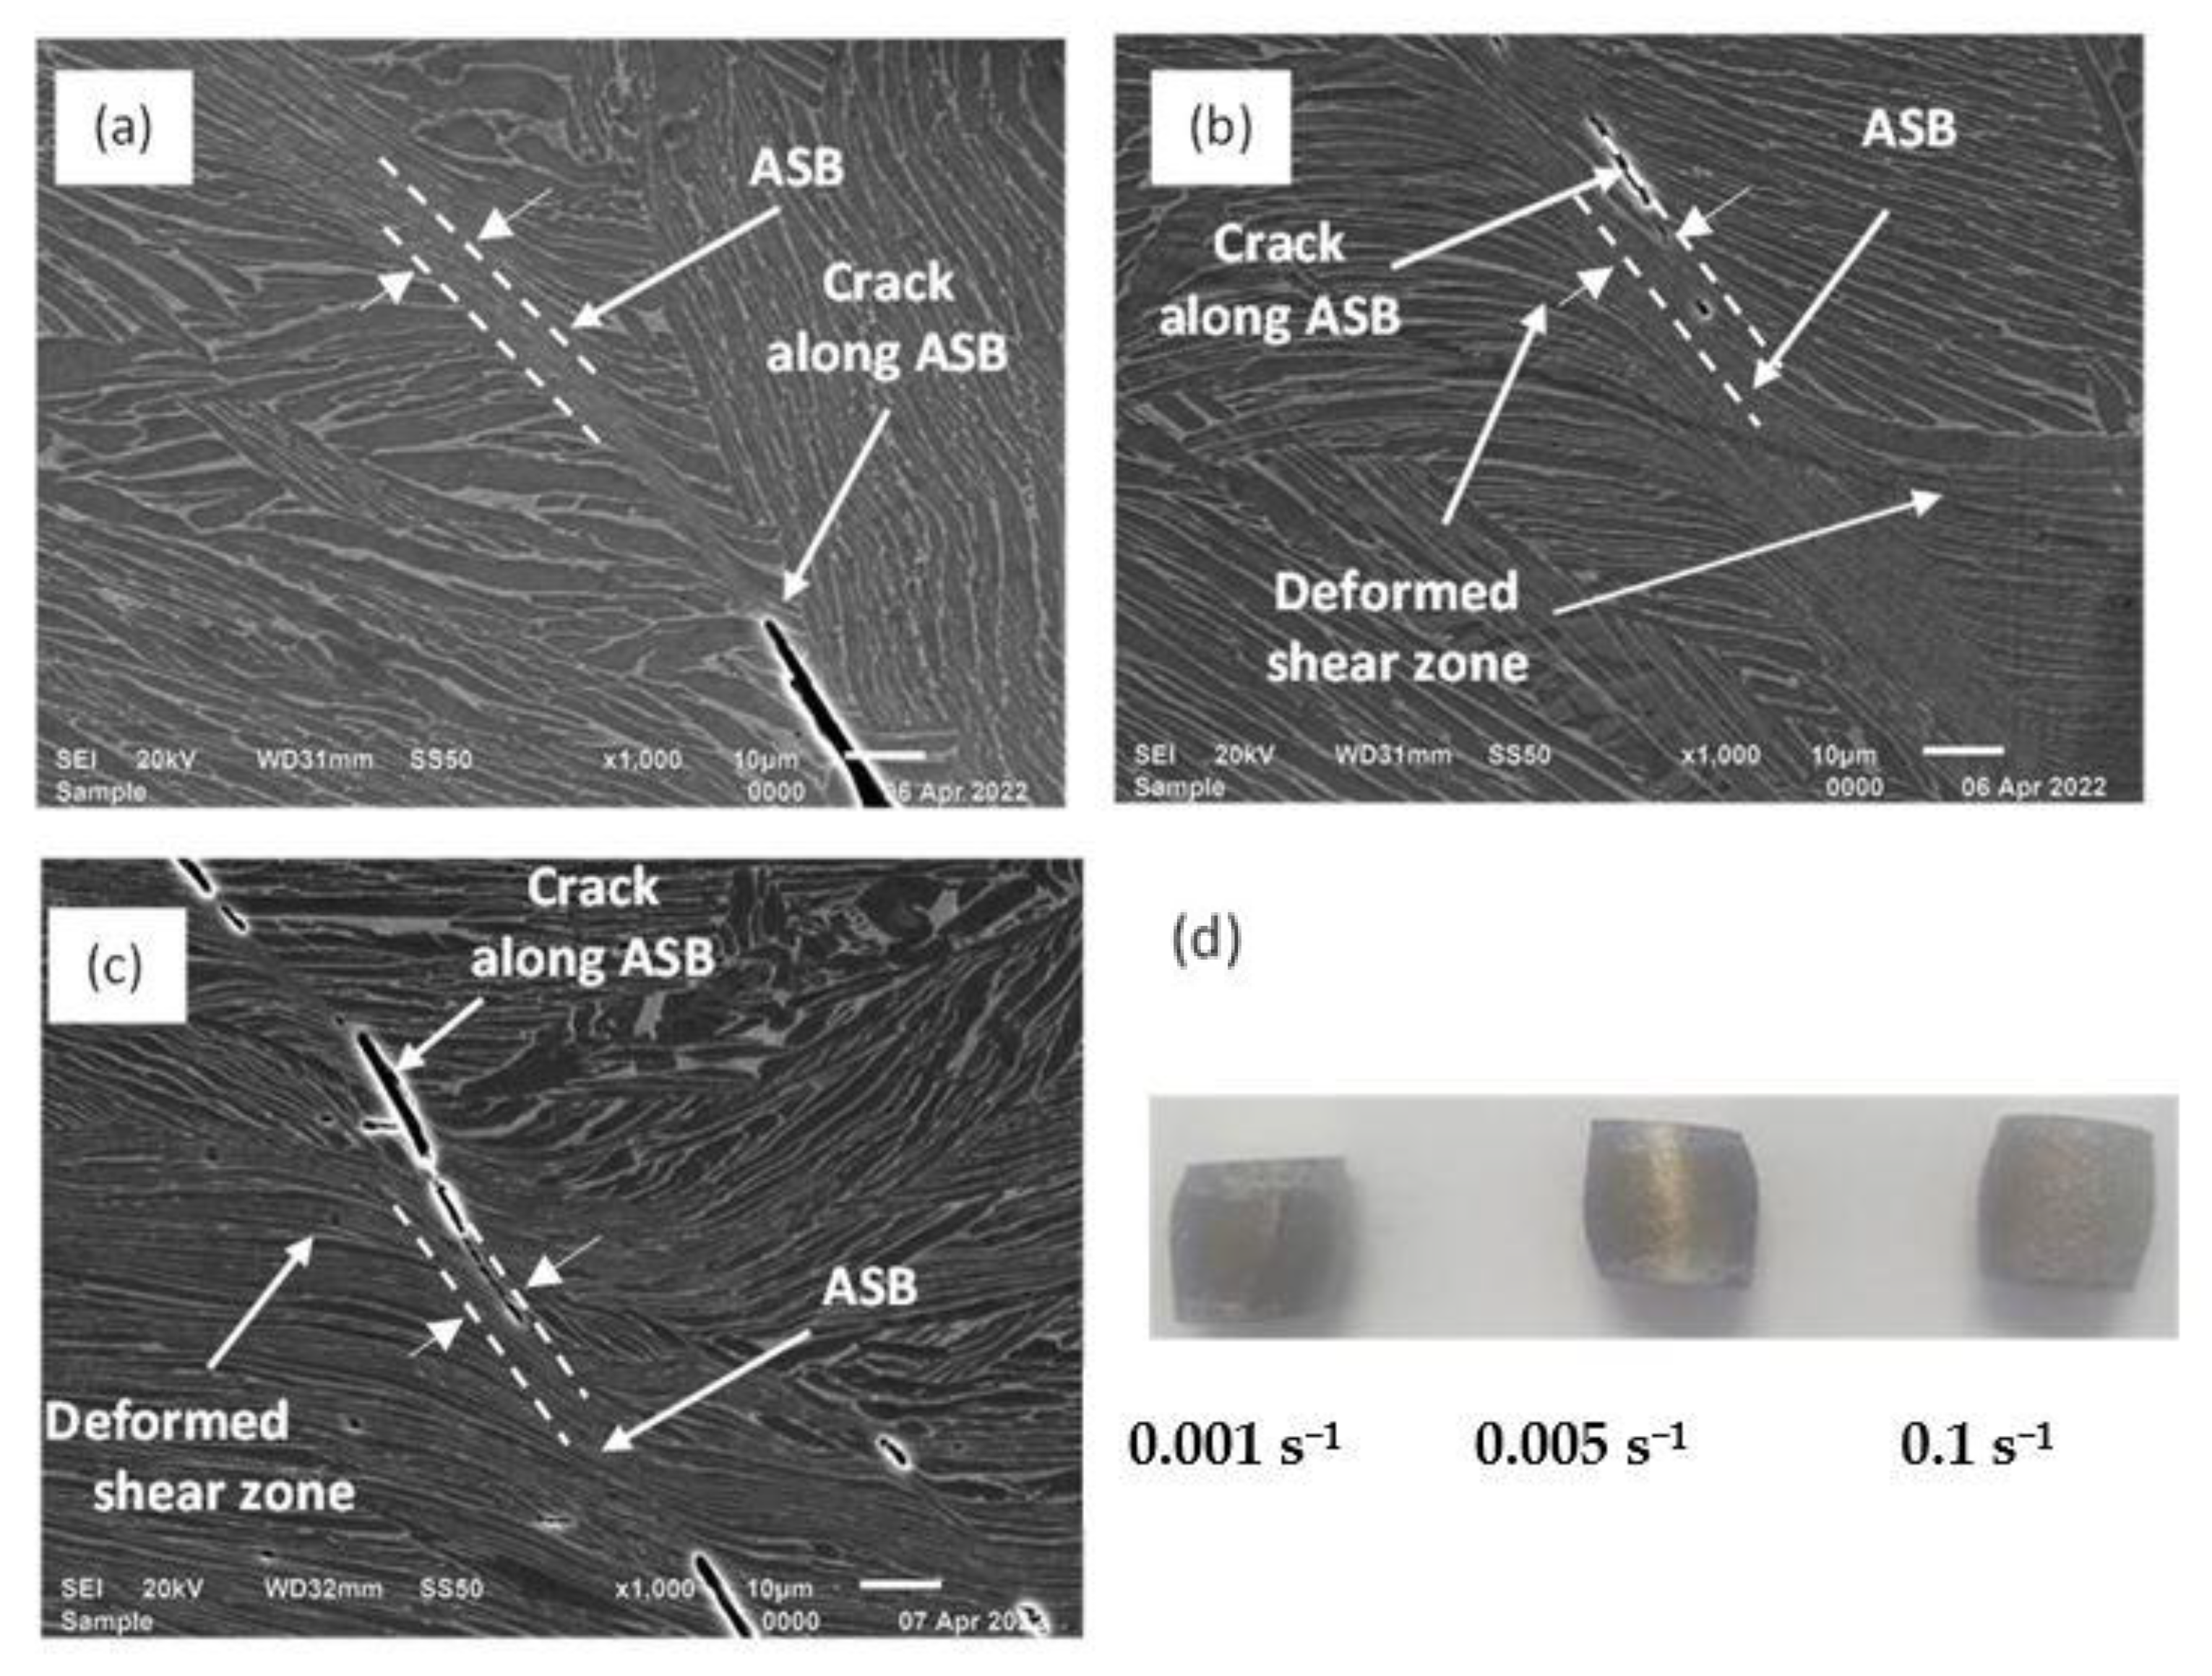
Adiabatic shear bands were the primary failure mechanism in the three different forms of the DMLS Ti6Al4V(ELI) alloy.

Author Contributions

Conceptualization, A.M., M.M. and W.d.P.; methodology, A.M.; formal analysis, A.M.; writing—original draft preparation, A.M.; writing—review and editing, A.M., M.M. and W.d.P.; supervision, M.M. and W.d.P.; funding acquisition, W.d.P. and M.M. All authors have read and agreed to the published version of the manuscript.

Funding

This research was funded by the South African Department of Science and Innovation (DSI) through the Council for Scientific and Industrial Research (CSIR), for the Collaborative Program in Additive Manufacturing, Contract No.: CSIR -NLC-CPAM-21-MOA-CUT-01.

Institutional Review Board Statement

Not applicable.

Informed Consent Statement

Not applicable.

Data Availability Statement

The datasets presented in this study are available on request from the corresponding author and are not publicly available as they form part of ongoing research.

Acknowledgments

The authors acknowledge the Centre for Rapid Prototyping and Manufacturing (CRPM) of the Central University of Technology, Free State (CUT) for production of test specimens used for this study. The Centre for High Resolution Transmission Electron Microscopy (CHRTEM) of the Nelson Mandela University where the EBSD analyses were carried out is acknowledged. The authors also express their gratitude to the mechanical engineering laboratory of the Council for Scientific and Industrial Research (CSIR) of South Africa, where quasi-static experiments were conducted.

Conflicts of Interest

The authors declare no conflict of interest.

References

  1. Liu, R.; Wang, Z.; Sparks, T.; Liou, F.; Newkirk, J. Aerospace applications of laser additive manufacturing. In Laser Additive Manufacturing; Milan, B., Ed.; Elsevier: Amsterdam, The Netherlands, 2017; pp. 351–371. [Google Scholar] [CrossRef]
  2. Gorse, S.; Hutchinson, C.; Gounce, M.; Banarjee, R. Additive manufacturing of metals: A brief review of the characteristic microstructures and properties of steels, Ti6Al4V and high entropy alloys. STAM 2017, 18, 584–610. [Google Scholar] [CrossRef] [PubMed]
  3. Rafi, H.K.; Karthik, N.V.; Gong, H.; Starr, T.; Brent, S. Microstructures and mechanical properties of Ti6Al4V parts fabricated by selective laser melting and electron beam melting. J. Mater. Eng. Perform. 2013, 22, 3872–3882. [Google Scholar] [CrossRef]
  4. Galarraga, H.; Warren, R.; Lados, D.; Dehoff, R.; Kirka, M.; Nandwana, P. Effects of heat treatments on microstructure and properties of Ti6Al4V (ELI) alloy fabricated by electron beam melting (EBM). Mater. Sci. Eng. A 2017, 685, 417–428. [Google Scholar] [CrossRef]
  5. Trevisan, F.; Calignano, F.; Aversa, A.; Marchese, G.; Lombardi, M.; Biamino, S.; Ugues, D.; Manfredi, D. Additive manufacturing of titanium alloys in the biomedical field: Processes, properties and applications. JABFM 2018, 16, 57–67. [Google Scholar] [CrossRef] [PubMed]
  6. Uhlmann, E.; Kersting, R.; Klein, T.; Fernando, C.; Borille, V. Additive manufacturing of titanium alloy for aircraft components. Procedia CIRP 2015, 35, 55–60. [Google Scholar] [CrossRef]
  7. Strickland, J.D. Applications of Additive Manufacturing in the Marine Industry. In Proceedings of the PRADS2016, Copenhagen, Denmark, 4–8 September 2016. [Google Scholar]
  8. Özsoy, K.; Duman, B.; Gültekin, D.I. Metal part production with additive manufacturing for aerospace and defence industry. Inter. J. Technol. Sci. 2019, 11, 201–210. [Google Scholar]
  9. Shunyu, L.; Yung, S. Additive manufacturing of Ti6Al4V alloy: A review. Mater. Des. 2019, 164, 107552. [Google Scholar] [CrossRef]
  10. Gray, G.T., III. High strain rate deformation: Mechanical behaviour and deformation substructures induced. Annu. Rev Mater. Res. 2012, 42, 285–303. [Google Scholar] [CrossRef]
  11. Sharma, S.; Majila, A.; Chavan, M.; Fernando, D.; Patel, R.; Babu, N. Deformation response of titanium alloy under static and dynamic loading. Procedia Eng. 2017, 173, 1894–1900. [Google Scholar] [CrossRef]
  12. Kim, J.Y.; Shim, I.; Kim, H.; Hong, S.; Hong, H. Dynamic deformation and high impact behaviours of Ti6Al4V alloys. Mater. Sci. Forum 2007, 539–543, 2269–2274. [Google Scholar] [CrossRef]
  13. Zhai, Y.; Galarraga, H.; Lados, D. Microstructure, static properties, and fatigue crack growth mechanisms in Ti6Al4V fabricated by additive manufacturing: LENS and EBM. Eng. Fail. Anal. 2016, 69, 3–14. [Google Scholar] [CrossRef]
  14. Voisin, T.; Calta, N.; Saad, K.; Forien, B.; Balogh, L.; Cunningham, R.W.; Rollett, D.; Wang, M. Defects-dictated tensile properties of selective laser melted Ti6Al4V. Mater. Des. 2018, 158, 113–126. [Google Scholar] [CrossRef]
  15. Charlotte, F.; Michotte, S.; Rigo, O.; Germain, L.; Godet, S. Electron beam melted Ti6Al4V: Microstructure, texture and mechanical behaviour of the as-built and heat-treated material. Mater. Sci. Eng. A 2016, 652, 105–119. [Google Scholar] [CrossRef]
  16. Li, P.H.; Guo, W.G.; Huang, W.D.; Su, Y.; Lin, X.; Yuan, K.B. Thermomechanical response of 3D laser-deposited Ti–6Al–4V alloy over a wide range of strain rates and temperatures. Mater. Sci. Eng. 2015, 647, 34–42. [Google Scholar] [CrossRef]
  17. Huang, Q.; Liu, X.; Yang, X.; Zhang, R.; Shen, Z.; Feng, Q. Specific heat treatment of selective laser melted Ti6Al4V for biomedical applications. Front. Mater. Sci. 2015, 9, 373–381. [Google Scholar] [CrossRef]
  18. Kiel-Jamrozik, M.; Jamrozik, W.; Witkowska, I. The heat treatment influence on the structure and mechanical properties of Ti6Al4V alloy manufactured by SLM technology. In Innovations in Biomedical Engineering; Gzik, M., Tkacz, E., Paszenda, Z., Piętka, E., Eds.; Springer: Cham, Switzerland, 2017; Volume 623, pp. 319–327. [Google Scholar] [CrossRef]
  19. Vranken, B.; Thijis, L.; Pierre, K.; Humbeeck, J. Heat treatment of Ti6Al4V produced by selective laser melting: Microstructure and mechanical properties. J. Alloys Compd. 2012, 541, 177–185. [Google Scholar] [CrossRef]
  20. Caroll, B.; Palmer, T.; Beese, A. Anisotropic tensile behaviour of Ti6Al4V components fabricated with directed energy deposition additive manufacturing. Acta Mater. 2015, 87, 309–320. [Google Scholar] [CrossRef]
  21. Malefane, L.B.; Du Preez, W.B.; Maringa, M. High cycle fatigue properties of as-built Ti6Al4V(ELI) produced by direct metal laser sintering. SAJIE 2017, 28, 188–199. [Google Scholar] [CrossRef]
  22. Moletsane, G.; Krakhmalev, P.; Du Plessis, A.; Yadroitsava, I.; Yadroitsev, I.; Kazantseva, I. Tensile properties and microstructure of direct metal laser sintered Ti6Al4V(ELI) alloy. SAJIE 2016, 27, 110–121. [Google Scholar] [CrossRef] [Green Version]
  23. Lütjering, G.; Williams, J.C. Alpha + Beta Alloys. In Titanium. Engineering Materials and Processes; Springer: Berlin/Heidelberg, Germany, 2003; pp. 177–232. [Google Scholar] [CrossRef]
  24. Dieter, E.G. Mechanical Metallurgy, Materials Science and Engineering Series, 3rd ed.; McGraw-Hill: New York, NY, USA, 1986; pp. 255–258. [Google Scholar]
  25. Wu, G.; Shi, L.; Sha, W.; Sha, A.; Jiang, H. Effects of microstructure on the fatigue properties of Ti6Al4V titanium alloys. Mater. Des. 2011, 46, 668–674. [Google Scholar] [CrossRef]
  26. Peters, J.O.; Lütjering, G. Comparison of the fatigue and fracture of α + β and β titanium alloys. Metall. Mater Trans. A 2001, 32, 2805–2818. [Google Scholar] [CrossRef]
  27. ASTM F3001-14; Standard Specification for Additive Manufacturing Titanium-6Aluminium-4 Vanadium ELI (Extra Low Interstitial) with Powder Bed Fusion. ASTM: West Conshohocken, PA, USA, 2014.
  28. Muiruri, A.; Maringa, M.; du Preez, W. Crystallographic Texture Analysis of As-Built and Heat-Treated Ti6Al4V (ELI) Produced by Direct Metal Laser Sintering. Crystals 2020, 10, 699. [Google Scholar] [CrossRef]
  29. Muiruri, A.; Maringa, M.; du Preez, W. Evaluation of Dislocation Densities in Various Microstructures of Additively Manufactured Ti6Al4V (Eli) by the Method of X-ray Diffraction. Materials 2020, 13, 5355. [Google Scholar] [CrossRef] [PubMed]
  30. ASTM E112–13; Standard Test Methods for Determining Average Grain Size. ASTM: West Conshohocken, PA, USA, 2013.
  31. Wang, Y.; Fraser, H.; Dixit, V.; Shi, R. Variant selection of grain boundary α by special prior β grain boundaries in titanium alloys. Acta Mater. 2014, 75, 156–166. [Google Scholar] [CrossRef]
  32. Obasi, G.C.; Birosca, S.; Quinta, F.J.; Preuss, M. Effect of β grain growth on variant selection and texture memory effect during α→β→α phase transformation in Ti6Al4V. Acta Mater. 2012, 60, 1048–1058. [Google Scholar] [CrossRef]
  33. Simonelli, M.; Tse, Y.Y.; Tuck, C. The formation of α + β microstructure in as-fabricated selective laser melting of Ti6Al4V. J. Mater. Res. 2014, 29, 2028–2035. [Google Scholar] [CrossRef]
  34. Muiruri, A.; Maringa, M.; du Preez, W. Statistical analysis of the distribution of Schmid factor in as-built and annealed parts produced by laser powder bed fusion. Crystals 2022, 12, 743. [Google Scholar] [CrossRef]
  35. Hall, E.O. The deformation and ageing of mild steel: Discussion of results. Proc. Phys. Soc. B 1951, 64, 747. [Google Scholar] [CrossRef]
  36. Kohn, D.H.; Ducheyne, P. Tensile and fatigue strength of hydrogen-treated Ti6Al4V alloy. J. Mater. Sci. 1991, 26, 328–334. [Google Scholar] [CrossRef]
  37. Greer, J.R.; De Hosson, M. Plasticity in small-sized metallic systems: Intrinsic versus extrinsic size effect. Prog. Mater. Sci. 2011, 56, 654–724. [Google Scholar] [CrossRef]
  38. Swygenhoven, H.; Derlet, P.M. Grain-boundary sliding in nanocrystalline fcc metals. Phys. Rev. B 2001, 64, 224105. [Google Scholar] [CrossRef]
  39. Gong, J.; Wilkinson, A.J. Sample size effects on grain boundary sliding. Scr. Mater. 2016, 114, 17–20. [Google Scholar] [CrossRef]
  40. Malopheyev, S.; Vysotskiy, I.; Mironov, S.; Kaibyshev, R. Is Ashby grain-boundary hardening model applicable for high strains? Trans. Nonferr. Metal. Soc. 2019, 29, 2245–2251. [Google Scholar] [CrossRef]
  41. Lee, W.; Lin, C. Adiabatic shear fracture of titanium alloy subjected to high strain rate and high temperature loadings. J. Phys. Colloq. 1997, 7, 855–860. [Google Scholar] [CrossRef]
  42. Chen, J.; Zhao, Y.; Yang, H.; Hiu, L.; Hong, Q. Investigation of adiabatic shear bands of Ti-B19 titanium alloy, Ti 2007: Science and Technology. In Proceedings of the 11th World Conference on Titanium, Kyoto International Conference Centre, Kyoto, Japan, 3–7 June 2007. [Google Scholar]
  43. Dodd, B.; Bai, Y. Adiabatic Shear Localization—Frontiers and Advances, 2nd ed.; Elsevier: Amsterdam, The Netherlands, 2012; pp. 183–200. [Google Scholar]
  44. Biswas, N.; Ding, J.L.; Balla, V.K.; Field, D.P.; Bandyopadhay, A. Deformation and fracture behaviour of laser processed dense and porous Ti6Al4V alloy under static and dynamic loading. Mater. Sci. Eng. A 2012, 549, 213–221. [Google Scholar] [CrossRef]
  45. Muiruri, A.; Maringa, M.; du Preez, W. High Strain Rate Properties of Various Forms of Ti6Al4V(ELI) Produced by Direct Metal Laser Sintering. Appl. Sci. 2021, 11, 8005. [Google Scholar] [CrossRef]
Figure 1. Schematic diagram illustrating the EOSINT M280 machine scanning strategy employed in production of samples for use in this study. The arrows show the scan vectors in every stripe (shown by the dashed lines). The stripes in the subsequent layer are rotated at 67° from the previous layer.
Applsci 12 09552 g001
Figure 2. A photograph showing produced cylindrical rods on the EOSINT M280 machine table. The specification of each of these rods in millimetres is shown by the insert schematic drawing.
Applsci 12 09552 g002
Figure 3. The Instron 1342 servo-hydraulic universal test machine (UTM) at CSIR.
Applsci 12 09552 g003
Figure 4. The secondary electron images (SEI) of samples (a) C, (c) D and (e) E and α-grain boundary distribution in samples (b) C, (d) D and (f) E. The red arrows indicate the build orientation.
Applsci 12 09552 g004
Figure 5. (a,c,e) The orientation distribution maps and (b,d,f) the local grain misorientation/low angle grain boundary maps in samples C, D and E, respectively. The red arrows indicate the build orientation.
Applsci 12 09552 g005
Figure 6. The area fraction distribution of different grain sizes determined from EBSD maps of (a) samples C, (b) samples D and (c) samples E.
Applsci 12 09552 g006
Figure 7. Schematic diagram illustrating the specimen loading axis and corresponding second-rank stress tensor.
Applsci 12 09552 g007
Figure 8. Typical values of the global Schmid factor for basal slip systems of the α-phase for the load applied along the build orientation in samples (a) C, (b) D and (c) E, while (d) shows the statistical distribution of the values obtained in each form of material.
Applsci 12 09552 g008
Figure 9. Typical values of the global Schmid factor for prismatic slip systems of the α-phase for the load applied along the build orientation in samples (a) C, (b) D and (c) E, while (d) shows the statistical distribution of the values obtained in each form of material.
Applsci 12 09552 g009
Figure 10. Typical values of the global Schmid factor for pyramidal <α> slip systems of the α-phase for the load applied along the build orientation in samples (a) C, (b) D and (c) E, while (d) shows the statistical distribution of the values obtained in each form of material.
Applsci 12 09552 g010
Figure 11. The stress–strain curves of samples (a) C, (b) D and (c) E at various strain rates, while (d), (e) and (f) show the comparison of the flow stress curves of these different samples at strain rates of 0.1 s−1, 0.005 s−1 and 0.001 s−1, respectively.
Applsci 12 09552 g011
Figure 12. Comparison of (a) the yield and (b) ultimate compressive stress of various forms of LPBF Ti6Al4V(ELI) at different levels of strain rate.
Applsci 12 09552 g012
Figure 13. The variation of strain hardening with strain for samples (a) C, (b) D and (c) E, while (d), (e) and (f) show the comparison of strain hardening in the three different categories of samples at strain rates of 0.1 s−1, 0.005 s−1, and 0.001 s−1, respectively.
Applsci 12 09552 g013
Figure 14. Typical shear-deformed surfaces of samples C after tests at strain rates of (a) 0.001 s−1, (b) 0.005 s−1 and (c) 0.1 s−1, while (d) shows the typical condition of the test samples after testing at the respective strain rates.
Applsci 12 09552 g014
Figure 15. Typical shear-deformed surfaces of samples D after tests at strain rates of (a) 0.001 s−1, (b) 0.005 s−1 and (c) 0.1 s−1, while (d) shows the typical condition of the test samples after testing at the respective strain rates.
Applsci 12 09552 g015
Figure 16. Typical shear-deformed surfaces of samples E after tests at strain rates of (a) 0.001 s−1, (b) 0.005 s−1 and (c) 0.1 s−1, while (d) shows the typical condition of the test samples after testing at the respective strain rates.
Applsci 12 09552 g016
Table 1. The chemical composition of the Ti6Al4V(ELI) as received from the supplier and that specified in the ASTM F3001-14 standard [27].
Element AlVFeOCNHTi
Composition (wt.%)6.343.9440.250.0820.0060.0060.001Bal.
ASTM F3001-145.50–6.503.50–4.50<0.25<0.13<0.08<0.05<0.012Bal.
Table 2. The heat treatment cycles of different samples of LPBF Ti6Al4V(ELI).
Samples GroupTemperatureResidence TimeAverage Rate of Cooling
C800 °C2.5 h7.5 °C/min
D *940 °C followed by 750 °C2.5 h followed by 2h57.5 °C/min and 51 °C/min
E1020 °C2.540.5 °C/min
* Double annealed.
Table 3. The thickness of ASBs in samples C, D and E for tests conducted at quasi-static and high strain rates.
Thickness of the ASB
Test Strain Rate Samples CSamples DSamples EReference
0.001 s−12 µm4 µm5 µmPresent study
0.005 s−12 µm5 µm5 µmPresent study
0.1 s−13 µm7 µm5 µmPresent study
750 s−13 µm12.3 µm12.4 µm[45]
1500 s−15 µm14.7 µm18.4 µm[45]
Publisher’s Note: MDPI stays neutral with regard to jurisdictional claims in published maps and institutional affiliations.

