
Genetic Mechanism of Uranium Concentration in Ferruginous Sandstone of the Wajid Group in Southern Saudi Arabia


Abstract
:1. Introduction
2. Regional Geology
2.1. Regional Geological Settings
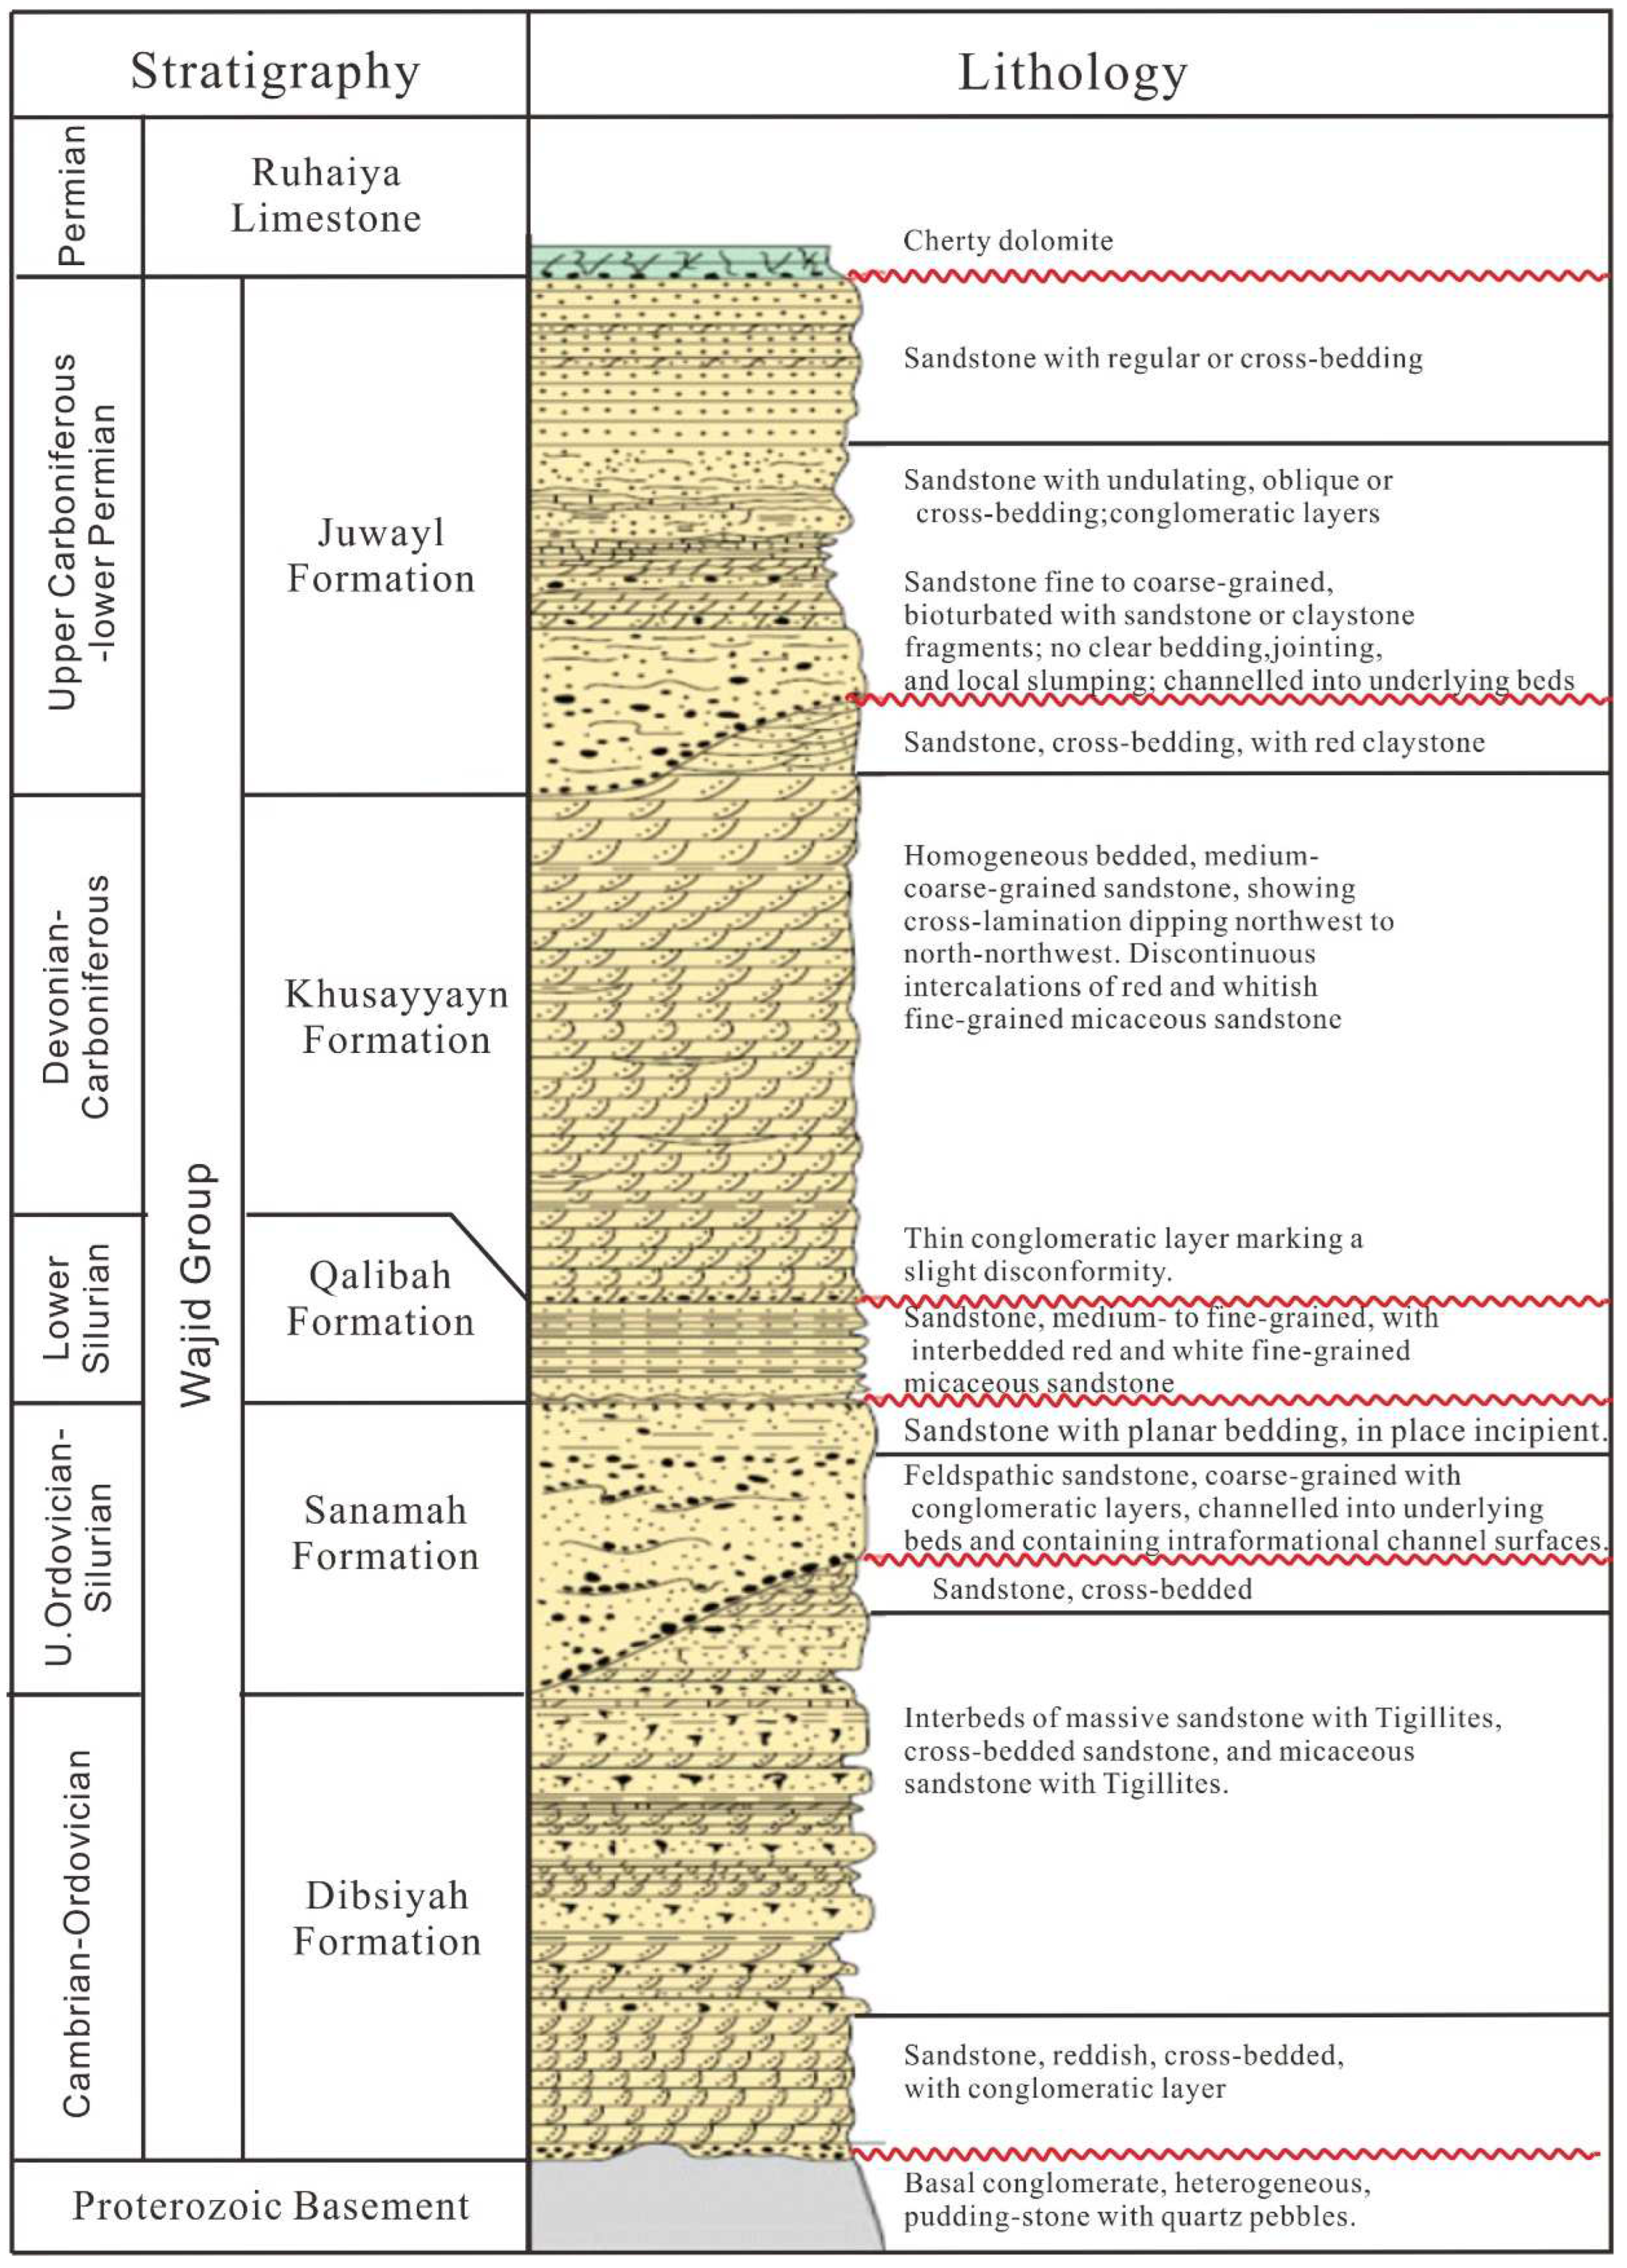
2.2. Wajid Group
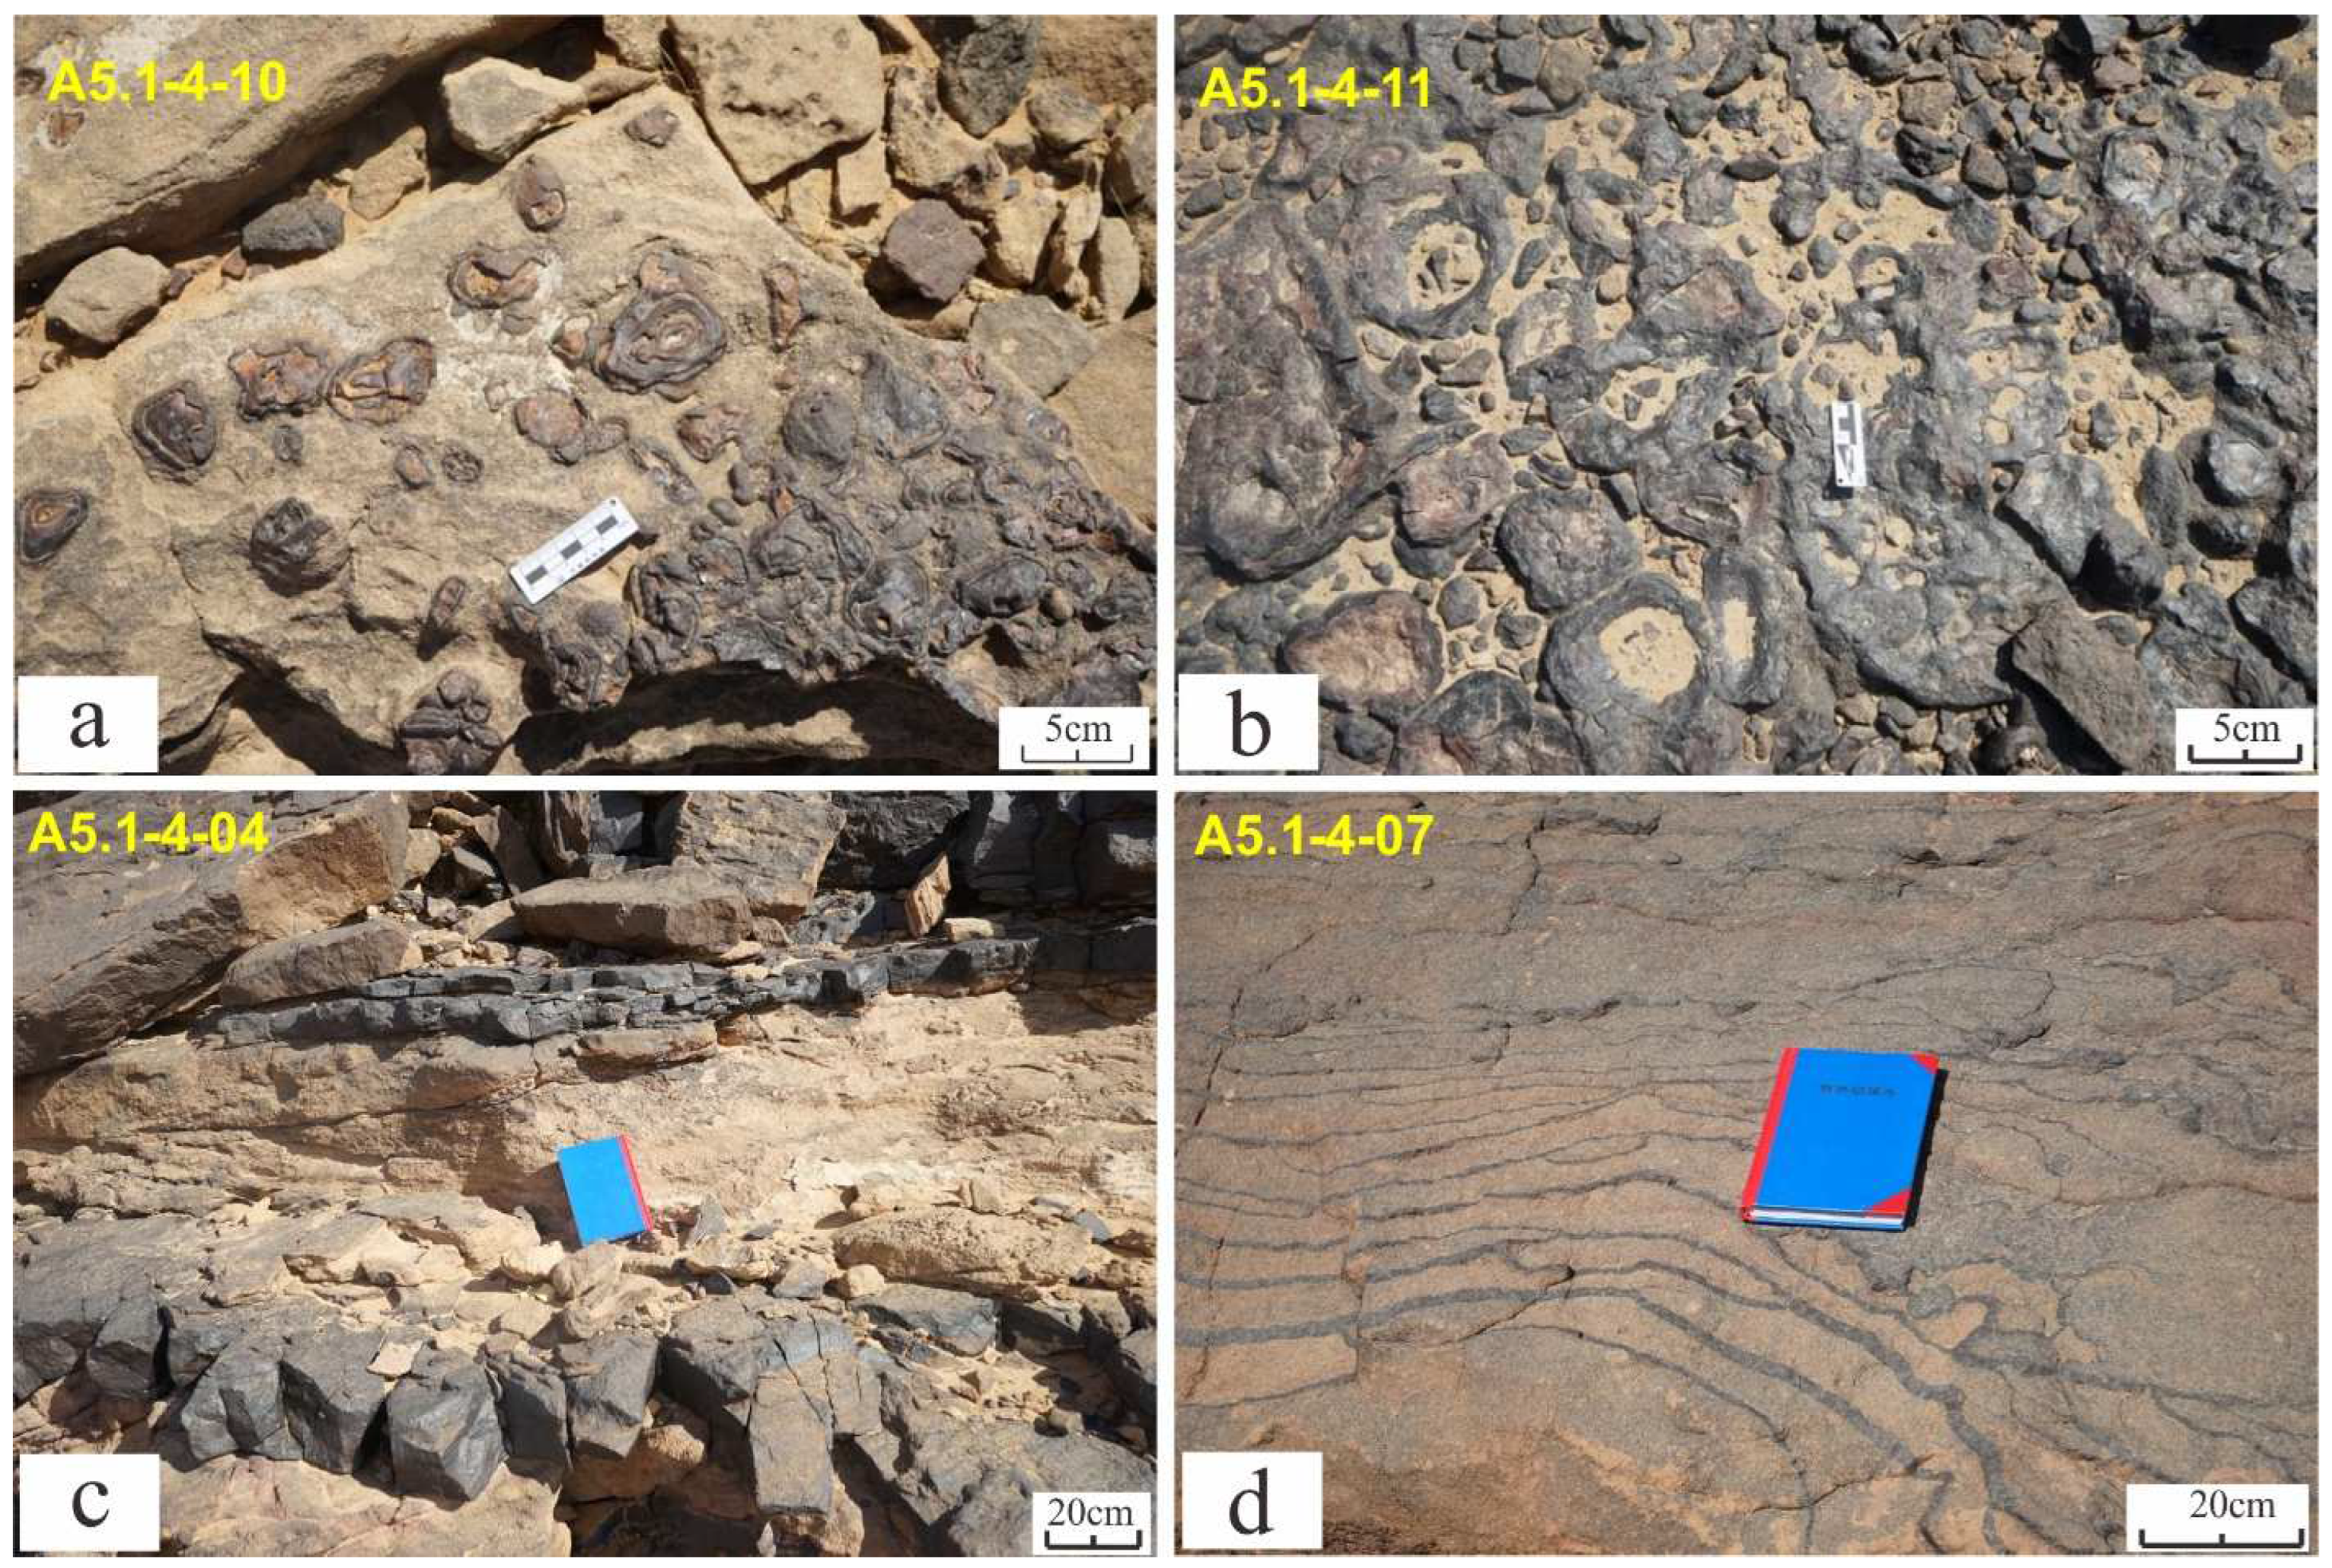
2.3. Ferruginous Sandstone
3. Sampling and Analytical Methods
3.1. Sampling and Sample Preparation
3.2. Analytical Methods
4. Results
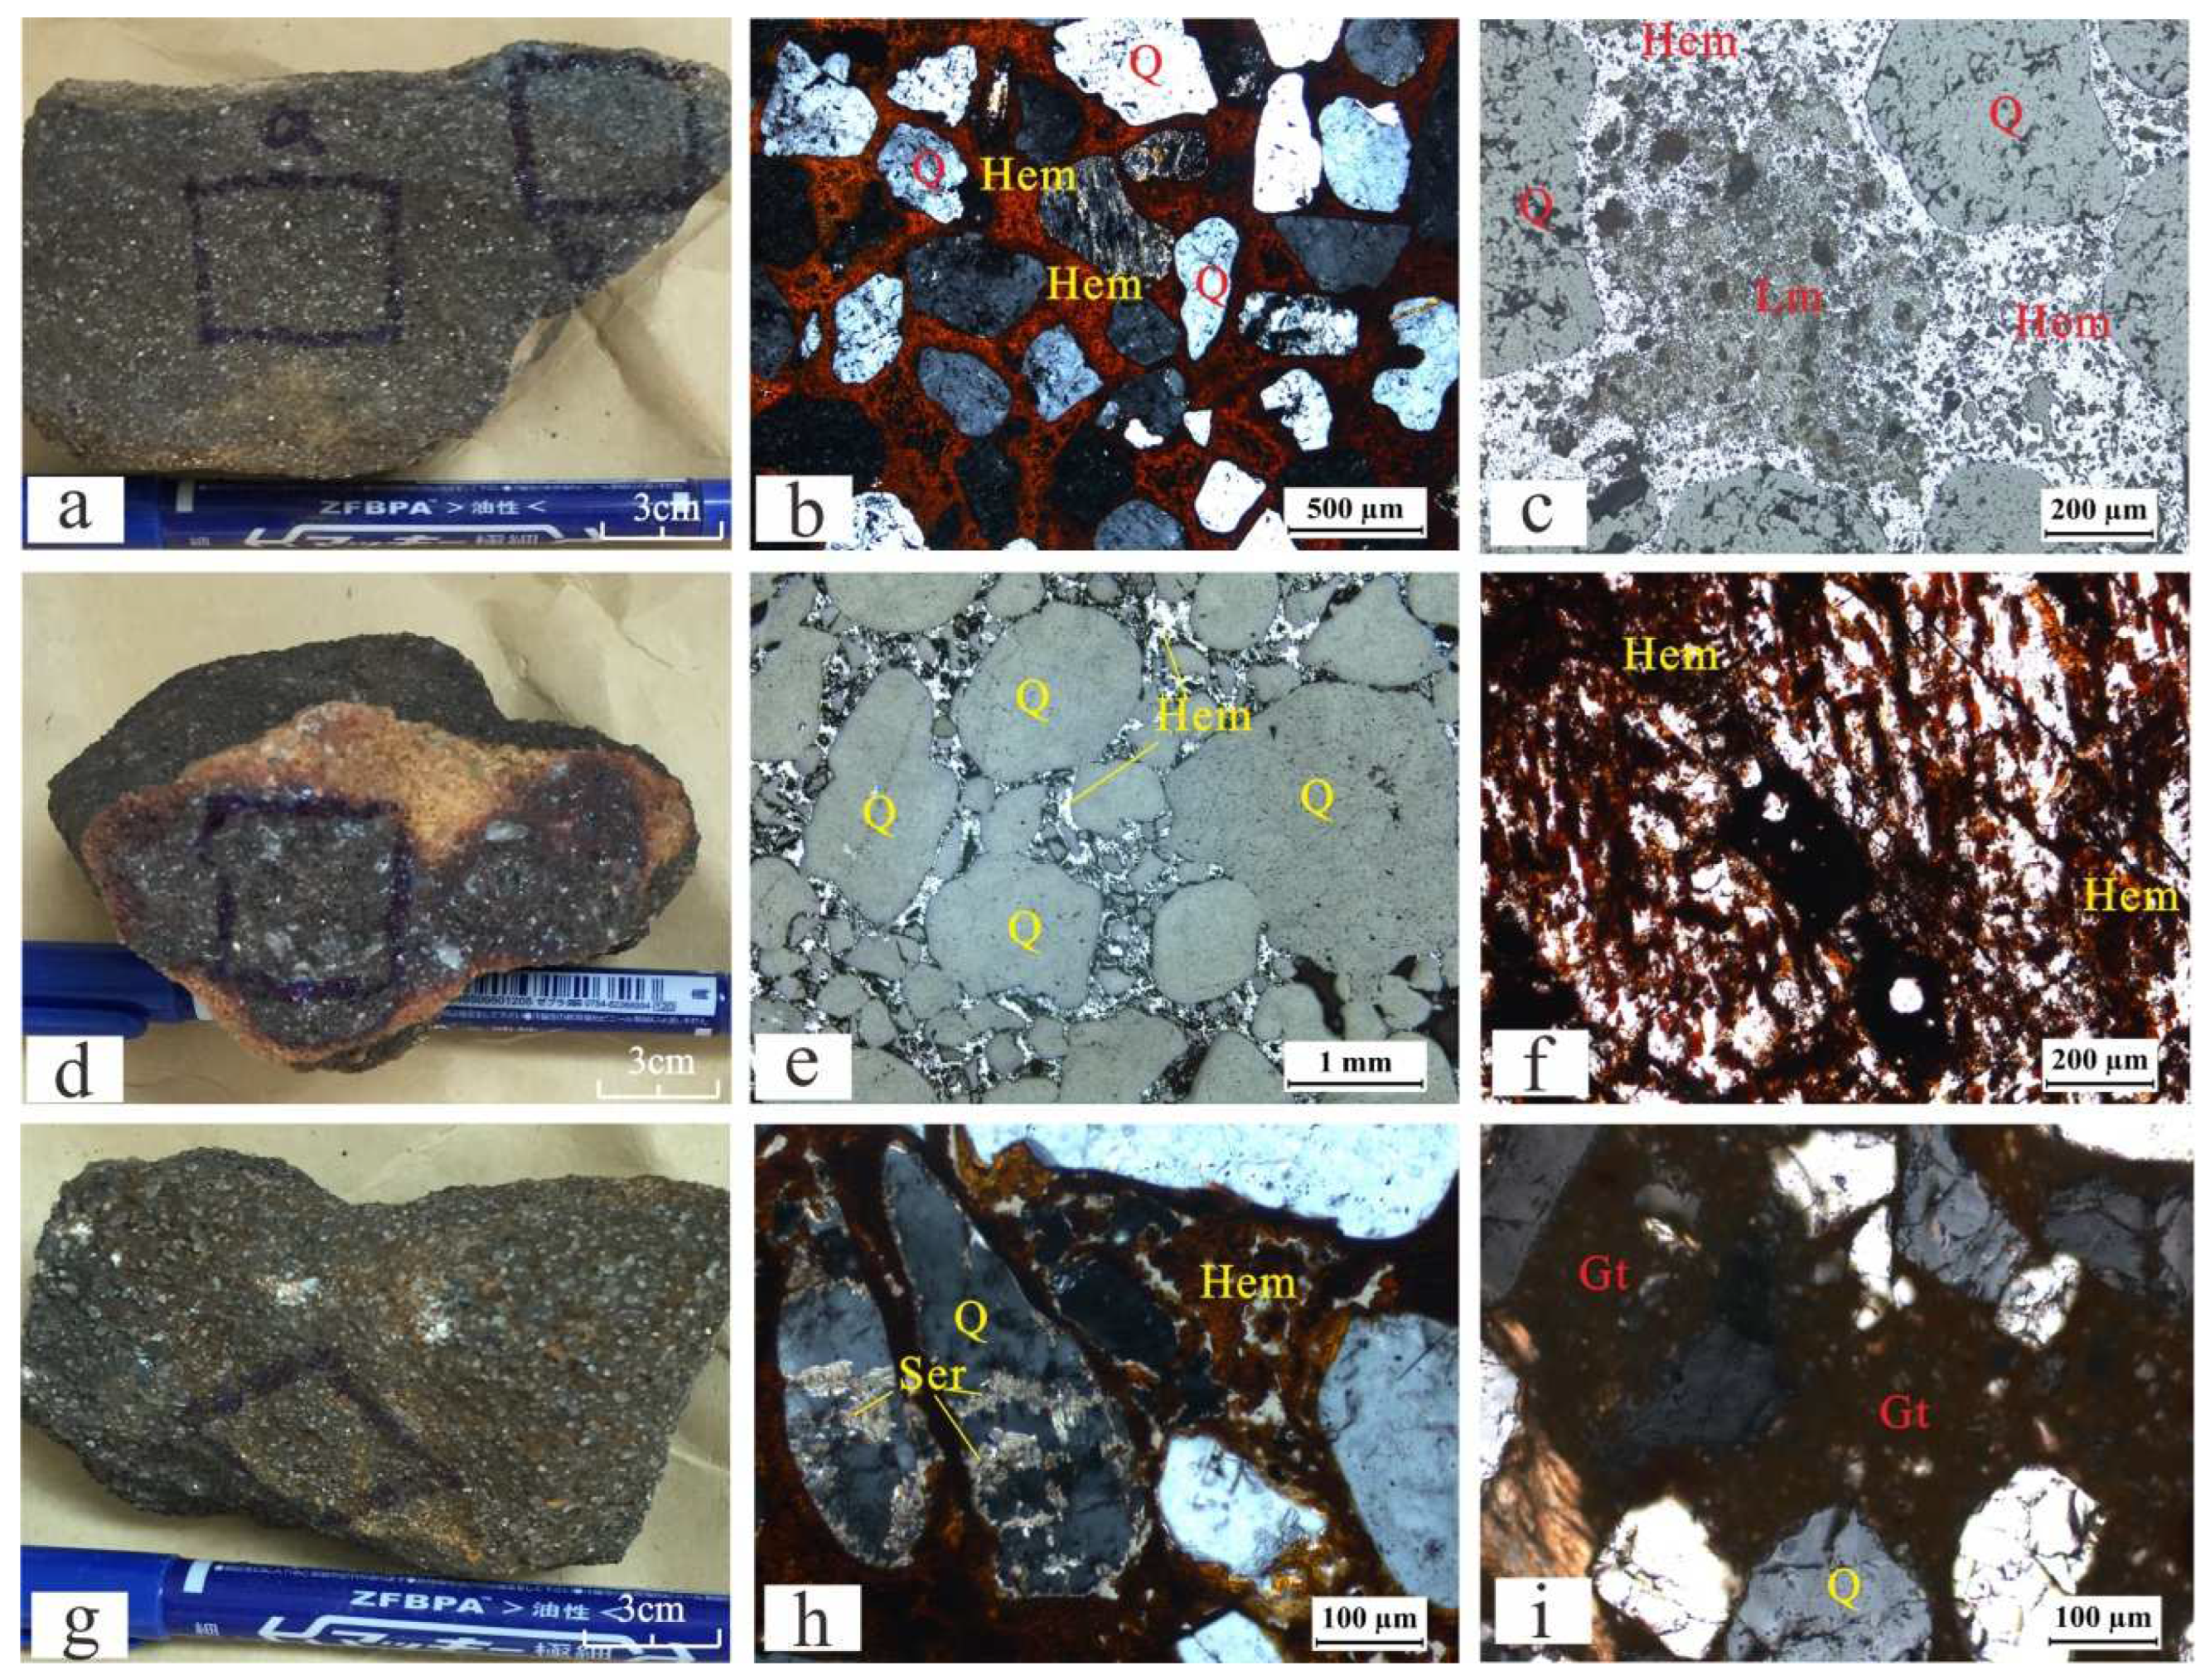
4.1. Ferruginous Sandstone Petrological Identification
4.2. Ferruginous Sandstone Chemical Characteristics
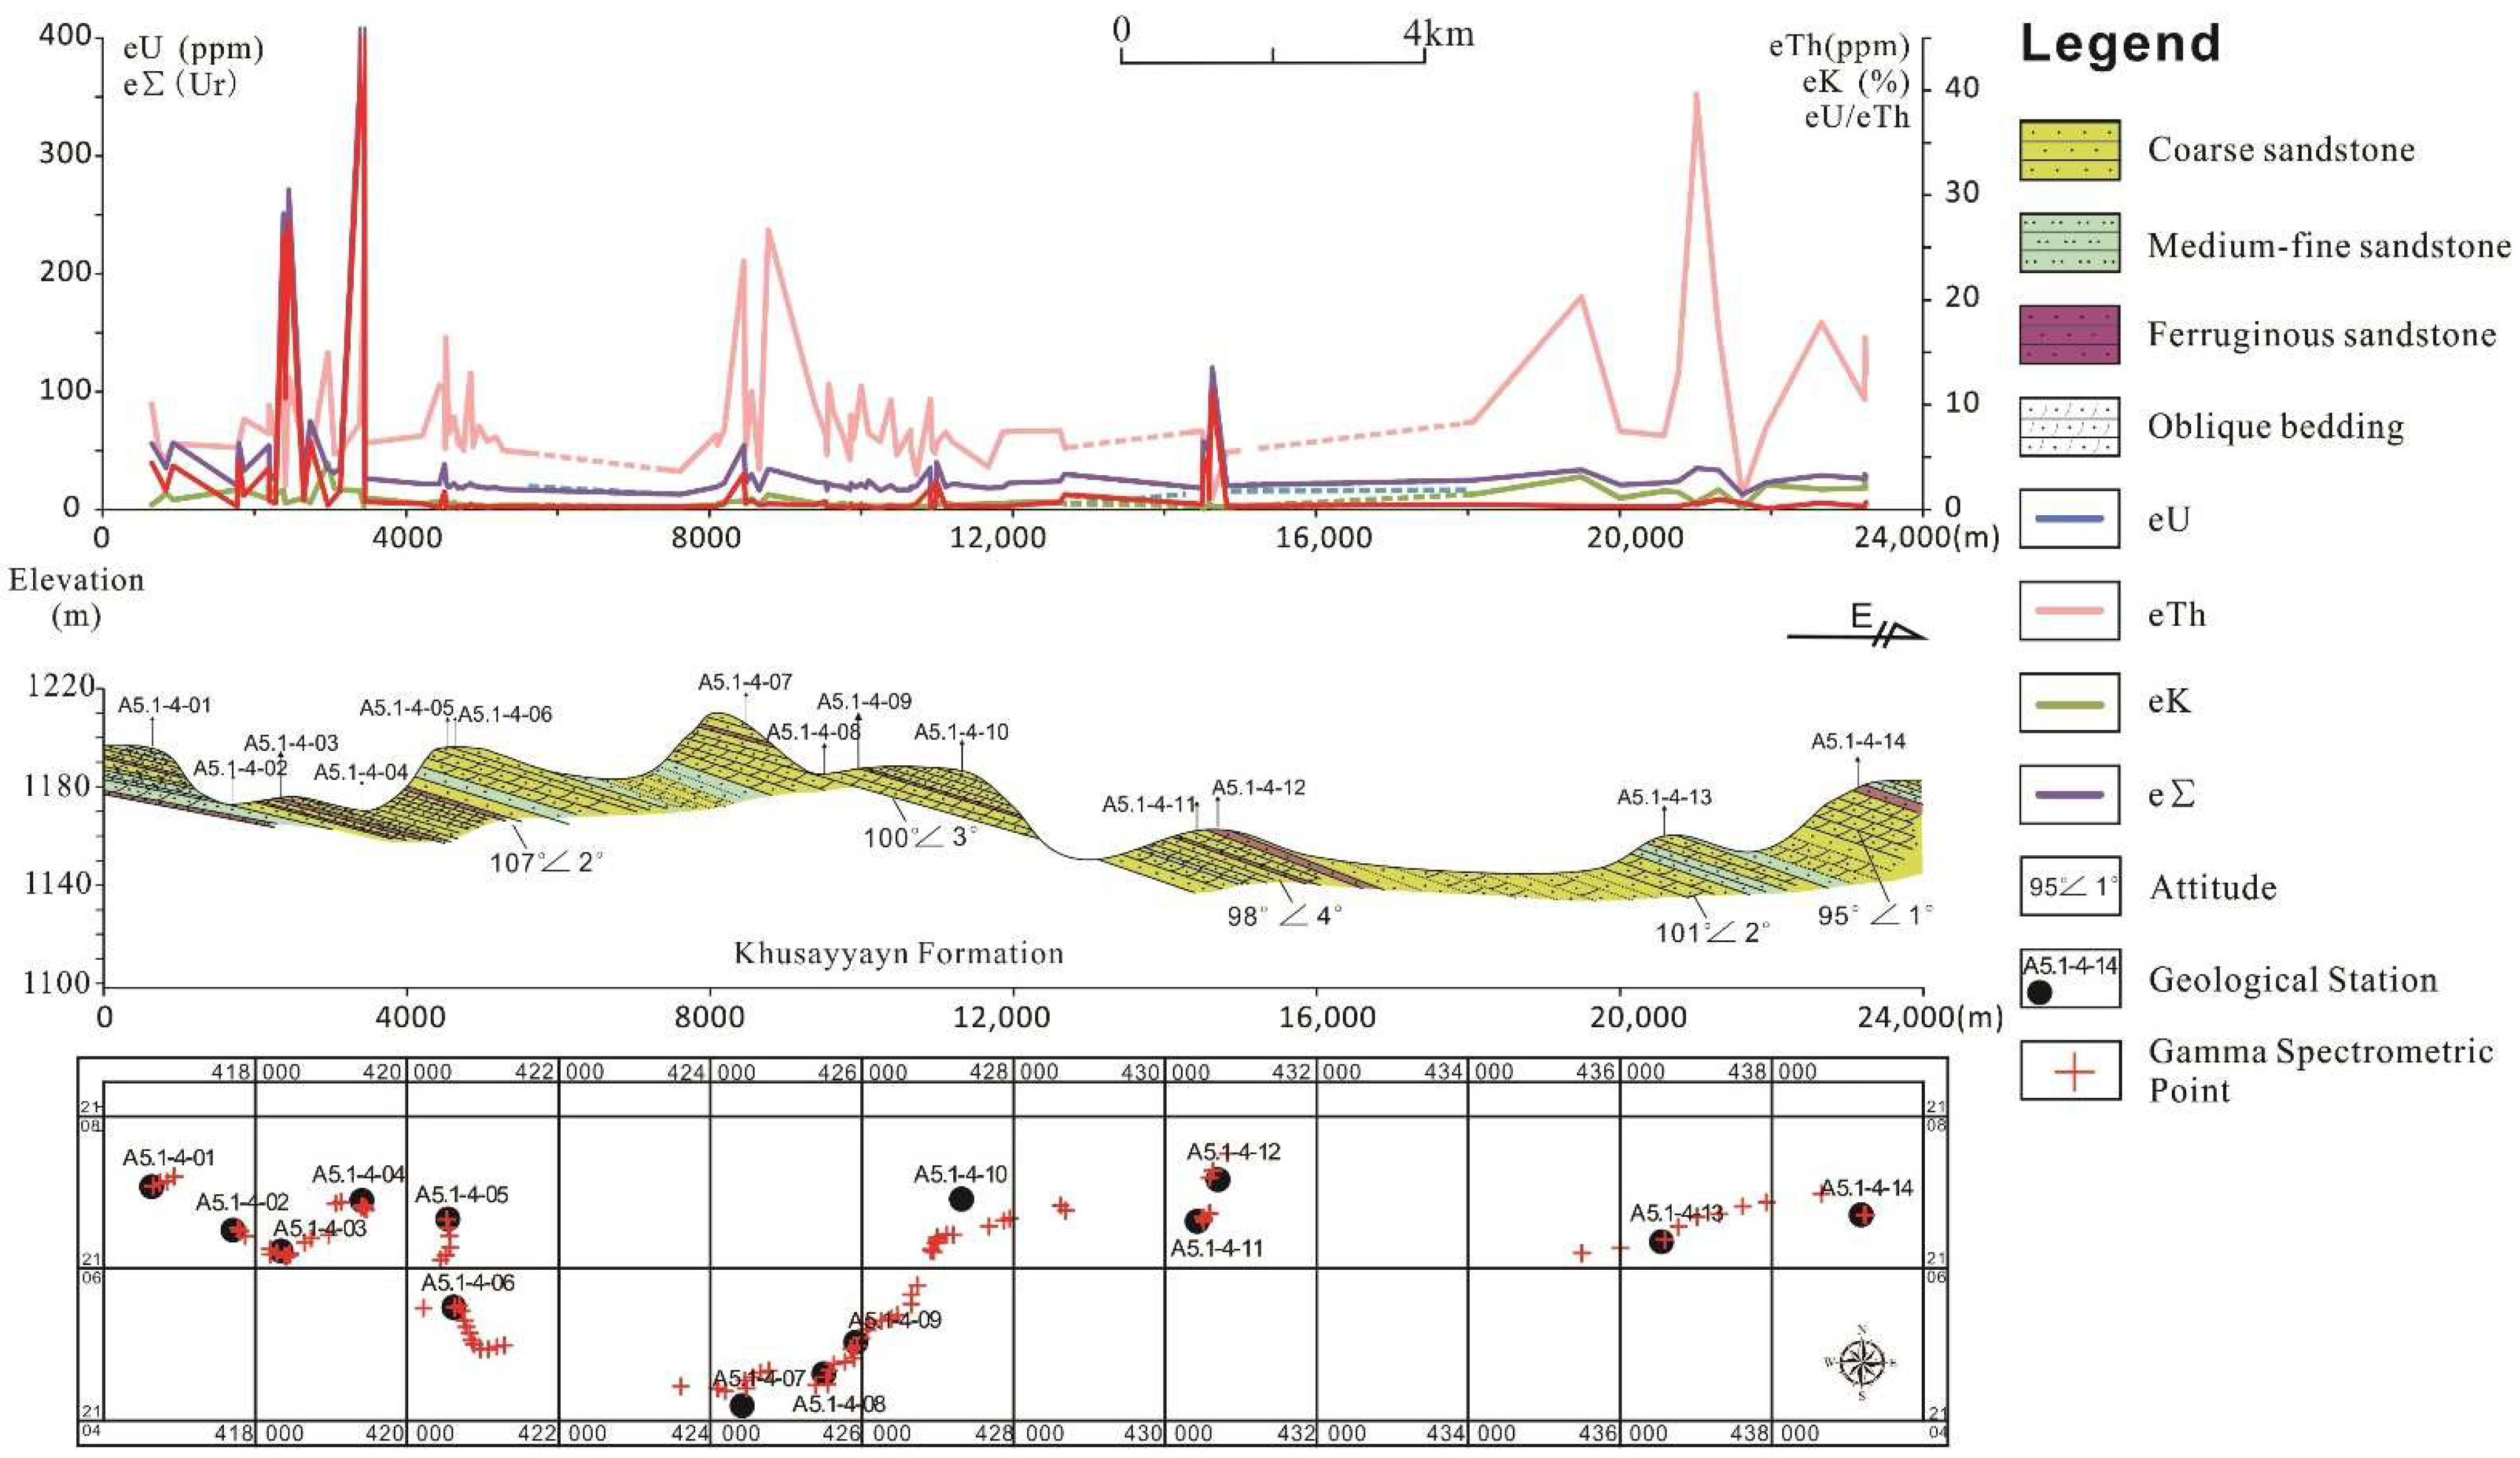
4.3. Ferruginous Sandstone Uranium Anomaly
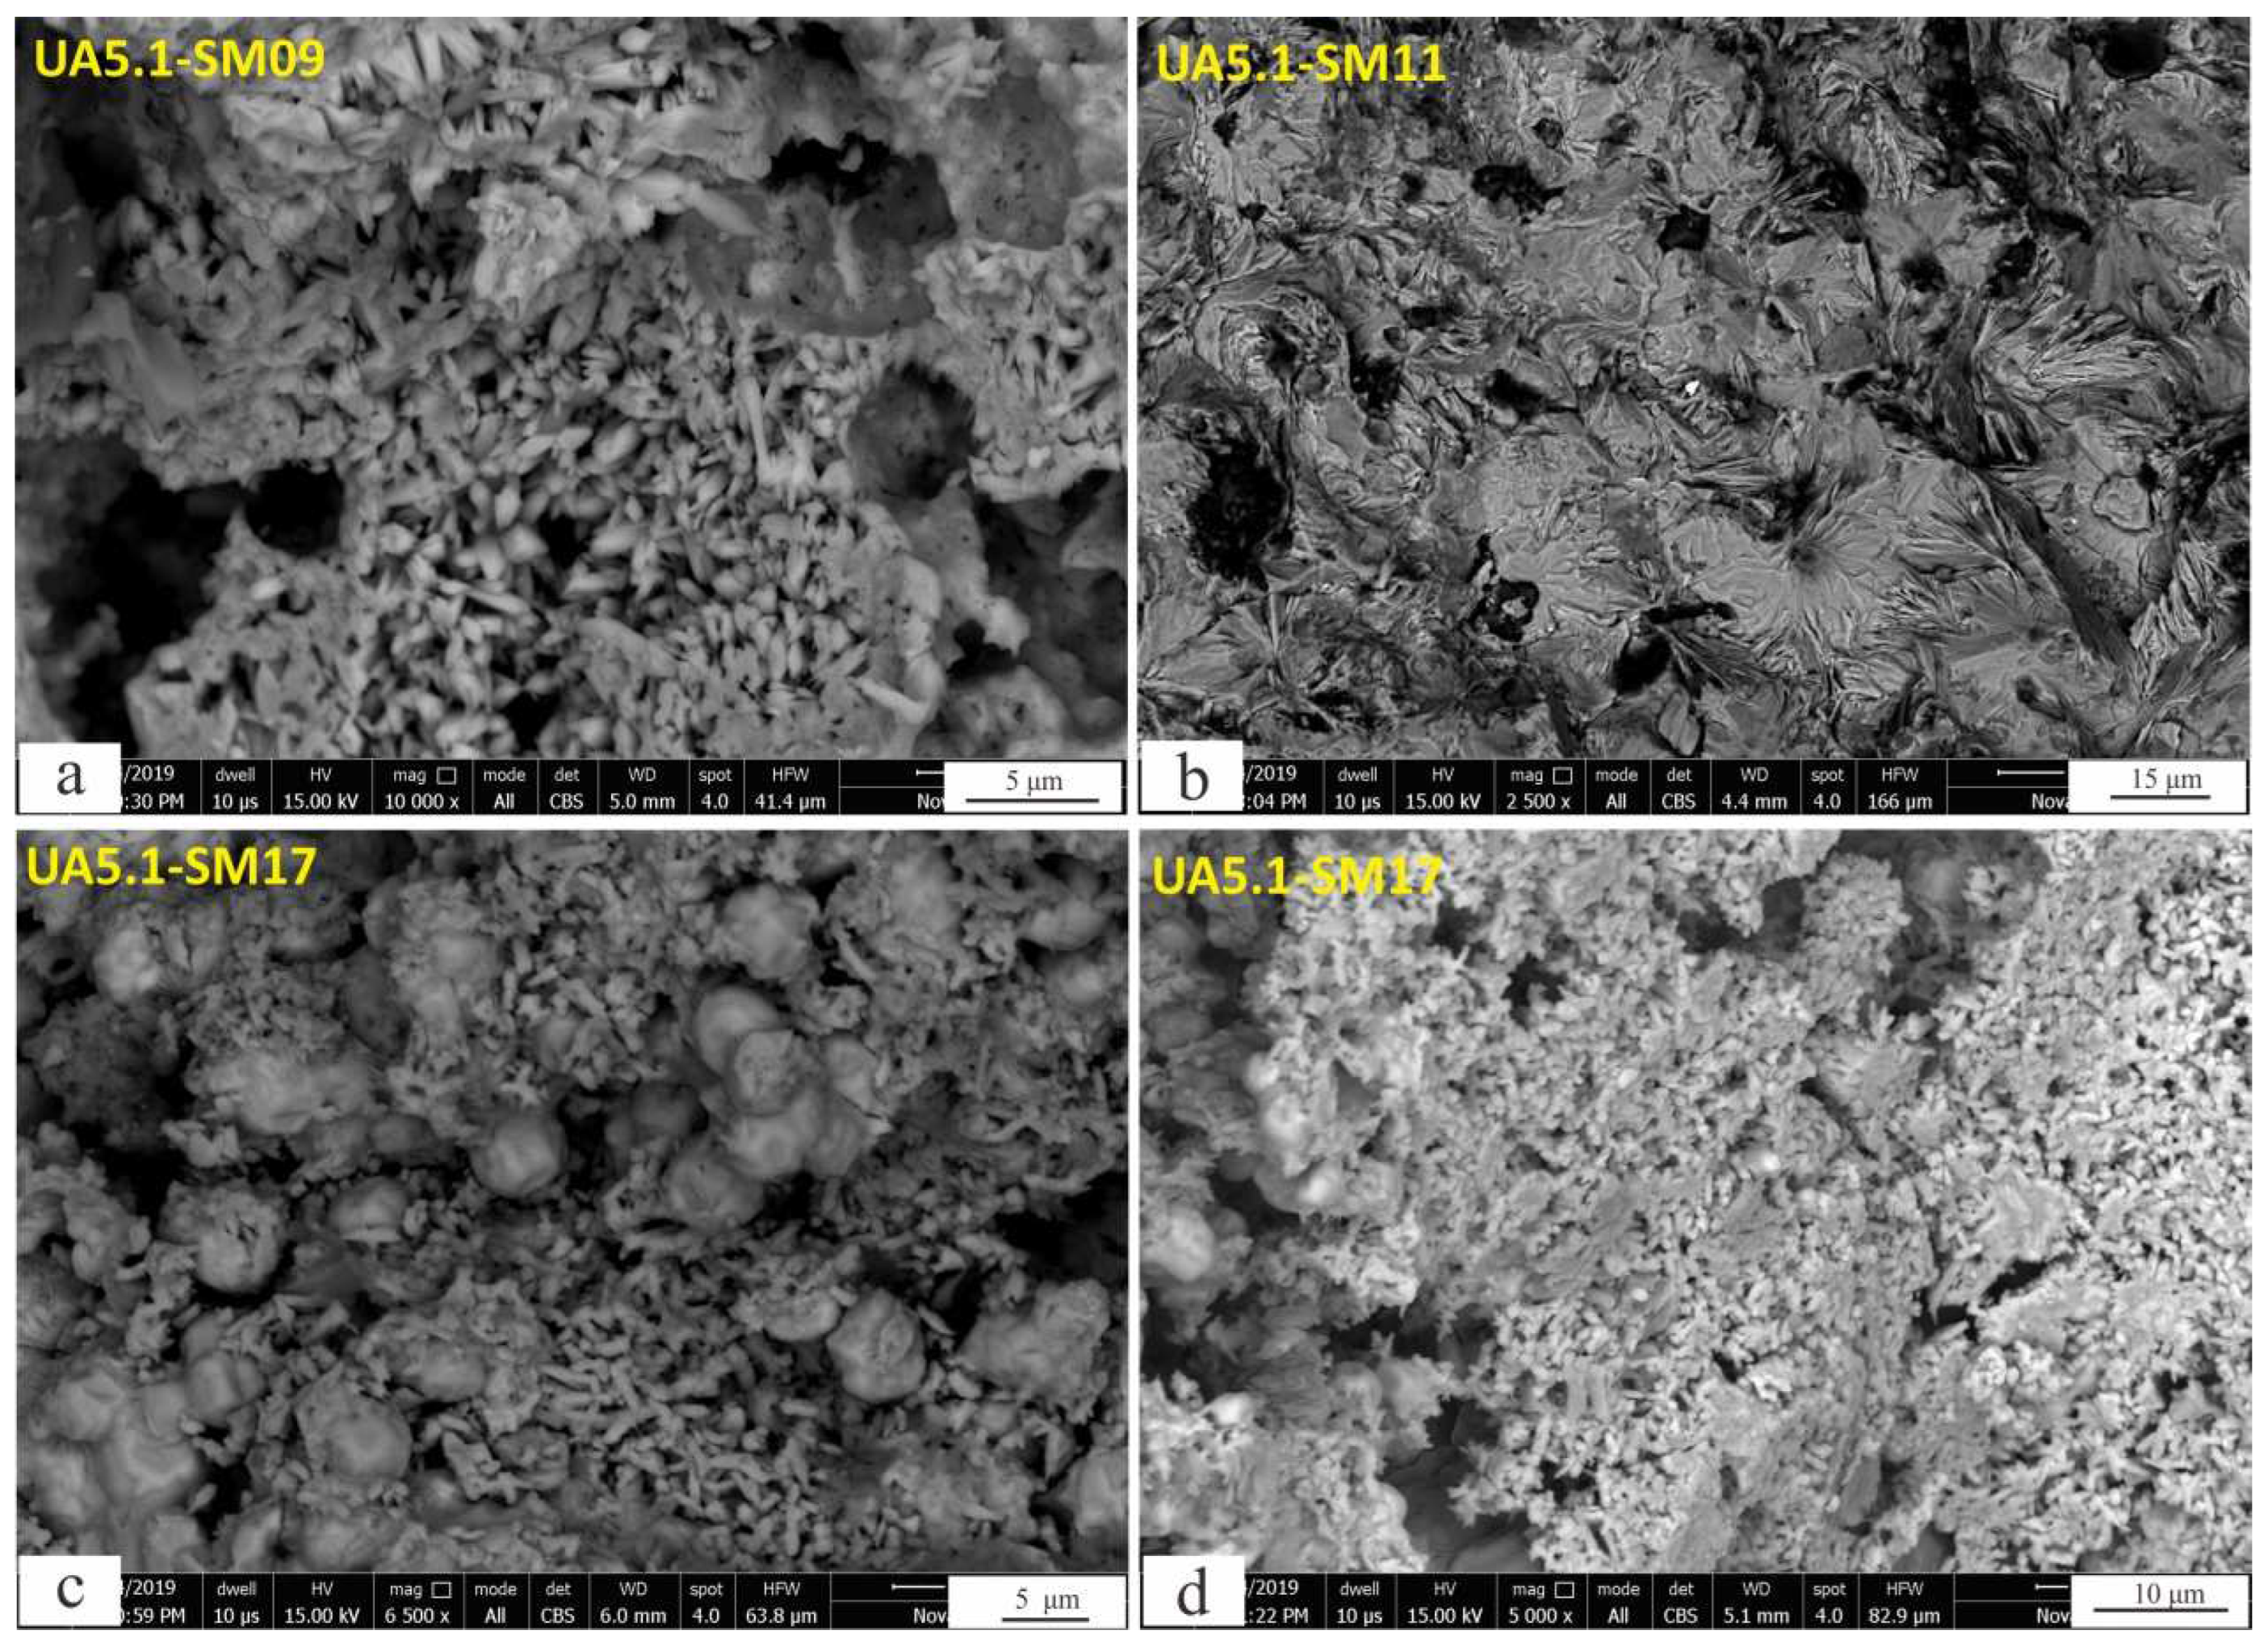
4.4. Ferruginous Sandstone Uranium Minerals
5. Discussions
5.1. Genesis of Ferruginous Sandstone
5.2. Mechanism of Uranium Concentration in Ferruginous Sandstone
5.3. Role of Ferric Ions in Uranium Mineralization
6. Conclusions
- The ferruginous sandstone is mainly found in the Khusayyayn Formation of the Wajid Group, mainly distributed along the bottom or bedding of the sandstone, thin-bedded and lenticular, mainly cemented by hematite and limonite. The ferric iron basically exists in the form of Fe2O3 in the ferruginous sandstone, and a small amount of reducing substances remains, such as FeO, organic carbon, and sulfur.
- All of the uranium anomalies were hosted in ferruginous sandstone in the Khusayyayn Formation of the Wajid Group. It indicates that the uranium was weakly reformed after the uranium concentration in an alkaline oxidation environment.
- It is concluded that there was poor potential for uranium mineralization in the ferruginous sandstone in the work area, and its radioactivity has little impact on the environment. The primary reason is that the uranium mineralization in the ferruginous sandstone was small in size and unfavorable for in situ leaching mining.
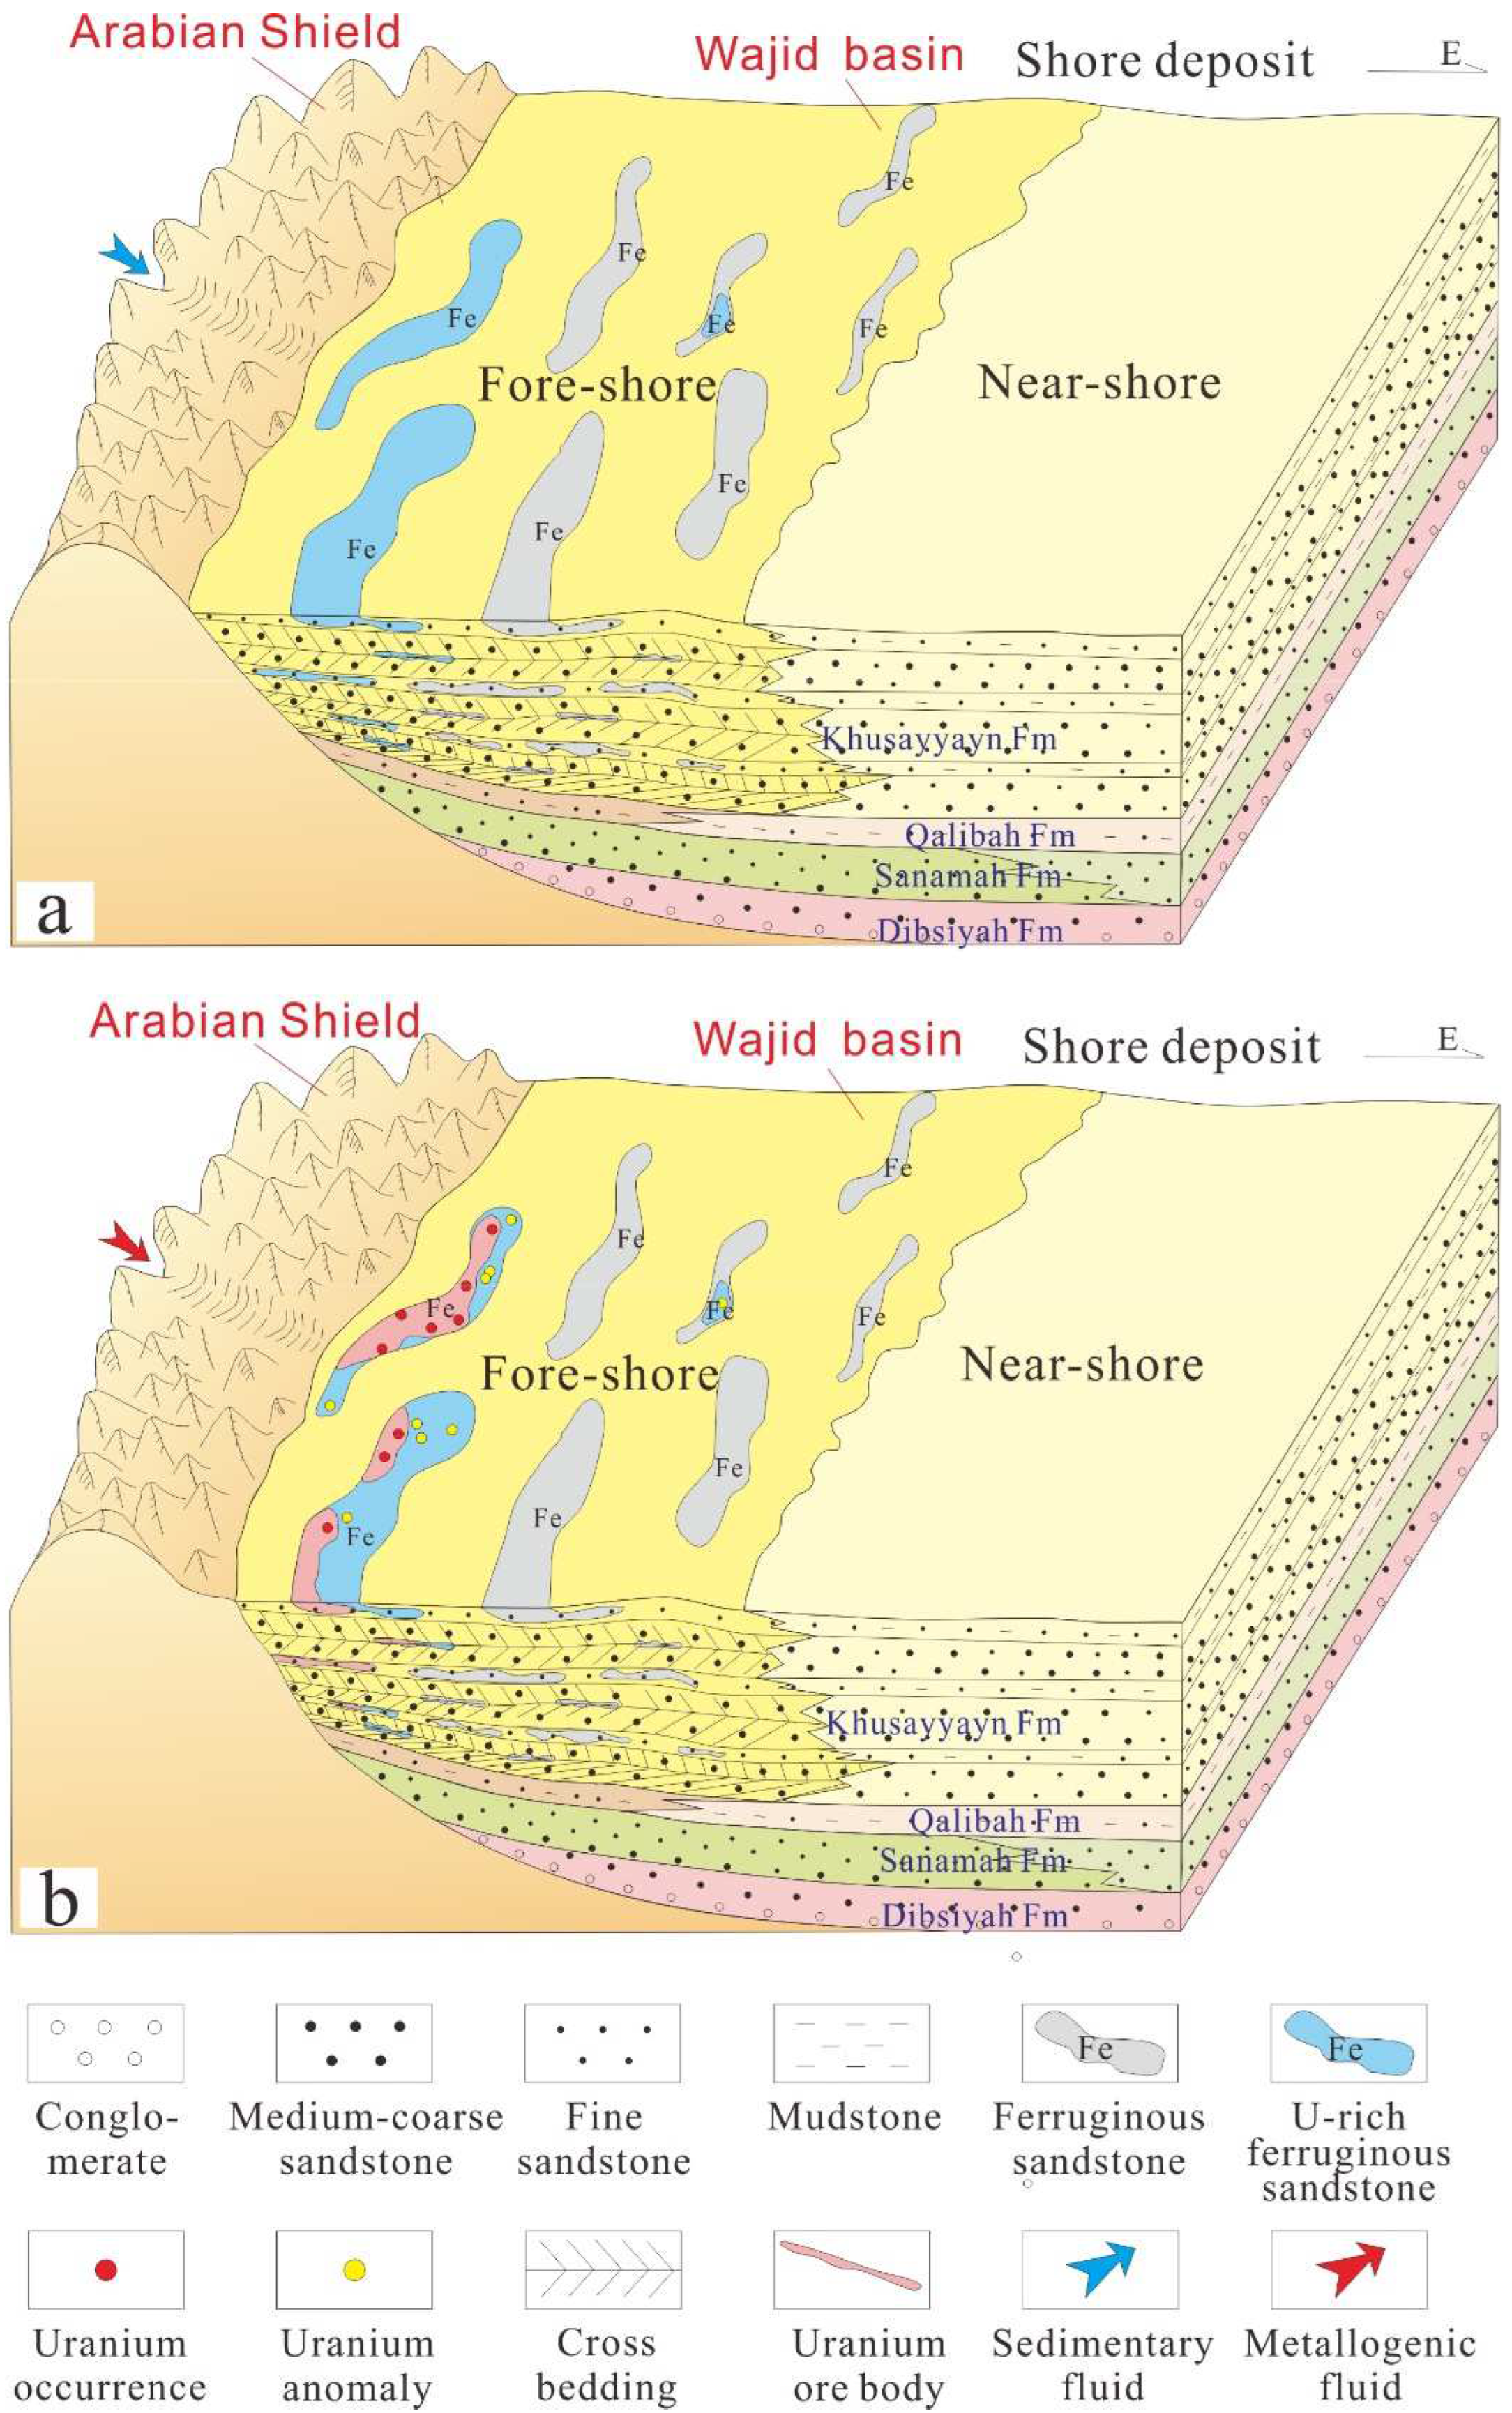
- The formation of the ferruginous sandstone in the study area occurred during the early synsedimentary and later diagenesis stages. The initial concentration of the uranium occurred during the deposition of the ferruginous sandstone.
- Ferric ions are closely related to uranium mineralization. Most of the uranium was adsorbed by ferric colloidal solutions, and part of it was reduced by Fe2+, organic carbon, and sulfur in the uranium preconcentrated stage during the ferruginous sandstone deposit. The uranium ore was superimposed, transformed, and concentrated due to the change in the pH environment in the early Neogene.
Author Contributions
Funding
Institutional Review Board Statement
Informed Consent Statement
Data Availability Statement
Acknowledgments
Conflicts of Interest
References
- Adekoya, J.A.; Aluko, A.F.; Opeloye, S.A. Sedimentological characteristics of Ajali sandstone in the Benin flank of Anambra basin, Nigeria. Ife J. Sci. 2011, 13, 327–337. [Google Scholar]
- Elzien, S.; Abdelateif, F.A.; Mohamed, A.A. Tectonic setting of ferruginous sandstone evidences from petrography and geochemistry, west ed debba, sudan. Int. J. Eng. Res. -Online 2013, 1, 346–357. [Google Scholar]
- Hopson, P.M.; Wilkinson, I.P.; Woods, M.A.; Farrant, A.R. The Lower Albian (Lower Cretaceous) Monk’s Bay Sandstone Formation (formerly the Carstone) of the Isle of Wight: Its distribution, litho- and biostratigraphy. Proc. Geol. Assoc. 2011, 122, 816–830. [Google Scholar] [CrossRef]
- Shen, B.F. Geological characters and resource prospect of the BIF type iron ore deposits in China. Acta Geol. Sin. 2012, 86, 1376–1395. [Google Scholar]
- Konhauser, K.O.; Amskold, L.; Lalonde, S.V.; Posth, N.R.; Kappler, A.; Anbar, A. Decoupling photochemical Fe(II) oxidation from shallow-water BIF deposition–ScienceDirect. Earth Planet. Sci. Lett. 2007, 258, 87–100. [Google Scholar] [CrossRef]
- Babalola, L.O.; Hussain, M.; Hariri, M.M. Origin of iron-rich beds in the basal Wajid Sandstone, Abha-Khamis Mushayt Area, Southwest Saudi Arabia. Arab. J. Sci. Eng. 2003, 28, 3–24. [Google Scholar]
- Babalola, L.O. Depositional environments and provenance of the Wajid Sandstone, Abha-Khamis Mushayt Area, southwestern Saudi Arabia. Master’s Thesis, King Fahd University of Petroleum and Minerals, Dhahran, Saudi Arabia, 1999; p. 239. [Google Scholar]
- Abzalov, M.Z.; Paulson, O. Sandstone hosted uranium deposits of the great divide basin, Wyoming, USA. Appl. Earth Sci. 2012, 121, 76–83. [Google Scholar] [CrossRef]
- Dallwitz, W.B. Preliminary Laboratory Investigation of Radioactive Ferruginous Sandstone from Madigan’s Prospect, Bynoe Harbour, Northern Territory; Geoscience Australia: Canberra, Australia, 1953. [Google Scholar]
- Hayat, H.M.A.; Hussain, S.; Ali, H.M.; Anwar, N.; Iqbal, M.N. Extraction of yttrium from ferruginous sandstone, southwestern sinai, Egypt. Chem. Technol. 2015, 10, 234–241. [Google Scholar]
- Mahmouds, S.M.; Salman, H.M.; Abdelfattah, N.A. Liquid—liquid extraction of uranium from sulfate leach liquor of Ramlet Hemeyir, ferruginous sandstone ore material, Southwestern, Sinai, Egypt. Phys. Chem. Indian J. 2014, 9, 322–329. [Google Scholar]
- MiSchubert, C.; Schüth, C.; Michelsen, N.; Rausch, R.; Al-Saud, M. Investigation and Treatment of Natural Radioactivity in Large-Scale Sandstone Aquifer Systems. Int. J. Water Resour. Arid. Environ. 2011, 1, 25–32. [Google Scholar]
- Rose, A.W.; Wright, R.J. Geochemical exploration models for sedimentary uranium deposits. J. Geochem. Explor. 1980, 13, 153–179. [Google Scholar] [CrossRef]
- Ministry of Water and Electricity (MoWE), the Kingdom of Saudi Arabia. Study of Groundwater Natural Radioactive Contamination Phenomena, Volume 1: Main report; Ministry of Water and Electricity, the Kingdom of Saudi Arabia: Riyadh, Saudi Arabia, 2014. [Google Scholar]
- Ministry of Water and Electricity (MoWE), the Kingdom of Saudi Arabia. Study of Groundwater Natural Radioactive Contamination Phenomena, Volume 4: Sandstone Aquifers; Ministry of Water and Electricity, the Kingdom of Saudi Arabia: Riyadh, Saudi Arabia, 2014. [Google Scholar]
- Johnson, P.R. Explanatory Notes to the Map of Proterozoic Geology of Western Saudi Arabia; Saudi Geological Survey Technical Report SGS-TR-2006-4; Scale 1:1,500,000; Saudi Geological Survey: Jeddah, Saudi Arabia, 2006; p. 62. [Google Scholar]
- Johnson, P.R.; Andresen, A.; Collins, A.S.; Fowler, A.R.; Fritz, H.; Ghebreab, W.; Kusky, T.; Stern, R.J. Late cryogenian-ediacaran history of the Arabian-Nubian Shield: A review of depositional, plutonic, structural, and tectonic events in the closing stages of the northern East African Orogen. J. Afr. Earth Sci. 2011, 61, 167–232. [Google Scholar] [CrossRef]
- Kellog, K.S.; Janjou, D.; Minoux, L.; Fourniguet, J. Explanatory Notes to the Geological Map of the Wadi Tathlith Quadrangle, Sheet 20G; Kingdom of Saudi Arabia, Ministry of Petroleum and Mineral Resources Deputy Ministry for Mineral Resources: Jeddah, Saudi Arabia, 1986. [Google Scholar]
- Edgell, H.S. Aquifers of Saudi Arabia and the geologic framework. Arab. J. Sci. Technol. 1997, 22, 5–31. [Google Scholar]
- Hussain, M.; Babalola, L.O.; Hariri, M.M. Heavy minerals in the Wajid Sandstone from Abha-Khamis Mushayt area, southwestern Saudi Arabia: Implications on provenance and regional tectonic setting. GeoArabia 2004, 9, 77–102. [Google Scholar] [CrossRef]
- Keller, M.; Amarah, B.; Al Ajmi, F.H. The Wajid Sandstone around Abha/Khamis Mushayt and in its type area: Lithostratigraphic architecture and correlations. Arab. J. Geosci. 2017, 10, 55. [Google Scholar] [CrossRef]
- Keller, M.; Hinderer, M.; Ajmi, H.A.; Rausch, R. Sedimentary History of the Paleozoic Wajid Group (Saudi Arabia) and Implications for the Tectono-Stratigraphic Evolution of the Southwestern Arabian Platform; Workshop of ILP-Task Force on Sedimentary Basins: Abu Dhabi, United Arab Emirates, 2009; Volume 5, pp. 11–12. [Google Scholar]
- Abdulkadir, I.T.; Abdullatif, O.M. Facies, Depositional Environments, Reservoir Potential and Palaeogeography of the Cambro-Ordovician Dibsiyah Formation, Wajid Outcrop Belt, Saudi Arabia. Arab. J. Sci. Eng. 2013, 38, 1785–1806. [Google Scholar] [CrossRef]
- Abdulkadir, I.T.; Sahin, A.; Abdullatif, O.M. Distribution of petrophysical parameters in the Cambro-Ordovician dibsiyah member of theWajid sandstone, SWSaudi Arabia. J. Petrol. Geol. 2010, 33, 269–280. [Google Scholar] [CrossRef]
- Ajmi, H.A.; Keller, M.; Hinderer, M.; Rausch, R. Advances in Understanding the Relation between Reservoir Properties and Facies Distribution in the Paleozoic Wajid Sandstone, Saudi Arabia. Advances in the Research of Aquatic Environment; Springer: Berlin/Heidelberg, Germany, 2011; pp. 21–28. [Google Scholar]
- Al Ajmi, F.H.; Keller, M.; Hinderer, M.; Filomena, C.M. Lithofacies, depositional environments, and stratigraphic architecture of the Wajid Group outcrops in southern Saudi Arabia. GeoArabia 2015, 20, 49–94. [Google Scholar] [CrossRef]
- Bassis, A.; Hinderer, M.; Meinhold, G. New insights into the provenance of Saudi Arabian Palaeozoic sandstones from heavy mineral analysis and single-grain geochemistry. Sediment. Geol. 2016, 333, 100–114. [Google Scholar] [CrossRef]
- Yassin, M.; Abdullatif, O. Geochemistry of the Lower Paleozoic Wajid Formation in Saudi Arabia—Implications for Tectonic Setting and Provenance. In Proceedings of the 76th EAGE Conference and Exhibition, Amsterdam, The Netherlands, 16–19 June 2014. [Google Scholar]
- Dabbagh, M.E.; Rogers, J. Depositional environments and tectonic significance of the Wajid Sandstone of southern Saudi Arabia. J. Afr. Earth Sci. 1983, 1, 47–57. [Google Scholar] [CrossRef]
- Nehlig, P.; Genna, A.; Asirfane, F. A review of the Pan-African evolution of the Arabian Shield. GeoArabia 2002, 7, 103–124. [Google Scholar] [CrossRef]
- McGillivary, J.G.; Husseini, M.I. The Paleozoic petroleum geology of the central Arabia. AAPG 1992, 76, 1473–1490. [Google Scholar]
- Evans, D.S.; Lathon, R.B.; Senalp, M.; Connally, T.C. Stratigraphy of the Wajid Sandstone of Southwestern Saudi Arabia. Paper SPE 21449. In Proceedings of the SPE Middle East Oil Show, Bahrain, 16–19 November 1991; pp. 947–960. [Google Scholar]
- Fairer, G.M. Geologic Map of the Wadi Baysh Quadrangle, Sheet 17F, Kingdom of Saudi Arabia. Saudi Arabian Deputy Ministry for Mineral Resources Geoscience MapGM-77C, Scale 1:250,000; Ministry of Petroleum and Mineral Resources, Deputy Ministry for Mineral Resources: Jeddah, Saudi Arabia, 1985; p. 40. [Google Scholar]
- Janjou, D.; Halawani, M.A.; Memesh, A.; Razin, P.; Jaques, R.; Roobol, M.J.; Shorbaji, H. Geologic Map of the Jibal al Misma Quadrangle, Sheet 27D, Kingdom of Saudi Arabia. Saudi Arabian Deputy Ministry for Mineral Resources Geoscience Map GM-138, Scale 1: 250,000; Ministry of Petroleum and Mineral Resources, Deputy Ministry for Mineral Resources: Jeddah, Saudi Arabia, 1998; p. 40. [Google Scholar]
- Ajmi, H.A.; Hinderer, M.; Rausch, R.; Hornung, J.; Bassis, A. Matrix versus fracture permeability in a regional sandstone aquifer (Wajid sandstone, SW Saudi Arabia), Grundwasser. Grund. —Z. Der Fachsekt. Hydrogeol. 2014, 19, 151–157. [Google Scholar] [CrossRef]
- Kellogg, K.S.; Janjou, D.; Minoux, L.; Fourniguet, F. Geologic Map of the Wadi Tathlith Quadrangle, Sheet 20G, Kingdom of Saudi Arabia. Saudi Arabian Deputy Ministry for Mineral Resources Geoscience Map GM-103C, Scale 1:250,000; Ministry of Petroleum and Mineral Resources, Deputy Ministry for Mineral Resources: Jeddah, Saudi Arabia, 1986; p. 27. [Google Scholar]
- Dini, S.M.; Wallace, C.A.; Halawani, M.A.; Al-sobhi, S.A.; Kashghari, W.A.; Al-Ghamdi, A.S. Explanatory Notes to the Geological Map of the As Sulayyil Quadrangle, Sheet 20H, Kingdom of Saudi Arabia; Saudi Geological Survey: Jeddah, Saudi Arabia, 2009. [Google Scholar]
- Senalp, M.; Al-Duaiji, A. Stratigraphy and sedimentology of the storm and tide-dominated shallow marine siliciclastic members of the Qasim formation, Qasim region, Saudi Arabia. GeoArabia Middle East Petrol. Geosci. 1996, 1, 192. [Google Scholar]
- Moshrif, M.A.; El-Hiti, A. Lithofacies and petrography of Wajid sandstone (Cambrian-Ordovician) Saudi Arabia. J. Afr. Earth Sci. 1989, 9, 401–412. [Google Scholar] [CrossRef]
- Mahgoub, M.I.; Abdullatif, O.M. Facies, petrography, reservoir heterogeneity and quality of the late Carboniferous-Permian Juwayl Member, Wajid Sandstone, SW Saudi Arabia. Mar. Pet. Geol. 2020, 120, 104521. [Google Scholar] [CrossRef]
- Wanas, H.A.; Abdel-Maguid, N.M. Petrography and geochemistry of the Cambro-Ordovician Wajid Sandstone, southwest Saudi Arabia: Implications for provenance and tectonic setting. J. Asian Earth Sci. 2006, 27, 416–429. [Google Scholar] [CrossRef]
- Greenwood, W.R. Explanatory Notes to the Geological Map of the Jibal Al Qahr Quadrangle, Sheet 19G, Kingdom of Saudi Arabia; Ministry of Petroleum and Mineral Resources, Deputy Ministry for Mineral Resources: Jeddah, Saudi Arabia, 1985. [Google Scholar]
- Yassin, M.A.; Abdullatif, O.M. Chemostratigraphic and sedimentologic evolution of Wajid Group (Wajid Sandstone): An outcrop analog study from the Cambrian to Permian, SW Saudi Arabia. J. Afr. Earth Sci. 2017, 126, 159–175. [Google Scholar] [CrossRef]
- Melvin, J.; Norton, A.K. Advances in Arabian stratigraphy: Comparative studies of glaciogenic Juwayl and lower Unayzah strata (Carboniferous-Permian) of Saudi Arabia. GeoArabia 2013, 18, 97–134. [Google Scholar] [CrossRef]
- Nabawy, B.S.; Ibrahim, E.; Kahal, A.; Alfaifi, H.J.; Lashin, A.A. Impact of authigenic iron oxides, clay content and grain size on the aquifer quality properties of the Cambrian-Ordovician Wajid Sandstone, southwest Saudi Arabia. J. Afr. Earth Sci. 2020, 172, 104000. [Google Scholar] [CrossRef]
- Stump, T.E.; Van Der Eem, J.G. The stratigraphy, depositional environments and periods of deformation of the Wajid outcrop belt, southwestern Saudi Arabia. J. Afr. Earth Sci. 1995, 21, 421–441. [Google Scholar] [CrossRef]
- Benaafi, M.; Hariri, M.; Al-Shaibani, A.; Abdullatif, O.; Makkawi, M. Integrated geomechanical, petrographical and petrophysical study of the sandstones of the Wajid Group, SW Saudi Arabia. J. Afr. Earth Sci. 2018, 143, 162–177. [Google Scholar] [CrossRef]
- Benaafi, M.; Hariri, M.; Bertotti, G.; Al-Shaibani, A.; Abdullatif, O.; Makkawi, M. Natural fracture system of the Cambro-Permian Wajid Group, Wadi Al-Dawasir, SW Saudi Arabia. J. Pet. Sci. Eng. 2019, 175, 140–158. [Google Scholar] [CrossRef]
- Finch, R.; Murakami, T. Systematics and paragenesis of uranium minerals. In Uranium: Mineralogy, Geochemistry and the Environment; Burns, P.C., Finch, R., Eds.; De Gruyter: Berlin, Germany, 1999; pp. 91–180. [Google Scholar]
- Tribovillard, N.; Algeo, T.J.; Lyons, T.; Riboulleau, A. Trace metals as paleoredox and paleoproductivity proxies: An update. Chem. Geol. 2006, 232, 12–32. [Google Scholar] [CrossRef]
- Boynton, W.V. Geochemistry of the rare earth elements: Meteorite studies. In Rare Earth Element Geochemistry; Elsevier: Amsterdam, The Netherlands, 1984; pp. 63–114. [Google Scholar]
- Mariano, A.N. Economic geology of rare earth minerals. In Geochemistry and Mineralogy of Rare Earth Elements. Mineralogical Society of America Reviews in Mineralogy 21; Lipin, B.R., McCay, G., Eds.; Mineralogical Society of America: Chelsea, MI, USA, 1989; pp. 309–338. [Google Scholar]
- McLennan, S.M. Rare earth elements in sedimentary rocks: Influence of provenance and sedimentary processes. Rev. Mineral. Geochem. 1989, 21, 169–200. [Google Scholar]
- Migdisov, A.A.; Williams-Jones, A.E. A spectrophotometric study of Nd(III), Sm(III) and Er(III) complexation in sulfate-bearing solutions at elevated temperatures. Geochim. Cosmochim. Acta 2008, 72, 5291–5303. [Google Scholar] [CrossRef]
- Garnit, H.; Bouhlel, S.; Barca, D.; Chtara, C. Application of LA-ICP-MS to sedimentary phosphatic particles from Tunisian phosphorite deposits: Insights from trace elements and REE into paleo-depositional environments. Chem. Erde Geochem. 2012, 72, 127–139. [Google Scholar] [CrossRef]
- Ludwig, R.K.; Wallace, R.A.; Simmons, R.K. The Schwartzwalder uranium deposit, II: Age of uranium mineralization and Lead isotope constraints on genesis. Econ. Geol. 1985, 80, 1858–1871. [Google Scholar] [CrossRef]
- Jensen, M.L. Sulfur isotopes and the origin of sandstone-type uranium deposits. Econ. Geol. 1958, 53, 598–616. [Google Scholar] [CrossRef]
- Ludwig, K.R. Calculation of uncertainty of U-Pb isotope data. Earth Planet. Sci. Lett. 1980, 46, 212–220. [Google Scholar] [CrossRef]
- Ludwig, K.R. PBDAT—A Program for Reduction of Pb-U-Th Isotope Data, for Use with HP—86/87 Microcomputers; Open File Report 83-113; U.S. Geological Survey: Drive Reston, VA, USA, 1984; p. 54. [Google Scholar]
- Ludwig, K.R. ISOPLOT: A Plotting and Regression Program for Radiogenic Isotope Data; Open File Report 91-445; U.S. Geological Survey: Drive Reston, VA, USA, 1993; pp. 1–42. [Google Scholar]
- Fathy, D.; Wagreich, M.; Ntaflos, T.; Sami, M. Paleoclimatic variability in the southern Tethys, Egypt: Insights from the mineralogy and geochemistry of Upper Cretaceous lacustrine organic-rich deposits. Cretac. Res. 2021, 126, 104880. [Google Scholar] [CrossRef]
- Fawzy, M.M.; Mahdy, N.M.; Sami, M. Mineralogical characterization and physical upgrading of radioactive and rare metal minerals from Wadi Al-Baroud granitic pegmatite at the Central Eastern Desert of Egypt. Arab. J. Geosci. 2020, 13, 413. [Google Scholar] [CrossRef]


| Sample Number | Coordinates | Test Results | |||||||||||||||
|---|---|---|---|---|---|---|---|---|---|---|---|---|---|---|---|---|---|
| Longitude | Latitude | Elevation | SiO2 | Al2O3 | Fe2O3 | MgO | CaO | Na2O | K2O | MnO | TiO2 | P2O5 | LOI | FeO | Th | U | |
| A5.1/SR01 | 44°14′13.08″ | 18°58′24.82″ | 1312 | 57.80 | 1.06 | 31.67 | 0.18 | 1.24 | 0.04 | 0.22 | 1.18 | 0.05 | 0.22 | 5.76 | <0.10 | 1.09 | 107 |
| A5.1/SR02 | 44°13′42.80″ | 19°04′30.19″ | 1312 | 59.96 | 1.47 | 27.89 | 0.23 | 2.72 | 0.06 | 0.34 | 0.11 | 0.06 | 0.22 | 6.36 | <0.10 | 1.03 | 67.4 |
| A5.1/SR05 | 44°13′50.24″ | 19°04′28.00″ | 1184 | 61.97 | 2.02 | 22.85 | 0.22 | 3.78 | 0.03 | 0.25 | 1.72 | 0.11 | 0.18 | 6.27 | <0.10 | 1.68 | 374 |
| A5.1/SR06 | 44°13′50.25″ | 19°03′09.06″ | 1167 | 63.15 | 1.51 | 21.91 | 0.24 | 4.29 | 0.02 | 0.26 | 1.43 | 0.07 | 0.12 | 6.44 | <0.10 | 2.13 | 40.7 |
| A5.1/SR07 | 44°14′13.08″ | 18°58′24.8″ | 1194 | 64.11 | 1.07 | 26.70 | 0.25 | 1.41 | 0.03 | 0.26 | 0.59 | 0.05 | 0.26 | 4.72 | <0.10 | 1.39 | 237 |
| A5.1/SR08 | 44°14′32.37″ | 18°57′51.03″ | 1217 | 72.67 | 1.86 | 17.96 | 0.16 | 1.64 | 0.10 | 0.25 | 0.23 | 0.07 | 0.12 | 4.40 | <0.10 | 2.96 | 76.3 |
| A5.1/SR09 | 44°16′59.87″ | 18°57′29.95″ | 1249 | 51.89 | 1.44 | 32.91 | 0.30 | 3.42 | 0.03 | 0.29 | 1.28 | 0.05 | 0.13 | 7.70 | <0.10 | 2.84 | 10.8 |
| H5.1/SR06 | 44°13′42.80″ | 19°04′30.19″ | 1312 | 61.77 | 1.11 | 27.22 | 0.20 | 2.57 | 0.04 | 0.26 | 0.15 | 0.05 | 0.22 | 5.87 | <0.10 | 1.41 | 52.5 |
| H5.1/SR07 | 44°13′50.24″ | 19°04′28.00″ | 1184 | 59.90 | 1.48 | 22.99 | 0.18 | 5.65 | 0.02 | 0.24 | 1.80 | 0.09 | 0.19 | 6.87 | <0.10 | 1.75 | 766 |
| H5.1/SR08 | 44°13′50.26″ | 19°03′09.07″ | 1167 | 62.97 | 0.68 | 23.29 | 0.19 | 3.67 | 0.02 | 0.14 | 1.98 | 0.04 | 0.19 | 6.28 | <0.10 | 3.89 | 48.5 |
| H5.1/SR09 | 44°14′13.08″ | 18°58′24.8″ | 1194 | 60.30 | 1.07 | 29.69 | 0.15 | 0.58 | 0.04 | 0.30 | 2.24 | 0.06 | 0.21 | 4.82 | <0.10 | 1.40 | 176 |
| W5.1/SR01 | 44°14′32.33″ | 18°59′50.22″ | 1202 | 58.46 | 1.42 | 23.02 | 0.13 | 6.22 | 0.05 | 0.34 | 2.23 | 0.06 | 0.09 | 7.76 | <0.10 | 2.33 | 6.1 |
| W5.1/SR03 | 44°13′42.80″ | 19°04′30.19″ | 1312 | 60.84 | 1.49 | 28.67 | 0.21 | 1.95 | 0.05 | 0.44 | 0.09 | 0.09 | 0.21 | 5.77 | 0.45 | 11.50 | 58.6 |
| W5.1/SR04 | 44°13′50.24″ | 19°04′28.00″ | 1184 | 61.32 | 1.91 | 24.63 | 0.21 | 3.35 | 0.07 | 0.23 | 1.35 | 0.11 | 0.19 | 6.39 | <0.10 | 2.86 | 279 |
| W5.1/SR05 | 44°13′50.24″ | 19°03′09.05″ | 1167 | 62.99 | 1.52 | 20.99 | 0.15 | 4.67 | 0.04 | 0.27 | 2.67 | 0.08 | 0.08 | 6.35 | <0.10 | 3.91 | 36.1 |
| UA5.1/SM01 | 44°13′34.02″ | 19°06′47.58″ | 1164 | 41.27 | 18.22 | 29.82 | 0.24 | 0.28 | 0.07 | 0.54 | 0.02 | 1.08 | 0.39 | 7.80 | 0.28 | 18.10 | 86.9 |
| UA5.1/SM02 | 44°13′34.02″ | 19°06′47.58″ | 1164 | 75.43 | 2.13 | 16.98 | 0.35 | 1.28 | 0.05 | 0.13 | 0.05 | 0.12 | 0.16 | 3.29 | 0.27 | 6.67 | 73.7 |
| UA5.1/SR03 | 44°10′20.57″ | 19°26′08.40″ | 1153 | 6.67 | 2.92 | 84.97 | 0.08 | 0.37 | 0.02 | 0.07 | 0.03 | 0.15 | 0.71 | 3.98 | 0.29 | 6.31 | 92.5 |
| UA5.1/SM04 | 44°14′13.21″ | 18°57′28.52″ | 1216 | 59.57 | 1.57 | 32.23 | 0.11 | 0.34 | 0.04 | 0.46 | 1.19 | 0.05 | 0.13 | 4.17 | <0.10 | 2.68 | 39 |
| UA5.1/SM05 | 44°12′31.04″ | 19°01′54.38″ | 1221 | 68.68 | 2.32 | 24.86 | 0.15 | 0.69 | 0.05 | 0.61 | 0.07 | 0.06 | 0.13 | 2.29 | 0.33 | 1.91 | 215 |
| UA5.1/SM06 | 44°12′31.04″ | 19°01′54.38″ | 1221 | 50.65 | 14.08 | 23.43 | 0.18 | 0.87 | 0.09 | 1.81 | 0.03 | 0.65 | 0.20 | 7.80 | 0.41 | 16.70 | 73.9 |
| UA5.1/SM07 | 44°12′31.04″ | 19°01′54.38″ | 1221 | 55.94 | 12.17 | 22.58 | 0.25 | 0.24 | 0.05 | 0.71 | 0.03 | 0.78 | 0.14 | 7.05 | 0.27 | 10.80 | 163 |
| UA5.1/SM08 | 44°12′27.85″ | 19°03′17.79″ | 1173 | 70.44 | 2.19 | 14.22 | 0.16 | 5.27 | 0.04 | 0.42 | 0.05 | 0.21 | 0.10 | 6.83 | 0.39 | 5.24 | 36.8 |
| UA5.1/SM09 | 44°13′27.85″ | 19°03′17.79″ | 1173 | 39.86 | 6.53 | 38.63 | 0.16 | 1.17 | 0.09 | 1.57 | 3.43 | 0.45 | 0.29 | 7.52 | <0.10 | 6.93 | 210 |
| UA5.1/SR06 | 44°13′27.85″ | 19°03′17.79″ | 1173 | 71.08 | 7.13 | 12.12 | 0.10 | 0.56 | 0.13 | 1.97 | 2.51 | 0.49 | 0.05 | 3.82 | <0.10 | 1.48 | 7.71 |
| UA5.1/SM10 | 44°13′27.85″ | 19°03′17.79″ | 1173 | 60.97 | 0.75 | 22.31 | 0.22 | 6.22 | 0.03 | 0.16 | 1.08 | 0.04 | 0.28 | 7.81 | <0.10 | 2.20 | 183 |
| UA5.1/SM11 | 44°14′01.95″ | 19°03′08.99″ | 1158 | 59.35 | 0.98 | 31.07 | 0.18 | 1.37 | 0.05 | 0.07 | 0.66 | 0.09 | 0.58 | 4.49 | <0.10 | 1.03 | 320 |
| UA5.1/SM12 | 44°16′43.75″ | 19°01′51.87″ | 1181 | 10.38 | 3.67 | 70.00 | 0.38 | 2.21 | 0.05 | 0.23 | 0.41 | 0.18 | 0.25 | 12.14 | <0.10 | 5.90 | 58.2 |
| UA5.1/SM13 | 44°20′21.78″ | 19°03′06.45″ | 1141 | 59.58 | 1.56 | 31.55 | 0.15 | 1.64 | 0.03 | 0.12 | 0.15 | 0.07 | 0.14 | 4.95 | 0.46 | 4.04 | 11.9 |
| UA5.1/SM15 | 44°20′26.45″ | 19°03′25.95″ | 1137 | 48.39 | 0.89 | 44.66 | 0.16 | 2.31 | 0.02 | 0.04 | 0.05 | 0.02 | 0.14 | 3.28 | 0.64 | 2.42 | 642 |
| UA5.1/SM16 | 44°05′23.54″ | 18°54′46.68″ | 1324 | 81.39 | 0.76 | 12.04 | 0.12 | 1.72 | 0.03 | 0.08 | 0.30 | 0.09 | 0.08 | 3.35 | 0.36 | 2.28 | 51.9 |
| UA5.1/SM17 | 44°13′47.42″ | 18°54′32.57″ | 1254 | 50.15 | 9.05 | 26.42 | 0.18 | 3.76 | 0.10 | 1.24 | 0.35 | 0.33 | 0.11 | 8.14 | 0.41 | 17.30 | 365 |
| UA5.1/SM18 | 44°13′47.42″ | 18°54′32.57″ | 1254 | 43.91 | 6.93 | 33.87 | 0.36 | 3.75 | 0.17 | 1.28 | 0.13 | 0.29 | 0.13 | 8.67 | <0.10 | 17.00 | 627 |
| UA5.1/SR28 | 44°13′25.24″ | 18°56′20.08″ | 1239 | 37.13 | 14.86 | 38.34 | 0.21 | 0.33 | 0.04 | 0.45 | 0.01 | 0.84 | 0.75 | 6.62 | 0.46 | 18.20 | 39.1 |
| UA5.1/SR33 | 44°04′45.93″ | 18°47′43.83″ | 1352 | 74.60 | 0.55 | 20.92 | 0.08 | 0.34 | 0.02 | 0.02 | 0.09 | 0.10 | 0.46 | 2.80 | 0.55 | 1.62 | 4.34 |
| Sample Number | Longitude | Latitude | Lithology Name | U (ppm) | Organic Carbon (wt.%) | S (wt.%) | pH | Eh (mV) |
|---|---|---|---|---|---|---|---|---|
| H5.1/SR01 | 44°14′31.38″ | 20°13′35.46″ | Yellow sandstone | 1.44 | 0.058 | 0.006 | 9.29 | 192 |
| H5.1/SR02 | 44°14′31.38″ | 20°13′35.46″ | Gray sandstone | 26.3 | 0.081 | 0.029 | 9.25 | 206 |
| H5.1/SR03 | 44°14′32.33″ | 18°59′50.22″ | Light yellow sandstone | 2.07 | 0.094 | 0.011 | 9.24 | 205 |
| H5.1/SR04 | 44°14′13.08″ | 18°58′24.82″ | Yellow sandstone | 11.1 | 0.078 | 0.015 | 9.80 | 226 |
| H5.1/SR05 | 44°13′17.90″ | 19°04′20.03″ | Yellow sandstone | 3.9 | 0.061 | 0.125 | 8.68 | 236 |
| H5.1/SR06 | 44°13′42.80″ | 19°04′30.19″ | Black ferruginous sandstone | 52.5 | 0.069 | 0.057 | 8.56 | 245 |
| H5.1/SR07 | 44°13′50.24″ | 19°04′28.00″ | Black ferruginous sandstone | 766 | 0.060 | 0.075 | 8.69 | 241 |
| H5.1/SR08 | 44°13′50.26″ | 19°03′09.07″ | Brownish ferruginous sandstone | 48.5 | 0.054 | 0.059 | 8.69 | 248 |
| H5.1/SR09 | 44°14′13.08″ | 18°58′24.80″ | Black ferruginous sandstone | 176 | 0.052 | 0.078 | 8.49 | 251 |
| H5.1/SR10 | 44°30′03.44″ | 20°21′44.12″ | Gray sandstone | 0.945 | 0.062 | 0.024 | 9.10 | 224 |
| H5.1/SR11 | 43°57′19.82″ | 19°25′54.81″ | Red sandstone | 1.65 | 0.064 | 0.014 | 9.03 | 217 |
| Sample Number | Longitude | Latitude | Lithology Name | U (μg/g) | Ra (Bq/g) | Kp | Up (μg/g) |
|---|---|---|---|---|---|---|---|
| A5.1/SR01 | 44°14′13.08″ | 18°58′24.82″ | Yellow ferruginous sandstone | 107.00 | 1.296 | 0.98 | 104.43 |
| A5.1/SR02 | 44°13′42.80″ | 19°04′30.19″ | Black ferruginous sandstone | 67.40 | 0.892 | 1.07 | 71.88 |
| A5.1/SR03 | 44°13′42.80″ | 19°04′30.19″ | Yellow sandstone | 2.95 | 0.036 | 0.99 | 2.93 |
| A5.1/SR04 | 44°13′42.80″ | 19°04′30.19″ | Yellow sandstone | 3.24 | 0.035 | 0.87 | 2.80 |
| A5.1/SR05 | 44°13′50.24″ | 19°04′28.00″ | Black ferruginous sandstone | 374.00 | 4.334 | 0.93 | 349.23 |
| A5.1/SR06 | 44°13′50.25″ | 19°03′09.06″ | Black ferruginous sandstone | 40.70 | 0.482 | 0.95 | 38.84 |
| A5.1/SR07 | 44°14′13.08″ | 18°58′24.8″ | Black ferruginous sandstone | 237.00 | 2.607 | 0.89 | 210.07 |
| A5.1/SR08 | 44°14′32.37″ | 18°57′51.03″ | Yellow ferruginous sandstone | 76.30 | 0.826 | 0.87 | 66.56 |
| A5.1/SR09 | 44°16′59.87″ | 18°57′29.95″ | Yellow ferruginous sandstone | 10.80 | 0.118 | 0.88 | 9.51 |
| A5.1/SR10 | 44°13′17.90″ | 19°04′20.03″ | Black ferruginous sandstone | 3.49 | 0.044 | 1.03 | 3.58 |
| A5.1/SR11 | 44°16′59.90″ | 18°57′29.90″ | Black ferruginous sandstone | 3.21 | 0.045 | 1.12 | 3.60 |
| Sample Number | Test Results (wt%) | ||||||||||||
|---|---|---|---|---|---|---|---|---|---|---|---|---|---|
| Test Point | Y2O3 | SiO2 | FeO | UO2 | MgO | Na2O | TiO2 | ThO2 | As2O5 | Al2O3 | MnO | PbO | |
| UA5.1/SM01 | 1 | 1.15 | 12.57 | 0.18 | 22.83 | / | / | / | 51.96 | / | / | 0.13 | 0.15 |
| 2 | / | 29.66 | 0.19 | 10.81 | / | / | / | 7.67 | 0.07 | / | 0.06 | 1.16 | |
| UA5.1/SM 10 | 1 | 1.03 | 25.01 | 0.28 | 5.77 | 0.04 | 0.49 | / | 30.67 | / | 0.69 | / | 0.86 |
| UA5.1/SM 11 | 1 | 0.19 | 1.38 | 1.83 | 87.86 | / | 1.04 | 0.61 | / | / | / | 1.33 | 0.28 |
| 2 | / | 13.41 | 1.91 | 60.58 | 0.14 | 0.08 | 0.16 | / | 0.16 | 0.04 | / | / | |
| 3 | / | 30.08 | 2.14 | 48.46 | 0.07 | 0.14 | / | / | / | 0.01 | 0.24 | / | |
| 4 | / | 1.20 | 1.19 | 91.18 | / | 0.19 | / | / | / | 0.07 | 1.02 | 0.14 | |
| 5 | 0.30 | 3.72 | 2.42 | 82.09 | 0.06 | 1.19 | 0.16 | / | 0.29 | 0.03 | 0.58 | 0.28 | |
| Sample Number | Test Results (wt%) | ||||||||||||
| Test point | V2O3 | K2O | Nd2O3 | CaO | Ce2O3 | SO3 | La2O3 | ZrO2 | Pr2O3 | P2O5 | SnO2 | Total | |
| UA5.1/SM01 | 1 | 0.08 | 0.30 | / | 0.18 | / | / | / | 0.23 | / | 1.88 | / | 91.64 |
| 2 | / | / | / | / | 0.30 | 0.04 | 0.25 | 44.26 | 0.13 | 1.61 | / | 96.21 | |
| UA5.1/SM 10 | 1 | 0.11 | 0.19 | / | 0.09 | / | / | / | 27.21 | 0.08 | 0.91 | / | 93.43 |
| UA5.1/SM 11 | 1 | / | 0.26 | / | 1.38 | 0.35 | 0.12 | / | 0.74 | / | 1.43 | / | 98.80 |
| 2 | / | 1.50 | 0.26 | 11.67 | / | 8.63 | / | 0.15 | 0.05 | 0.27 | / | 99.01 | |
| 3 | / | 0.51 | / | 3.55 | / | 0.09 | / | 0.15 | / | 0.60 | / | 86.04 | |
| 4 | / | 0.20 | / | 0.55 | / | / | 0.37 | / | / | 1.21 | / | 97.32 | |
| 5 | / | 0.29 | / | 1.26 | 0.22 | 1.48 | / | 0.47 | / | 2.73 | / | 97.57 | |
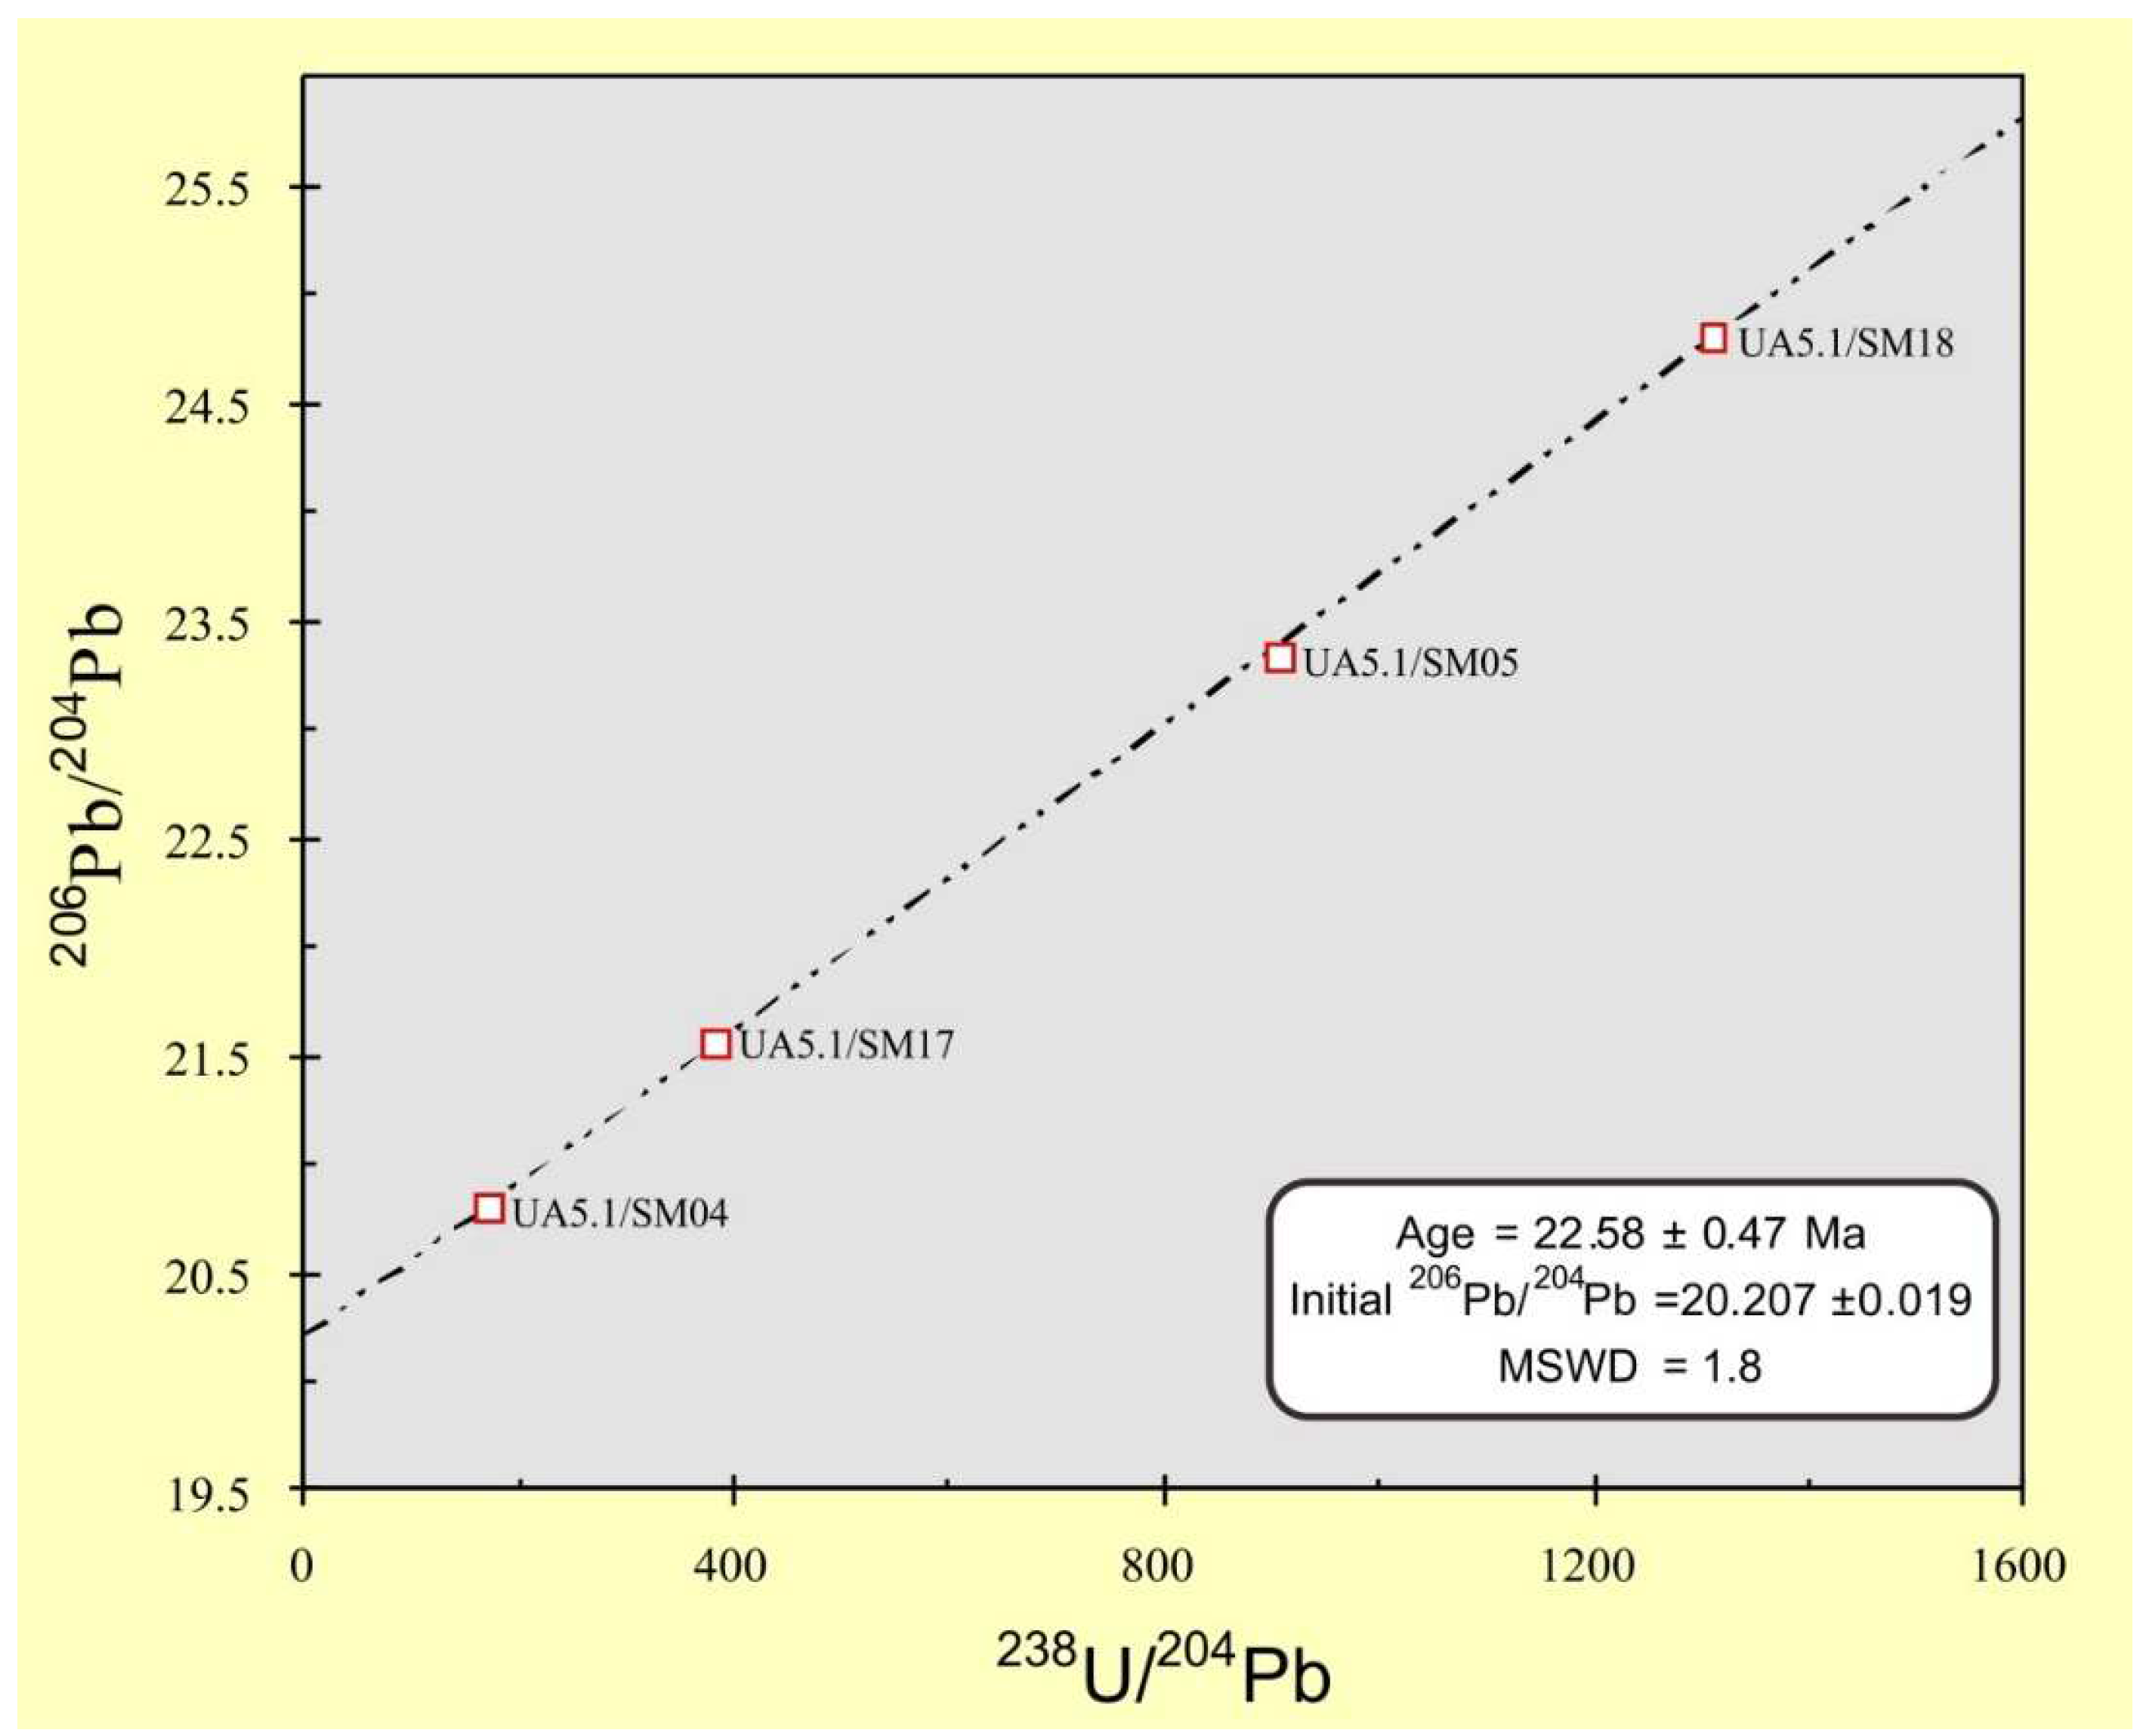
| Sample Number | U (μg/g) | Pb (μg/g) | 238U/204Pb | 208Pb/204Pb | 207Pb/204Pb | 206Pb/204Pb |
|---|---|---|---|---|---|---|
| UA5.1/SM01 | 86.9 | 37.3 | 160.655 | 39.767 | 16.113 | 23.003 |
| UA5.1/SM04 | 39 | 15.5 | 170.314 | 39.135 | 15.956 | 20.803 |
| UA5.1/SM05 | 215 | 16.3 | 906.008 | 39.054 | 16.123 | 23.333 |
| UA5.1/SM10 | 183 | 21.0 | 625.821 | 39.128 | 16.274 | 26.766 |
| UA5.1/SM11 | 320 | 29.5 | 977.673 | 39.232 | 17.347 | 46.660 |
| UA5.1/SM17 | 365 | 64.4 | 380.684 | 39.115 | 16.034 | 21.565 |
| UA5.1/SM18 | 627 | 33.5 | 1309.290 | 39.014 | 16.197 | 24.807 |
Publisher’s Note: MDPI stays neutral with regard to jurisdictional claims in published maps and institutional affiliations. |
© 2022 by the authors. Licensee MDPI, Basel, Switzerland. This article is an open access article distributed under the terms and conditions of the Creative Commons Attribution (CC BY) license (https://creativecommons.org/licenses/by/4.0/).
Share and Cite
He, F.; Xing, Z.; Li, X.; Zhang, Z.; Jia, C. Genetic Mechanism of Uranium Concentration in Ferruginous Sandstone of the Wajid Group in Southern Saudi Arabia. Appl. Sci. 2022, 12, 9643. https://doi.org/10.3390/app12199643
He F, Xing Z, Li X, Zhang Z, Jia C. Genetic Mechanism of Uranium Concentration in Ferruginous Sandstone of the Wajid Group in Southern Saudi Arabia. Applied Sciences. 2022; 12(19):9643. https://doi.org/10.3390/app12199643
Chicago/Turabian StyleHe, Feng, Zuochang Xing, Xide Li, Zilong Zhang, and Cui Jia. 2022. "Genetic Mechanism of Uranium Concentration in Ferruginous Sandstone of the Wajid Group in Southern Saudi Arabia" Applied Sciences 12, no. 19: 9643. https://doi.org/10.3390/app12199643
APA StyleHe, F., Xing, Z., Li, X., Zhang, Z., & Jia, C. (2022). Genetic Mechanism of Uranium Concentration in Ferruginous Sandstone of the Wajid Group in Southern Saudi Arabia. Applied Sciences, 12(19), 9643. https://doi.org/10.3390/app12199643