Article

A Novel Radial Artery P-S Curve Model Based on Radial Vibration of Vascular Wall

1
Institute of Microelectronics of the Chinese Academy of Sciences, Beijing 100029, China
2
University of Chinese Academy of Sciences, Beijing 100049, China
*
Author to whom correspondence should be addressed.
Appl. Sci. 2022, 12(19), 9706; https://doi.org/10.3390/app12199706
Submission received: 22 August 2022 / Revised: 17 September 2022 / Accepted: 23 September 2022 / Published: 27 September 2022

Abstract

:
In pulse wave analysis, the changing curve of pulse wave strength with continuous increasing pressure, that is, the P-S (pressure-strength) curve, contains abundant human physiological information, but there is no accurate model to describe the formation mechanism of the curve. Therefore, this paper proposes a modeling method of the radial artery P-S curve based on the radial vibration of the vascular wall. The modeling method includes three parts. Firstly, based on hemodynamics, we proposed the blood motion equation in the pulsation process of healthy people. Secondly, the motion equation of the vascular wall based on the fluid–structure interaction between blood motion and vascular wall was established. Finally, according to the elastic theory of the vascular wall, the relationship between pulse strength and extravascular pressure of blood vessels was found. To verify the accuracy and applicability of the model, this paper simulated the changes in the vascular wall stress and the intravascular pressure with the extravascular pressure during the process of vascular deformation. In addition, 69 healthy volunteers were selected to participate in this study. Based on the gradient compression, the pulse strength envelope under the continuous pressure sequence of the radial artery, namely the pulse P-S curve, was extracted. We also analyzed the relationship between the individual P-S curve difference and BMI. The results show that the actual human body data collection and analysis results are consistent with the theoretical model established in this paper, which indicates that the model can provide a novel idea for the evaluation of the state of the human body.

1. Introduction

The arterial pulse is a phenomenon of periodic oscillation of flow, blood pressure and blood vessel wall caused by the periodic ejection activity of the heart [1,2,3]. The arterial pulse can be noninvasively detected at the body’s surface with the radial artery, which contains abundant physiological and pathological information [4,5,6,7]. In clinical practice, the pulse information that corresponds to the strongest point of radial artery vibration is often obtained through finger pressure and finger feeling. The finger pressure that corresponds to the strongest point represents the static pressure applied to the pulse, and the finger feeling represents the strength of the pulse [8,9]. The P-S curve of pulse wave can be used to quantify the change trend of finger pressure and finger feeling. However, the traditional human perception has subjective factors and it is difficult to continuously record the two-dimensional information of pulse pressure and strength, so machine perception came into being.
At present, the analysis and modeling of pulse waves mainly focuses on the single-cycle waveform of the maximum strength pulse wave. O’Rourke [10] systematically explained the waveform characteristics of pulse waves from the perspective of time domains. Wang JJ [11] used the linearization method of characteristic analysis to establish the pulse wave propagation model in the aorta of the whole body. Stergiopulos N [12] established a lumped hemodynamic model of the arterial system based on resistance and compliance. Yoon YZ [13] used the pulse wave peak average value and applied pressure as parameters to describe the pulse change trend and analyze the pulse static pressure. Wei CC [14] established a single-cycle pulse wave spring model and carried out data verification. Lin Wang Y-Y et al. [15] established a fluid model of elastic tubes and proved the importance of transverse vibration of the arterial tube. Alastruey J [16] proposed the R-C circuit model of pulse waves and analyzed the relationship between pressure and flow in the process of pulse wave propagation. Yoo SK et al. [17] proposed a gradient pressure measurement method for the differences in biological individuals, obtained the pulse wave under the optimal pulse pressure, and improved the automation and accuracy of pulse wave acquisition. These researchers above focused on the modeling of the time-domain single cycle pulse wave and the analysis of the optimal pulse pressure through the pulse P-S curve, but there is no accurate research model for the formation mechanism of the P-S curve.
To solve this problem, based on the theory of radial vibration of vascular walls, this paper systematically analyzes the change in pulse strength with extravascular pressure from the perspectives of hemodynamics, fluid–structure interaction and elastic mechanics of the vascular wall, and establishes a theoretical model of the relationship between pulse strength and pressure. To verify the accuracy and applicability of this model, this paper simulates the changes in blood flow velocity, intravascular pressure and vascular wall stress when the vascular wall is deformed by extravascular pressure. Through the pulse diagnostic apparatus [18,19,20] independently developed by our laboratory, the radial pulse signals of 69 healthy human volunteers were collected. Based on the gradient compression method, the pulse strength envelope under the continuous pressure sequence of the radial artery was extracted, and the radial artery P-S curve of the sample was obtained. Furthermore, the relationship between sample P-S curve variability and BMI was analyzed.
The results show that the actual human body data acquisition and analysis results are in line with the radial artery P-S curve theory based on the radial vibration of the vascular wall proposed in this paper. At the same time, the reason for the difference in the P-S curve of the pulse of a healthy human body can be explained by the model. The model can explain the formation mechanism of pulse P-S curves in healthy human bodies. The study provides new ideas for assessing the health status of the human body through the radial artery, and to a certain extent, it can assist doctors in the diagnosis of physical health.

2. Models and Methods

This paper mainly models the pulse P-S curve using the following three steps: firstly, we established the blood movement equation of human arteries under the condition of pulsating flow, and analyzed the relationship between axial velocity and radial velocity of blood flow. Secondly, based on fluid–structure interactions, we established the relationship between blood flow velocity and vascular wall displacement, and the changes in vascular wall stress were analyzed. Finally, based on the theory of vascular wall elasticity, we analyzed the changes in pulse strength under the combined effects of extravascular pressure, intravascular pressure and elastic stress of vascular wall.

2.1. Model of Blood Movement

The walls of human vessels are composed of three layers. The inner layer is composed of endothelial cells and the stromal membrane, the middle layer is composed of collagen and smooth muscle fibers, which is elastic, and the outer layer is a more relaxed connective tissue. We took a small segment of vascular microns in the radial artery, assumed that the blood vessels were cylindrical tubes of various isotropy, and constructed the vascular model shown in Figure 1.
In this model, the x -axis direction is the axial direction of the blood vessel, r is the radial direction, θ is the circular direction, μ and the v are the blood axial and radial flow rate, O is the coordinate origin, and R is the blood vessel radius. In this column coordinate system, the basic equation for blood movement is as follows [21,22].
Continuity equation:
μ x + 1 r r ( r v ) = 0
Axial and radial equations of motion:
μ t + μ μ x + v μ r = 1 ρ p x + η ( 2 μ r 2 + 1 r μ r + 2 μ x 2 )
v t + μ v x + v v r = 1 ρ p r + η ( 2 v r 2 + 1 r v r + 2 v x 2 v r 2 )
where ρ is the blood density and η indicates the motility viscosity of the blood. Due to the periodic ejection of the heart, the blood travels within the blood vessel in the form of pressure waves and assuming that the pulse is propagated by a sine wave with a wave velocity of a and a circular frequency of ω , the flow rate is expressed in the form of a plural, as shown in Formula (4).
{ μ = μ 0 ( r ) e j ω ( t x a ) v = v 0 ( r ) e j ω ( t x a )
Substituting Formula (4) into Formula (1) yields a radial initial flow rate of blood v 0 and the order of magnitude relationship (expressed in O ) of the axial initial flow rate μ 0 , as shown in Formula (5).
v 0 = O ( ω R a μ 0 )
Razavi, A., Zhao, Y.C. et al. [3,23] analyzed the changes in arterial blood flow under different stenosis degrees based on the blood continuity equation and momentum equation. On this basis, this study introduced the transformation equation of blood flow radial velocity and axial velocity. In addition, we analyzed the magnitude relationship between radial velocity and axial velocity, and provided an important basis for the elastic vibration of the arterial wall.

2.2. Model of Vascular Wall Movement

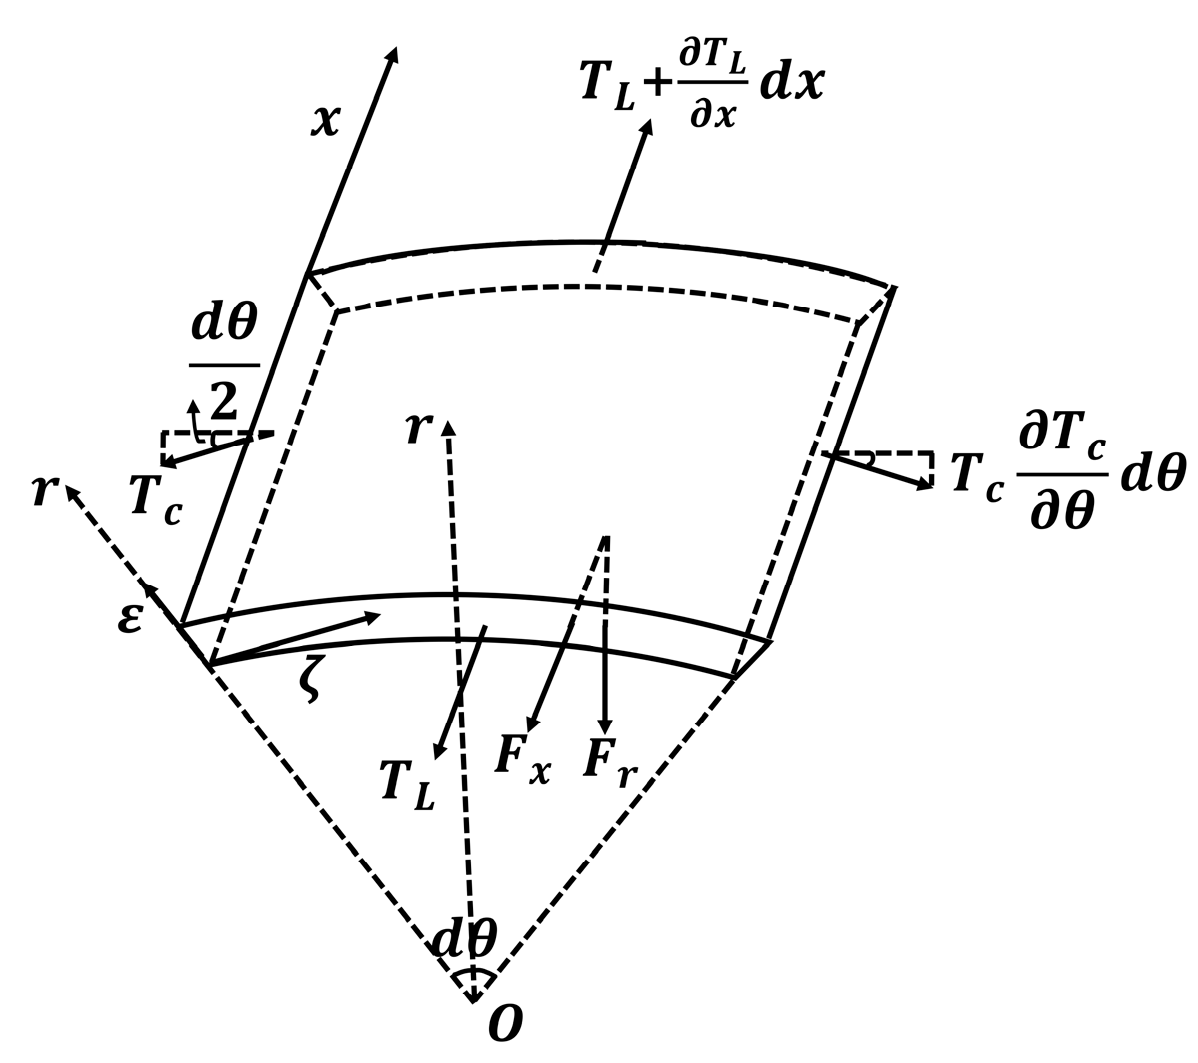
Vascular wall movement and blood flow are closely coupled, and the pressure of the doctor’s fingertip touching the radial artery in the clinic is the result of the direct effect of the vascular wall movement. To obtain the equation of motion of the arterial tube, a very small unit with the arc angle of the arterial tube as d θ is selected and the force analysis is performed to establish the following model, as shown in Figure 2.
In this model, x represents the axial direction, r represents the radial direction, T C and T L represent the peripheral and axial tension of the vascular wall, F r and F x represent the radial and axial components of the blood viscous friction force on the vascular wall, and ξ and ζ represent the radial and circumferential displacement of the vascular wall under the action of external force, respectively. Assuming that blood is a Newtonian fluid, according to the constitutive equation of Newtonian fluid [24], the viscous stress that acts on the inner surface of the blood vessel wall is shown in Formula (6).
{ τ r r = 2 η ( v r ) r = R τ r x = η ( μ r + v x ) r = R
Therefore, the radial and axial components of the viscous friction force are shown in Equation (7).
{ F r = 2 η ( v r ) r = R · R d θ · d x F x = η ( μ r + v x ) r = R · R d θ · d x
In addition to the effect of blood friction, the blood vessel wall will also be subject to elastic tension and assuming that the Young’s modulus of the blood vessel wall is E , the Poisson ratio of the blood vessel is σ , and the thickness of the blood vessel is h , the axial strain and circumferential strain of the blood vessel wall are shown in Formula (8).
{ ε x = ζ x = T L E h σ T C E h = 1 E h ( T L σ T C ) ε c = 2 π ( R + ξ ) 2 π R 2 π R = ξ R = 1 E h ( T C σ T L )
The circumferential and axial tension can be derived from Equation (9).
{ T C = E h 1 σ 2 ( σ ζ x + ξ R ) T L = E h 1 σ 2 ( ζ x + σ ξ R )
Assuming that the vascular wall density is ρ , the equation of radial motion of the vascular wall can be obtained according to the momentum theorem, as shown in Equation (10).
( ρ h R d θ · d x ) · 2 ξ t 2 = ( P P e ) R d θ · d x T C · sin d θ 2 · d x ( T C + T C θ d θ ) · sin d θ 2 · d x F r
where P represents the internal pressure of the blood vessel wall, P e represents the external pressure of the blood vessel wall and by substituting Formulas (7) and (9) into Formula (10), and eliminating the area micro element R d θ · d x , the radial motion equation of the blood vessel wall can be obtained, as shown in Formula (11).
ρ 2 ξ t 2 = P P e h E 1 σ 2 ( σ R ζ x + ξ R 2 ) 2 η h ( v r ) r = R
To simplify Equation (11) of the motion of the vascular wall, its various magnitudes are estimated. As is the case with Formula (4), assuming that the pulsation propagates at a wave velocity of a and a circular frequency of ω , the radial and axial displacement is shown in Equation (12).
{ ξ = ξ 0 e j ω ( t x a ) ζ = ζ 0 e j ω ( t x a )
Thus, the equation of motion for the coupled blood and blood vessel wall is shown in Equation (13).
{ ξ t = v | r = R ζ t = μ | r = R
After magnitude comparison and simplification, the Formula (11) can be expressed as Formula (14).
P P e h E 1 σ 2 ( σ R ζ x + ξ R 2 ) = 0
Similarly, the axial motion equation of the arterial tube is shown in Equation (15).
2 ζ x 2 + σ R ξ x = 0
Formula (16) can be obtained by combining Formula (14) with Formula (15).
P P e h E R 2 ξ = 0
According to Hooke’s law, the annular stress can be obtained, as shown in Equation (17).
τ c = E · ξ R = R h ( P P e )
Thus, the radial stress is shown in Equation (18). When the vascular wall is elastically deformed by an external force, this formula can explain the relationship between the stress of the vascular wall and the external force.
τ r = τ C · sin ( θ 2 ) = R h ( P P e ) · sin ( θ 2 )

2.3. Model of Elastic Deformation of the Vascular Wall

When the doctor examines the pulse, the acupressure feels the strength of the pulse from shallow to deep to find the strongest point of the pulse, and in this process, the vascular wall will deform with the increasing external force. When the extravascular pressure P e is less than the intravascular pressure P , the vascular wall expands due to the action of the internal pressure of the blood. When the extravascular pressure P e is equal to the intravascular pressure P , the vascular wall returns to its natural state. When the extravascular pressure P e is greater than the intravascular pressure P , the vascular wall collapses. Since the blood is an incompressible viscous fluid, the flow in the radial artery is laminar, satisfying Poiseuille’s law [25]. Therefore, the pressure change in the flow is shown in Equation (19).
P = Δ P = Q · 8 η l π R 4
where Q represents the flow rate, η represents the blood viscosity coefficient, and l represents the axial length of the vascular micron. If F is used to represent the strength of the pulse vibration felt by the fingertips of doctors, that is, the combined force of the internal pressure of blood vessels and the radial stress of the vascular wall deformation, the pulse strength F can be divided into the following situations:
1.   P e < P :
F = P F C = Q · 8 η l π R 4 R h ( P P e ) · sin ( θ 2 )
From Formula (20), it can be observed that as the extravascular pressure P e increases, the radial stress F C of the vascular wall gradually decreases, and F gradually increases.
2.   P e = P :
F = P F C = Q · 8 η l π R 4
At this time, due to the balance of extravascular pressure and intravascular pressure, the vascular wall stress disappears, and the pulse strength F reaches its maximum, as shown in Formula (21).
3.   P e > P :
The vascular wall collapses, assuming that L 1 and L 3 are fixed boundaries, L 2 is the force boundary, and the natural state radius is R. The vascular collapse model is shown in Figure 3.
When the vascular wall collapses due to extravascular pressure, the blood flow rate at the collapse increases with the degree of collapse. According to Bernoulli’s Equation (22), the flow weight potential energy at the same location is the same. The greater the velocity of the fluid, the smaller the pressure at the corresponding position. Therefore, when the vascular wall collapses, the intravascular pressure at the site of the collapse decreases.
P 1 + 1 2 ρ v 1 2 + G 1 = P 2 + 1 2 ρ v 2 2 + G 2
The combined force F is shown in Equation (23).
F = P 2 + F C = P 2 + R h ( P e P 2 ) · sin ( θ 2 )
From Formula (23), it can be observed that when the vascular wall collapses, the intravascular pressure P 2 decreases, the vascular radius R decreases, and the extravascular pressure P e increases, eventually leading to a decrease in F .
In summary, with the increase in the extravascular pressure P e , the change trend of pulse strength F gradually increases first. When the intravascular pressure and extravascular pressure reach equilibrium, F reaches the maximum value. As the P e continues to increase, the vascular wall collapses, and F will gradually decrease.

3. Model Validation Experiments and Results

3.1. Simulation Experiment

To verify the accuracy of the above model, we first apply the model to simulate the changes in stress, blood flow velocity and intravascular pressure during the compression deformation of the vascular wall. The software environment is COMSOL (COMSOL Multiphysics® 6.0). The initial parameter settings for the model are shown in Table 1, where R represents the radius of the blood vessel, h represents the thickness of the vascular wall, σ represents Poisson’s coefficient, E represents Young’s modulus, η represents the viscosity coefficient, r h o represents the fluid density, P o u t represents the outlet pressure, and v i n represents the inlet velocity, L 1 and L 3 are fixed boundaries and L 2 is the force boundary.
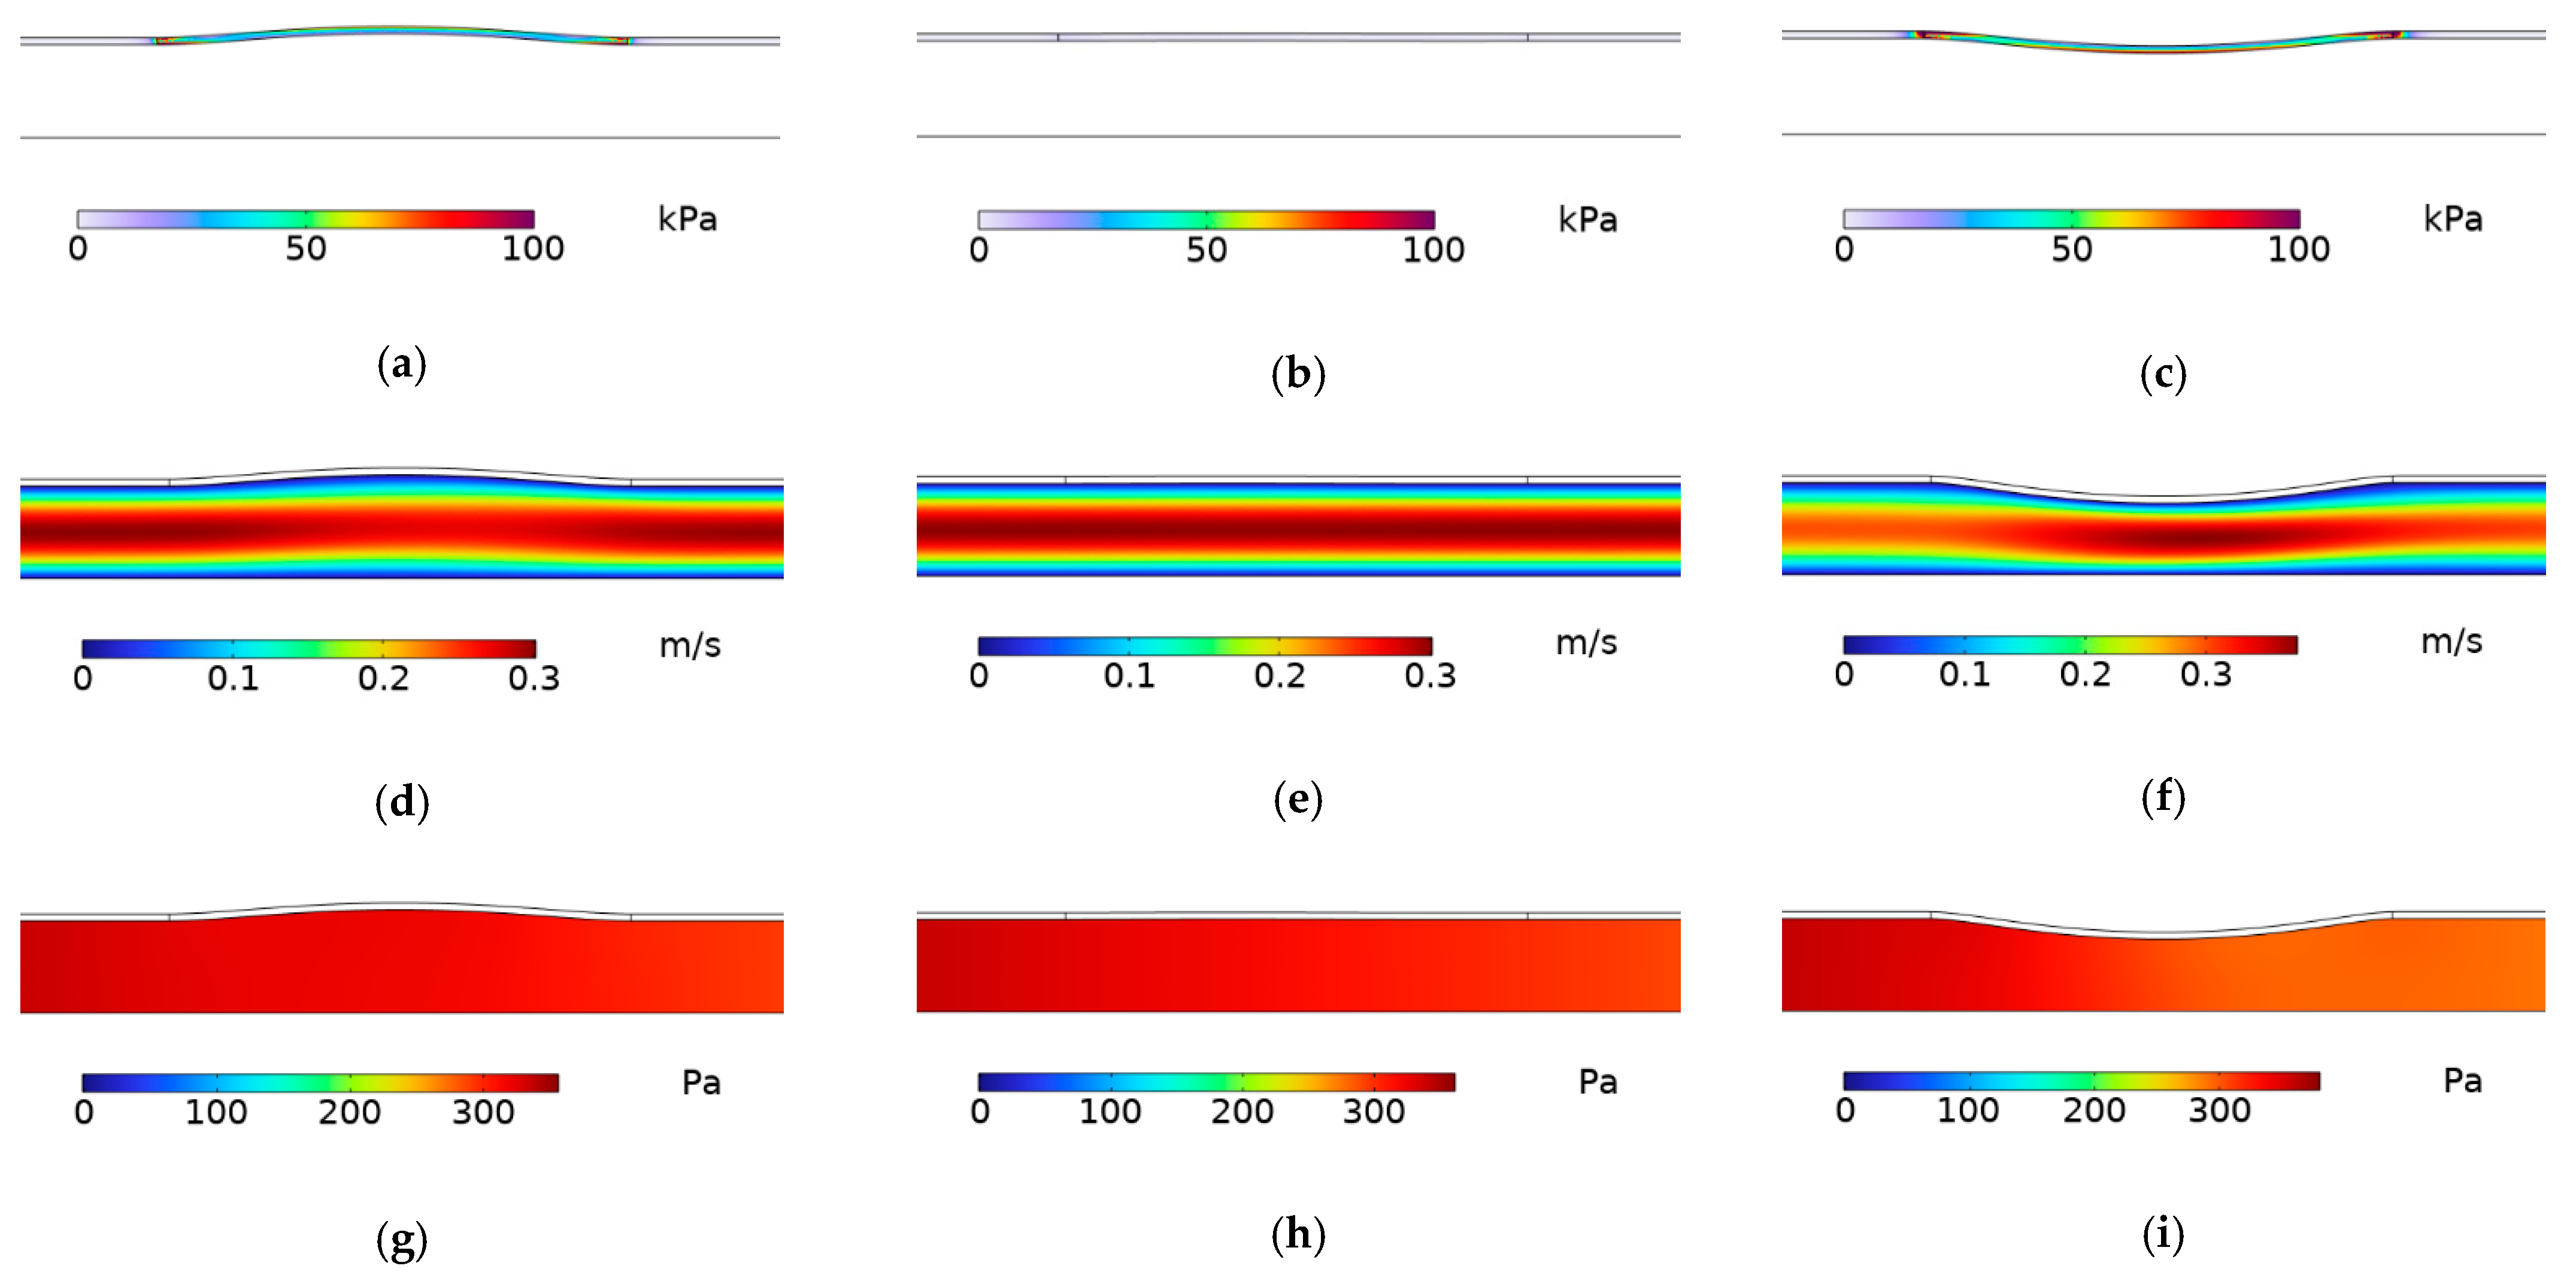
Assuming that the blood vessels are isotropic, uniform, long straight tubes, we substituted the simulation parameters of the hemodynamic model shown in Table 1, and obtained the simulation results of Figure 4.
As shown in Figure 4, it can be observed through the color scale chart that when the extravascular pressure P e gradually increases, the vascular wall stress decreases first and then increases, but the vascular wall stress is opposite along the direction of the radial component. While the blood flow velocity gradually increases, the intravascular pressure gradually decreases, which indicates that the change law of pulse strength F first increases and then decreases, and F reaches the maximum when P = P e . Taking the vascular wall collapse center as the reference point, the wall stress, blood flow velocity and intravascular pressure parameters of each reference point in P > P e , P = P e , P < P e were extracted, as shown in Table 2. Through the simulation model of stress and intravascular pressure, it is found that the variation law of each parameter is in line with the theoretical calculation model proposed by this paper.
According to the above analysis, when P = P e , the stress of the vessel wall almost disappears, and the pulse strength is mainly determined by the intravascular pressure. According to Formula (21), the intravascular pressure at this time is mainly affected by the blood flow, vessel radius and blood viscosity coefficient. To verify the positive correlation between blood viscosity and pulse strength, this paper simulates the changes in intravascular pressure under different blood viscosity coefficients, and the results are shown in Figure 5.
As shown in Figure 5 and Table 3, the simulation results showed that the intravascular pressure increases with the increase in the blood viscosity coefficient. The theory that the pulse strength increases with the increase in the blood viscosity coefficient is verified.

3.2. Human Validation Experiments

To verify the applicability of the model, the radial pulse P-S curve of healthy subjects was collected and extracted. We analyzed the correlation between the actual human P-S curve trend and the theoretical model, and discussed the relationship between the P-S curve and BMI of different samples.

3.2.1. Data Sources

In this study, a total of 69 healthy volunteers from our laboratory team participated in the data collection process, the basic physiological parameters of the subjects are shown in Table 4. During the experiment, each participant fully understood the research content of the project and volunteered to participate in the data collection. The data acquisition equipment is a pulse diagnosis instrument independently developed by our laboratory. The equipment can accurately and objectively collect the pulse wave after experimental verification [18], which adopts the wristband balloon pressurization method to step up the radial artery of the human wrist. The number of pressurization is 14 times, the single pressurization pressure maintenance time is 10 s, and the instrument sampling frequency is 225 Hz. The sensor probe adopts a composite structure, which can record static pressure and pulse strength at the same time, corresponding to the finger pressure and finger feeling in the clinical pulse diagnosis process. The specific inclusion criteria for the sample are as follows:
  • Good physical condition and no cold symptoms;
  • No chronic diseases or genetic diseases;
  • No malformation or injury of the radial artery;
  • No heart bypass.

3.2.2. P-S Curve Acquisition

To accurately obtain the relationship between pulse pressure and strength of the original signal waveform and obtain the P-S curve of the sample, the original signal is processed through the following four steps:
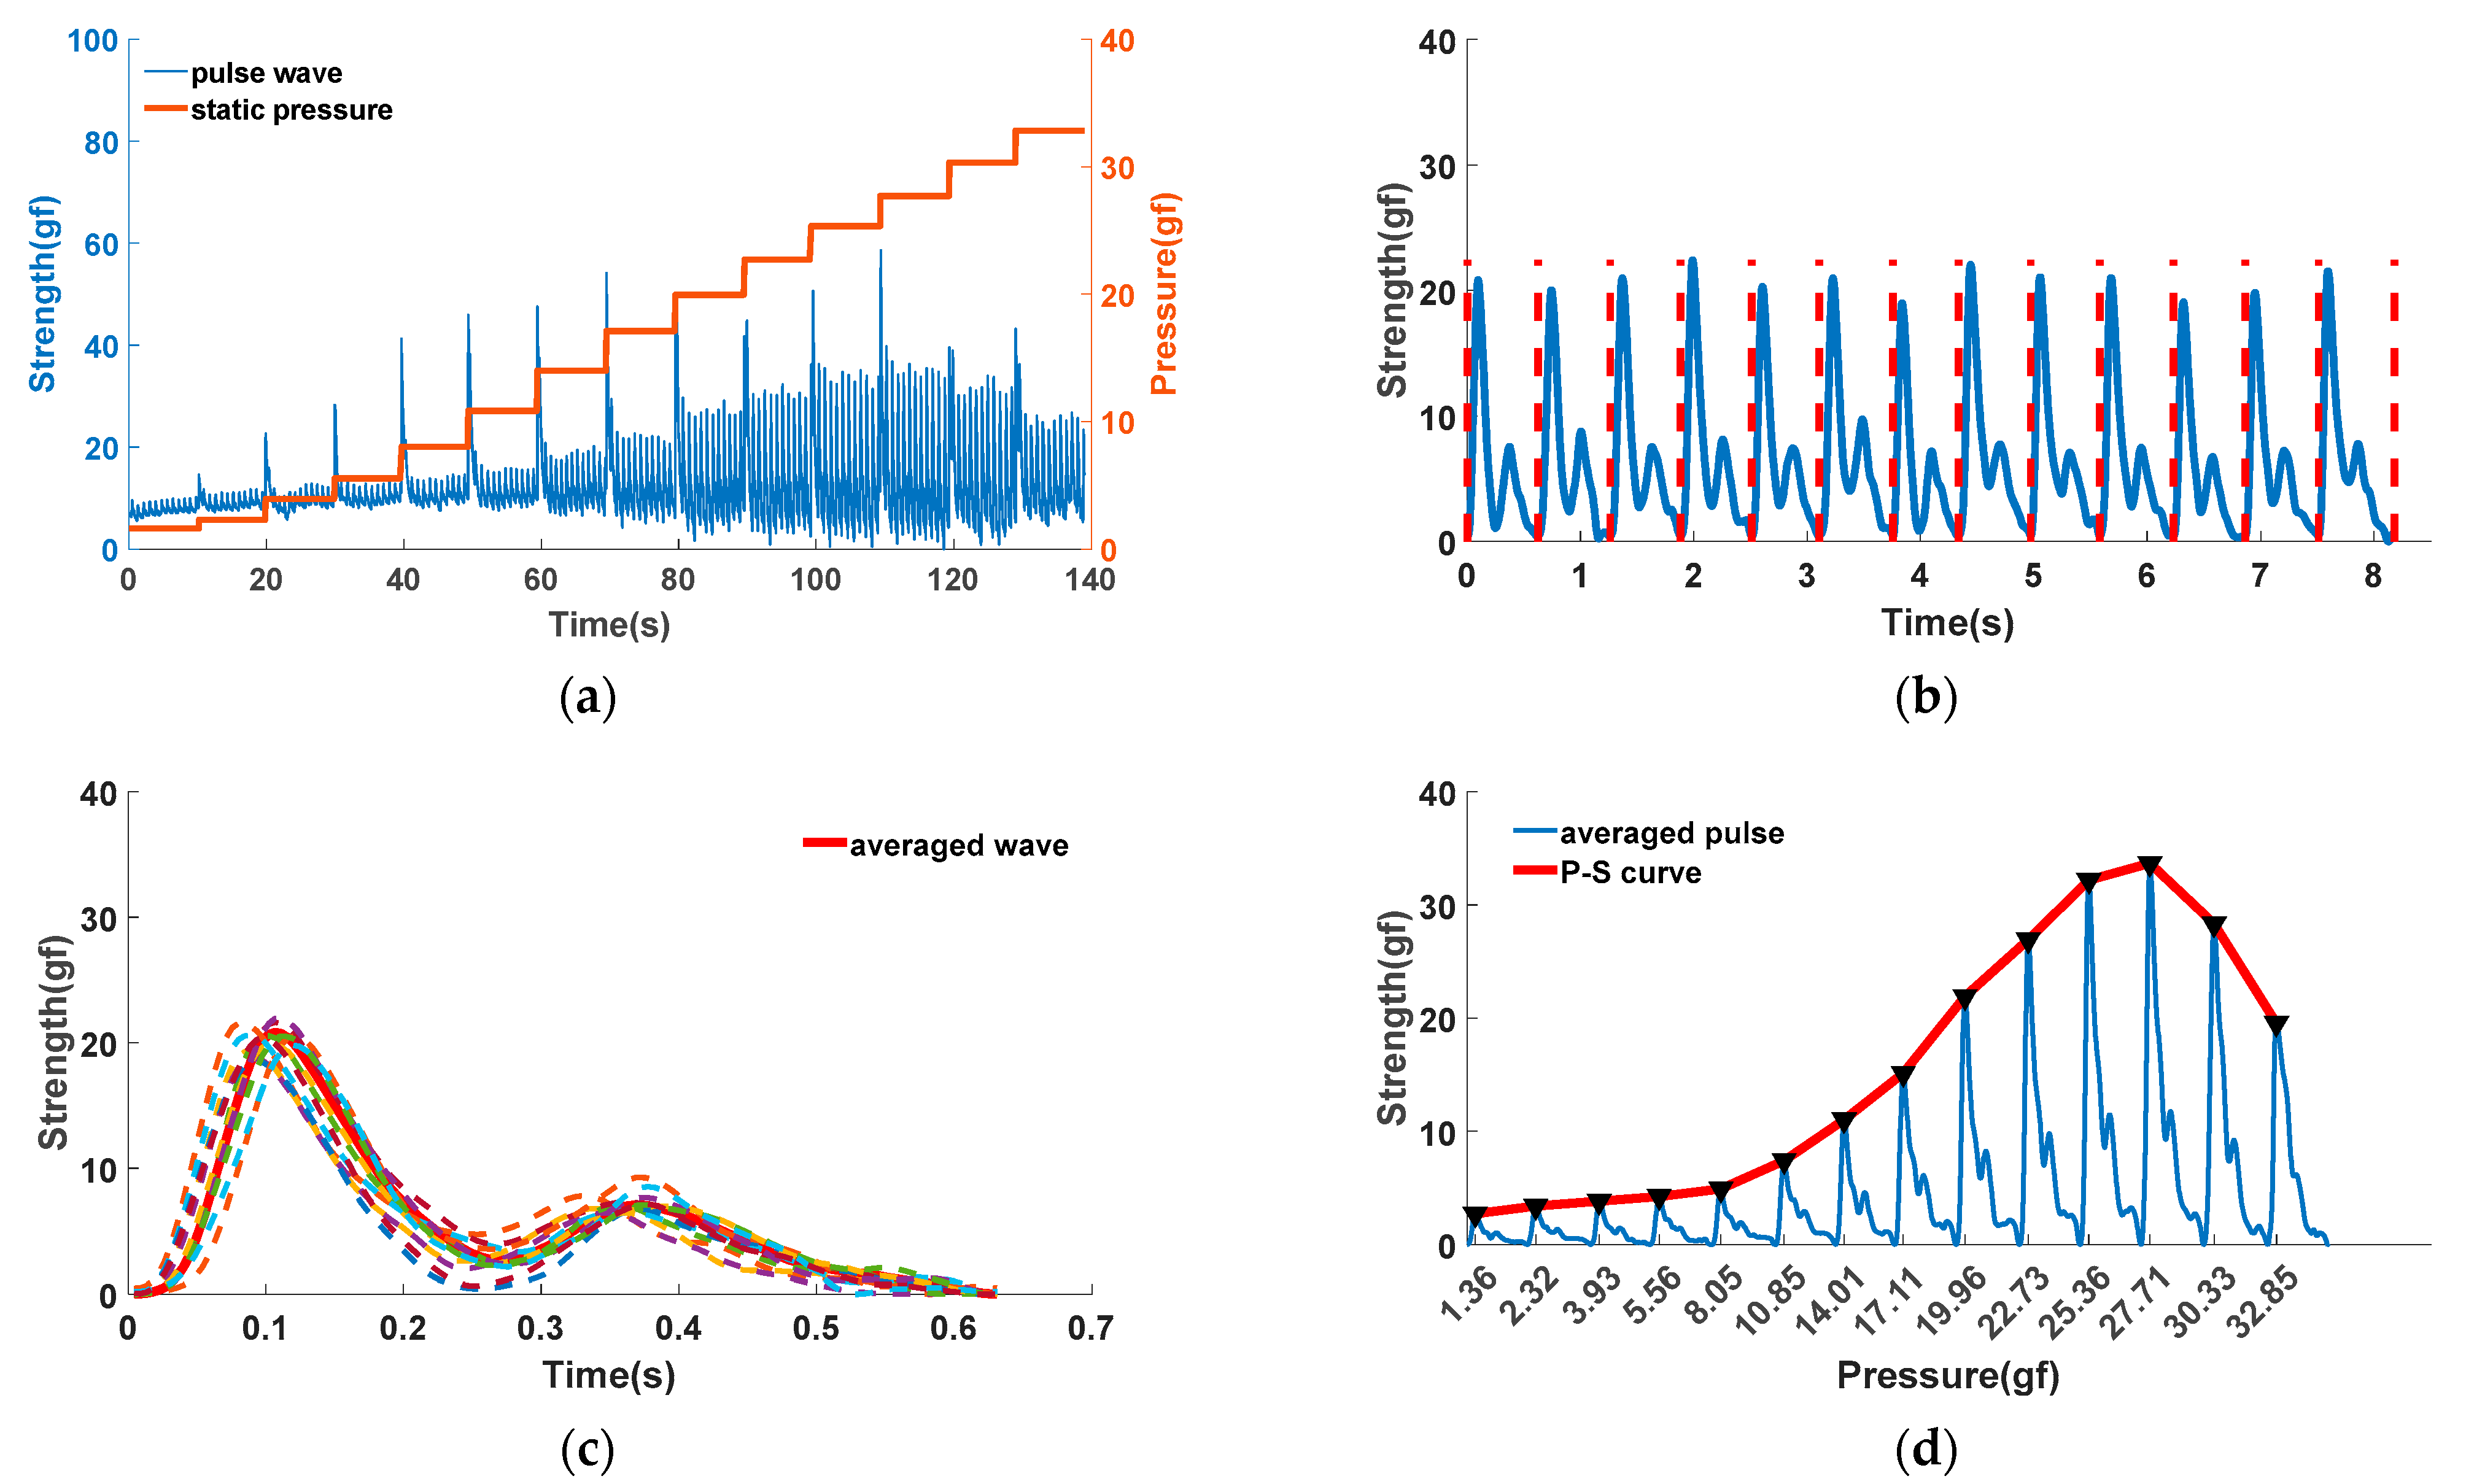
  • Based on the wavelet filtering algorithm and bandpass filtering algorithm, the noise interference caused by motion, environment and power frequency is eliminated, As shown in Figure 6a;
  • Based on the principle of cardiac cycle similarity, the pulse signal under each pressure segment is divided into a single cycle, and a set of single-cycle pulse wave signals is obtained, as shown in Figure 6b;
  • Based on the cubic spline interpolation method, the pulse wave under the same pressure is partitioned by their cycles. Then, pulse waves are interpolated into a group of waveforms with the same cycle, and averaged these reorganized waveforms in the time domain. In this way, we obtained a representative waveform of a single cycle, as shown in Figure 6c;
  • Based on the stepped pressurization method, the pulse strength envelope under the continuous pressure sequence is extracted, that is, the pulse P-S curve, as shown in Figure 6d.
The raw signal processing is shown in Figure 6.

3.2.3. P-S Curve Analysis

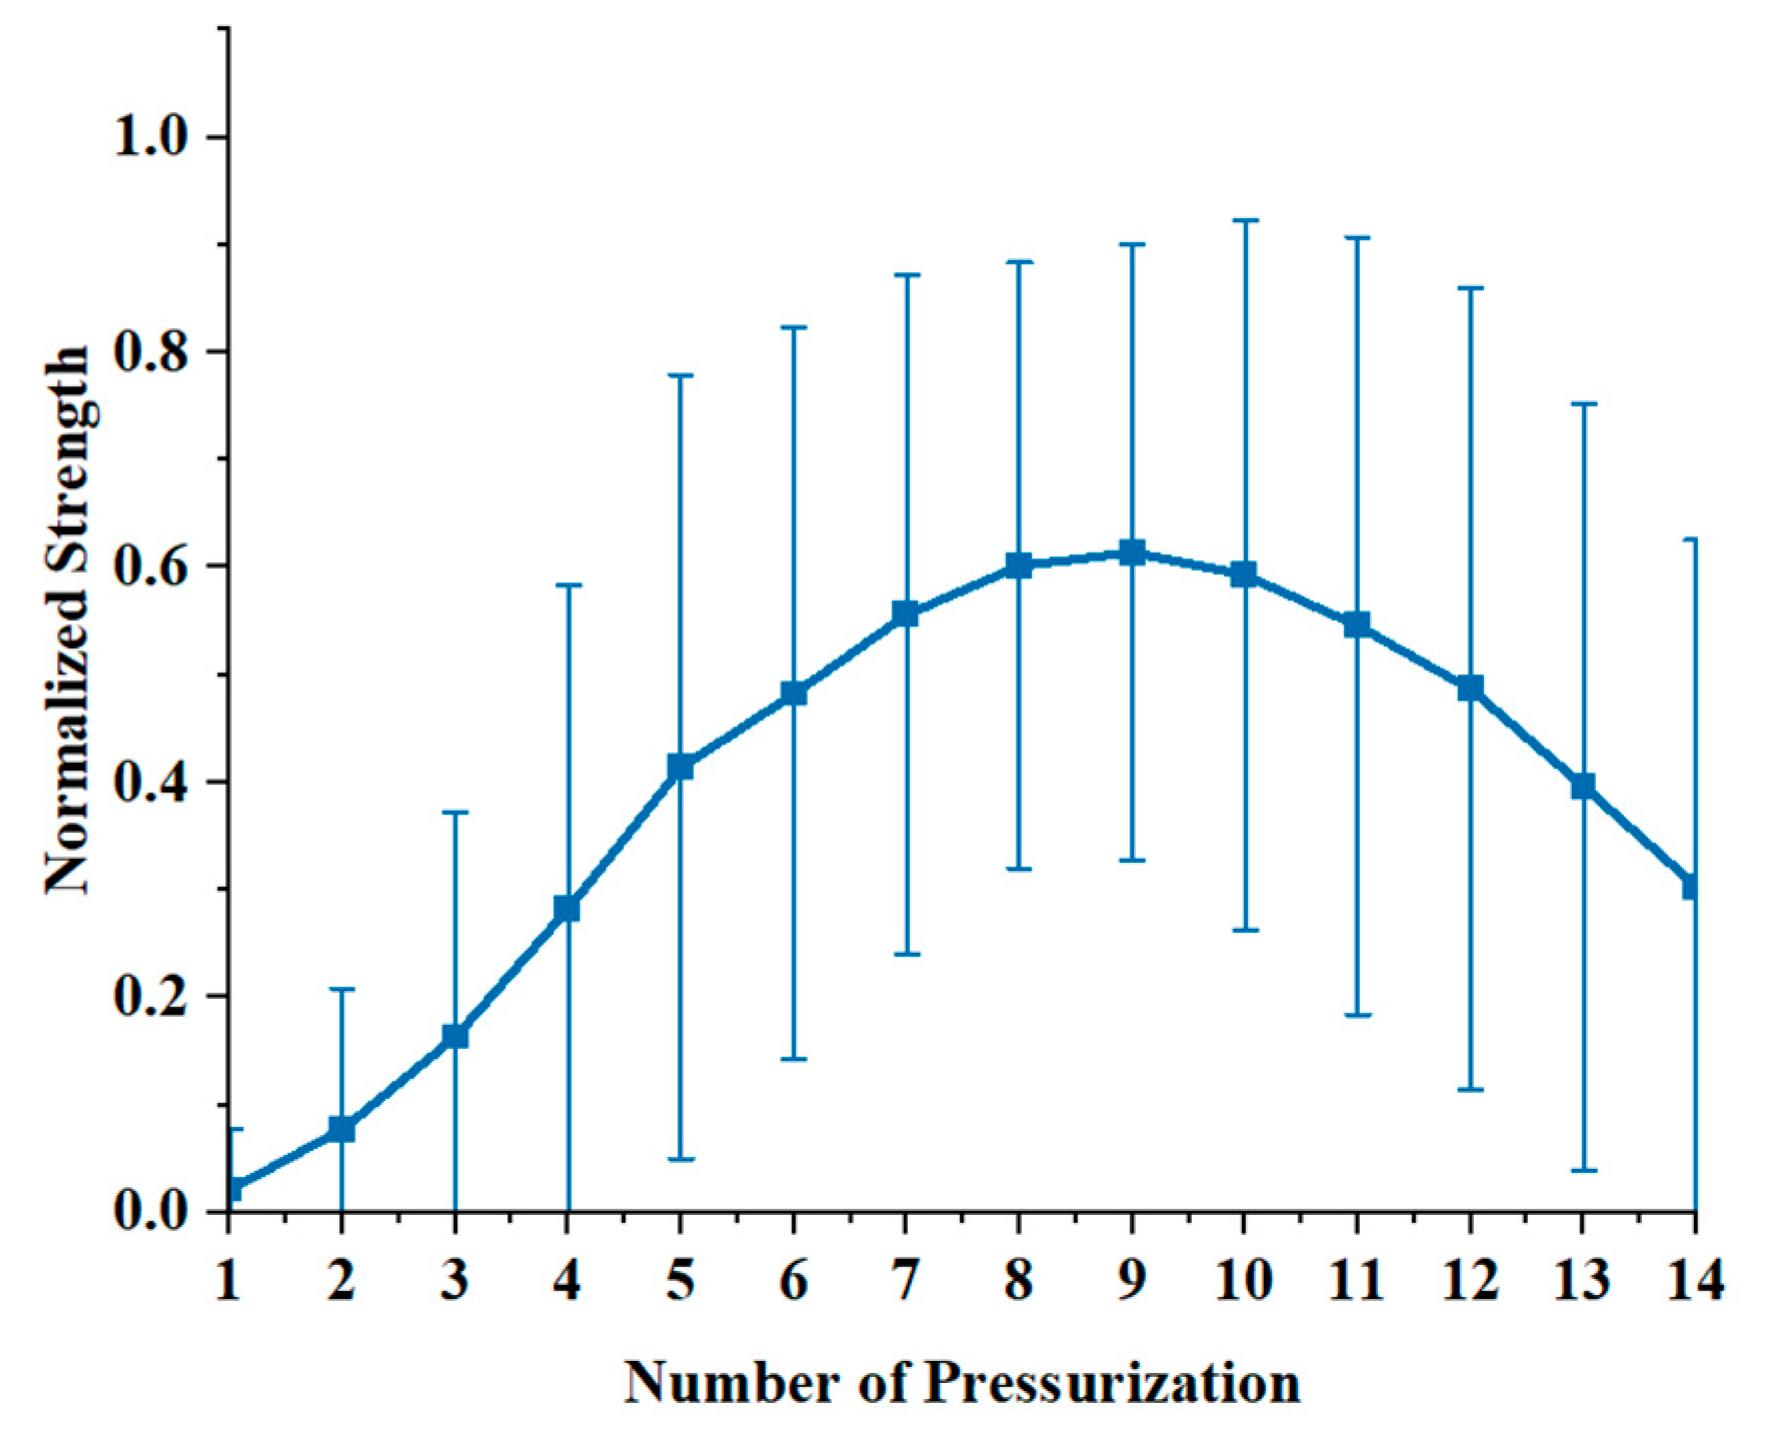
By using the method mentioned above, the P-S curve of the radial artery was extracted from 69 healthy samples, and the mean and standard deviation of pulse strength of the sample population were calculated under the same number of pressurizations. The P-S curve trend chart of 69 healthy samples was drawn with the number of times of pressurization as the abscissa and the normalized pulse strength as the ordinate. The results are shown in Figure 7.
The experimental results in Figure 7 demonstrated that when the number of pressurizations increases from 1 to 9, the average pulse strength gradually increases, with an increment Δ S = 0.59 . When the number of pressurizations reaches 9, the average pulse strength reaches the maximum. When the number of pressurizations increases from 9 to 14, the pulse strength gradually decreases, with an increment Δ S = 0.32 . Therefore, the pulse P-S curve of the healthy sample population generally shows a trend of increasing first and then decreasing. However, due to the small number of samples, and the fact that the maximum strength and position of the P-S curve vary from person to person, the standard deviation of the pulse strength of the group pulse P-S curve at the same number of pressurizations is large. According to the simulation results in Table 2, as P e gradually increases to equal to P , the stress increment of blood vessel wall is Δ τ = 32.10   kPa , but the increment of intravascular pressure is small, so the pulse strength gradually increases. When the vessel wall stress is close to zero, the pulse strength reaches the maximum, and as P e continues to increase, the flow rate also increases, which leads to the increment in intravascular pressure drop and Δ P = 14   Pa , so the pulse strength gradually decreases. According to Formulas (21)–(24), when P e < P , the pulse strength gradually increased with the increase in P e . When P e = P , the pulse strength reaches the maximum, and the maximum pulse strength is mainly affected by blood flow, vessel radius and the blood viscosity coefficient. When P e continues to increase to P e > P , the internal pressure of blood vessel decreases, leading to the decrease in pulse strength. In conclusion, the experimental and simulation results are consistent with the theoretical model proposed in this paper.
To verify the relationship between blood viscosity and pulse strength, this study divided 69 samples into 3 categories according to the BMI (body mass index) and explored the influence of the BMI on the pulse strength. Then, the theoretical model verified that the pulse strength is positively correlated with the blood viscosity coefficient. Specifically, according to the Chinese BMI classification standard, the 69 samples are divided into the following 3 categories:
  • Lean weight, BMI < = 18.5;
  • Moderate weight, 18.5 < BMI < = 23.9;
  • Overweight, BMI > 23.9.
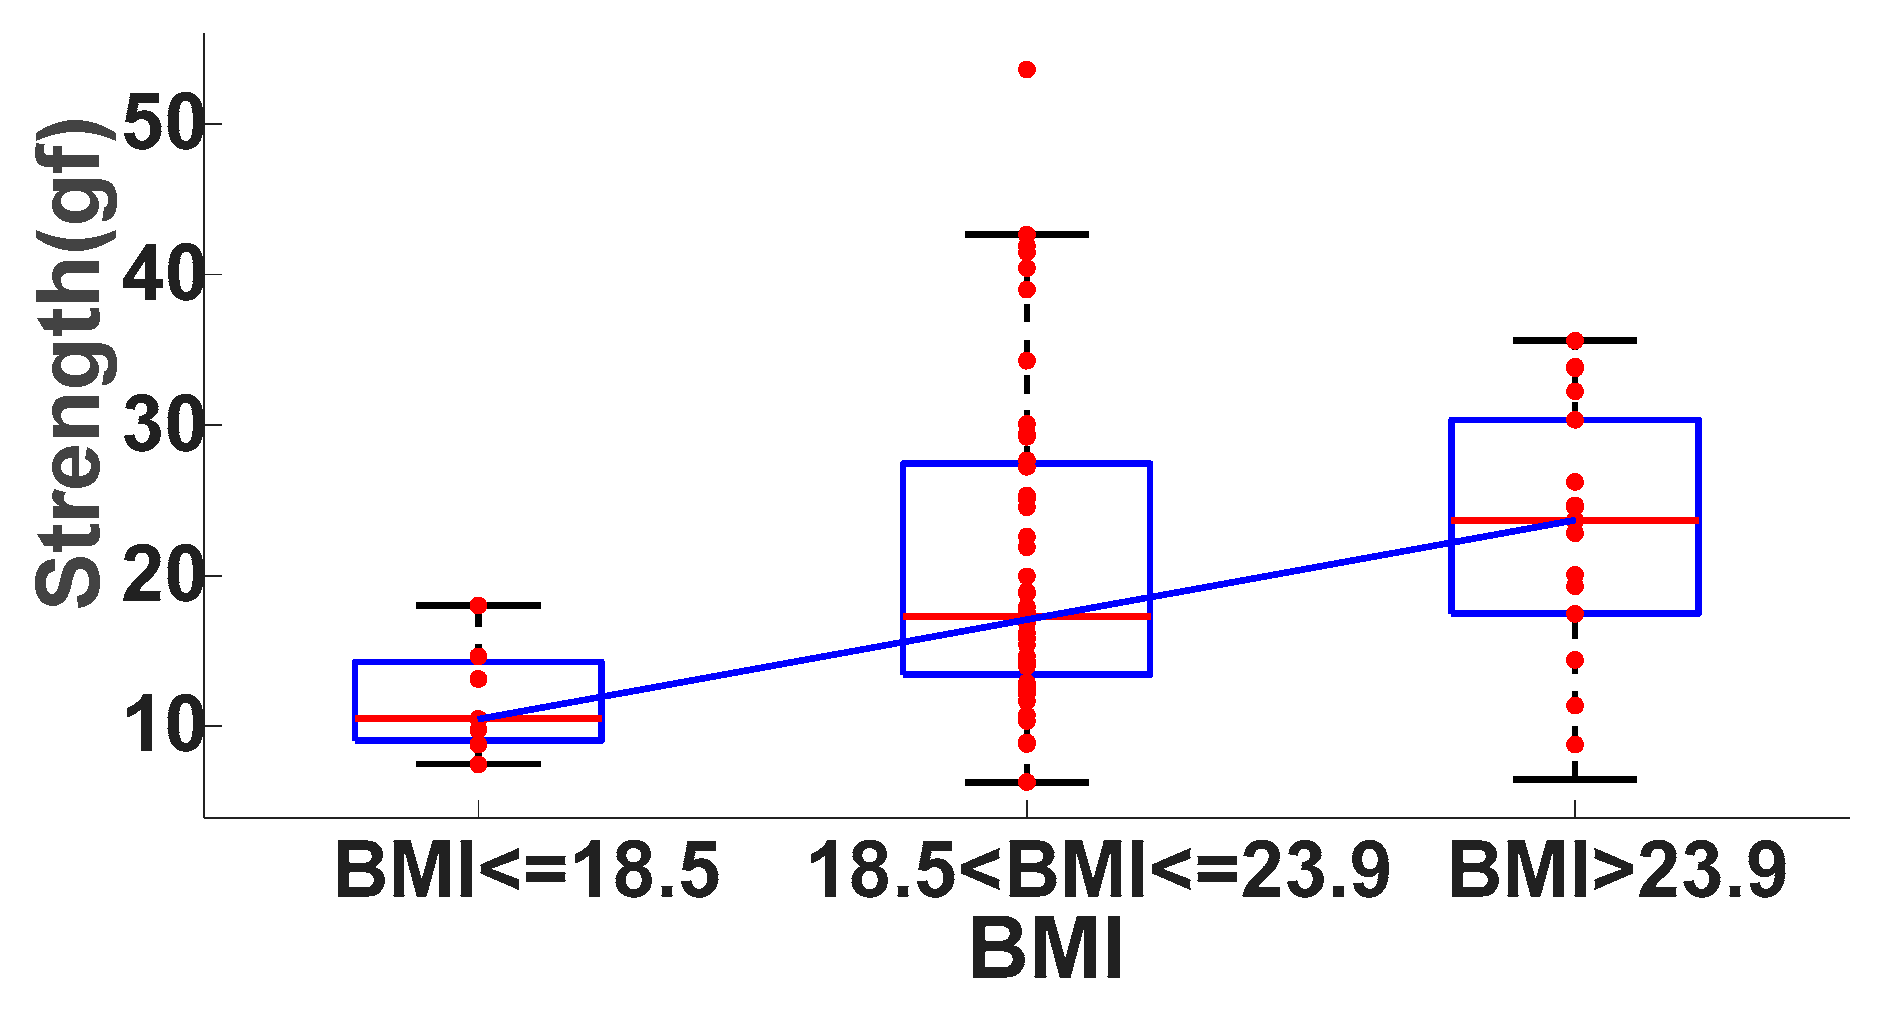
The positions of the peak points of the P-S curves of the three groups of people were extracted, and the pulse strength values of the samples were obtained, and the statistical figure shown in Figure 8 and the statistical tables shown in Table 5 were obtained.
It can be observed from Figure 8 that by drawing the statistical box graph of the pulse strength of the three groups of people, the change trend of the pulse strength of the three groups of people with BMI is fitted. And, the mean value and variance in the pulse strength of the three groups of people are calculated, as shown in Table 5. The above data statistics results all demonstrate that the pulse strength is positively correlated with BMI. At the same time, by analyzing the relationship between BMI and hemorheology, Rosito GA, Seki K and Ercan M [28,29,30] found that there was a significant positive correlation between BMI and blood viscosity. In other words, there was a positive correlation between pulse strength and blood viscosity. So, the experimental results conform to the simulation results and the theoretical model established in this paper.

4. Discussion

Pulse waves contain rich human physiological and pathological information and can be used to diagnose diseases [31,32]. However, there are some shortcomings in the existing methods, that is, they focus on the pulse shape of the strongest point of the pulse wave and its formation mechanism, and there is no accurate study of the change trend of pulse strength with pressure and its formation mechanism. Therefore, based on the radial vibration theory of the vascular wall, a theoretical model of the pulse P-S curve formation mechanism is established, the relationship between pulse strength and extravascular pressure is analyzed, and the mechanical relationship between P > P e , P = P e and P < P e is simulated by using COMSOL software, and the actual human pulse P-S curve data are extracted and analyzed, which verifies the accuracy and applicability of the theoretical method.
Specifically, in terms of model establishment, firstly, assuming that the blood vessels are uniform long straight tubes, the blood movement equation in the normal human pulsation process is established, and the relationship between the radial flow rate of blood and the axial flow rate is analyzed. Secondly, according to the fluid–structure interaction between blood movement and the vascular wall, the stress change in the blood vessel wall during blood movement was analyzed. Finally, according to the theory of vascular wall elasticity, the changes in vascular wall stress, blood flow speed and intravascular pressure under the action of vascular wall extravascular pressure are analyzed, and the relationship between the above force and pulse strength is established. In terms of experimental results, this paper uses the bionic parameters of the radial artery of the human body, and uses COMSOL software to simulate the changes in vascular wall stress, blood flow velocity and intravascular pressure under the deformation of extravascular pressure, and found that the change trend of vessel wall stress and intravascular pressure conforms to the theoretical model established in this paper, which verified the accuracy of the theoretical model. At the same time, the pulse data of 69 healthy samples are collected. It was found that the pulse P-S curve of the healthy population showed a trend of first increasing and then decreasing with the increase in number of pressurizations. This was consistent with the theoretical model proposed in this paper that demonstrated that the pulse strength first increased and then decreased with the increase in extravascular pressure, which verified the applicability of the theoretical model.
However, in the actual situation, there are many factors that affect the physiological parameters of the pulse of the sample, such as environment, region, temperature, physique, sex, age, etc. These objective factors will eventually be reflected in the changes in cardiovascular physiological parameters. The experimental results found that there are differences in the pulse P-S curve of the individual samples that were extracted, mainly reflected in the difference in pulse strength. According to the theoretical model established in this paper, when the intravascular pressure and extravascular pressure reach equilibrium, the pulse strength is mainly related to blood flow, blood viscosity coefficient and blood vessel radius. Rosito GA, Seki K and Ercan M [28,29,30] showed that the blood viscosity is positively correlated with BMI, so this paper divides 69 healthy samples into 3 categories based on BMI. The pulse strength of three groups of people is counted, and the results show that the median pulse strength of the group with a BMI <= 18.5 is 10.5 gf, and the mean ± variance is 11.7 ± 3.7 gf, 18.5, the median pulse strength of the group with 18.5 < BMI <= 23.9 is 17.3 gf, the mean ± variance is 21.3 ± 11.0 gf, the median pulse strength of the group with a BMI > 23.9 is 23.7 gf, and the mean ± variance is 22.7 ± 8.7 gf. The above data reflect that BMI is positively correlated with pulse strength, which in turn shows that the blood viscosity coefficient is positively correlated with pulse strength, and the rationality of the theoretical model is explained. The applicability of the theoretical model was further verified.
In the future work, we will analyze the influence of radial artery flow and radius on the pulse P-S curve on the basis of the above pulse P-S curve theoretical analysis method. We will collect radial pulse data of specific disease populations, and analyze the difference between the pulse P-S curve of specific disease populations and healthy people. We also believe that this work is very helpful in promoting the development of the pulse wave diagnosis disease field.

5. Conclusions

Pulse waves contain rich physiological and pathological information about the human body. In clinical practice, the physiological signal at the time of maximum pulse strength is often found through the pulse P-S curve for disease diagnosis, but the formation mechanism of the P-S curve has not been accurately studied. To solve this problem, this paper proposed a P-S curve modeling method of the radial artery based on the radial vibration of the vascular wall and analyzed the blood movement of healthy human arteries under the continuous change in intravascular pressure and the force on the vascular wall. We also established a theoretical model of pulse strength that changed with extravascular pressure. To verify the accuracy and applicability of the model, the changes in vascular stress, blood flow velocity and intravascular pressure during the process of vessel deformation were simulated. The corresponding relationship between the pulse strength and the three parameters was analyzed. The P-S curve of 69 healthy volunteers under the continuous pressure sequence of the radial artery was extracted, and the difference in pulse strength was analyzed from the perspective of BMI. The results show that the simulation experiment and human data collection and analysis results conform to the theoretical model established in this paper, which indicates that this model can help clinicians to diagnose the health status of patients to a certain extent.

Author Contributions

Conceptualization, G.W., X.G. and H.Z.; methodology, G.W.; software, G.W. and X.G.; data collection, G.W., X.G. and X.K.; data analysis, G.W.; writing—original draft preparation, G.W.; writing—review and editing, G.W., X.G. and X.K.; final approval, G.W., X.G., X.K., Y.Z., J.Z. and H.Z. All authors have read and agreed to the published version of the manuscript.

Funding

This research was funded by the Key Research Program of the Chinese Academy of Sciences, grant no. ZDRW-ZS-2021-1.

Institutional Review Board Statement

Ethical review and approval were waived for this study, due to the research we conducted was only to collect pulse wave signals on the surface of the body. It did not cause any physiological harm to the volunteers and did not involve the privacy of the volunteers.

Informed Consent Statement

Informed consent was obtained from all subjects involved in the study.

Data Availability Statement

The raw/processed data required to reproduce these findings cannot be shared at this time, as the data also form part of an ongoing study.

Conflicts of Interest

There is no conflict of interest among the authors.

References

  1. Guyton, A.C.; Hall, J.E. Textbook of Medical Physiology, 11th ed.; xxxv; Elsevier Saunders: Philadelphia, PA, USA, 2006; 1116p. [Google Scholar]
  2. Hall, J.E. Guyton and Hall Textbook of Medical Physiology, 13th ed.; xix; Elsevier: Philadelphia, PA, USA, 2016; 1145p. [Google Scholar]
  3. Zhao, Y.C.; Vatankhah, P.; Goh, T.; Michelis, R.; Kyanian, K.; Zhang, Y.; Li, Z.; Ju, L.A. Hemodynamic analysis for stenosis microfluidic model of thrombosis with refined computational fluid dynamics simulation. Sci. Rep. 2021, 11, 6875. [Google Scholar] [CrossRef] [PubMed]
  4. Nichols, W.W. Clinical measurement of arterial stiffness obtained from noninvasive pressure waveforms. Am. J. Hypertens. 2005, 18, 3S–10S. [Google Scholar] [CrossRef] [PubMed]
  5. Ferreira, A.D.; Lopes, A.J. Pulse waveform analysis as a bridge between pulse examination in Chinese medicine and cardiology. Chin. J. Integr. Med. 2013, 19, 307–314. [Google Scholar] [CrossRef] [PubMed]
  6. Kim, J.; Bae, J.H.; Ku, B.; Yim, M.H.; Ang, L.; Kim, H.; Jeon, Y.J. A comparative study of the radial pulse between primary dysmenorrhea patients and healthy subjects during the menstrual phase. Sci. Rep. 2019, 9, 9716. [Google Scholar] [CrossRef] [PubMed]
  7. Liao, K.M.; Chang, C.W.; Wang, S.H.; Chang, Y.T.; Chen, Y.C.; Wang, G.C. The first harmonic of radial pulse wave predicts major adverse cardiovascular and microvascular events in patients with type 2 diabetes. J. Diabetes Complicat. 2019, 33, 107420. [Google Scholar] [CrossRef]
  8. Xu, K.; Butlin, M.; Avolio, A.P. Effects of pressure-dependent segmental arterial compliance and postural changes on pulse wave transmission in an arterial model of the human upper limb. In Proceedings of the 011 Annual International Conference of the IEEE Engineering in Medicine and Biology Society, Boston, MA, USA, 30 August–3 September 2011; pp. 6450–6453. [Google Scholar]
  9. Ribeiro de Moura, N.G.; Cordovil, I.; de Sá Ferreira, A. Traditional Chinese medicine wrist pulse-taking is associated with pulse waveform analysis and hemodynamics in hypertension. J. Integr. Med. 2016, 14, 100–113. [Google Scholar] [CrossRef]
  10. O’Rourke, M.F. Time domain analysis of the arterial pulse in clinical medicine. Med. Biol. Eng. Comput. 2009, 47, 119–129. [Google Scholar] [CrossRef]
  11. Wang, J.J.; Parker, K.H. Wave propagation in a model of the arterial circulation. J. Biomech. 2004, 37, 457–470. [Google Scholar] [CrossRef]
  12. Stergiopulos, N.; Westerhof, B.E.; Westerhof, N. Total arterial inertance as the fourth element of the windkessel model. Am. J. Physiol.-Heart C 1999, 276, H81–H88. [Google Scholar] [CrossRef]
  13. Yoon, Y.Z.; Lee, M.H.; Soh, K.S. Pulse type classification by varying contact pressure. IEEE Eng. Med. Biol. Mag. 2000, 19, 106–110. [Google Scholar]
  14. Wei, C.C. An innovative method to measure the peripheral arterial elasticity: Spring constant modeling based on the arterial pressure wave with radial vibration. Ann. Biomed. Eng. 2011, 39, 2695–2705. [Google Scholar] [CrossRef] [PubMed]
  15. Lin Wang, Y.-Y.; Chiu, W.-B.; Jan, M.-Y.; Bau, J.-G.; Li, S.-P.; Wang, W.-K. Analysis of transverse wave as a propagation mode for the pressure pulse in large arteries. J. Appl. Phys. 2007, 102, 064702. [Google Scholar] [CrossRef]
  16. Alastruey, J. On the mechanics underlying the reservoir-excess separation in systemic arteries and their implications for pulse wave analysis. Cardiovasc. Eng. 2010, 10, 176–189. [Google Scholar] [CrossRef] [PubMed]
  17. Yoo, S.K.; Shin, K.Y.; Lee, T.B.; Jin, S.O. New pulse wave measurement method using different hold-down wrist pressures according to individual patient characteristics. Springerplus 2013, 2, 406. [Google Scholar] [CrossRef] [PubMed]
  18. Geng, X.; Liu, S.; Zhang, Y.; Zhang, S.; Hou, J.; Zhang, J.; Asif, M.; Zhang, H.-Y. Adjacent Channel Interference Modeling of Single Vibration Point on Multichannel Dynamic Pressure Sensors. J. Sens. 2020, 2020, 1–8. [Google Scholar] [CrossRef]
  19. Geng, X.; Liu, S.; Zhang, Y.; Hou, J.; Zhang, S.; Zhang, J.; Zhang, H. A Noncontact Method for Locating Radial Artery above Radial Styloid Process in Thermal Image. Evid. Based Complement. Altern. Med. 2020, 2020, 4057154. [Google Scholar] [CrossRef]
  20. Chen, C.; Li, Z.; Zhang, Y.; Zhang, S.; Hou, J.; Zhang, H. A 3D Wrist Pulse Signal Acquisition System for Width Information of Pulse Wave. Sensors 2019, 20, 11. [Google Scholar] [CrossRef]
  21. Coccarelli, A.; Carson, J.M.; Aggarwal, A.; Pant, S. A framework for incorporating 3D hyperelastic vascular wall models in 1D blood flow simulations. Biomech. Model. Mechanobiol. 2021, 20, 1231–1249. [Google Scholar] [CrossRef]
  22. Kim, H.J.; Vignon-Clementel, I.E.; Coogan, J.S.; Figueroa, C.A.; Jansen, K.E.; Taylor, C.A. Patient-specific modeling of blood flow and pressure in human coronary arteries. Ann. Biomed. Eng. 2010, 38, 3195–3209. [Google Scholar] [CrossRef]
  23. Razavi, A.; Shirani, E.; Sadeghi, M.R. Numerical simulation of blood pulsatile flow in a stenosed carotid artery using different rheological models. J. Biomech. 2011, 44, 2021–2030. [Google Scholar] [CrossRef]
  24. Secomb, T.W. Hemodynamics. Compr. Physiol. 2016, 6, 975–1003. [Google Scholar] [CrossRef] [PubMed] [Green Version]
  25. Sriram, K.; Intaglietta, M.; Tartakovsky, D.M. Non-Newtonian flow of blood in arterioles: Consequences for wall shear stress measurements. Microcirculation 2014, 21, 628–639. [Google Scholar] [CrossRef] [PubMed]
  26. Rosenson, R.S.; McCormick, A.; Uretz, E.F. Distribution of blood viscosity values and biochemical correlates in healthy adults. Clin. Chem. 1996, 42, 1189–1195. [Google Scholar] [CrossRef]
  27. Sandeep, S.; Shine, S.R. Effect of stenosis and dilatation on the hemodynamic parameters associated with left coronary artery. Comput. Methods Programs Biomed. 2021, 204, 106052. [Google Scholar] [CrossRef]
  28. Rosito, G.A.; D’Agostino, R.B.; Massaro, J.; Lipinska, L.; Mittleman, M.A.; Sutherland, P.; Wilson, P.W.F.; Levy, D.; Muller, J.E.; Tofler, G.H. Association between obesity and a prothrombotic state: The Framingham Offspring Study. Thromb. Haemost. 2004, 91, 683–689. [Google Scholar] [CrossRef] [PubMed]
  29. Seki, K.; Sumino, H.; Nara, M.; Ishiyama, N.; Nishino, M.; Murakami, M. Relationships between blood rheology and age, body mass index, blood cell count, fibrinogen, and lipids in healthy subjects. Clin. Hemorheol. Microcirc. 2006, 34, 401–410. [Google Scholar]
  30. Ercan, M.; Konukoglu, D. Role of plasma viscosity and plasma homocysteine level on hyperinsulinemic obese female subjects. Clin. Hemorheol. Microcirc. 2008, 38, 227–234. [Google Scholar] [PubMed]
  31. Korpas, D.; Halek, J.; Dolezal, L. Parameters describing the pulse wave. Physiol. Res. 2009, 58, 473–479. [Google Scholar] [CrossRef]
  32. Parittotokkaporn, S.; de Castro, D.; Lowe, A.; Pylypchuk, R. Carotid Pulse Wave Analysis: Future Direction of Hemodynamic and Cardiovascular Risk Assessment. JMA J. 2021, 4, 119–128. [Google Scholar] [CrossRef]
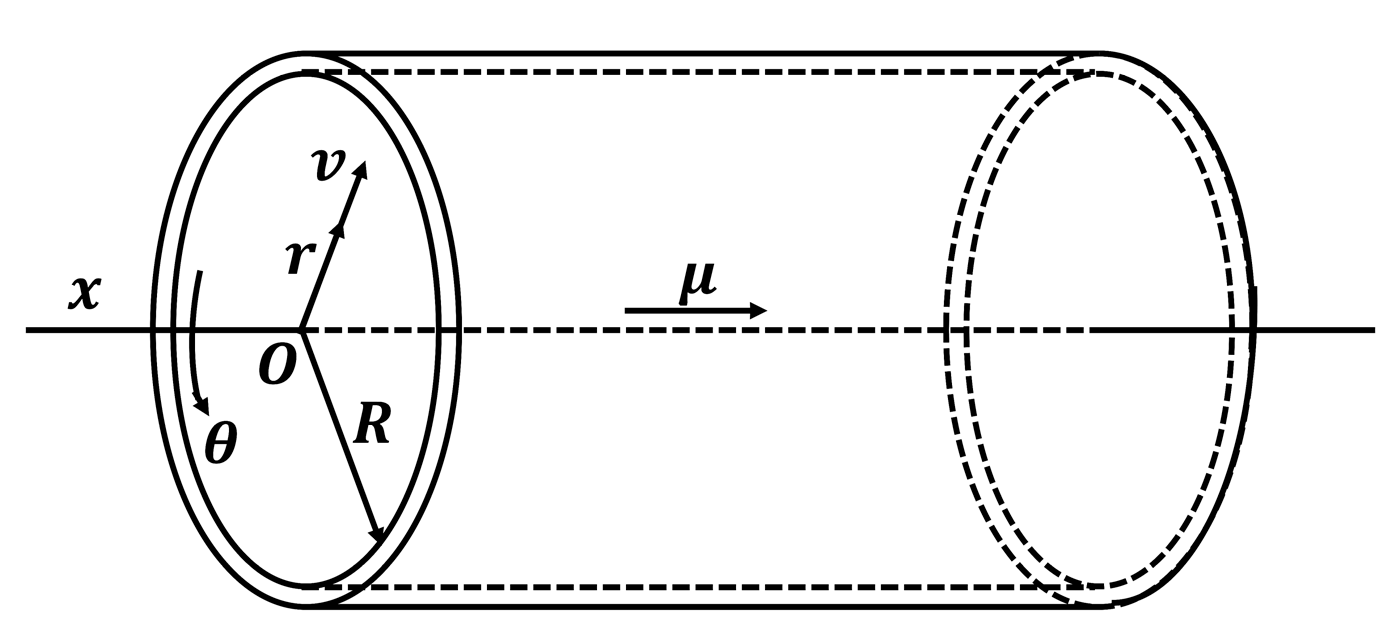
Figure 1. Vascular model.
Applsci 12 09706 g001
Figure 2. Micro element force model of blood vessel wall.
Applsci 12 09706 g002
Figure 3. Vascular collapse model.
Applsci 12 09706 g003
Figure 4. Simulation results of vascular wall stress, blood flow rate, and intravascular pressure under different pressure conditions of blood vessel. (ac) Simulation results of vascular wall stress changes in P > P e , P = P e , P < P e . (df) Simulation results of blood flow velocity changes in P > P e , P = P e , P < P e . (gi) Simulation results of intravascular pressure changes in P > P e , P = P e , P < P e .
Applsci 12 09706 g004
Figure 5. Simulation results of intravascular pressure under different blood viscosity at P = P e : (a) Simulation results of intravascular pressure when blood viscosity is η = 0.5 η . (b) Simulation results of intravascular pressure when blood viscosity is η = η . (c) Simulation results of intravascular pressure when blood viscosity is η = 1.5 η .
Applsci 12 09706 g005
Figure 6. Pulse P-S curve acquisition process: (a) raw pulse signal; (b) the original signal period division, the red dotted line is the initial boundary of the pulse cycle, and the blue solid line is the actual single cycle pulse waveform; (c) time domain averaging of single-period signals, the dotted lines with different colors are the single cycle pulse wave after dividing the cycle, and the solid red lines are the pulse wave after time domain average; (d) full pressure segment pulse strength envelope.
Applsci 12 09706 g006
Figure 7. Number of pressurizations–normalized strength curve.
Applsci 12 09706 g007
Figure 8. BMI–pulse strength statistics.
Applsci 12 09706 g008
Table 1. Hemodynamic model simulation parameters [26,27].
Parameter (Unit)Value
R (m) 2 × 10 3
h (m) 1.5 × 10 4
σ 4.95 × 10 1
E (Pa) 9.65 × 10 5
η (Pa · s ) 5 × 10 3
r h o   ( kg / m 3 ) 1.06 × 10 3
P o u t (Pa)0
v i n ( m / s ) 2 × 10 1
L 1 (m) 1 × 10 2
L2 (m) 1 × 10 2
L3 (m) 1 × 10 1
Table 2. Simulation parameters of vascular wall stress, blood flow velocity, and intravascular pressure under different pressure conditions.
Pressure RelationshipStress (kPa) Velocity   ( m / s ) Intravascular
Pressure (Pa)
P > P e 32.570.28319
P = P e 0.470.30316
P < P e 45.840.37302
Table 3. Simulation results of intravascular pressure under different viscosity coefficients.
Pressure RelationshipViscosity Coefficient (Pa∙s)Intravascular
Pressure (Pa)
0.5 η 157
P = P e η 316
1.5 η 474
Table 4. Table of basic physiological parameters for subjects.
Characteristic (Unit)Number or Mean ± SD
Number (n)69
Age (year)27.5   ±   4.9
Weight (kg)66.2   ±   13.4
BMI (kg/m2)23.6   ±   1 .2
BP–diastolic (mmHg)69.4   ±   9.6
BP–systolic (mmHg) 115.0   ±   12.5
T-body (°C)36.8   ±   0.3
T-ambient (°C)23.6   ±   1.2
SaO297.8   ±   0.8
HR (times/minute)71.6   ±   10.3
Table 5. BMI–pulse strength parameter statistical table.
GroupBMINumber (n)Strength (gf)
Lean weight17.6 ± 0.6711.7 ± 3.7
Moderate weight21.4 ± 1.54421.3 ± 11.0
Overweight26.2 ± 3.81822.7 ± 8.7
Publisher’s Note: MDPI stays neutral with regard to jurisdictional claims in published maps and institutional affiliations.