1. Introduction
Cargo inspection systems have been developed in the security area using various radiation sources, such as radioactive materials [
1], electron linear accelerators [
2], and neutron generators [
3]. Their high penetration power is important for examining the inner container without opening the gate [
4]. The first cargo inspection system was developed using a gamma-ray source for the cargo inspection of the carrier and container. The gamma-ray inspection system detects metallic weapons such as guns [
5], knives [
6], and bombs [
7]. Non-invasive measurements that use gamma-rays are convenient and safe for cargo users as much as for criminal investigators. However, gamma-ray systems are limited in detecting objects made of low-density materials, such as drugs or plastic explosives. Neutron sources have been used to analyze low-density materials in the fields of physics [
8], nuclear sciences [
9], and the battery industries [
10]. Neutrons with high energies of several mega-electron volts have a higher penetrating power, similar to gamma-rays. Therefore, the combined use of a gamma-ray and neutrons provides a powerful effect to extend the material discrimination.
Neutrons and gamma-rays each have their advantages and disadvantages for inspecting cargo, but combining them into one system compensates for these shortcomings. Recently, a cargo inspection system using a Deuterium-Tritium (D-T) neutron generator and Co-60 irradiators was developed by the Australia group in China [
3], and it can differentiate 16 materials. The D-T generator radiates neutrons with an energy of 14.1 MeV in all directions (4π), using a fusion reaction with deuterium and tritium. The Co-60 emits characteristic gamma-rays of 1.2 and 1.3 MeV, which are lighter and smaller than electronically generated gamma-rays. However, the radioactive matter has a limited use time and low dose rates. A gamma-ray source with higher energy and a higher dose rate can be generated for a linear electron accelerator. The electron accelerator produces gamma-rays with energies of a few MeV by the bremsstrahlung effect. This energy can be higher than that of Co-60.
An air cargo inspection system requires high-energy radiation sources. The radiations with higher energy have the higher penetrating power. For instance, the penetrating lengths of iron with 5.995 × 10
−2 cm
2/g at 1 MeV and 3.057 × 10
−2 cm
2/g at 6 MeV of a gamma-ray are calculated to about 2.122 cm and 4.162 cm, respectively [
11].
The high penetrating power of radiation adversely affects the detector owing to its low measurement efficiency. Plastic scintillators and silicon photomultiplier-based radiation readout circuit boards are well-known radiation detectors for high-energy radiation measurements [
12,
13]. Plastic scintillators have been widely used to convert high-energy radiation to visible light. It is very attractive because of its nontoxicity, stability at varying temperatures, and simpler geometrical control, unlike liquid scintillators and others [
14,
15,
16]. A silicon photomultiplier was used to produce electrical pulses from the photon generated in the scintillator. The radiation detector modules were vertically arranged, and the moving cargo container was scanned.
The neutron and gamma-ray system outputs the neutron and gamma-ray transmittance images of the cargo container. The transmittance of the radiation has multiple pieces of information related to the material density, material thickness, and radiation beam conditions. Transmittance data should be calculated to extract the radiation absorption of materials and obtain their intrinsic characteristics for material discrimination.
In this paper, we report the development of an air cargo inspection system using fast neutron and gamma-ray sources to investigate the ability of material classification for security inspection. These radiation sources have a high penetration power, and the combined imaging provides a powerful result for material classification compared to using a single radiation source. Neutron and gamma-ray generators were installed, and their signals were measured using scintillator-based silicon photomultiplier electric circuits. Multiple detectors were arranged vertically to scan the air cargo using a motorized linear translator. The acquired neutron and gamma-ray images were used to calculate the R-value, which represented the ratio of neutron and gamma-ray attenuation coefficients. The data processing method using R-value images can categorize materials such as metals, plastics, and organic materials as a color map.
2. Materials and Methods
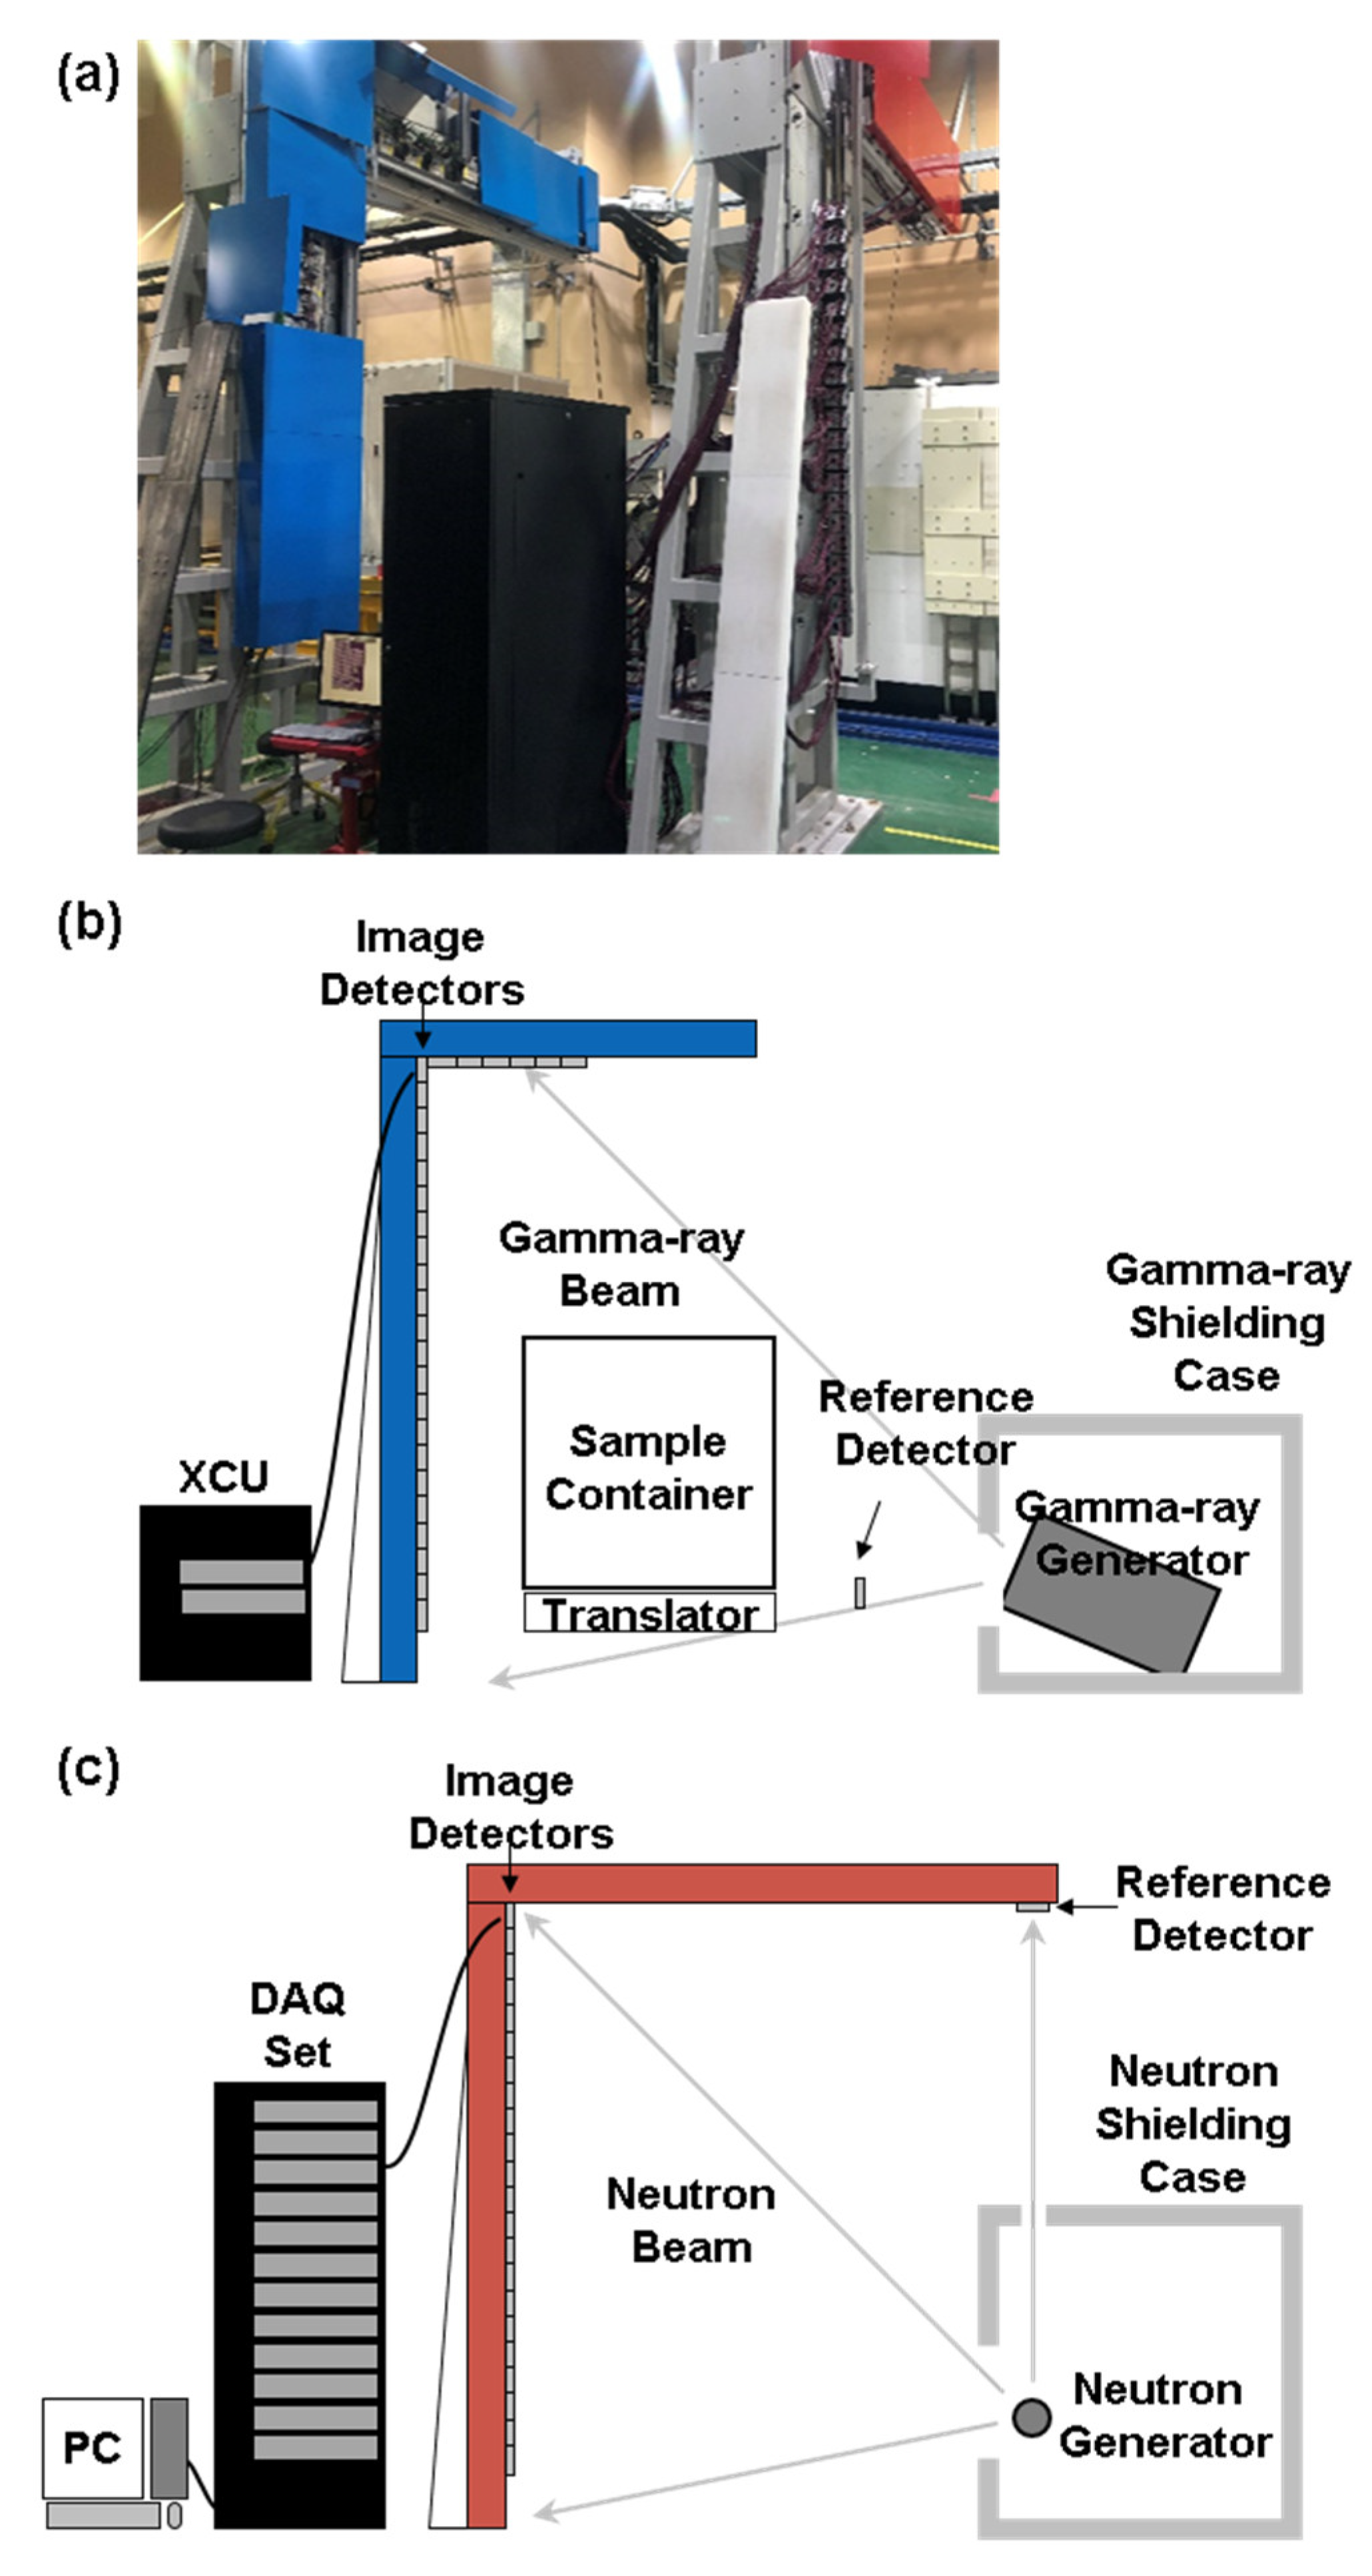
The air cargo inspection system developed at the Advanced Radiation Technology Institute of Korea Atomic Energy Research Institute is based on a radiation imaging system consisting of radiation sources, sample translators, and radiation detectors. Two types of radiation sources are installed: neutrons and gamma-rays. They radiate in the same direction from different positions, as shown in
Figure 1. Radiation detectors were placed on the opposite side of the cargo container from the source. Radiation sources and detectors are surrounded by radiation-shielding materials, except for the emission and detection areas. The entire area of the air cargo inspection system was shielded. The machine control room was located sufficiently far from the inspection area, and there is no risk of irradiation exposure. Between the radiation sources and detectors, the cargo is moved on a motorized linear translation stage. The data acquisition system accumulates imaging data and communicates with the machine control commands from a user-controlled computer via a network.
2.1. Gamma-ray Generation and Detection
The gamma-ray beam is produced using an electron linear accelerator system (LINAC) to output gamma-rays. The LINAC is composed of an electron gun, radio frequency (RF) generator, RF cavity, vacuum system, cooling system, high-voltage power system, tungsten target, and collimator, as shown
Figure 2. The generated electrons were accelerated in a gamma-ray generator system with a size of 965 × 1515 × 1115 mm
3 (width × length × height) and a repetition rate of 200 Hz for a tungsten target with a thickness of 2 mm. The gamma-rays produced from the tungsten target by the bremsstrahlung process have an energy of 6 MeV and a dose rate of 1.25 Gy/min. The gamma-ray beam passes through the slit collimator in front of the tungsten target and radiates towards the gamma-ray detectors.
The gamma-ray radiation that passed through the air cargo container was detected using a gamma-ray detection tower. The structure of the gamma-ray detection tower is built from a steel frame, as shown in
Figure 1b, to vertically arrange the 30 gamma-ray detection modules. They are connected to the gamma-ray control units and transmit the gamma-ray image pixel values to a user-controlled computer. One gamma-ray detection module combines CdWO4 scintillators (PSs, EPIC Crystal Co., 30,000 photons/MeV in scintillation efficiency), a Si-PIN photodiode (Si-PIN), and a control board. The PSs with a size of 4.6 × 7 × 30 mm
3 (width × length × height) convert gamma-rays to visible light with a wavelength of 480 nm, and the Si-PINs detect the visible light and generate electrical signals. The control board in the gamma-ray detection module counts the number of electrical signals and restructures the pixel values of the images. The number of vertically arranged image pixel values in one gamma-ray detection module was 32. The image frame was composed of the arrangement of the image pixel values transmitted from the gamma-ray detection modules. The other gamma-ray detection module was installed in front of the gamma-ray generator to detect a reference signal with pure gamma-ray beam information with no air cargo signals. The reference signal was useful for gamma-ray image correction.
2.2. Neutron Generation and Detection
Fast neutrons were generated in nuclear fusion reactions of deuterium and tritium in a D-T generator that emits an isotropic and mono-energetic neutron beam with an energy of 14.1 MeV. The D-T generator acts as a small particle accelerator composed of an ion source, acceleration stage, target, and pressure stabilizer in a vacuum-sealed case. The ions were extracted from the plasma formed in the ion source using a single-stage acceleration optic system. The extracted beam was then focused on the target shown in
Figure 3, which was constantly supplied at 150 kV. To reduce radiation risks, the D-T generator was covered with high-purity polyethylene panels and blocks, and 5 cm slits were open on the neutron shielding cover to emit the neutron beam.
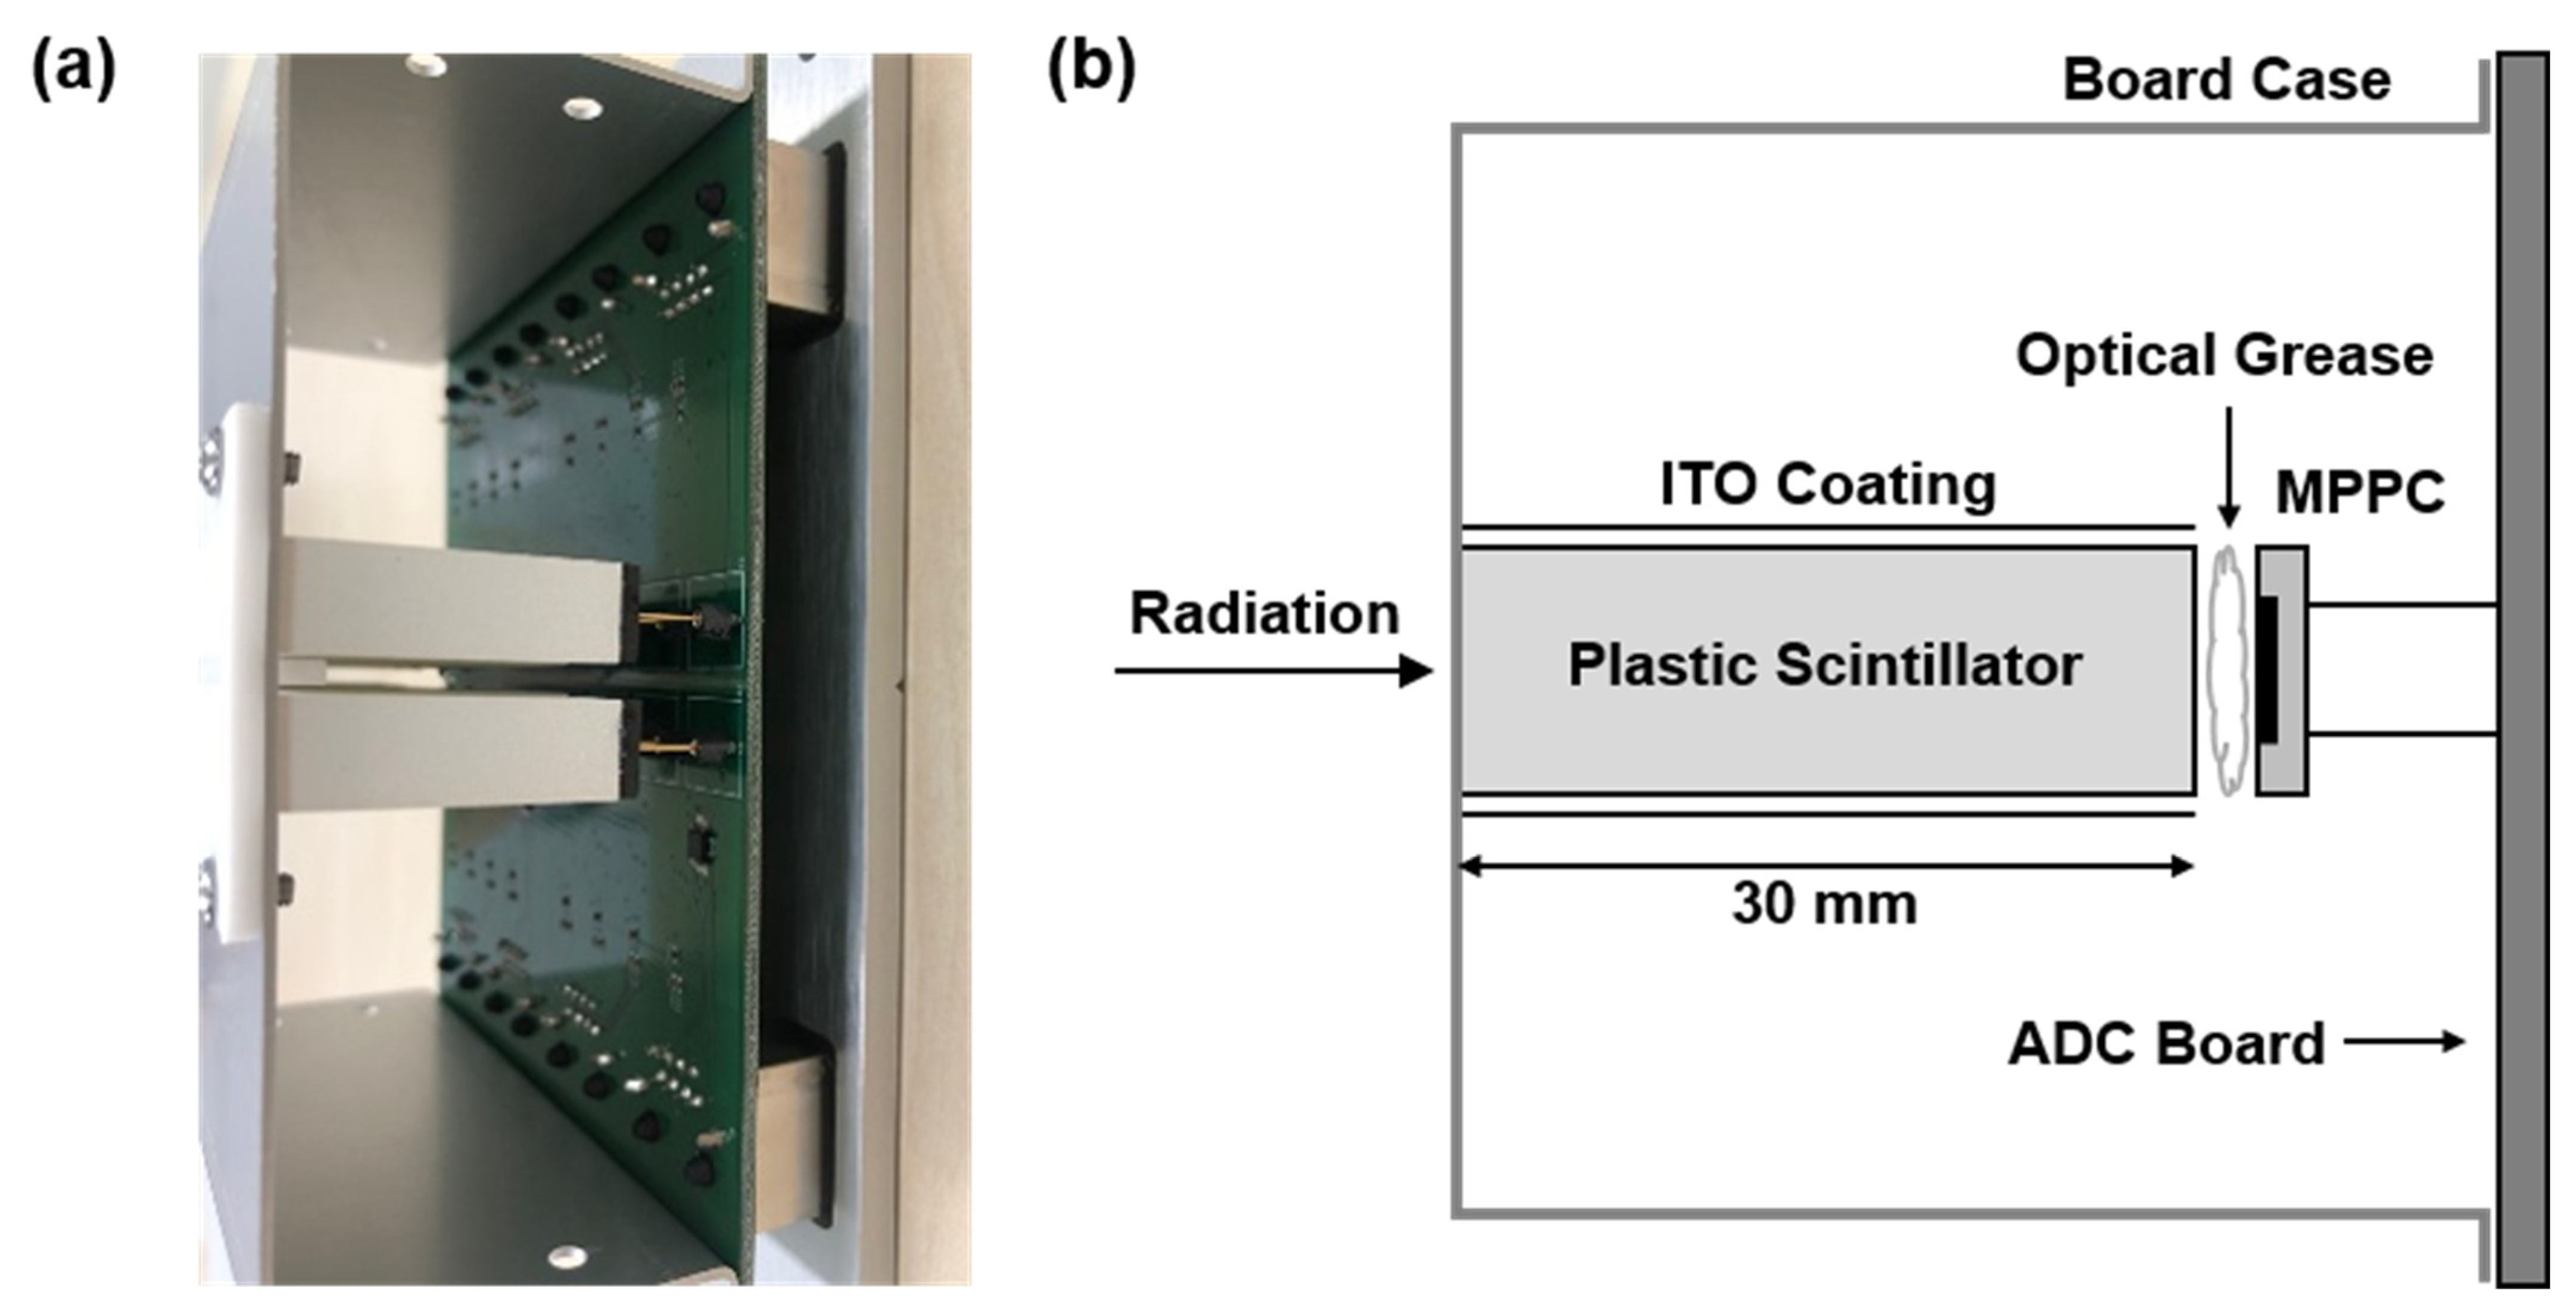
During operation, the D-T neutron generator emits highly penetrating radiation, including neutrons and gamma-rays. Among the radiation, only neutron property data for air cargo must be collected. The radiation was detected using a plastic scintillator on the neutron detector. The neutron detector module in
Figure 4 shows the composition of the plastic scintillator (PS), silicon photomultiplier (SiPM), analog-to-digital converter (ADC) board, and visible shielding case. A polyvinyl toluene-based plastic scintillator (PS, EJ-276G from Eljen Technology [
15]) with a size of 10 × 10 × 30 mm
3 was selected to develop a fast neutron detector with PSs arranged in a 2 × 8 array. PS converts the high-penetrating radiation to the visible region at a wavelength of approximately 490 nm. This scintillator has a scintillation efficiency of 8000 photons/MeV. A silicon photomultiplier (SiPM, S13360-6025CS, Hamamatsu) with a photosensitive area of 6 × 6 mm
2 senses visible light. The photon detection efficiency of this SiPM is 25%. The contact surface between the PS and SiPM is bonded to titanium oxide grease with a refractive index similar to that of PS to reduce optical losses. The SiPM counts a single photon generated from the PS and generates electrical output pulses. The ADC board measuring the electrical pulse was designed to sample it at a frequency of 125 MHz and a 14-bit resolution.
The electrical pulse shape is characterized by recoil protons and electrons excited by radiation. In general, electrical pulses arising from neutron signals tend to have higher peaks and longer tails than those arising from photon signals, as shown in
Figure 5. The peak means the highest intensity of the pulse, and the tail is the integral of the post-peak time and the pulse end time. Using this feature, the pulse shape discrimination (PSD) technique differentiates neutron signals from various highly penetrating radiation signals [
17,
18]. With over 100,000 detections, the distribution of the electrical signals can be spread over a spot plot with peak and tail coordinates. Under stable measurement conditions, the PSD spot plot showed two regions: neutrons and gamma-rays. This result can also be displayed as a histogram of the ratio between the pulse peak and tail. The PSD histogram shows two Gaussian distributions, neutrons, and gamma-rays. In the PSD histogram, the valley of the two Gaussian distributions is determined by the area separating the neutron and gamma-ray signals.
The neutron detector modules were vertically arranged to create an image frame similar to the gamma-ray detector tower. Vertically arranged neutron detector modules were placed in front of the neutron generator. The neutron detector modules were connected to the data acquisition boards, and they supplied high-voltage power and transmitted the electrical pulse data.
2.3. Imaging Process
The gamma-ray and neutron detectors were connected to the data acquisition (DAQ) system to record the radiation image and communicate the machine control commands with a user computer. The number of electrical pulses obtained from the radiation detector during the measurement time represents the image pixel value. For instance, when the gamma-ray detector is activated for 1 s and the image pixel value is 1, and when the detector functions for longer, the image pixel value increases. The radiation detector modules and image pixel values were arranged vertically. The vertically arranged image pixels formed an image frame. By repeating the measurements at regular intervals, the image frames are horizontally accumulated, and the radiation image is expanded in two dimensions. Under this measurement condition, the container is displayed in the radiation image when the cargo container moves between the radiation generator and the radiation detector.
The radiation imaging system in the air cargo inspection system produces gamma-ray and neutron images with transmission properties. In the transmission characteristics of the radiation image, various information on the air, container, and beam, as well as the sample material, is present. However, security inspection requires only the intrinsic properties of the sample material. The reference and gain signals are used to extract the intrinsic properties of the sample material. Because the reference signal is measured before the radiation passes through the cargo container, it only has information about the pure beam intensity of radiation. Image correction using the reference signal can remove beam intensity fluctuations in the radiation image. The gain signal indicates the radiation signals passing through the air or container with no information of the sample material. This image correction using the gain signal separates the background transmission characteristics from the mixed transmission characteristics of the sample material. When used in an optical system, the gain correction removes the background information and characterizes the absorption of the sample material. The absorption coefficient is an intrinsic property of a sample material. The optical path length is required to calculate the absorption coefficient from the transmission data. However, because security inspection proceeds in an unopened state, the optical path length cannot be measured, and another method is required.
The unique information of the sample material inside the air cargo container can be extracted from the ratio of radiation absorption properties: the neutron and gamma-ray absorption values of the sample material. The ratio of the neutron and gamma-ray attenuation coefficients is:
where
In is the measured neutron intensity through the object,
In0 is the measured neutron intensity with the object removed,
Ig is the measured gamma-ray intensity through the object, and
Ig0 is the measured gamma-ray intensity with the object removed. The R-value does not require the calculation of the optical path length because the radiation has the same sample material optical path. Hence, calculating the R-values of the sample materials made material classification using the air cargo inspection system possible. The R-value is defined as the ratio of neutron absorption to gamma-ray absorption.
The R-values of the sample materials extracted from the radiation images were repainted onto the radiation image as a color map. The R-value image shows the differentiation of the materials. It is important to display the R-value image so that the operators can ensure that the positions of carriages match their R-values in real airports or cargo inspection rooms. To match the R-values in the radiation image, the pixel numbers and object positions must be identical between the neutron and gamma-ray images. Because the number of pixels in the gamma-ray image is greater than that in the neutron image, the pixel values of the neutron image are interpolated. Object position matching between the two radiation images was performed using the image registration method.
2.4. Air Cargo Container Translator
During air cargo inspection, a radiation image is created by the linear motion of the cargo container. The linear motion is supported by a motorized linear stage with a translation speed of 0.1 to 1000 mm/s. The motorized stage can move between the neutron source and the detector. The transfer movement is remotely controlled to change and adjust the speed, direction, and distance. An air cargo container with a size of approximately 233 × 162 × 153 cm3 was fabricated to be of the type used at airports. The interior of the container contained three layers of shelves for loading the material samples.
2.5. Sample Material Preparation
To investigate the material classification of the air cargo inspection system, 30 materials listed in
Table 1 were prepared. Their density and depth are different and in the range of 0.41 to 19.25 g/cm
3 and 17 to 430 mm, respectively. The materials had the same front size of 20 × 25 cm
2. The metallic samples were machined, and the powder samples were contained in an acrylic case. A maximum of six samples were placed on a shelf in the cargo container. The shelves with samples were arranged at different heights and depths to ensure that the radiation paths did not overlap. Radiation imaging experiments were conducted with various combinations of sample materials in different locations.
3. Results
The detected radiation is of neutrons and gamma-rays of various energies.
Figure 6a shows the representative single pulses of gamma-rays and neutrons. The tail regions of normalized electrical pulses of neutrons have higher values. A distribution trend of the main pulse peak intensity and tail region integration was obtained by exposing the neutron detector with the D-T generator activated for 60 s, as shown in
Figure 6b. The scatter plot in
Figure 6 shows two groups with different ratios of peak intensity and tail integration, and these two groups are separated by a linear line. Electrical pulses with lower intensities were considered as noise signals and were excluded from the scatter plot. The linear line in
Figure 6b is the reference value for separating the neutron signals. This reference value can be calculated from the histogram plot of the ratio between the tail and peak in
Figure 6c. The tail and peak ratio histograms can be fitted to two Gaussian fits, and the minimum in the valley of the Gaussian fitted plots is the reference value. In addition, the figure of merit (FOM) can be calculated from the two Gaussian fitted plots. The FOM is a value that establishes the ability to discriminate neutrons and other radiation and is defined as [
14,
19]
where Dpp is the distance between the peaks of the Gaussian fitted plots, and GFWHM and NFWHM are the full widths at half maximum (FWHM) of the gamma and neutron peaks, respectively. The FOM of the neutron detector is approximately 1.12.
The number of electrical pulses attributed to neutrons or gamma-rays corresponds to the image pixel value. The image pixel values are transformed to the gray color map to display the radiation image. The radiation image is obtained with the horizontal translation of the cargo container.
Several experiments were conducted using different combinations of sample materials to acquire radiation images. The translation speed was adjusted from 16 mm/s to 200 mm/s. The radiation dose rates were 1.25 Gy/min for gamma-rays and 10
8 n/s for neutrons. The radiation images were captured for 30 s and 90 s for the gamma-ray and neutron images, respectively.
Figure 7a,b show one of the results of the gamma-ray and neutron images. These images were corrected with reference and gain signals, and they presented the absorption properties.
Figure 7c shows a visible image of the material sample inside the air cargo container.
Using the gamma-ray and neutron images and the absorption properties of the radiation, the R-values of the 30 sample materials were calculated, as shown in
Figure 8. The R-values were in the range of 0.26 and 1.26 for the prepared sample materials listed in
Table 1. The R-values of the metals were mainly below 0.6, but their values were sufficiently different. Plastics have higher R-values at lower densities, and there were large differences between the R-values for materials of different atomic compositions. Organics had R-values greater than 0.6, except for animal bones, rubber, and melamine, most of which had values near 1. It is considered that the R-value is affected by the atomic compound because organics with R-values near 1 are vegetable substances, only metals have R-values under 0.6, and plastics have different R-values for different polymer families.
Figure 9 shows the R-value image of the air cargo container loaded with samples of various materials. The R-value image is obtained from the color mapping result by matching the sample positions of the gamma-ray and neutron absorption images and calculating the R-value for each pixel. The mapping colors of the R values were colors of the rainbow, as shown in the legend of
Figure 9. The hollow frame and empty area in the container are filled to the air, so their R-values are almost zero, and their areas are displayed to the black color. Metals with R values of less than 0.6 have reddish colors and are clearly distinguished from other materials. Animal bones, Teflon, and rubber in the air container had higher R-values than the metals. Acetamide and polyethylene had the highest R values in
Figure 9. The color map image cannot give detailed R values to distinguish objects of the same materials; however, it can differentiate between the material classes of metals, plastics, and organics.
4. Conclusions
We developed an air cargo inspection system using a D-T neutron generator and accelerator-based gamma-ray source. The neutron source generates neutrons with an energy of 14.1 MeV and a flux of 108 n/sec. The gamma-ray source produced a gamma-ray beam with an energy of 6 MeV and a dose of 1.25 Gy/min. A neutron and gamma-ray imaging system was installed to acquire radiation transmittance images of 30 materials loaded in an air cargo container. These radiations can penetrate materials several tens of centimeters thick within an air cargo container. A linear motorized translator moved the air cargo container between the radiation sources and detectors. The radiation detectors were based on plastic scintillators, silicon photomultipliers, and electric circuits. They were arranged vertically to scan the moving stage, including the cargo container. The radiation signals were counted as image pixel values, according to the PSD method. As a result, the radiation imaging system outputs neutron and gamma-ray images with transmittance. Data processing with image interpolation and registration was used to calculate R values from the transmittance data and displayed them on the color map image to differentiate between 30 types of materials: metals, plastics, organics, and others. This process validates the material classification capability.
The R-value image is powerful in distinguishing more diverse materials than the use of a single radiation source. However, the industrial fields require more complicated systems for use in the mixed or packed material classes in the real cargo container. In the imaging system, the three-dimensional imaging system is required because the mixed materials are superposed on the beam path. Our further step in the development of the security inspection system is a tomographic inspector that uses gamma-rays and neutrons.


 ,
, 


