Abstract
Gate allocation has always been a fundamental but critical issue in the daily operation of airports, which is related to service quality and schedule efficiency. In order to obtain reasonable and efficient gate allocation results, in this paper, a multi-commodity network flow model is proposed to describe the gate allocation process in flight flow, based on which a multi-objective optimization model is constructed. It not only comprehensively considers the flight information of aircraft arrivals and departures, but also integrates the broader interests of passengers, airlines, and airports. To solve it, a linear weighting technique is applied. In addition, K-means cluster analysis is used to explore different weight combinations, and on this basis, the idle time of the gate is introduced as a performance evaluation index to guide the selection of the final weight. By analyzing the optimization results of actual operation data, the proposed model significantly balances the interests of multiple parties and the number of flights at each gate and has a relatively high gate-utilization rate. It can provide rich decision support and a reasonable allocation scheme for airport management to a certain extent.
1. Introduction
Over the past few decades, the rapid development of the civil aviation industry has been witnessed. However, the contradiction between the rapid increase in the demand for civil aviation transportation and the lack of existing resources has become more and more prominent. The contradiction reduces the airport’s operational efficiency in the central position, making it easy to cause large-scale delays [1]. The fundamental solution to this problem is to increase the airport’s capacity among which the construction of infrastructure is the most direct way. However, this method is challenging due to high costs and long periods. Another way is to increase the airport capacity by improving the operating efficiency, which is also the direction of this paper. As one of the important resources in airport surfaces, the gate is a main factor to ensure the efficient operation of the airport [2]. Under the circumstance of limited gate resources, the allocation of gates will play a key role in the transition and connection of aircraft entering and leaving the airport. An effective gate allocation scheme can help reduce surface conflicts and flight delays, thereby improving service quality and passenger satisfaction.
Gate allocation refers to selecting suitable and compatible gates for arrival and departure flights with a fixed occupancy time to complete the corresponding surface tasks [3]. It is essentially a resource scheduling and optimization problem that is ubiquitous in various fields [4,5,6,7,8]. At the airport planning level, the manager allocates the gate reasonably according to the number, location, and type to meet the expected demand of surface flights. At the airport operation level, based on the flight plan data and appropriate optimization goals, we can predict the assignment of the aircraft in advance. According to the actual operation of the airport surface, the results of gate allocation can have a huge impact on a variety of stakeholders, especially passengers, airlines, and airports. Passengers expect to walk the shortest distance to board the corresponding flight or arrive at the corresponding terminal smoothly. Airlines want to minimize taxi time due to congestion and surface conflicts and maximize the operational efficiency of their resources. The airport hopes to optimize the use of surface resources, thereby ensuring passenger satisfaction and balancing the interests of multiple airlines. Therefore, in order to comprehensively consider the interests of multiple parties and generate an efficient and reasonable gate allocation scheme, this paper builds a multi-objective optimization model of gate allocation based on the multi-commodity network flow theory. To solve it, a regularized linear weighting method converts it into a single-objective optimization model. Furthermore, to analyze and evaluate different weight combinations, cluster analysis is applied. According to the analysis results, different weight combinations may correspond to the same objective function value. Therefore, the gate robustness is introduced as an auxiliary indicator to determine the most suitable weight combination. The proposed model is validated on the real data of Shanghai Pudong International Airport.
Overall, our main contributions can be summarized as follows:
- (1)
- A multi-objective optimization model based on multi-commodity network flow is proposed, where the interests of passengers, airports, and airlines are comprehensively considered.
- (2)
- A linear weighting method is used to solve the multi-objective optimization model, where cluster analysis and auxiliary metrics are used to determine weight combinations.
- (3)
- Extensive experimental analysis is performed on real operational data, and the validity of the allocation results is illustrated from both qualitative and quantitative perspectives, respectively.
The rest of this paper is organized as follows. In Section 2, the related work is reviewed, and the research status of gate allocation is introduced from three aspects. The problem description is presented in Section 3. In Section 4, the optimization objectives and constraints are explained in detail. Section 5 shows the experimental verification results. Finally, the conclusion and prospect of future work are presented in Section 6.
2. Literature Review
The gate allocation will significantly affect the quality of passenger service. Departing passengers want the distance from the waiting port to boarding the plane to be as short as possible and arriving passengers want the travel time from the aircraft to baggage claim to be as fast as possible. Transfer passengers want the distance between the corresponding two flight gates to be as short as possible. Since 1971, some scholars have paid attention to the problem of gate allocation considering passenger satisfaction [9], which is also the first group of people to pay attention to and solve the gate allocation problem. Among the optimization objectives from the perspective of passenger satisfaction, the most frequently used one is to minimize the walking distance of passengers. In earlier studies, most scholars only considered the single objective optimization problem [10,11,12,13]. In the 21st century, multi-objective optimization methods occupied the main proportion [14,15,16,17,18]. In addition, some studies changed the perspective of the optimization objective, such as minimizing the total waiting time of passengers [14] or minimizing the transit time of passengers [19,20]. Maharjan B et al. [21] considered the transit time of passengers and the transit walking distance. Since overall passenger satisfaction is proportional to the number of passengers, the number of passengers is also considered an essential parameter of passenger satisfaction [22,23] to reduce the overall walking cost of passengers and the possibility of missing flights as much as possible.
Since 2000, scholars have begun considering the interests of airlines and airport operations more comprehensively. The continuous airport operation needs to ensure the satisfaction of passengers and airlines’ preferences simultaneously to ensure the efficient operation and constant income of the airport. The primary consideration of the airport is to maximize the function of surface resources so that the utilization of resources can reach the optimal mode as close as possible. Drexl A et al. [16] considered different airlines’ preferences for gates and established a multi-objective model. Jaehn F [24] improved the utilization of gates by reducing idle time. It used a genetic algorithm to solve the problem. Bolat A [25] also considered the utilization of gates and solved it using an adaptive particle swarm algorithm. In addition, the robustness of the gate is also regarded as an important perspective. For the possibility of changes in the arrival and departure times of flights, the dynamic ability of the optimization model can be improved by minimizing the variance of idle time [17,26,27]. Maximizing compatibility is also an option to enhance the robustness of gates [23,28].
For airlines, ground operations must be performed as efficiently as possible with limited resources. Reducing the number of aircraft with unassigned gates [15,17,23,28,29,30] and the number of aircraft allocated to remote gates [18,31] can improve ground operation efficiency and reduce ground consumption costs. When the aircraft cannot temporarily reach the contact gate for various reasons, passengers must take airport buses to the location without the corridor bridge to board the plane, which consumes a lot of time and cost on the ground and reduces passengers’ patience and comfort. In addition, reducing the total cost of towing an aircraft from a remote gate is also a method chosen by many types of literature. Using special airport vehicles such as tractors to tow aircraft requires considerable cost, so we try our best to avoid the arrival and departure flights of the same aircraft not being at the same gate and the situation that the aircraft needs to be towed to the corresponding gate. Towing operations can be reduced by minimizing the number of towing tasks [32,33,34] or the towing cost. Kumar and Bierlaire [35] developed a linear programming model to optimize the towing cost of aircraft under certain constraints. Yu, Zhang, and Lau [36] established the quadratic objective function. They used the adaptive search algorithm to solve it, which reduced the towing cost and improved the robustness of the aircraft to a certain extent. Liang et al. [37] proposed an adaptive improved genetic algorithm combining parallel advantages and elite strategies to improve the decision-making ability of large-scale handling data on the real airport surface. Some studies guarantee the interests of airlines by reducing the waiting time and consumption cost [38,39,40], and passengers’ overall satisfaction in the waiting process is also a part of the consideration [41]. During the process of surface control, the gate allocated to the aircraft will be temporarily busy, so the aircraft and passengers need to spend time waiting on the ground until the corresponding gate is free. Moreover, some scholars also consider more practical effects, such as aircraft fuel consumption [21].
3. Problem Description
The gate allocation problem proposed in this paper involves arrival and departure, which are continuous and highly correlated. Airport Collaborative Decision-Making (ACDM) provides accurate and detailed decision-making support from multiple sources in surface control. Additionally, it provides rich information to a large extent for the solution of multi-objective optimization problems. Firstly, the arrival flight lands on the designated runway at the landing time to complete the runway taxiing task, then leaves the runway, enters the taxiway, and meets the surface taxiing task according to the path and designated rules. Then, the aircraft enters the apron taxiway and stops at the pre-allocated gate at the in-block time. After completing the ground support work, the departure process of the corresponding aircraft will be carried out. For a departing aircraft, it first leaves the gate at the off-block time and enters the apron taxiway. Then, according to the corresponding taxi path, it arrives at the runway threshold and enters the runway at the take-off time. Due to the high uncertainty and flexibility of the airport surface, some assumptions are made in the modeling process to realize the multi-objective gate allocation and provide the optimization scheme of surface resource scheduling. The solution to the problem is based on the following assumptions.
- (1)
- Solving the gate allocation problem requires multiple sources of information, such as flight plans, aeronautical information publication, airport layouts, etc. We assume that the above information is known and complete to support subsequent studies and experiments.
- (2)
- We assume that the total number of flights is kept within the airport capacity, and enough remote gates are set up to allocate each flight.
To describe the resource situation of an airport, the network model of the airport gate schedule is established, and the knowledge of graph theory is used to construct the directed graph , where is the set of nodes and is the set of directed edges. The gate allocation problem is similar to the multi-commodity network flow model, which is the problem of allocating different gates as different commodities from the same origin node to the same destination node in the network. The paradigm of the multi-commodity network flow model is shown in Figure 1a, which includes four types of nodes and five types of arcs, as detailed below:
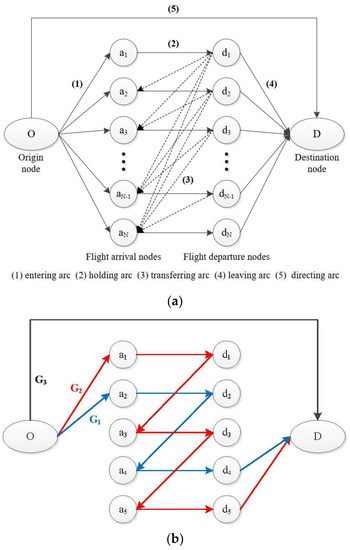
Figure 1.
Multi-commodity network flow model for gate allocation. (a) The basic paradigm. (b) An example of the allocation result with three gates and five flight pairs.
- (1)
- Node: The node represents the static state in the gate allocation. The origin node is a virtual node, which is the starting point of the gate as the commodity. According to the order of the aircraft on the surface, the gate is first allocated to the corresponding arrival flight, that is, the gate flows from the unique origin node to one of the flight arrival nodes . Then, the gate is allocated to the corresponding departure flight, that is, the gate flows from the flight arrival node to the corresponding flight departure node . When the gate is no longer occupied, it will eventually flow to the only destination node to be recycled, which is also a virtual node. The node set can be summarized as follows, where is the number of flight pairs.
- (2)
- Arc: An arc is a directed edge representing the dynamic trend of the gate. The entering arc is the direction from the origin node to the flight arrival nodes , indicating the allocation status of the corresponding gate designated for the arrival flight. Its existence means that the corresponding gate is occupied. The holding arc is the direction from the arrival to the corresponding departure flight, indicating the gate’s continuous occupancy status. That is, the related aircraft is receiving ground service. The transferring arc points to the direction of the next arrival flight to be allocated from the departing flight that has been serviced, indicating the next flight served by the designated gate. This type of arc exists if the landing time of the arrival flight to be allocated is greater than the departure time of the last flight currently served by the gate. A buffer time greater than a certain buffer time is required between the two flights operated by the same gate. The leaving arc is the gate recovery arc, which flows from the corresponding flight departure node to the destination node , indicating that the gate is idle and is about to be recycled. The directing arc flows directly from the origin node to the destination node , indicating that the gate is never occupied. The arc set can be concluded as follows:
The gate flows through the direction of the arc in the network as a commodity. It starts from the origin node and flows through the intermediate nodes to the destination node to form a complete commodity flow. The multi-commodity network flow model is the interleaved network formed by multiple commodity flows. Figure 1b shows a feasible allocation scheme for three gates and five flight pairs . The blue line indicates the overall flow of , which is first allocated to the arrival flight , and then serves the corresponding departure flight . Due to the landing time of flight being greater than the departure time of flight and the service time of the satisfying the corresponding buffer time, is allocated to the arrival flight and the departure flight and then is in an idle state. The red line indicates the work process of the , which is first assigned to the arrival flight and the departure flight , and then to the arrival flight and the departure flight under certain conditions. After the second process, it is found that can still be allocated to arrival flight and departure flight . is not assigned again after serving three pairs of flights. The black line represents the state of , which means that the gate has not been allocated and is always in an idle state. According to the modeling process described above, some potential limitations can be found, such as the paired existence of flights (i.e., arrival and departure flights) and the first-come-first-served gate allocation strategy. In practice, most scenarios follow these requirements, so these potential limitations are somewhat acceptable.
4. Modeling
The specific components of the multi-objective optimization problem proposed in this paper are shown in Figure 2. Due to the correlation and contradiction of multiple interests, the gate allocation must face the fact that resources are scarce and expensive and deal with and balance the conflicting factors. Therefore, the problem of gate allocation is inherently multi-objective. On the premise of avoiding deadlock at the planning level, optimization strategies should also be designed at the operation level to avoid running conflicts. The importance of the factors needs to be adjusted to allocate gate resources reasonably. The related decision variables are provided in Table 1.
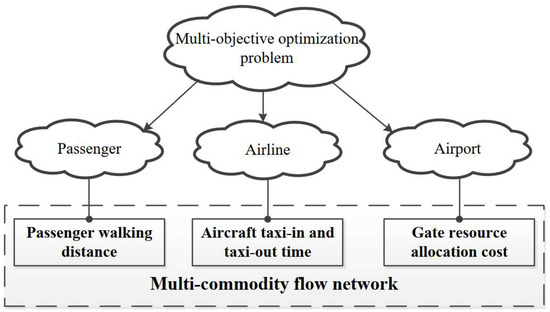
Figure 2.
Basic diagram of the proposed multi-objective optimization problem.

Table 1.
Description of decision variables.
In general, based on the multi-commodity network flow, the proposed multi-objective model considers three perspectives, namely, passengers, airlines, and airports. In order to characterize the respective interests, passenger walking distance, aircraft taxi-in and taxi-out time, and gate resource allocation cost are defined as three objective functions.
(1) Minimize passenger walking distance. From the perspective of passengers, the primary purpose of gate allocation is to improve passenger satisfaction. The number of passengers departing and arriving on the flight is used as the weight to calculate the corresponding walking distance. The overall walking distance of passengers is taken as the first optimization objective, as follows:
where and denote the set of arrival and departure flights, is the set of gate resource, and are the number of passengers for arrival flight and departure flight , and and represent the corresponding walking distance between gate and the terminal (i.e., baggage waiting for arrival and security check for departure).
(2) Minimize aircraft taxi-in and taxi-out time. In the taxiing phase, aircraft operating costs such as fuel consumption are directly related to taxi time. Therefore, the taxi-in and taxi-out time of the aircraft is also an important factor in choosing a suitable gate. The second optimization objective is provided as follows:
where and are the average taxi-in and taxi-out time of gate . Since it is calculated from historical operating data, it has potentially considered different taxiing paths, taxiing conflicts, etc. Similar to objective 1, the number of passengers is also included as a weight for the purpose of measuring the importance of taxi cost.
(3) Minimize gate resource allocation cost. To fully use the gate resource, the size of the allocated gate needs to match the aircraft size. Therefore, the waste of surface resources can be minimized only by allocating the most appropriate gate for the corresponding aircraft and not allocating remote gates as far as possible. The third optimization objective is provided as follows:
where is the cost of size mismatch between arrival flight and gate . As a rule of thumb, different levels of penalty values are defined as shown in Equation (6). is the size of gate , and is the size of arrival flight . Especially, we assign the largest penalty to the remote gate, which is to minimize its frequency of use unless all contact gates are occupied. is defined, likewise:
In order to balance the interests of multiple parties, multiple optimization objectives are integrated together through a linear weighting method, as follows:
where , , and are weight coefficients for each objective, and . To further eliminate the adverse effect of scale on each objective function, a normalization technique is applied to obtain the final function as shown in Equation (8).
where , , and are the maximum values of each objective function and , , and are the corresponding minimum values.
Furthermore, to obtain a reliable gate allocation scheme for each flight, three types of constraints are considered, namely multi-commodity network flow constraints, flight exclusive constraint, and gate compatible constraint.
(1) Multi-commodity network flow constraints. Considering the complex interactions between commodities (i.e., gates) and obtaining valid commodity flows, the following basic constraints must be observed:
Equation (9) describes the constraint of flow-in, indicating that each gate needs to choose the entering arc or the directing arc (i.e., whether there is a flight using the gate). Correspondingly, Equation (10) provides the constraint of flow-out. As for Equation (11), it represents the flow balance constraint of the flight arrival nodes. Here, means arrival flight and departure flight form a flight pair. Similarly, Equation (12) presents the flow balance constraint of the flight departure nodes. It should be noted that an indicator function is used to describe the temporal relationship between the departure flight and the arrival flight , as follows:
where is a preset buffer time, and when the time interval between arrival flight and departure flight is greater than , is equal to 1. Otherwise, is equal to 0. With in mind, it can be determined whether two flights are allowed to use the same gate. Equation (13) is the constraint of the transferring arc, which shows that only one gate can flow through it. Equation (14) ensures that the above variables are 0–1 variables.
(2) Flight exclusive constraint. The flight exclusive constraint means that each flight must be assigned a unique gate. It is formalized as follows:
where is 0 or 1, indicating whether flight is assigned to gate .
(3) Gate compatible constraint. The gate compatible constraint describes the size limitation between the gate and aircraft, which means that the size of the gate should be sufficient to accommodate the size of the aircraft. It is formalized as follows:
where is an arbitrarily large integer. Note that when the value of is 0, this inequality always holds.
5. Numerical Study
5.1. Experimental Data and Settings
In order to verify the proposed model in the problem of gate allocation, one of the busiest hub airports in the world, Shanghai Pudong International Airport, is used as the research object, where 20 representative gates in Terminal 1 are selected, as shown in Figure 3. In addition to 18 contact gates, 2 remote gates are also considered to prevent the absence of feasible solutions due to the accumulation of flights exceeding the inherent capacity of contact gates at a specific time.
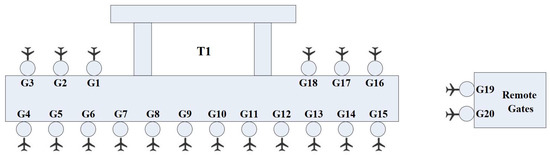
Figure 3.
Layout of Terminal 1 in Shanghai Pudong International Airport.
Specifically, according to the size of aircraft wingspan that the gate can accommodate, all these gates are divided into three categories, which are small gates (G1~G5), medium gates (G6~G13), and large gates (G14~G20). Furthermore, based on historical operations, we filtered flights for each gate and calculated the average taxi time as the taxi cost. The walking distance of passengers related to each gate was also preliminarily estimated, and the detailed information is presented in Table 2.
Table 2.
Basic information of gate resources.
Meanwhile, this paper considers the actual operational data of the flight, which involves a total of 88 pairs of flights in the time range of 08:00–20:00. All flights are also divided into three categories based on the aircraft wingspan length, including 39 small flights, 28 medium flights, and 21 large flights. As for the number of passengers, it is set to the full capacity of each flight for simplicity. More detailed flight information is shown in Table 3.
Table 3.
Basic information of flight data.
In the following experiments, the buffer time between two adjacent flights for each gate is set to 30 min. All the models related to this paper are created on a Dell G15 laptop consisting of an i7-11800H@2.30 GHz Intel Core and a 16 GB DDR3 RAM. With PyCharm as the implementation platform, Gurobi Commercial Optimizer 9.5.2 and Python 3.9.9 are used as core tools to solve the Binary Integer Linear Programming problem and obtain the optimal results of gate allocation. Specifically, the branch-and-cut (B&C) [42] algorithm is used to solve the integer programming problem, which is an exact algorithm composed of a cutting plane method and a branch-and-bound algorithm. The parameter settings and branching strategies related to the algorithm are based on the default configuration of the Gurobi solver. According to the operation results of the solver, the optimal values for decision variables and objective functions are obtained, as well as the corresponding running time.
5.2. Results Analysis
5.2.1. Single Objective vs. Multi Objectives
To compare the performance differences between the single objective function and the integrated multi-objective function, four optimization problems are presented and the results are shown in Table 4. Problems 1–3 optimize their respective objective functions. Problem 4 considers all objective functions with equal weights. It can be clearly seen that there are conflicts and limitations between the various objective functions, and the optimization of one objective is at the expense of the degradation of other objectives. For example, when the goal is to minimize the allocation cost of the gate resource (i.e., min f3), it achieves a minimum value of 4.0, but leads to a larger walking and taxi cost due to the allocation process neglecting the location and the required taxi time of the gate. This phenomenon is alleviated to a certain extent by using a linearly weighted objective function to consider the interests of all parties. Moreover, regardless of the objective function, the running time is within 1 min, so it can be easily extended to the pre-tactical and tactical stages of the gate allocation problem.
Table 4.
Performance comparison of four optimization problems.
5.2.2. Trade-Offs of Multiple Objectives
In order to further explore the influence of different weight combinations on the value of each objective function, weight coefficients are set from 0.1 to 0.8 with a step size of 0.1 (e.g., ), forming a total of 36 weight combinations. With these weight combinations in mind, firstly, the corresponding optimal solution of the integrated objective function is found and the value of each individual objective function is calculated. On this basis, the K-means clustering algorithm is used to perform cluster analysis on 36 combinations, where the silhouette index is used to select the optimal number of clusters. In this way, clusters with similar objective function values can be easily found to help understand the differences and connections between weight combinations. By providing K sets of weight combinations for decision makers, the problem of weight setting commonly existing in the linear weighting method is solved to a certain extent. Overall, a total of 7 clusters are formed and the results are presented in Table 5. Specifically, some interesting phenomena and conclusions can be found: (1) The first two clusters contain 55.6% of the combinations, and both have a minimum gate cost. From the detailed allocation results, it can be inferred that adjustments are made to the adjacent flights under the premise of the same gate size to trade off the benefits of walking distance and taxi time. Cluster 4 and cluster 5 are in a similar situation. (2) Cluster 3 and cluster 7 mainly compromise the cost of taxi and gate, while 1 and 7 compromise the cost of walking and gate. (3) Cluster 6 corresponds to the most extreme type of situation, which maximizes the passenger satisfaction represented by the walking distance at the cost of taxiing time and gate cost. (4) Regardless of the cluster, both remote gates (i.e., G19 and G20) are assigned flights between 15:00 and 18:00. This is because during this time period, all the contact gates are occupied due to the excessive flight volume, so the remote gates are forced to be used.
Table 5.
Cluster analysis results of different weight combinations.
Although cluster analysis can provide decision makers with initial insight into the weight setting, the authors found that different combinations of weights within the same cluster may correspond to the same objective function value. Moreover, further analysis of allocation results reveals that even in the same cluster, its related performance still has great uncertainty, especially the idle time of the gates. According to the relevant description in the past literature [26], the idle time variance is calculated by , where refers to the last idle time at gate until the arrival of the flight . Figure 4 presents the variance of idle time corresponding to each allocation under different clusters. It can be clearly deduced that the variance of idle time can be large or small, which fluctuates in the range of 2400–3300. In addition, the Pearson correlation coefficient between the variance of idle time and the cluster ID is 0.11, indicating that there is no significant correlation. Since the variance of idle time can reflect the sensitivity of gate allocation to variations in flight schedule (that is, the robustness of gate allocation), this performance indicator has been regarded as an important optimization objective in previous studies [24,25,26]. However, this paper focuses on the three stakeholders of passengers, airlines, and airports, and it is only used as an auxiliary performance metric for selecting weight combinations. When the value of each objective function is the same, the allocation result with the smallest variance of idle time is given priority to balance the idle time of each gate and alleviate the adverse effects caused by flight delays in actual operations. In the following experiments, the weight combination corresponding to the minimum idle time variance is selected, and its optimal solution is taken as the final gate allocation result.
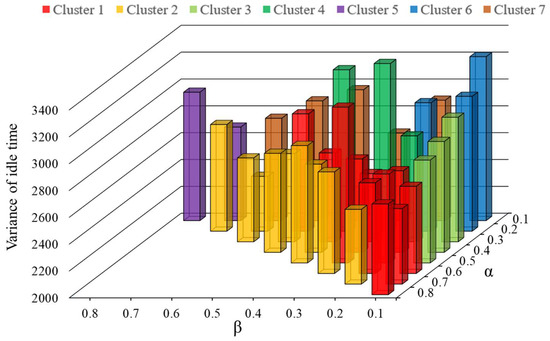
Figure 4.
Variance of idle time under different clusters.
5.2.3. Analyzing the Optimal Allocation of Gates
Based on the criterion of minimum idle time variance, the final weight combination is set to . Its optimized objective values for gate cost, taxi time, and walking distance are 4.2, 494,155.2, and 19,500,658, respectively. As shown in Figure 5, the gate allocation results are visualized using a Gantt diagram, where the dark blue represents the occupied time of each flight, and light blue represents the buffer time. Correspondingly, the distribution of the number of flights assigned to each gate is provided in Figure 6.
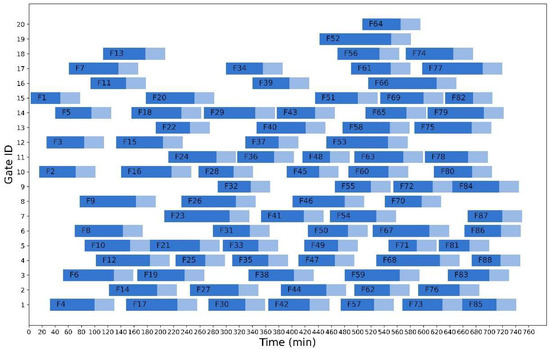
Figure 5.
Gantt diagram for gate allocation results.
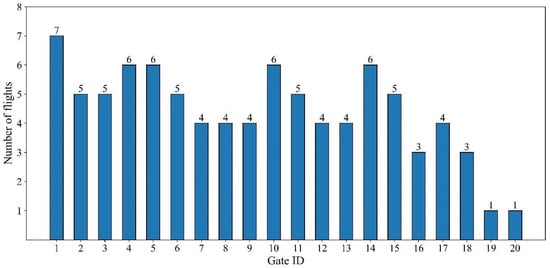
Figure 6.
Number of flights allocated for each gate.
Overall, all gates are fully utilized and there are no idle gates during the entire time period. Although remote gates have the highest cost in terms of walking distance, taxi time, and gate size, they still cannot avoid being used. In our final results, each of the two remote gates (i.e., G19 and G20) served one flight. As mentioned earlier, during the time period of 15:00–18:00, a large number of flights were piled up, resulting in all contact gates being occupied. This phenomenon can be clearly seen from Figure 5. Additionally, among all contact gates, G1 has the most flights allocated, with a total of seven flights. This is because it has absolute advantages in taxi time and walking distance among small-size gates. In contrast, G16 and G18 are allocated the fewest flights due to their larger taxi time and the larger proportion of taxi cost in this weight combination.
In addition, we also counted the relative utilization rate and absolute utilization rate of each gate, as shown in Figure 7. On the whole, the utilization rate of the contact gate is relatively high, except for the remote gate. Additionally, the absolute utilization rate of most of them is above 40%, while the relative utilization rate is above 55%. Similar to the distribution of the number of flights, G1 has the highest absolute utilization and relative utilization, while G16 and G18 have the lowest. From the above conclusions, it can be found that the established multi-objective optimization model for gate allocation can effectively balance the interests of multiple parties and obtain a higher utilization rate. On the premise of ensuring relevant interests, by considering the robustness of the allocation results, the number of flights and the idle time at each gate are also balanced, thereby reducing the difficulty of airport management.
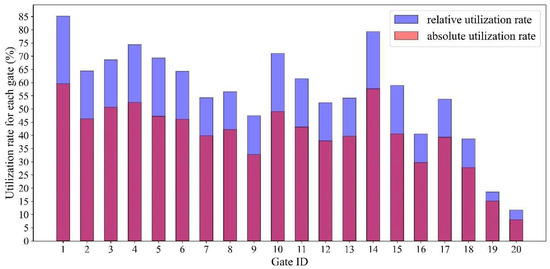
Figure 7.
Utilization rate for each gate.
6. Conclusions
The flight-to-gate allocation has always been one of the core issues for the operation of airport surfaces. In order to generate an effective and efficient gate allocation scheme and improve the operating efficiency of the airport surface, a multi-objective optimization model for gate allocation was established based on the multi-commodity network flow, which considers the multiple interests of passengers, airlines, and airports. To solve this model, a linear weighting technique was applied, and its various weight combinations were discussed using clustering algorithms. The variance of idle time was also introduced to evaluate the pros and cons of different solutions. Experiments using actual operating data show that the model can reasonably allocate gate resources with a high utilization and robustness. The proposed model can be regarded as a powerful decision support tool for air traffic controllers. According to the published flight plan, it can quickly generate a reasonable gate allocation scheme to realize the airport resource scheduling and configuration in the pre-tactical stage.
Future work will verify the generalizability of the proposed model in more diverse operational data. In addition, how to combine other resources of the airport, such as taxiways, runways, etc., to deeply examine the surface resource scheduling problem at the micro level is also an interesting topic.
Author Contributions
Conceptualization, J.D. and M.H.; methodology, J.D. and J.Y.; software, J.D. and W.Z.; validation, J.D., M.H., J.Y. and W.Z.; formal analysis, J.D.; investigation, J.Y.; resources, M.H.; data curation, J.Y.; writing—original draft preparation, J.D. and J.Y.; writing—review and editing, J.D. and M.H.; visualization, J.D. and W.Z.; supervision, M.H.; project administration, M.H.; funding acquisition, J.D., M.H., J.Y. and W.Z. All authors have read and agreed to the published version of the manuscript.
Funding
This work is partially supported by the National Key R&D Program of China (2021YFB1600500), National Natural Science Foundation of China (52002178, 71731001), Natural Science Foundation of Jiangsu Province (BK20190416), Postgraduate Research & Practice Innovation Program of Jiangsu Province (KYCX22_0377, KYCX22_0373), Interdisciplinary Innovation Fund for Doctoral Students of Nanjing University of Aeronautics and Astronautics (KXKCXJJ202202), and China Scholarship Council (202106830100, 202106830077).
Institutional Review Board Statement
Not applicable.
Informed Consent Statement
Not applicable.
Data Availability Statement
Due to the nature of this research, participants of this study did not agree for their data to be shared publicly, so supporting data are not available.
Conflicts of Interest
The authors declare no conflict of interest.
References
- Du, J.; Hu, M.; Zhang, W.; Yin, J. Finding Similar Historical Scenarios for Better Understanding Aircraft Taxi Time: A Deep Metric Learning Approach. IEEE Intell. Transp. Syst. Mag. 2022, 2–17. [Google Scholar] [CrossRef]
- Ding, H.; Lim, A.; Rodrigues, B.; Zhu, Y. New heuristics for over-constrained flight to gate assignments. J. Oper. Res. Soc. 2004, 55, 760–768. [Google Scholar] [CrossRef]
- Zhang, Y.; He, Q.; Yang, L.; Liu, C. An Improved Tunicate Swarm Algorithm for Solving the MultiObjective Optimisation Problem of Airport Gate Assignments. Appl. Sci. 2022, 12, 8203. [Google Scholar] [CrossRef]
- Feng, C.; Hu, S.; Ma, Y.; Li, Z. A Project Scheduling Game Equilibrium Problem Based on Dynamic Resource Supply. Appl. Sci. 2022, 12, 9062. [Google Scholar] [CrossRef]
- Zhang, J.; Chong, X.; Wei, Y.; Bi, Z.; Yu, Q. Optimization of Apron Support Vehicle Operation Scheduling Based on Multi-Layer Coding Genetic Algorithm. Appl. Sci. 2022, 12, 5279. [Google Scholar] [CrossRef]
- Peron, M.; Fragapane, G.; Sgarbossa, F.; Kay, M. Digital facility layout planning. Sustainability 2020, 12, 3349. [Google Scholar] [CrossRef]
- Wu, D.; Wu, C. Research on the Time-Dependent Split Delivery Green Vehicle Routing Problem for Fresh Agricultural Products with Multiple Time Windows. Agriculture 2022, 12, 793. [Google Scholar] [CrossRef]
- Deng, W.; Ni, H.; Liu, Y.; Chen, H.; Zhao, H. An adaptive differential evolution algorithm based on belief space and generalized opposition-based learning for resource allocation. Appl. Soft Comput. 2022, 127, 109419. [Google Scholar]
- Braaksma, J.P.; Shortreed, J.H. Improving airport gate usage with critical path. Transp. Eng. J. ASCE 1971, 97, 187–203. [Google Scholar]
- Mangoubi, R.S.; Mathaisel, D.F. Optimizing gate assignments at airport terminals. Transp. Sci. 1985, 19, 173–188. [Google Scholar]
- Bihr, R.A. A conceptual solution to the aircraft gate assignment problem using 0, 1 linear programming. Comput. Ind. Eng. 1990, 19, 280–284. [Google Scholar] [CrossRef]
- Haghani, A.; Chen, M.-C. Optimizing gate assignments at airport terminals. Transp. Res. Part A 1998, 32, 437–454. [Google Scholar] [CrossRef]
- Xu, J.; Bailey, G. The Airport Gate Assignment Problem: Mathematical Model and a Tabu Search Algorithm. In Proceedings of the 34th Annual Hawaii International Conference on System Sciences, Maui, HI, USA, 3–6 January 2001; IEEE: Washington, DC, USA, 2001. [Google Scholar]
- Yan, S.; Huo, C.-M. Optimization of multiple objective gate assignments. Transp. Res. Part A 2001, 35, 413–432. [Google Scholar] [CrossRef]
- Ding, H.; Lim, A.; Rodrigues, B.; Zhu, Y. The over-constrained airport gate assignment problem. Comput. Oper. Res. 2005, 32, 1867–1880. [Google Scholar] [CrossRef]
- Drexl, A.; Nikulin, Y. Multicriteria airport gate assignment and Pareto simulated annealing. IIE Trans. 2008, 40, 385–397. [Google Scholar] [CrossRef]
- Deng, W.; Zhao, H.; Yang, X.; Xiong, J.; Sun, M.; Li, B. Study on an improved adaptive PSO algorithm for solving multi-objective gate assignment. Appl. Soft Comput. 2017, 59, 288–302. [Google Scholar] [CrossRef]
- Dell’Orco, M.; Marinelli, M.; Altieri, M.G. Solving the gate assignment problem through the fuzzy bee colony optimization. Transp. Res. Part C 2017, 80, 424–438. [Google Scholar] [CrossRef]
- Kim, S.H.; Feron, E.; Clarke, J.-P. Gate assignment to minimize passenger transit time and aircraft taxi time. J. Guid. Control Dyn. 2013, 36, 467–475. [Google Scholar] [CrossRef]
- Kim, S.H.; Feron, E.; Clarke, J.-P.; Marzuoli, A.; Delahaye, D. Airport gate scheduling for passengers, aircraft, and operation. arXiv 2017, arXiv:1301.3535. [Google Scholar] [CrossRef]
- Maharjan, B.; Matis, T.I. Multi-commodity flow network model of the flight gate assignment problem. Comput. Ind. Eng. 2012, 63, 1135–1144. [Google Scholar] [CrossRef]
- Yan, S.; Tang, C.-H. A heuristic approach for airport gate assignments for stochastic flight delays. Eur. J. Oper. Res. 2007, 180, 547–567. [Google Scholar] [CrossRef]
- Benlic, U.; Burke, E.K.; Woodward, J.R. Breakout local search for the multi-objective gate allocation problem. Comput. Oper. Res. 2017, 78, 80–93. [Google Scholar] [CrossRef]
- Jaehn, F. Solving the flight gate assignment problem using dynamic programming. Z Betr. 2010, 80, 1027–1039. [Google Scholar] [CrossRef]
- Bolat, A. Assigning arriving flights at an airport to the available gates. J. Oper. Res. Soc. 1999, 50, 23–34. [Google Scholar] [CrossRef]
- Bolat, A. Procedures for providing robust gate assignments for arriving aircrafts. Eur. J. Oper. Res. 2000, 120, 63–80. [Google Scholar] [CrossRef]
- Liu, S.; Chen, W.H.; Liu, J. Robust assignment of airport gates with operational safety constraints. IJAC 2016, 13, 31–41. [Google Scholar] [CrossRef][Green Version]
- Neuman, U.M.; Atkin, J. Airport Gate Assignment Considering Ground Movement. In Computational Logistics; Springer: Berlin/Heidelberg, Germany, 2013; pp. 184–198. [Google Scholar]
- Dorndorf, U.; Jaehn, F.; Pesch, E. Flight gate scheduling with respect to a reference schedule. Ann. Oper. Res. 2012, 194, 177–187. [Google Scholar] [CrossRef]
- Dorndorf, U.; Jaehn, F.; Pesch, E. Flight gate assignment and recovery strategies with stochastic arrival and departure times. OR Spectr. 2017, 39, 65. [Google Scholar] [CrossRef]
- Tang, C.-H.; Wang, W.-C. Airport gate assignments for airline-specific gates. J. Air Transp. Manag. 2013, 30, 10–16. [Google Scholar] [CrossRef]
- Dorndorf, U.; Jaehn, F.; Pesch, E. Modelling robust flight-gate scheduling as a clique partitioning problem. Transp. Sci. 2008, 42, 292–301. [Google Scholar] [CrossRef]
- Nikulin, Y.; Drexl, A. Theoretical aspects of multicriteria flight gate scheduling: Deterministic and fuzzy models. J. Schedul. 2010, 13, 261–280. [Google Scholar] [CrossRef]
- Dijk, B.; Santos, B.F.; Pita, J.P. The recoverable robust stand allocation problem: A GRU airport case study. OR Spectr. 2018, 41, 615–639. [Google Scholar] [CrossRef]
- Kumar, P.; Bierlaire, M. Multi-objective airport gate assignment problem in planning and operations. J. Adv. Transp. 2014, 48, 902–926. [Google Scholar] [CrossRef]
- Yu, C.H.; Zhang, D.; Lau, H.Y. An Adaptive Large Neighborhood Search Heuristic for Solving a Robust Gate Assignment Problem. Expert Syst. Appl. 2017, 84, 143–154. [Google Scholar] [CrossRef]
- Liang, B.; Li, Y.; Bi, J.; Ding, C.; Zhao, X. An Improved Adaptive Parallel Genetic Algorithm for the Airport Gate Assignment Problem. J. Adv. Transp. 2020, 2020, 8880390. [Google Scholar] [CrossRef]
- Hu, X.-B.; Di Paolo, E. An efficient genetic algorithm with uniform crossover for the multi-objective airport gate assignment problem. Stud. Comput. Intell. 2009, 171, 71–89. [Google Scholar]
- Kaliszewski, I.; Miroforidis, J.; Stanczak, J.T. Multiobjective optimization in the airport gate assignment problem, exact versus evolutionary multiobjective optimization. Comput. Sci. 2017, 18, 41. [Google Scholar] [CrossRef]
- Van Schaijk, O.R.; Visser, H.G. Robust flight-to-gate assignment using flight presence probabilities. Transp. Plann. Technol. 2017, 40, 928–945. [Google Scholar] [CrossRef]
- Lim, A.; Rodrigues, B.; Zhu, Y. Airport gate scheduling with time windows. Artif. Intell. Rev. 2005, 24, 5–31. [Google Scholar] [CrossRef]
- Padberg, M.; Rinaldi, G. A branch-and-cut algorithm for the resolution of large-scale symmetric traveling salesman problems. SIAM Rev. 1991, 33, 60–100. [Google Scholar] [CrossRef]


Publisher’s Note: MDPI stays neutral with regard to jurisdictional claims in published maps and institutional affiliations. |
© 2022 by the authors. Licensee MDPI, Basel, Switzerland. This article is an open access article distributed under the terms and conditions of the Creative Commons Attribution (CC BY) license (https://creativecommons.org/licenses/by/4.0/).