Article

Grain Size Curve Characteristics of 2nd Member of Sangonghe Formation in Qianshao Area and Its Indicative Significance of Hydrodynamic Environment

1
Exploration and Development Research Institute of PetroChina Xinjiang Oilfield Company, Karamay 834000, China
2
Faculty of Petroleum, China University of Petroleum—Beijing at Karamay, Karamay 834000, China
3
The State Key Laboratory of Petroleum Resources and Prospecting, China University of Petroleum—Beijing, Beijing 102249, China
*
Authors to whom correspondence should be addressed.
Appl. Sci. 2022, 12(19), 9852; https://doi.org/10.3390/app12199852
Submission received: 8 August 2022 / Revised: 25 September 2022 / Accepted: 26 September 2022 / Published: 30 September 2022
(This article belongs to the Section Energy Science and Technology)

Abstract

:
There are mainly two sedimentary types of the 2nd member of Jurassic Sangonghe Formation (J1s2) in the Qianshao area: shallow-water delta and sandy debris flow. In order to accurately understand the characteristics and further identify the difference of sedimentary microfacies, the characteristics of the grain size curve are analyzed. The results show that the cumulative probability curve of sandstone particle size in the research area mainly includes two basic types: tractive current type and sandy debris flow type. The tractive current type is mainly developed in the shallow-water delta front. Among them, the inner front subaqueous distributary channel microfacies develop two patterns: tri-segment pattern and one bouncing segment-one suspension segment-one complex transitional zone pattern. The transitional section is widely developed. There are two patterns in the subaqueous distributary channel microfacies of the outer front (bi-segment pattern and one bouncing segment-one suspension segment-one transitional zone pattern) and two patterns in the estuary bar microfacies (bi-bouncing segment-one suspension segment-one transitional zone pattern and one bouncing segment-one suspension segment-one transitional zone pattern). The main tractive current characteristics are higher bouncing component content and slope and lower suspended component content. The sand debris flow type mainly develops two patterns: one bouncing segment-one suspension segment-one transitional zone pattern and one bouncing segment-one suspension segment-one complex transitional zone pattern with lower jump component content and slope and higher suspended component content.

1. Introduction

Qianshao area is located in the east ring of the Well Pen-1 west sag in Junggar Basin, adjacent to the hydrocarbon rich sag, and is a favorable exploration area for natural gas with high hydrocarbon maturity and high gas-oil ratio. In 2019, the Well QS2 achieved a breakthrough of high production gas, indicating broad gas exploration potential. The Qianshao area is also a key exploration area for lithologic gas reservoirs in Junggar Basin. The type of sedimentary facies is an important controlling factor for the distribution of lithologic gas reservoirs, but there are academic disputes on the sedimentary facies model and the division of sedimentary microfacies of Jurassic Sangonghe Formation reservoirs in the Qianshao area. Recent research proposed a sedimentary model of lacustrine sandy debris flow in the sedimentary model study of the Jurassic Sangonghe Formation in the Well Pen-1 west sag [1,2,3]. The authors considered that the sandy debris flow sediments came from the braided river delta under the background of semi-deep lacustrine and deep lacustrine areas which are widely developed in the research area, and are controlled by two steps of slope break [1,2]. They also proposed that sandy debris flow sediments have the characteristics as follows: thick massive sandstone, floating mud gravel and torn mudstone fragments exist in the reservoir, and most of them are in clearly defined layers from top to bottom [3]. However, there are still some other views on the sedimentary model and facies in the research area. Many scholars believe that there are mainly shallow water delta deposits, leading to shallow-water delta outer front subfacies deposits [4,5,6]. The two views are mainly based on the special sedimentary facies marks of drilling coring, such as mud, gravel and torn mudstone cuttings. However, a single core facies mark often has multiple interpretations, which will lead to deviation in geological understanding. Therefore, more data and evidence are needed to determine the sedimentary facies type of the Jurassic Sangonghe Formation in Qianshao area.
The results of literature research show that detrital grain size analysis can distinguish sedimentary hydrodynamic conditions and is one of the methods and means for analyzing the sedimentary environment and sedimentary facies [7,8]. Scholars have conducted relevant studies on the characteristics of grain size curves of different sedimentary facies types and established corresponding grain size probability curve models [7,9,10]. The former researchers analyzed the grain size probability curve characteristics of the conglomerate in Yongbei area of Dongying Sag [11]. It is considered that the inner fan of the nearshore subaqueous fan mainly developed a broad convex arc pattern reflecting debris flow deposition and a bi-segment pattern reflecting high density turbidite deposition [11]. The braided channel in the middle of the fan mainly developed from a low-slope bi-segment reflecting high-density turbidity current deposition, and a high-slope one bouncing segment-one suspension segment-one transitional zone pattern reflecting low-density turbidity current deposition [11]. The deeply-cutting channels of the outer fan mainly develop a one bouncing segment-one suspension segment-one transitional zone pattern reflecting the conversion from high-density turbidity current to low density turbidity current [11]. After studying the grain size probability accumulative curve characteristics of the Paleogene delta depositional environment in Huimin Depression, the researchers believed that distributary channel microfacies in the delta plain developed typical bi-segment or tri-segment patterns, while the subaqueous distributary channel microfacies of the delta front mainly developed one bouncing segment-one suspension segment-one transitional zone pattern and low-slope multi-segments pattern [12]. There have two patterns of estuary sand bar microfacies: high-slope one bouncing segment-one suspension segment-one transitional zone pattern and one bouncing segment-one suspension segment -one transitional zone pattern [12]. At the same time, the authors also studied the fan delta sedimentary environment. They believed that the fan delta plain subfacies mainly developed 3 patterns: unpatched arc pattern, typical bi-segment pattern or tri-segment pattern, and fine-grained high-slope transitional pattern [12]. The subaqueous distributary channel microfacies of fan-delta front subfacies are mainly developed with one- segment and multi-segment patterns reflecting the gravity current and typical bi-segment pattern or tri-segment pattern reflecting the fluvial deposition [12]. Estuary sand bar microfacies are mainly developed with three patterns: low-slope tri-segments pattern, high-slope multi-bouncing segments-one suspension segment pattern and high-slope one bouncing segment-one suspension segment-one transitional zone pattern [12].
As regards sandy debris flow, some scholars have conducted exploration and research, but there is no perfect grain size probability curve model for sandy debris flow at present, and the method of using grain size probability curve to identify sandy debris flow is not very mature [13,14,15].
Therefore, the purpose of this study is to collect core samples from the 2nd member of Sangonghe Formation in Qianshao area for laser grain size analysis, to study the type and characteristics of grain size probability curve, and comprehensively identify the genetic type of sand bodies. Combined with the study of conventional logging facies and core facies markers, the sedimentary facies type of the study area will be determined. It will provide a reference for the discrimination of sedimentary microfacies types in other similar areas in the hinterland of Junggar Basin. At the same time, this study will contribute to enriching the grain size probability curve patterns of different sedimentary facies types and strengthening the application of grain size probability curve in sedimentary facies discrimination.

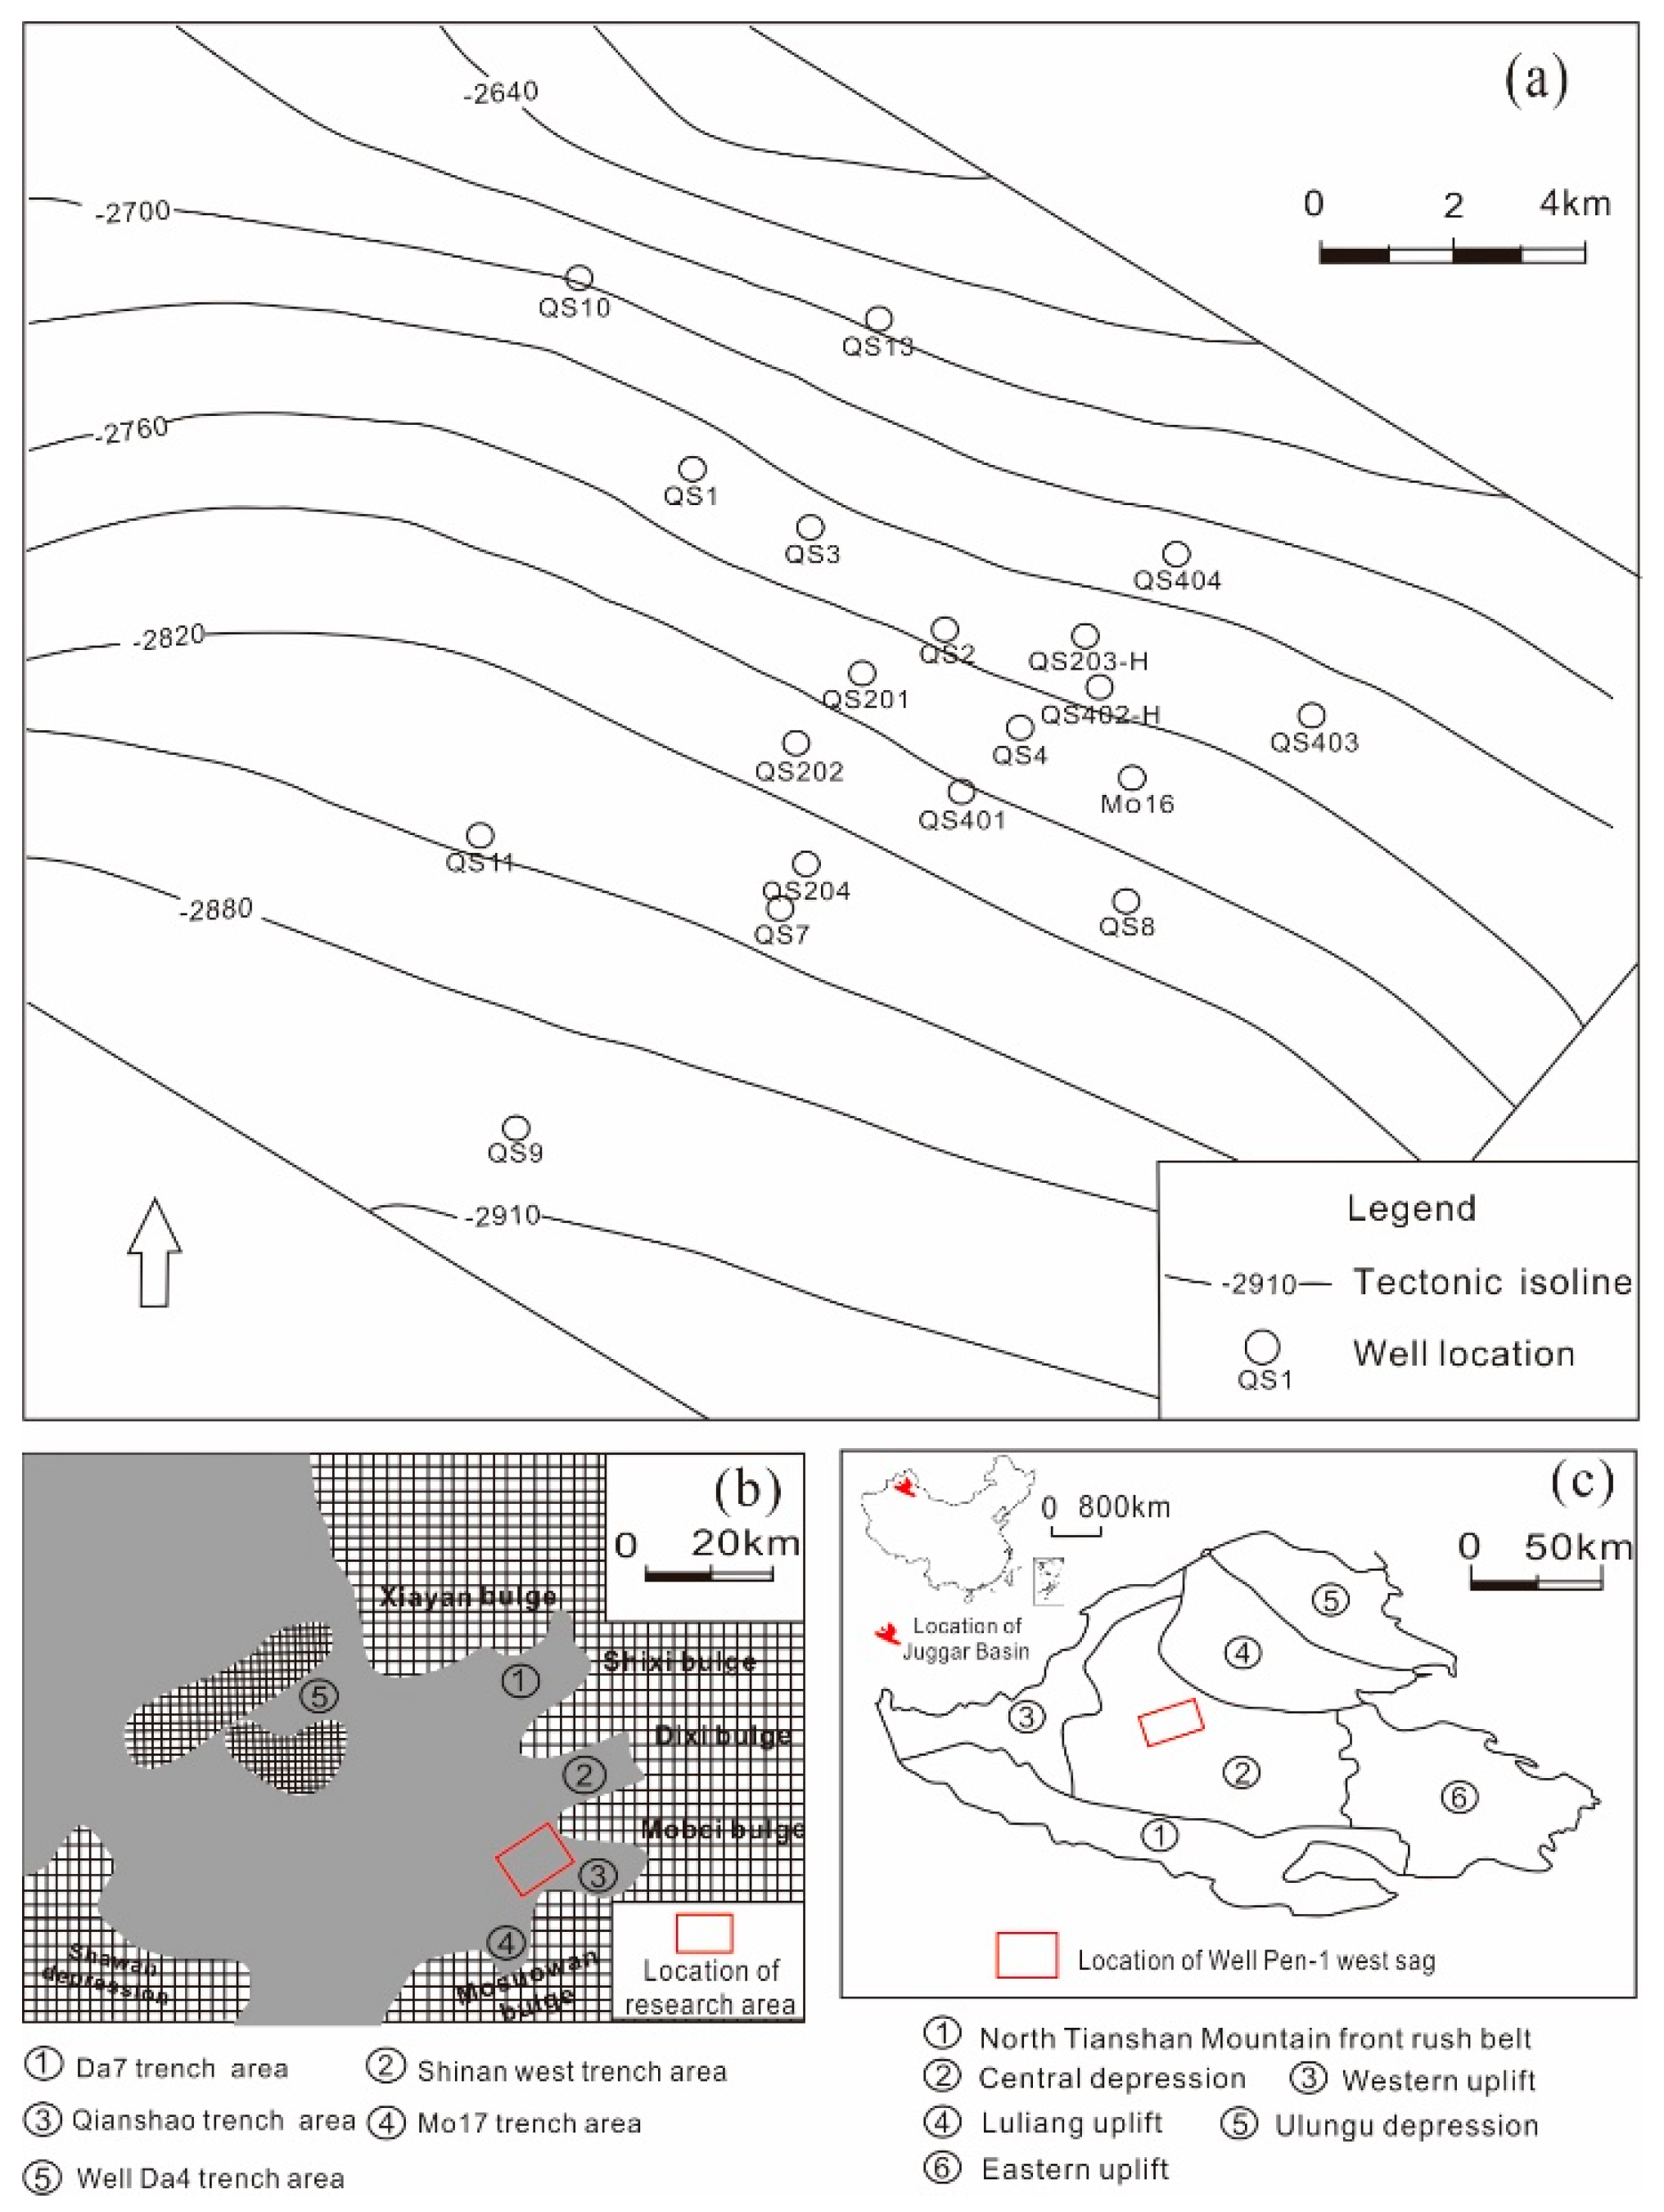
2. Geological Settings

Qianshao area is adjacent to Mobei uplift in the east, with the Mosuowan uplift in the south, the Shixi uplift in the northeast, and the Well Pen-1 west sag in the west (Figure 1). Since the Permian, the study area has experienced the late Hercynian rifting stage, the Indosinian–Yanshanian depression stage and the Himalayan regenerative foreland basin evolution stage [1,16]. Among them, the Yanshanian period is mainly characterized by stable settlement and a large range of deposits were received [1]. The stratums are fully and continuously developed from Paleozoic to Cenozoic [1]. The main target formation is the J1s2 Formation, which can be divided into the lower sub-member (J1s22) and the upper sub-member (J1s21) from the bottom to the top. The lower part of the J1s21 formation mainly develops the alternating layers of gray fine sandstone, argillaceous sandstone and mudstone, transitioning upward to gray, gray-green mudstone and silty mudstone; this is shown as positive rhythmic deposition under the background of lake expansion and forming a set of favorable facies reservoir-capping assemblages. The sandstone section is the most important gas-bearing layer system in this area, which is also the target stratum of this study.

3. Sample and Experimental Methods

The research samples used herein come from 8 coring wells in the research area. A total of 31 samples were collected for the laser particle size analysis experiment. The experiment was carried out in the state key laboratory of petroleum resources and prospecting in China University of Petroleum, Beijing. The detection instrument is Partica LA-950V2, a Japan Laser scattering particle size distribution analyzer. The samples were soaked in 10% HCl for 24 h to remove the calcium cement, filtered to remove the acid, and then dried in a constant temperature oven at 60 °C for 72 h. The dried samples were put into an agate mortar for grinding to completely separate the particles. About 1 g of samples was added to the instrument for particle size analysis.

4. Results

The grain size curves of the 31 samples were prepared; six grain size distribution patterns of the tractive current and sandy debris flow are summarized by analyzing the number of line segments, slope of line segments and percentage content of different grain size components. The hydrodynamic characteristics of different grain size curves are summarized below.

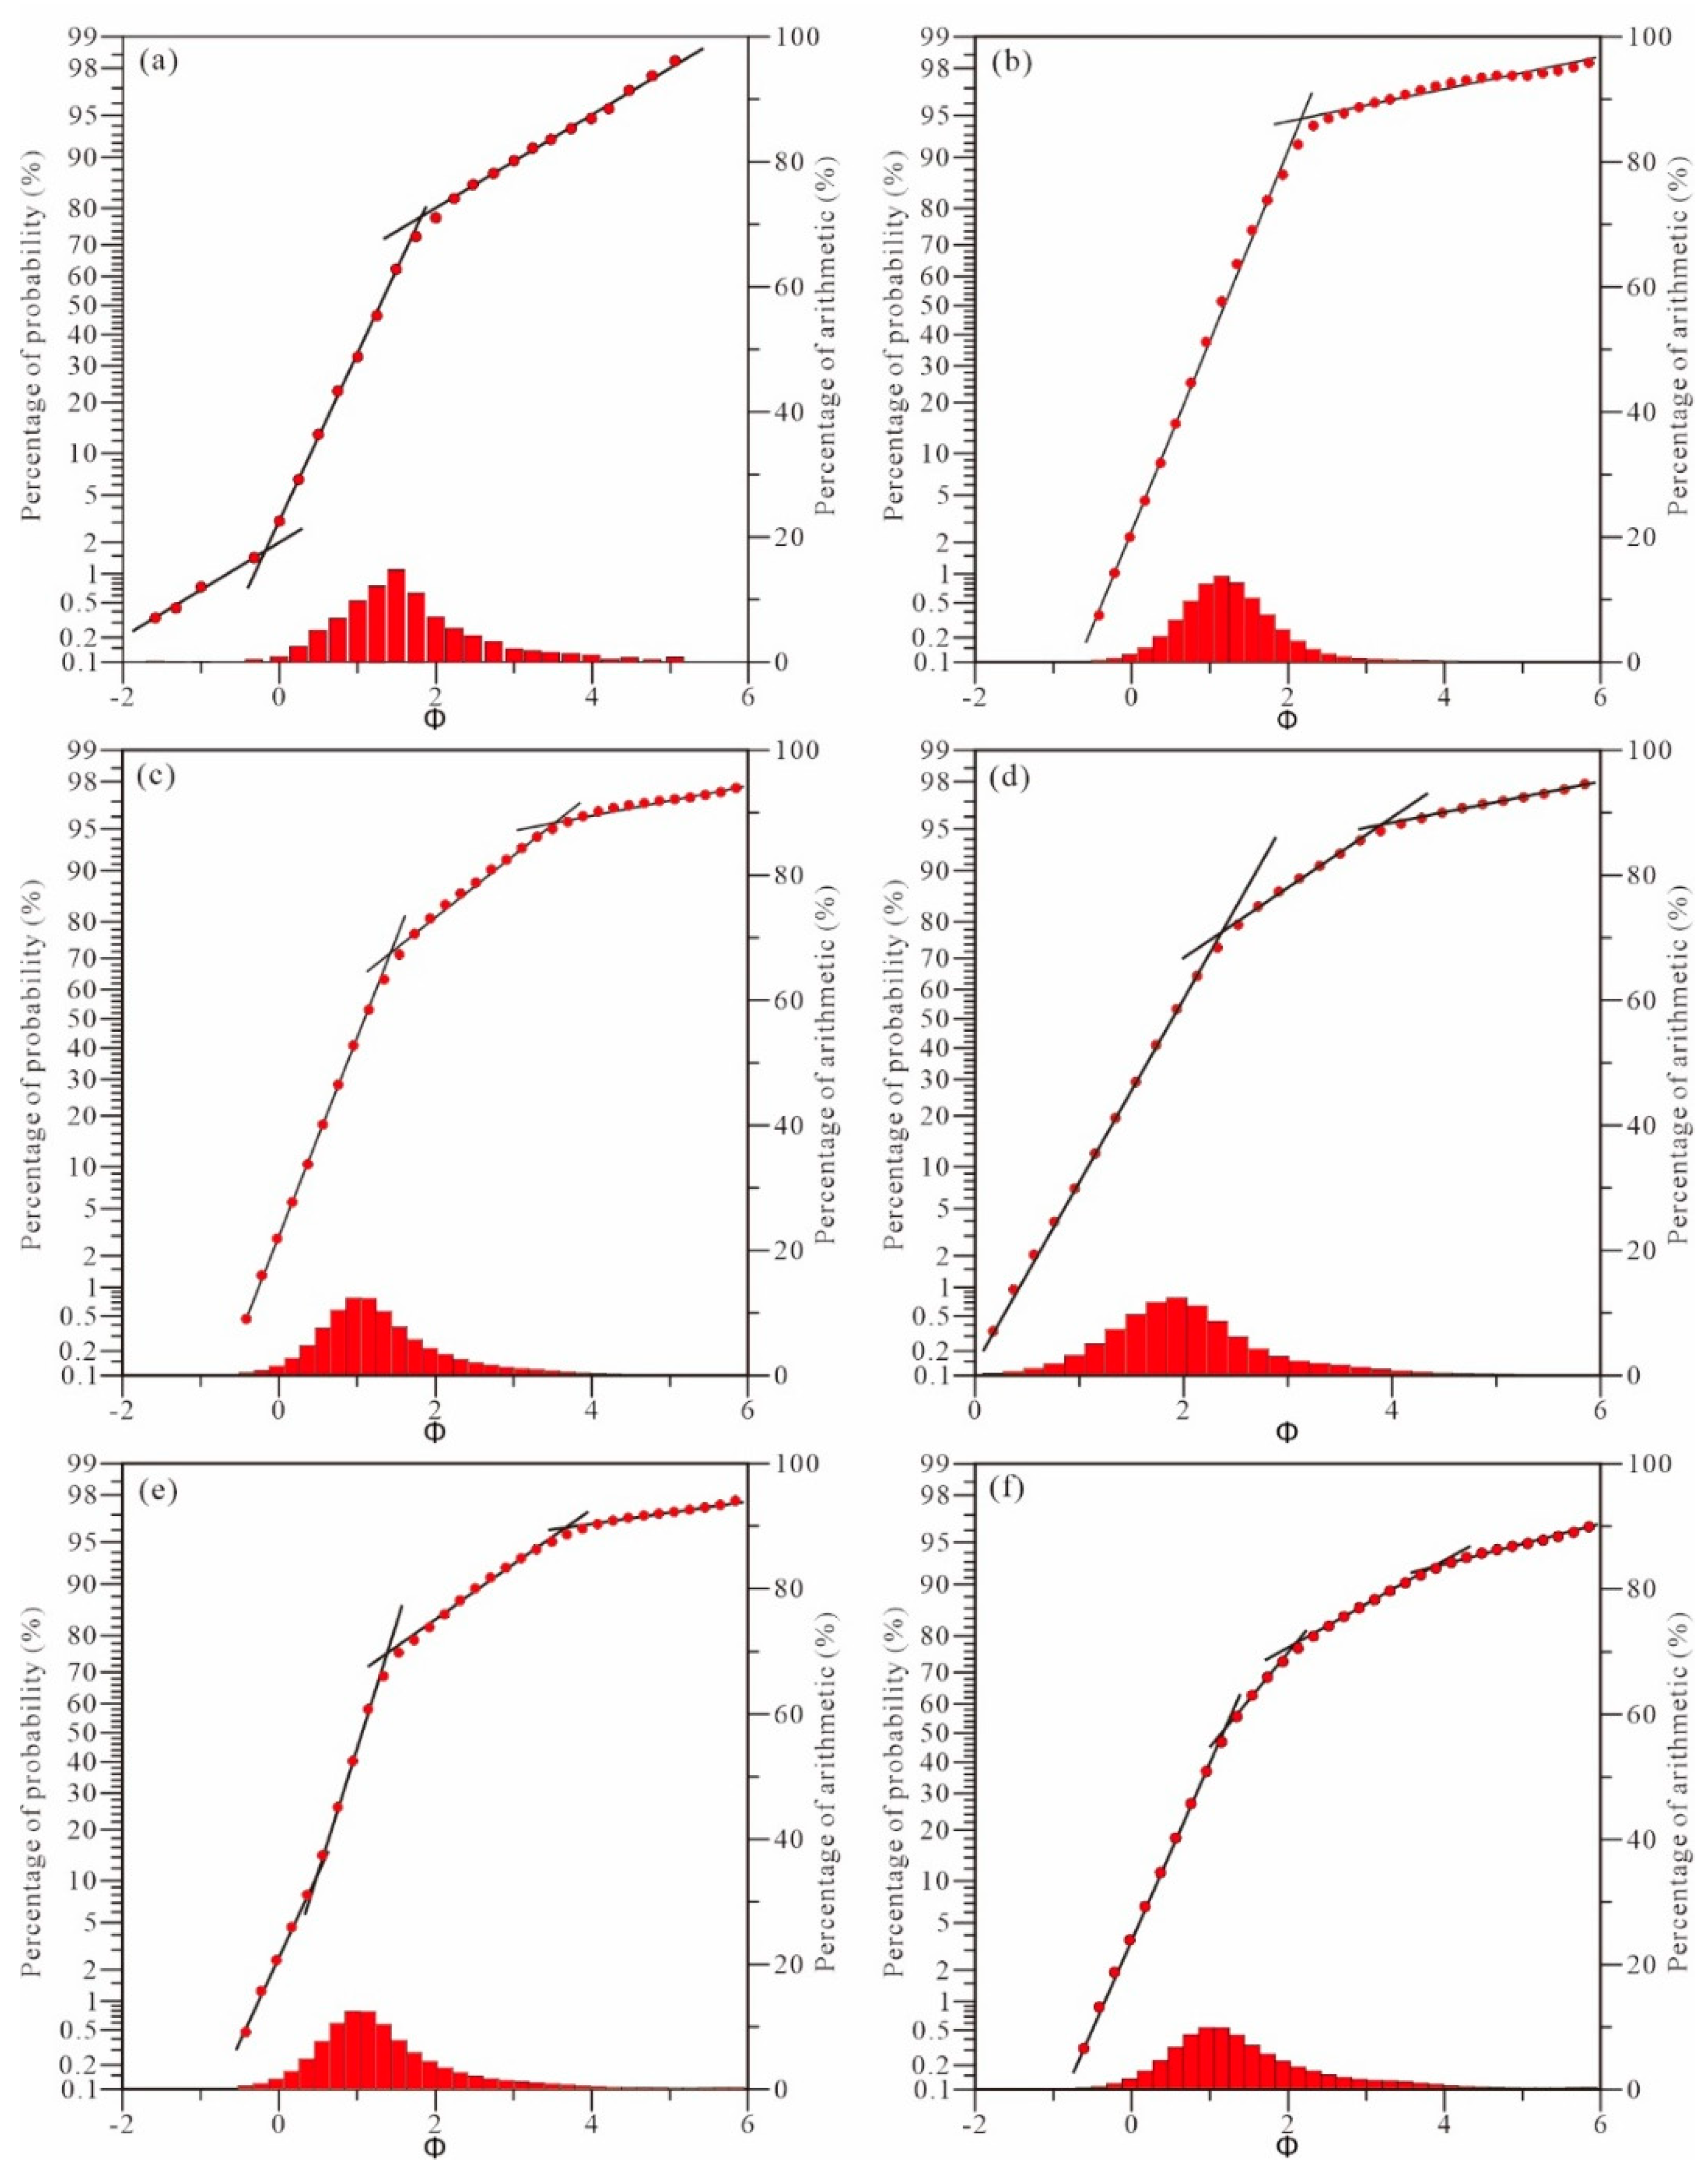
4.1. Tractive Current Type

4.1.1. Typical Tri-Segment Pattern

The curves of this pattern mainly reflect the characteristics of channel deposition with weakened hydrodynamic force. During the transportation process, the components that used to be jumping enter a phase of rolling transport, due to the continuous bifurcation of water currents and the gradual reduction of transport capacity [11]. The bouncing components are dominant in this pattern, generally comprising 75~80% of the total. The cut-off values of the bouncing segment with the rolling segment are −1~0 φ, and 1~2 φ with the suspension segment. The gradients of the bouncing segment are generally 60~70°, which means good sorting. The rolling components are mainly affected by the channel detention and sedimentation, with the lower contents less than 5% and poor sorting. The suspended component contents are about 20% and the suspension segment has gradients between 20° to 30° (Figure 2a).
The frequency distribution histograms are relatively concentrated and the peak values are about 1.5 φ with distribution range concentrated in 1.4–1.8 φ, which reflect typical characteristics of a channel sand body with relatively good sorting. The curves of this pattern mainly reflect a background of the gradual weakening of hydrodynamics during the continuous bifurcation process of a channel [11,12]. In the research area, this pattern mainly appears at the top of the sequence of subaqueous distributary channel microfacies in the shallow-water delta inner front (Figure 2a).

4.1.2. Typical Bi-Segment Pattern

The curves of this pattern mainly reflect the characteristics of typical river sediment, which have the bouncing segment with higher gradients and the suspension segment with lower gradients (Figure 2b). The bouncing components are dominant, with the content greater than 90%. The gradients of the bouncing segment are 65~75°, which means good sorting. The suspended component contents are 5~10% and the gradients of the suspension segment are less than 15°. The frequency distribution histograms are relatively concentrated and the distribution range is concentrated in the range of 0.8–1.4 φ, which shows typical characteristics of channel sand body deposition. The characteristics of high bouncing component content and low suspended component content mainly reflect the sedimentary characteristics of a stable channel [17]. In the research area, the curves of this pattern mainly appear at the subaqueous distributary channel microfacies in the shallow-water delta outer front.

4.1.3. One Bouncing Segment-One Suspension Segment-One Transitional Zone Pattern

The curves of this pattern mainly develop the bouncing components, the transitional components and the suspension components (Figure 2c,d). The bouncing component contents are between 60% and 80%, and the particles are mainly composed of coarse debris particles. The gradients of the bouncing segment concentrated at 60~70°, which has good sorting. The contents of the transitional component range from 15% to 25%, and the gradients of the transitional segment are about 30° to 40°, which means poor sorting. The cut-off values of the transitional segment range from 1 φ to 3 φ, and 3~4 φ with the suspension segment. The particle size span is large, and the transport mode is between progressive suspension transport and bouncing transport [11]. There is a much lower content of suspended components, mostly below 10%, and the gradients of the suspension segment are about 10° to 15°, which also means poor sorting. The curves of this pattern reflect the hydrodynamic characteristics of slow current speed and reduced energy in the process of forward transport of a stable river current into the lake basin in the dry season [11]. The transitional zone represents the environment with slow terrain slope and turbulent water body in the sedimentary period. In other words, high-density river water quickly settles, and the inclusion of debris particles has no time for sorting, so that the relatively coarse part enters the jumping component and becomes its thin end, while the smaller particles merge into the coarse end of the suspended component; its thick end bends to form a transitional section [18]. In the research area, curves of this pattern mainly occur in the subaqueous distributary channel and estuary bar microfacies of the shallow-water delta outer front.

4.1.4. Bi-Bouncing Segment-One Suspension Segment-One Transitional Zone Pattern

The curves of this pattern mainly consist of two bouncing segments with higher gradients, one suspension segment and one transitional zone (Figure 2e). The contents of bouncing components reached 70~80%, including 8~15% contents of the lower bouncing subpopulations and 65~70% contents of the upper bouncing subpopulations. The gradients of the two bouncing segments are similar and high (65~75°). The contents of the suspended component are less than 10% and are associated with lower gradients (10~15°). The contents of the transition section are 15~20% and the gradients are 25~35°. The frequency histogram distribution is concentrated in the range of 1.0–1.2 φ, which reflects good sorting. This pattern indicates that the sediment carried by the river is affected by the hydrodynamic forces in the lake such as the waves. In the research area, it mainly appears in the estuary bar microfacies of the shallow-water delta outer front.

4.1.5. One Bouncing Segment-One Suspension Segment-One Complex Transitional Zone Pattern

The curves of this pattern mainly consist of one bouncing segment, one suspension segment and one complex transitional zone (Figure 2f). The contents of the bouncing component are 50~60%, and the gradients of the bouncing segment are about 60~70°, which means medium sorting. The contents of suspended component are less than 10%, with associated gradients about 10~15°. The contents of the transitional component are up to 40~50%. The gradients of the transitional segments decreased with the increase of the φ values, which means sorting weakens gradually. The frequency histogram distribution tends to be scattered. However, the distribution interval is mainly concentrated in the range of 0.8–1.4 φ, which indicates that the sorting is relatively good. The curves of this pattern mainly reflect the rapid deposition environment in which lake hydrodynamic forces interact with strong river hydrodynamic forces during a flood period, and the channel is unstable. In the research area, the curves of this pattern mainly appear in the subaqueous distributary channel microfacies of the shallow-water delta inner front.

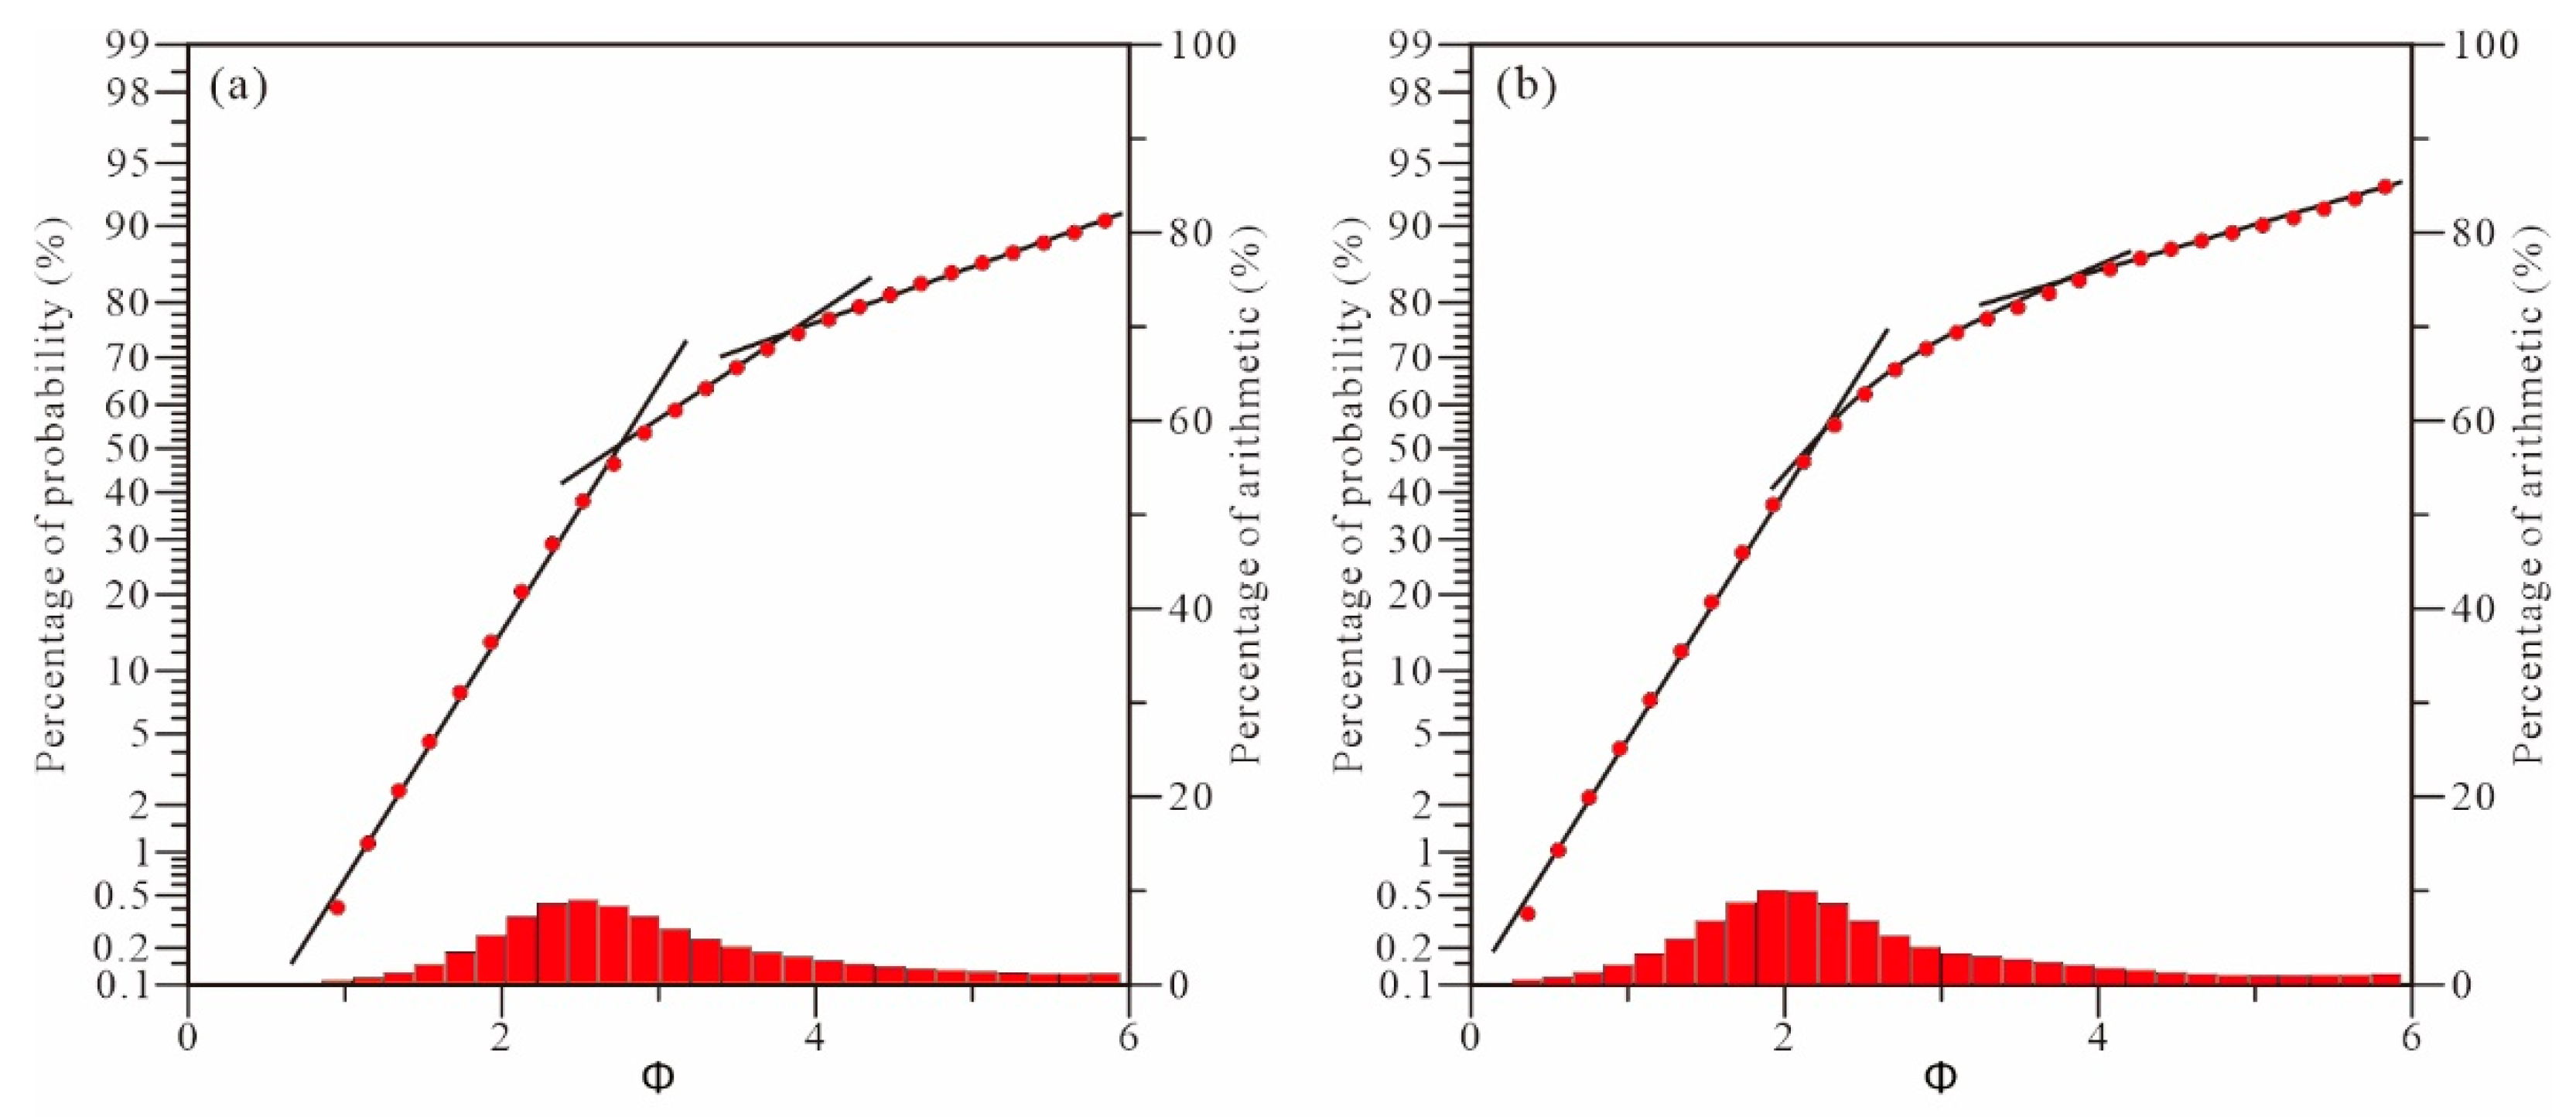
4.2. Sandy Debris Flow Type

4.2.1. One Bouncing Segment-One Suspension Segment-One Transitional Zone Pattern

Due to the rapid “freezing” overall transport and deposition mechanism of sandy debris flow, the sediments largely inherited the grain size distribution characteristics of the delta front sediments in the provenance area on the slope, so its grain size curve morphology also showed the one bouncing segment-one suspension segment-one transitional zone pattern (Figure 3a).
The contents of coarse debris are decreased after long distance transportation. At the same time, the contents of the bouncing component and the gradients of the bouncing segment are all decreased compared with the tractive current type. The contents of the suspended component increased significantly, ranging from more than 15% to 25%, representing a higher transport capacity. The frequency histograms have a wider distribution range with a peak value of 2–3 φ, and have an obvious “trailing” phenomenon. The components with high φ generally have a specific content, indicating complex water conditions and poor sorting. In the research area, this phenomenon is mainly present in the upper part of the single sandy debris flow deposition cycle.

4.2.2. One Bouncing Segment-One Suspension Segment-One Arc Transitional Zone Pattern

The overall shape of the curve of this pattern is similar to that of the “one bouncing segment-one suspension segment-one transitional zone” pattern, but the difference is that the transitional zone cannot be divided into straight segments with a broad convex arc shape (Figure 3b). The contents of the bouncing component are lower than 60%, with gradients about 55~60° of bouncing segment, which means medium sorting and the weak tractive current characteristics of sandy debris flow during the slip-slump process. The contents of the suspended component (generally 15~25%) and the gradients of the suspension segment (25~40°) are higher, which means poor sorting. The contents of the transitional component are 15~25% and the gradients of the transitional segment are 25~40°, which shows a rapid transport and deposition process.
Analysis of the hydrodynamic characteristics of the curves of this pattern suggests that this pattern is developed in the lower part of the single sandy debris flow deposition cycle. Influenced by the slope break of the research area, the sand body is transported to the slope break zone by water, and the coarse debris is quickly accumulated without sorting, thus forming a special transitional zone [11].
The characteristics of the frequency histogram of this pattern are similar to those of “one bouncing segment-one suspension segment-one transitional zone” pattern, and also have an obvious “trailing” phenomenon. The components with high φ value generally have a specific content, which shows the hydrodynamic background of weakening tractive current characteristics and rapid sediment deposition in the sliding and collapse process of sandy debris flow.

5. Discussion

Grain size is not only the most important structural characteristic of clastic rock particles, but also an important indicator to judge the sedimentary environment and hydrodynamic conditions. However, due to the complexity of hydrodynamic changes, similar hydrodynamic conditions can occur in different environments [19,20]. The grain size distribution is the most sensitive to hydrodynamic changes, and similar grain size distribution may occur in different environments. Therefore, it is necessary to consider both grain size and sedimentary structures. In this study, on the basis of the core facies markers, the grain size probability curve characteristics of different sedimentary microfasis in the research area are summarized.

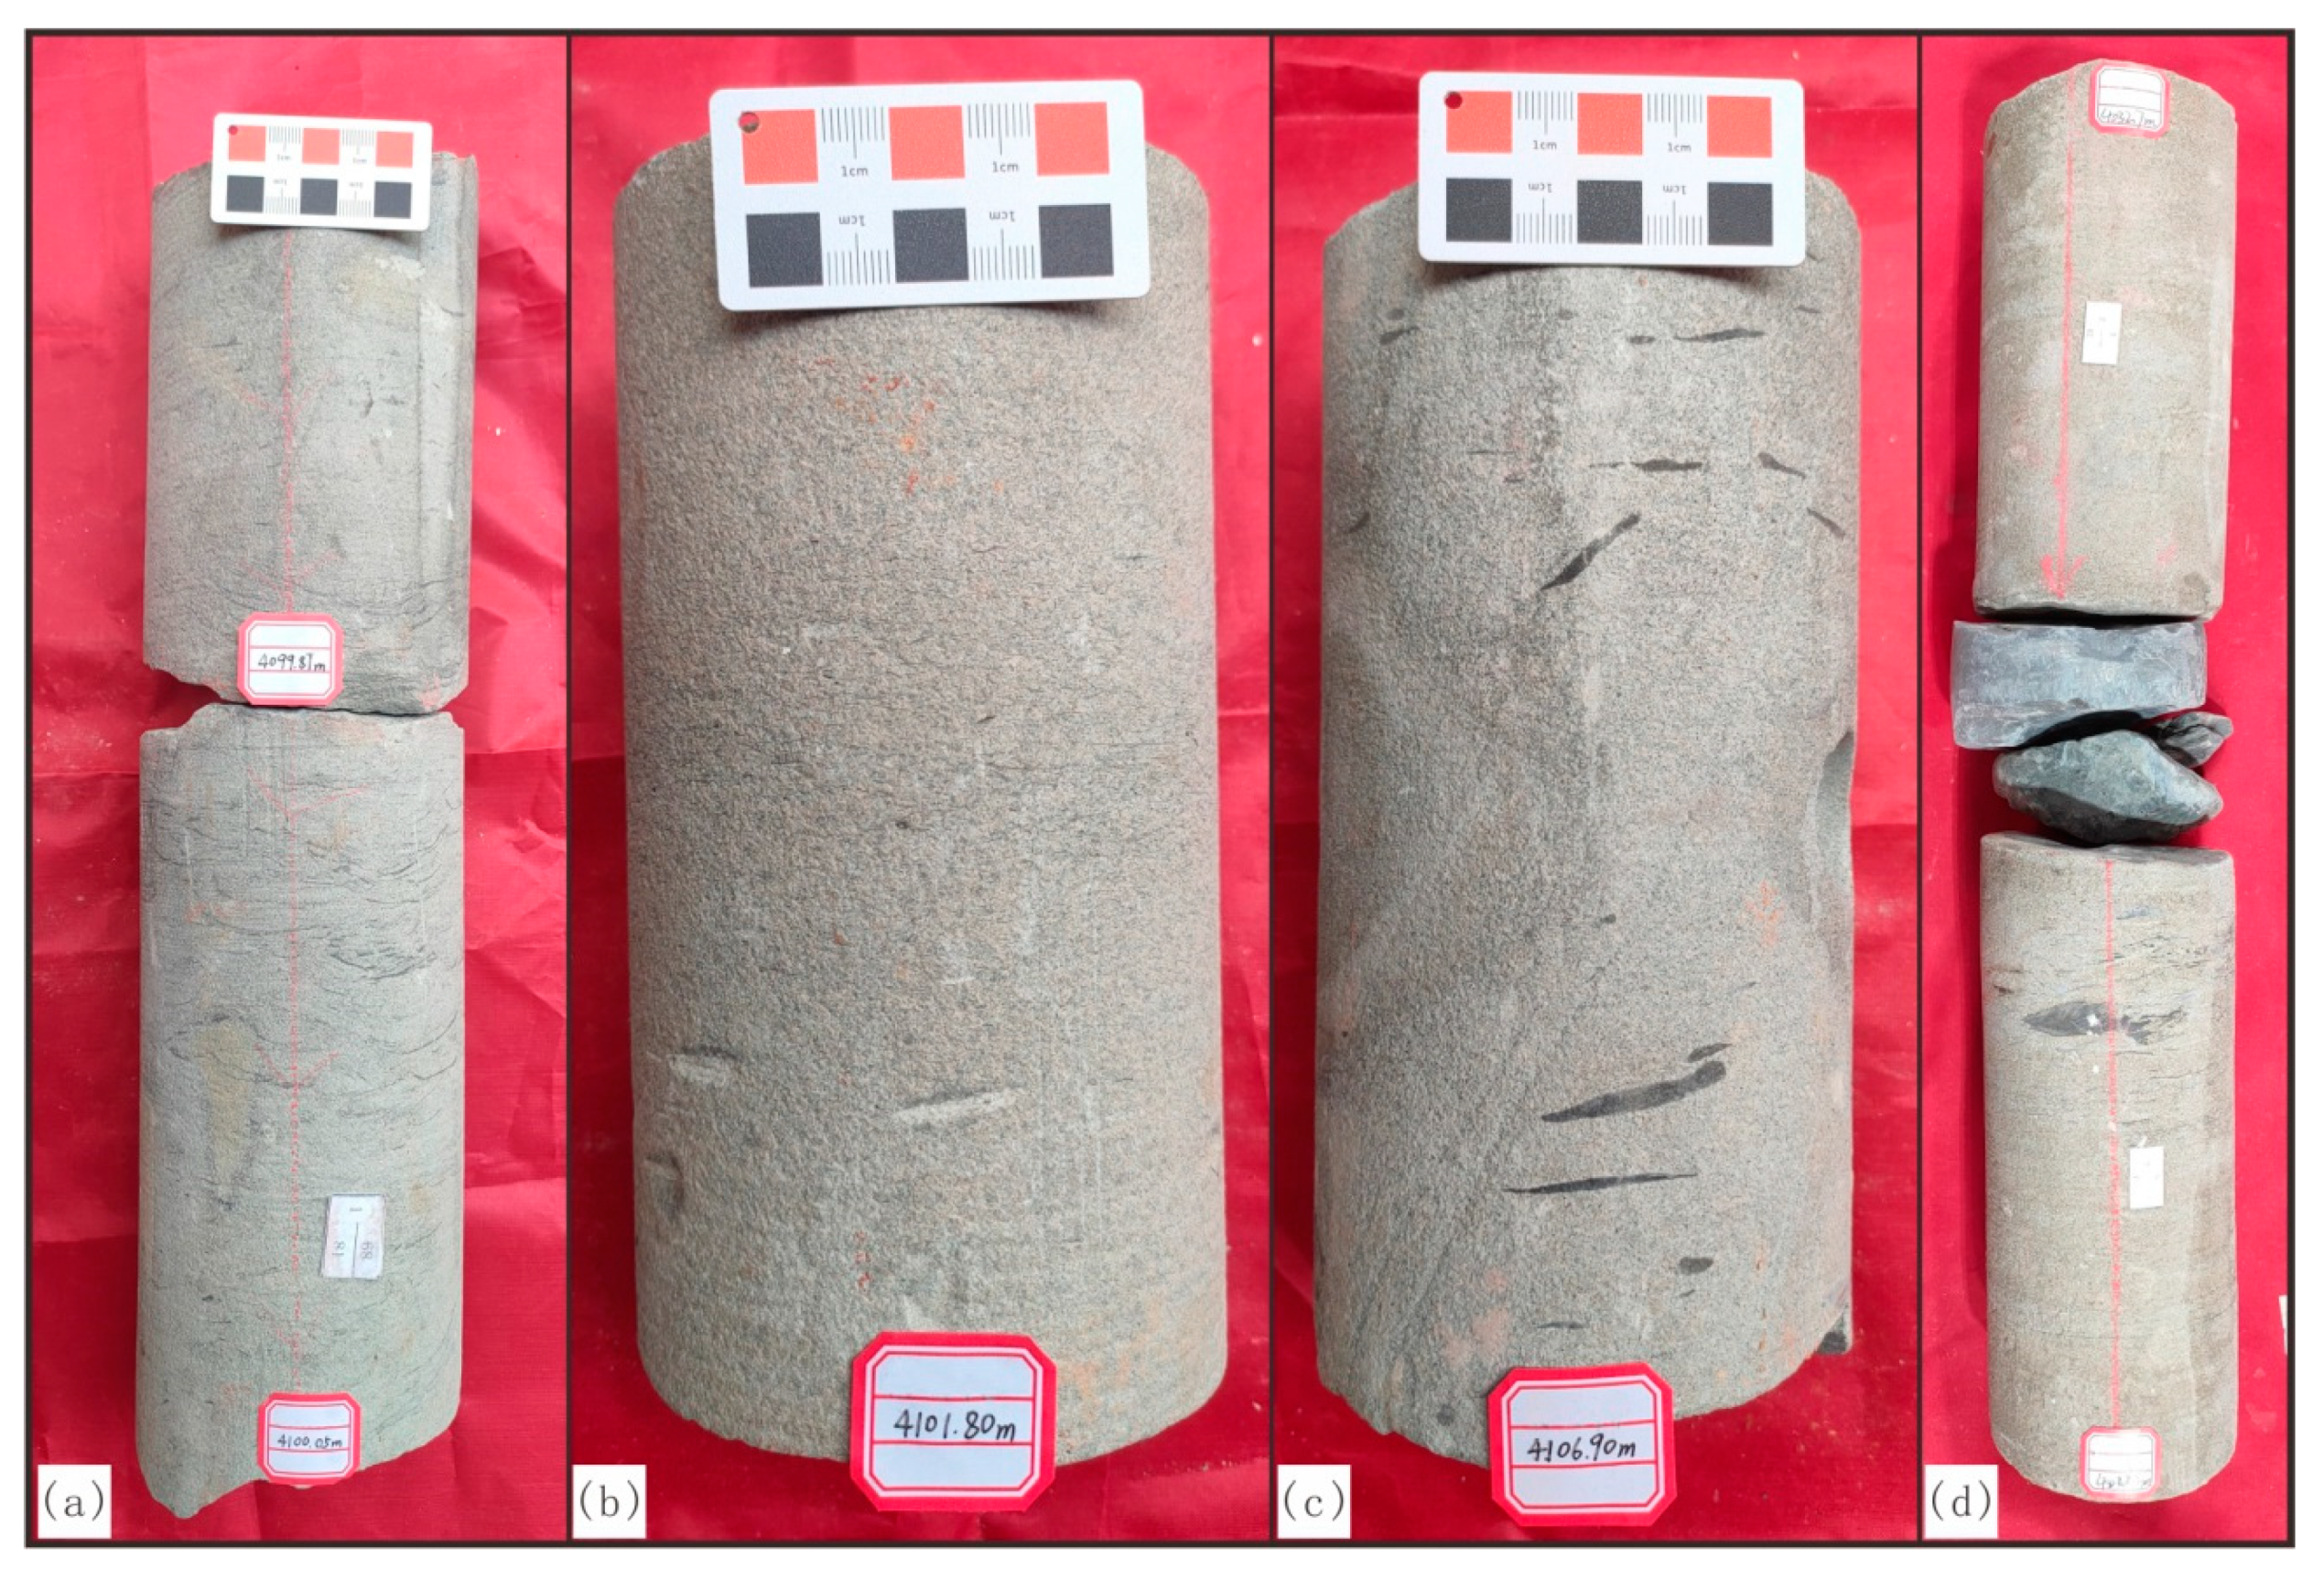
5.1. Sandy Debris Flow Deposits

The most representative characteristics of sandy debris flow are the massive sandstone with very low argillaceous content and the sandstone rich in mud gravel. At the same time, floating gravel, torn shale debris and “mud-coated intraclasts” features are also typical characteristics of sandy debris flow [18]. The sandy debris flow becomes turbid after long distance transport [21,22]; therefore, sandy debris flow shows both tractive current and gravity current characteristics in terms of fluid properties. The grain size probability curves have the patterns of “one bouncing segment-one suspension segment- one transitional zone” and “one bouncing segment- one suspension segment-one arc transitional zone” with the characteristics of higher content of the suspended component and lower content of the bouncing component, together with higher gradients in the suspension segment and lower gradients of the bouncing segment.

5.1.1. The Lower Part Microfacies of the Single Sandy Debris Flow Deposition Cycle

These microfacies have the characteristics of fast depositional rate, strong scouring effect and abundant deformation structures under the background of strong hydrodynamic conditions and the scouring of the coarse debris sediment affecting the early deposited lacustrine mudstone (Figure 4) [23]. The core shows the slump deformation structure (Figure 4a,b), the scour surface structure (Figure 4c), and a large scale of mud gravels which may account for the overall scouring of early lacustrine mudstones (Figure 4d). The grain size probability curves are mainly presented as “one bouncing segment-one suspension segment-one transitional zone” pattern. The higher contents of suspended component and low gradients of bouncing segment also reflect the characteristics of rapid deposition of gravity flow.

5.1.2. The Upper Part Microfacies of the Single Sandy Debris Flow Deposition Cycle

This microfacies show a the weak deformation of the shaley lamina or carbonaceous (Figure 5a), massive sandstone (Figure 5b), flattened sheets of gravel “floating” in massive sandstone (Figure 5c) and lithologic abrupt changes at the top (Figure 5d) reflecting the reduction of the hydrodynamic force during the late period of the debris flow slump. The grain size probability curve mainly shows “one bouncing segment-one suspension segment-one transitional zone” pattern, and also shows the characteristics of rapid deposition of gravity flow with higher contents of suspended component and low gradients of bouncing segment.

5.2. Shallow-Water Delta Deposits

Because of the terrain slope, the rise and fall of the lake level during flood season and dry season can often lead to a wide range of exposed areas on the shallow-water delta. The frequently exposed areas are usually called shallow-water delta inner front subfacies. They mainly comprise distributary channel sediments for the reason that the estuarine bar sediments formed during flood season could be easily scoured by the distributary channel during dry season. The areas always below the lake level during both flood season and dry season are called as shallow-water delta outer front subfacies, and develop the distributary channel microfacies and estuarine bar microfacies. However, the estuarine bar sediments could also be scoured by the distributary channel for the shallow water and terrain slope. Therefore, the shallow-water delta outer front subfacies are still dominated by subaqueous distributary channel microfacies, and a small amount of estuary bar microfacies are developed [24,25,26].

5.2.1. Subaqueous Distributary Channel Microfacies of Shallow-Water Delta Inner Front

This microfacies is mainly developed between the average high lake level and the average low lake level of the evolution of the flood period and the dry period, respectively, with a sedimentary background of being sometimes above water and sometimes under water. The distributary channel is very developed. In addition, due to the decrease of accommodating space during the evolution from flood period to dry period, the channel formed in the late period has a strong erosion and destruction effect on the channel and estuary sand bars formed in the early period; thus, a large number of scour surface structures can be seen (Figure 6a,b). Vertically, it is characterized by multi-period and incomplete channel superposition (Figure 6c).
The grain size probability curves of the subaqueous distributary channel microfacies mainly show “one bouncing segment- one suspension segment- one complex transitional zone” pattern, which reflects the hydrodynamic background of rapid transport and deposition. The complex transitional zone is the result of the superposition of multi-stage incomplete channels. As the distributary channel continues to move forward, new branches are constantly generated, resulting in weakening of the hydrodynamics, and part of the components originally transported by jumping are transformed into rolling transport, which creates a tri-segments pattern on the grain size probability curve.

5.2.2. Subaqueous Distributary Channel Microfacies of Shallow-Water Delta Outer Front

This microfacies is mainly developed under the average low lake level in dry season. At this time, the accommodation space increases relative to the inner front subfacies, the distributary channel is relatively stable, and the scour surface structure can be seen (Figure 7a). The sedimentary structures of typical channel deposits such as parallel bedding (Figure 7b,c) and wedge cross bedding (Figure 7d) can be seen in the sandstone. The grain size probability curves show a bi-segment pattern of typical channel deposition. However, terrigenous clastic sediments could be deposited quickly before sorting because of the action of lake water; a “one bouncing segment-one suspension segment-one transitional zone” pattern could also appear in this microfacies.

5.2.3. Estuarine Bar Microfacies of Shallow-Water Delta Outer Front

The microfacies is mainly caused by movements at the top of the lake water after the distributary channel sediments enter the lake basin, when the terrigenous clastic sediments unload and form estuary sand bars. Due to the scour and reflux action of lake waves, the bouncing component developed into two subpopulations, which showed “bi-bouncing segment-one suspension segment-one transitional zone” pattern. The gradients of the two bouncing subpopulations have little difference because the action intensity of river water is higher than that of lake water. The formation of a transitional segment is also the result of the rapid deposition of sediments influenced by the lake hydrodynamics under the background of terrain slope, shallow water and fast river velocity.
In addition, due to the limited hydrodynamic action of the lake, most of the bouncing components of estuarine bars do not show the characteristics of scour and reflux action, and the grain size probability curve is still characterized by “one bouncing segment-one suspension segment-one transitional zone” pattern.

5.3. Difference Analysis of Grain Size Probability Curves of Different Microfacies

Because of the differences in hydrodynamic properties between shallow-water delta and sandy debris flow deposits, the characteristics of the grain size probability curves are also different. Based on the identification of sedimentary microfacies by sedimentary facies markers, this study compares the grain size curves of different sedimentary microfacies in terms of curve shape, content of different grain size components, and gradients of different segments, etc. (Table 1).
In terms of fluid properties, the sandy debris flow generally shows the common characteristics of gravity current and traction current, and the grain size probability curves are dominated by “one bouncing segment-one suspension segment-one transitional zone” pattern and “one bouncing segment-one suspension segment-one arc transitional zone” pattern. The flow is characterized by the lower bouncing component content (52~64%) (Table 1, Figure 8a), the higher suspended component content (16~25%) (Table 1, Figure 8c), the lower gradients of the bouncing segment (55~60°) (Table 1, Figure 8d), and higher gradients of the suspension segment (15~20°) (Table 1, Figure 8f). The grain size frequency histogram also shows a wide distribution range, and components with high φ values generally have a specific content. There is an obvious “trailing” phenomenon, especially in the content of suspended components. All of these reflect the characteristics of fast deposition rate and weak mechanical differentiation of sandy debris flow in the sliding and slumping transport process.
The shallow-water delta deposits are generally characterized by traction current, but there are some differences between inner front subfacies and outer front subfacies.
The subaqueous distributary channel microfacies are dominant in the inner front subfacies of the shallow-water delta, and the sediment of this microfacies shows the characteristics of frequent river diversion and erosion damage to the early river channel under the background of the lake level changes during flood and dry seasons. The grain size probability curves of the inner front subfacies show a tri-segments pattern and “one bouncing segment-one suspension segment-one complex transitional zone” pattern with higher content of transitional components (34~40%) (Figure 8b).
The shallow-water delta outer front subfacies mainly include subaqueous distributary channel microfacies and estuarine bar microfacies, which show the characteristics of a delta dominated by fluvial sedimentation with weak lake hydrodynamic action. The grain size probability curves of the subaqueous distributary channel microfacies in the outer front show “one bouncing segment-one suspension segment-one transitional zone pattern” and bi-segments pattern, which is characterized by higher bouncing component content (51~96%) and bouncing segment gradients (58~64°) (Table 1, Figure 8a,d). The grain size probability curves of the estuarine bar microfacies in the outer front area are shown as “bi-bouncing segment-one suspension segment-one transitional zone” pattern and “one bouncing segment-one suspension segment-one transitional zone” pattern with higher gradients of transitional segment (Table 1, Figure 8e).
In shallow-water deltas, transitional components are generally developed, which also indicates that the shallow-water deltas are characterized by fast river velocity and rapid deposition of sediments under the action of the lake hydrodynamics.

6. Conclusions

  • There mainly develop two types of sedimentary facies in the study area: shallow water delta and sandy clastic flow. The evolution process from the inner front to the outer front of the shallow water delta reflects the hydrodynamic conditions that the lake hydrodynamic force gradually increases and the river hydrodynamic force gradually weakens. The sandy debris flow deposits at the front of the delta mainly show the unique hydrodynamic background in which traction current and gravity flow coexist.
  • The grain size probability curve patterns of shallow water delta and sandy debris flow deposits are similar, but there are obvious differences in suspended component content and sediment sorting. Due to the effects of lake water conditions, shallow-water delta deposits generally have a certain content of transitional components, with good overall sorting and low content of suspended components. However, due to the gravity effect, the sandy debris flow deposits show the characteristics of generally high content of suspended components and generally biased sediment sorting.
  • In the process of sedimentary facies research, the use of grain size probability curves can effectively identify the types of sedimentary facies and reduce the uncertainty of sedimentary facies identification.

Author Contributions

Writing—original draft preparation, Q.G. and J.T. and H.L.; Methodology, T.X. and T.S.; Software, J.T.; Validation, D.L. and P.Q. Formal analysis, J.T.; Investigation, J.T. and H.L. Resources, D.L. and P.Q.; Data curation, T.X.; Writing—review and editing, T.X. and T.S.; Supervision, W.Y. and D.L.; Project administration, D.L. and T.X.; Funding acquisition, W.Y. All authors have read and agreed to the published version of the manuscript.

Funding

This research was funded by Department of Science and Technology of Xinjiang Uygur Autonomous Region (grant number 2020D01A141).

Informed Consent Statement

Informed consent was obtained from all subjects involved in the study.

Acknowledgments

This project is supported by the natural science foundation of Xinjiang Uygur Autonomous Region (2020D01A141). At the same time, we sincerely appreciate the support of the research and innovation team of hydrocarbon generation and reservoir formation in superimposed basin of China University of Petroleum-Beijing at Karamay.

Conflicts of Interest

The authors declare no conflict of interest.

References

  1. Sun, J.; Xue, J.J.; Hou, F.G.; Wu, A.C.; Song, M.X.; Zhu, F. Sedimentary characteristics and model of sandy debris current in depression area of lacustrine basin: A case study of the Jurassic Sangonghe formation in the western well Pen-1 sag, Junggar basin. J. China Univ. Min. Technol. 2019, 48, 858–869. [Google Scholar]
  2. Hou, F.G.; Xu, Y.; Sun, J.; Wang, L.H.; Song, M.X.; Guo, H.J.; Li, Y.Z.; Chen, Y. Sedimentary model from delta front to deep water area and its significance: A case study of the first sand group of Member 2 of Sangonghe Formation in the Well Pen-1 West sag, Junggar Basin. Acta Pet. Sin. 2019, 40, 1223–1232. [Google Scholar]
  3. Fei, L.Y.; Wang, S.L.; Wu, T.; Wang, F.; Yu, C.H.; Li, Y.G.; Feng, C. Control of slope break zone on sandy debris current deposition: A case study of Jurassic Sangonghe Formation in west sag of Well Pen-1 and its periphery in Junggar Basin. Pet. Geol. Recover. Effic. 2020, 27, 26–34. [Google Scholar]
  4. Xu, G.H.; Shi, H.G.; Ren, X.C.; Deng, X.B. Characteristics of hydrocarbon accumulation and its controlling factors in Jurassic Sangonghe Formation in the east slope of Well Pen-1 Western Depression in Junggar Basin. Sci. Technol. Eng. 2015, 15, 23–28. [Google Scholar]
  5. Zheng, S. Sedimentary pattern of the Shallow-water delta in the Sangonghe Formation of cengtral Junggar Basin and its significance for hydrocarbon exploration. Spec. Oil Gas Reserv. 2019, 26, 87–93. [Google Scholar]
  6. Fei, L.Y.; Wang, S.L.; Su, C.; Liu, Y.; Liu, L.; Jiang, Z.Q.; Yang, M.Y.; Li, Y.G.; Peng, H.J. A research on the condition of the reservoir formation and the rule of Oil and gas accumulation of Sangonghe Formation in slope belt of Pen 1 Well West Sag. Nat. Gas Geosci. 2022, 33, 708–719. [Google Scholar]
  7. Zhang, X.N.; Zhang, H.C.; Chang, F.Q.; Xie, P.; Li, H.Y.; Wu, H.; Ouyang, C.T.; Liu, F.W.; Peng, W.; Zhang, Y.; et al. Long-range transport of aeolian deposits during the last 32 kyr inferred from rare earth elements and grain-size analysis of sediments from Lake Lugu, Southwestern China. Palaeogeogr. Palaeoclimatol. Palaeoecol. 2021, 567, 110248. [Google Scholar] [CrossRef]
  8. Ashraf, U.; Zhang, H.C.; Anees, A.; Mangi, H.N.; Ali, M.; Zhang, X.N.; Imraz, M.; Abbasi, A.S.; Abbas, A.; Ullah, Z.; et al. A Core Logging, Machine Learning and Geostatistical Modeling Interactive Approach for Subsurface Imaging of Lenticular Geobodies in a Clastic Depositional System, SE Pakistan. Nat. Resour. Res. 2021, 30, 2807–2830. [Google Scholar] [CrossRef]
  9. Zhang, X.N.; Zhang, H.C.; Chang, F.Q.; Ashraf, U.; Peng, W.; Wu, H.; Liu, Q.; Liu, F.W.; Zhang, Y.; Duan, L.Z. Application of Corrected Methods for High-Resolution XRF Core Scanning Elements in Lake Sediments. Appl. Sci. 2020, 10, 8012. [Google Scholar] [CrossRef]
  10. Zhang, X.N.; Zhang, H.C.; Chang, F.Q.; Xie, P.; Li, H.Y.; Wu, H.; Ouyang, C.T.; Liu, F.W.; Peng, W.; Zhang, Y.; et al. Sedimentary grain-size record of Holocene runoff fluctuations in the Lake Lugu watershed, SE Tibetan Plateau. Holocene 2020, 20, 346–355. [Google Scholar] [CrossRef]
  11. Wang, Z.K.; Li, Y.Z.; Cao, Y.C.; Wang, Y.Z.; Yang, T.; Zhao, B. Probability cumulative grain-size distribution curves and their implications for sedimentary environment identification of coarse clastic rocks of the Es3 in Yongbei area, the Dongying Sag, Bohai Bay Basin. Oil Gas Geol. 2017, 38, 230–240. [Google Scholar]
  12. Yuan, J.; Du, Y.M.; Li, Y.N. Probability cumulative grain size curves in terrigenous depositional environments of the Paleogene in Huiming Sag. Pet. Explor. Dev. 2003, 30, 103–106. [Google Scholar]
  13. Han, Z.Z.; Liu, F.W.; Gao, L.H.; Xia, D.; Han, M.; Li, H. Sandy debris-current sedimentary characteristics of middle-Es3 in Linbei Step-fault zone of Huimin depression. J. Shandong Univ. Sci. Technol. 2016, 35, 1–7. [Google Scholar]
  14. Li, Z.Y.; Xu, Y.Z.; Deng, J.; Li, Z.M.; Zhang, J.W.; Li, Y.Y. Microscale sedimentary characteristics and distinguishing methods for deep-vater sandy debris current and turbidity current in continental lakes: A case study of seventh member of Yanchang Formation, Ordos Basin. Pet. Geol. Exp. 2021, 43, 415–423. [Google Scholar]
  15. Lou, H. Research on the Sandy Debris-Current Sedimentary Characteristics of the Paleogene in the South of Nanpu Sag. Master’s Thesis, Northeast Petroleum University, Daqing, China, 2015. [Google Scholar]
  16. Lu, B.; Zhang, J.; Li, T.; Lu, M.A. Analysis of tectonic framework in Junggar basin. Xinjiang Pet. Geol. 2008, 29, 283–289. [Google Scholar]
  17. Yuan, W.F.; Chen, S.Y.; Zeng, C.M.; Yan, J.H. Probability cumulative grain size curves in terrigenous of the Tertiary in west Qaidam Basin. J. Univ. Pet. China 2005, 29, 12–18. [Google Scholar]
  18. Yang, F.; Zou, N.N.; Shi, J.A.; Long, G.H.; Jiang, H.; Liu, S.Q.; Du, Z.M.; Xu, Y.; Li, Y.F. Probability cumulative grain size curves in the paleogene clastic sediments and environmental significance in maxian region of northern Qaidam basin. Nat. Gas Geosci. 2013, 24, 690–700. [Google Scholar]
  19. Ashraf, U.; Zhu, P.M.; Yasin, Q.; Anees, A.; Imraz, M.; Mangi, H.N.; Shakeel, S. Classification of reservoir facies using well log and 3D seismic attributes for prospect evaluation and field development: A case study of Sawan gas field, Pakistan. J. Pet. Sci. Eng. 2019, 175, 338–351. [Google Scholar] [CrossRef]
  20. Anees, A.; Zhang, H.C.; Ashraf, U.; Wang, R.; Liu, K.; Yasin, Q.; Anees, A.; Abbas, A.; Ullah, Z.; Zhang, X.N.; et al. Sedimentary Facies Controls for Reservoir Quality Prediction of Lower Shihezi Member-1 of the Hangjinqi Area, Ordos Basin. Minerals 2022, 12, 126. [Google Scholar] [CrossRef]
  21. Jin, J.H.; Cao, Y.C.; Wang, J.; Yang, T.; Zhou, L. Deep-water sandy debris current deposits: Concepts, sedimentary processes and characteristics. Geol. Rev. 2019, 65, 689–702. [Google Scholar]
  22. Yang, K.; Zhu, X.M.; Liu, Y.; Liu, X.Z.; Guo, F. Key signatures of turbidite and sandy debris and core examples in Liaohe Basin. J. Palaeogeogr. 2020, 22, 483–492. [Google Scholar]
  23. Anees, A.; Zhang, H.C.; Ashraf, U.; Wang, R.; Liu, K.; Mangi, N.; Jiang, R.; Zhang, X.N.; Liu, Q.; Tan, A.C.; et al. Identification of favorable zones of gas Accumulation via fault distribution and sedimentary facies: Insights from Hangjinqi Area, Northern Ordos Basin. Front. Earth Sci. 2022, 9, 822670. [Google Scholar] [CrossRef]
  24. Lou, Z.H.; Lan, X.; Lu, Q.M.; Cai, X.Y. Control of the topography, climate and lake level fluctuation on the depositional environment of a shallow-water delta: A case study of the Cretaceous Putaohua reservoir in the northern part of Songliao basin. Acta Geol. Sin. 1999, 73, 83–92. [Google Scholar]
  25. Li, Y.H.; Liu, C.Y.; Du, Y.G.; Wang, X.J.; Huang, J.X. Sedimentary characteristics of shallow water delta and lake shoreline control on sand bodies of Chang8 oil-bearing interval of the Upper Triassic Yanchang Formation in northwestern Ordos Basin. J. Palaeogeogr. 2009, 11, 265–274. [Google Scholar]
  26. Wu, X.H.; Lv, X.X.; Zhou, X.H.; Zhang, J.; Shi, C.E. Depositional characteristics and hydrocarbon exploration significance of shallow deltas in the Yellow River Mouth Sag. Oil Gas Geol. 2010, 31, 165–172. [Google Scholar]
Figure 1. Structural location map of Qianshao area. (a) Well location distribution map of Qianshao area; (b) Structural unit distribution map of Well Pen-1 west sag; (c) Structural unit distribution map of Junggar Basin.
Applsci 12 09852 g001
Figure 2. Grain size curves of tractive current type. (a) Well M16, 4041.80 m, tri−segment pattern, subaqueous distributary channel microfacies of shallow−water delta inner front; (b) Well QS402, 3979.33 m, bi−segment pattern, subaqueous distributary channel microfacies of shallow−water delta outer front; (c) Well QS201, 4018.70 m; one bouncing segment−one suspension segment−one transitional zone pattern, estuary bar microfacies of shallow−water delta outer front; (d) Well QS4, 4003.50 m, one bouncing segment−one suspension segment−one transitional zone pattern, subaqueous distributary channel microfacies of shallow−water delta outer front; (e) Well QS201, 4017.50 m, bi−bouncing segment-one suspension segment−one transitional zone pattern, estuary bar microfacies of shallow−water delta outer front; (f) well M16, 4044.10 m, one bouncing segment−one suspension segment-one complex transitional zone pattern, subaqueous distributary channel microfacies of shallow−water delta inner front.
Applsci 12 09852 g002
Figure 3. Grain-size curves of debris flow type. (a) Well QS7, 4100.30 m, one bouncing segment-one suspension segment-one transitional zone pattern; (b) Well QS202, 4034.64 m, one bouncing segment-one suspension segment-one arc transitional zone pattern.
Applsci 12 09852 g003
Figure 4. Typical sedimentary structure of the lower part microfacies of the single sandy debris flow deposition cycle. (a) Well QS7, 4102.45 m, slump deformation structure; (b) Well QS7, 4109.05 m, slump deformation structure; (c) Well QS7, 4108.48 m, scour surface structure; (d) Well QS7, 4105.45 m, large mud gravel.
Applsci 12 09852 g004
Figure 5. Typical sedimentary structure of the upper part microfacies of the single sandy debris flow deposition cycle. (a) Well QS7, 4100.05 m, the deformation of argillaceous lamina or carbonaceous layer; (b) Well QS7, 4101.08 m, massive sandstone; (c) Well QS7, 4106.90 m, scour surface structure; (d) Well QS202, 4032.70 m, top mutation structure.
Applsci 12 09852 g005
Figure 6. Typical sedimentary structure of subaqueous distributary channel microfacies in shallow-water delta inner front. (a) Well M16, 4044.10 m, scour surface structure; (b) Well M16, 4054.70 m, scour surface structure; (c) Well M16, 4041.60~4045.45 m, Multiphase river superposition.
Applsci 12 09852 g006
Figure 7. Typical sedimentary structure of subaqueous distributary channel microfacies in shallow-water delta outer front. (a) Well QS1, 3939.75 m, scour surface structure; (b) Well QS2, 3972.15 m, parallel bedding; (c) Well QS201, 4018.00 m, parallel bedding; (d) Well QS201, 4016.03 m, wedge cross bedding.
Applsci 12 09852 g007
Figure 8. Comparison diagram of grain size content and slope in different sedimentary microfacies. (a) The bouncing component content of different sedimentary microfacies; (b) The transitional component content of different sedimentary microfacies (no statistics of bi-segments and tri-segments patterns); (c) The suspended component content of different sedimentary microfacies (d) The gradients of bouncing segment of different sedimentary microfacies (no statistics of bi-bouncing segments-one suspension segment-one transitional zone pattern); (e) The gradients of transitional segments of different sedimentary microfacies (no statistics of bi-segments pattern, tri-segments pattern, one bouncing segment-one suspension segment-one complex transitional zone pattern, one bouncing segment-one suspension segment-one arc transitional zone pattern); (f) The gradients of suspended components of different sedimentary microfacies.
Applsci 12 09852 g008
Table 1. Comparison of grain-size curves of different sedimentary microfacies.
Hydrodynamic TypeSedimentary FaciesGrain Size Probability Curve CharacteristicsFrequency Histogram Dominant Grain Size
Curve PatternsContent/%Slope/°
Bouncing ComponentTransitional ComponentsSuspended ComponentsBouncing ComponentTransitional ComponentsSuspended Components
Tractive current1. Shallow-water delta inner front(1) Subaqueous distributary channel microfacies(1) tri-segments76-2258-241.4~1.8 φ
(2) one bouncing segment-one suspension segment-one complex transitional zone51~5734~406~1258~63-14~190.8~1.4 φ
2. Shallow-water delta outer front(1) Subaqueous distributary channel microfacies(1) bi-segments88~96-4~1261~62-90.8~1.4 φ
(2) one bouncing segment-one suspension segment-one transitional zone72~7917~204~1158~6430~3510~141.6~2.4 φ
(2) Estuary bar microfacies(1) bi-bouncing segments-one suspension segment-one transitional zone7619967-up37131.0~1.2 φ
58-down
(2) one bouncing segment-one suspension segment-one transitional zone72~7418~196~860~6735~3712~130.8~1.4 φ
Sandy debris flow3. Sandy debris flow(1) Lower microfacies(1) one bouncing segment-one suspension segment-one arc transitional zone56~6416~2216~2255~60-15~181.4~2.8 φ
(2) Upper microfacies(1) one bouncing segment-one suspension segment-one transitional zone52~6218~2316~2556~6030~4116~202.0~3.4 φ
Publisher’s Note: MDPI stays neutral with regard to jurisdictional claims in published maps and institutional affiliations.

