Article

Stability Analysis of Surrounding Rock in the Diversion Tunnel at the Xulong Hydropower Station based on RFPA3D and Microseismic Monitoring

1
Guodian Jinshajiang Xulong Hydropower Development Co., Ltd., Chengdu 610041, China
2
School of Geoscience and Technology, Southwest Petroleum University, Chengdu 610500, China
3
State Key Laboratory of Geohazard Prevention and Geoenvironment Protection, Chengdu 610059, China
*
Author to whom correspondence should be addressed.
Appl. Sci. 2022, 12(19), 9939; https://doi.org/10.3390/app12199939
Submission received: 30 August 2022 / Revised: 28 September 2022 / Accepted: 29 September 2022 / Published: 2 October 2022

Abstract

:
To study the surrounding rock stability of the excavated geologically weak section of the #2 diversion tunnel in the Xulong Hydropower Station, a quasi-3D numerical model was built using the Realistic Failure Process Analysis (RFPA3D) system to simulate the damage and failure process consisting of crack initiation, growth, and penetration in the rock mass after tunnel excavation, and reveal the instability failure mechanism inside the rock mass. Moreover, the microseismic monitoring technology was employed to delineate potential danger areas in the surrounding rock of the tunnel and explore possible instability failure modes. Results indicate that the surrounding rock of the tunnel profile failed as different degrees during the excavation process, most obviously near the vault and corners of the side wall, where tensile failure predominated. As the excavation proceeded, microseismic events increased gradually at the vault and corners of the side wall, and the energy from acoustic emissions accumulated steadily, thus raising the possibility of collapse and rock bursts in this area. The research results can provide technical support for the construction of the diversion tunnel project in the Xulong Hydropower Station and serve as a guide for the construction of similar geologically weak underground projects.

1. Introduction

China has focused on the development and use of hydropower projects in the lower reaches of the Yalong River and upper reaches of the Jinsha River, with the aim of “achieving carbon neutrality before 2060”. Southwest China is located in the high mountain valley area of the Hengduan Mountains on the eastern edge of the Qinghai-Tibet Plateau. It is characterized by its high altitude, high ground stress, and complex rock structure. For hydropower plants in this area, underground caverns are often the most practical and cost-effective option for meeting topographic, spatial, building layout, and construction requirements. The construction of underground caverns for hydropower projects will face great risks and challenges due to the strict requirements for rock quality, construction cycle and safety standards, and complicated construction procedures. The surrounding rock is likely to become unstable and damaged during construction due to poor excavation and delayed support, which could result in casualties and property losses. For example, the Baihetan underground powerhouse has the largest excavation size in the world. During the excavation of underground caverns, rock collapses dominated by high geostress and geological structures posed serious threats to field construction [1]. An unexpectedly powerful rock burst that occurred in November 2009 during the construction of the Jinping-II drainage tunnel destroyed all the support systems in the affected sections, seriously damaged the TBM equipment, and killed seven workers [2]. Tunnel excavation of the Neelum-Jhelum Hydropower Project in Pakistan has been hindered by the ground composition of the Himalayas, faces the project complexities, geological environments involving significant overburden and tectonic stresses, and effects of the excavation method on tunnel stability. This causes time and cost overruns directly [3]. Therefore, it is crucial to assess the stability of surrounding rock during the excavation and unloading of underground caverns, to promptly inform the constructor of unstable areas, and to implement a reasonable construction and support reinforcement plan.
As an important research method, numerical modeling is now widely used by scholars to study the rock excavation and unloading process, and predict the instability failure mode and impacted area in the rock mass. To determine the deformation and stress distribution around the caverns and to analyze the impacts produced by weak structural planes and multiple caverns in the rock mass, Dhawan et al. [4] developed a three-dimensional finite element model for analyzing the stability of underground caverns. Hao et al. [5] examined the impact of faults on the plastic zone and displacement of underground caverns using the Universal Distinct Element Code (UDEC) numerical modeling software. Yazdani et al. [6] performed displacement-based back analysis using finite element and discrete element methods to determine geomechanical properties of the rock in underground caverns, such as stress ratios and joint parameters. Ma et al. [7] investigated the failure mechanisms and movement characteristics of rockfalls through a three-dimensional discontinuous deformation analysis (3D DDA) method. Song et al. [8] conducted pore-scale modeling on the methane hydrate dissociation and transportation in the reconstructed three-dimensional models of the MH-bearing sediment. Cai et al. [9] studied the acoustic emission pattern during the excavation and unloading process of underground plants using the FLAC/PFC coupled numerical modeling method. Jing [10] studied the stability of rock with anisotropic fractures in a tunnel using discontinuous deformation analysis (DDA) in the discrete element method (DEM).
In addition to numerical simulation, Field monitoring is also a common method for studying the mechanical response and stability of the underground rock. Field monitoring data can visually reflect the stress-strain characteristics of the rock mass in underground caverns. Routine monitoring methods include ground stress measurement, bolt stress meters, acoustic testing, and geological radar [11,12,13,14]. The monitoring results can better reflect changes in deformation and mechanical parameters on the section, but they have spatial limitations and make it difficult to capture micro-fractures within the rock mass, which are frequently the precursor to macroscopic instability failure in the rock mass. As a 3D monitoring method, microseismic monitoring can detect micro-fractures within the rock mass in advance, allowing for the forecast of risk areas in the rock. Li et al. The authors in [15] analyzed the microseismic b-values associated with rock mass large deformation and their temporal variation. Li et al. [16], based on tempo-spatial characteristics of the microseismic events, analyzed the relation between microseismic activities and field construction and revealed the main damage regions. Leśniak and Isakow [17] analyzed the clustering characteristics of microseismic events and developed a time-based function for high-energy fractures in coal mines. Hudyma and Potvin [18] developed a microseismic monitoring method to manage hazards in underground hard rock mines. Ma et al. [19] investigated the focal mechanism of seismic events induced by underground mines using an optimized moment tensor inversion method. Cai et al. [20] quantified the rock damage in the experimental tunnel using the source radius. Ma et al. [21] examined the stability of the surrounding rock of high-slope tunnels by analyzing the spatial and temporal characteristics of microseismic events. Dai et al. [22] classified the dominant factors of clustering microseismic events and proposed a method for studying the large deformation of rock in underground plant caverns based on source parameters.
In the present study, the incorporated method involving RFPA3D and MS monitoring technique is applied to analyze the stability of the surrounding rock, aiming at the instability failure problem inside the rock mass caused by the redistribution of ground stress after excavation in the geologically weak section of the #2 diversion tunnel in the Xulong Hydropower Station in the upper reaches of the Jinsha River, and analyzes the progressive instability failure of the tunnel using the RFPA3D numerical modeling software by comparing the spatial and temporal evolution characteristics of microseismic events to reveal the whole process from micro-fracture initiation, growth, and propagation, to penetration within the surrounding rock after tunnel excavation, and identifies potentially unstable areas after tunnel excavation. The research findings can be used to provide technical support for stability evaluation and risk prediction prior to and after excavation of the #2 diversion tunnel in the Xulong Hydropower Station, and can also provide experience for similar hydraulic tunnel excavation.

2. Engineering Background

The Xulong Hydropower Station is located in the upper reaches of the main stream of the Jinsha River at the junction of Deqin County, Yunnan Province and Derong County, Sichuan Province. This primary task of the project development is power generation, which is one of the backbone power points for west-east power transmission. It has an average annual flow of 990 m3/s at the dam site and an average annual runoff of 31.3 billion m3. The reservoir has a normal water level of 2302 m, a dead water level of 2294 m, a designed flood level of 2303.42 m, a maximum flood level of 2305.89 m, and a total capacity of about 847 million m3. The hydropower station has an installed capacity of 2400 MW and can generate 10.319 billion kWh of electricity annually.
According to site exploration data, the larger-scale faults on the left bank of the dam site were F1, F2, and F3, while the rest were III or IV structural planes, primarily steeply dipping faults orthogonal to the Jinsha River. The ground stress increased generally with burial depth, primarily at a medium level, and the concentration area of local stress was dominated by medium and high levels of stress. The riverbed area showed an obvious stress increase, with the maximum horizontal principal stress ranging from 2.9 MPa to 16.7 MPa, and high ground stress phenomena such as core discing occurred locally. The rocks are mainly granite, migmatite, and amphibolite schist. Their uniaxial compressive strength is 80~120 MPa and elastic modulus is 30~50 GPa. Figure 1 shows the geological axis profile of the #2 diversion tunnel on the left bank. Located at the downstream lateral border of the F2 fault, the inlet of the diversion tunnel had an elevation of 2155 m, a length of 1446.67 m, and a thickness of the overlying rock on the vault ranging from 50 m to 280 m. Moreover, the diversion tunnel and auxiliary tunnels were dominated by a medium level of ground stress.

3. Numerical Modeling

3.1. Basic Principles of RFPA

The RFPA is a numerical calculation method for analyzing the material fracture process based on finite element stress analysis and statistical damage theory, as well as a numerical test tool capable of simulating the entire material progressive fracture process until instability [23]. It is a new numerical analysis method for the material fracture process, which can simulate nonlinearity through material non-uniformity and mechanical problems of discontinuous media with the continuum mechanics theory. One significant aspect of this method is that it takes material non-uniformity into account. In 1995, Tang et al. [24] from Northeastern University developed the RFPA2D system based on the finite element theory and a new material fracture process algorithm thought, which simulates the nonlinearity of material by considering its non-uniformity, simulates material discontinuous behaviors like deformation and failure by weakening elements, and can be used to study the whole process of the rock (rock mass) material from mesoscopic damage to macroscopic failure.
Based on this basic principle, the parallel algorithm was introduced to the RFPA3D system that is a numerical analysis tool [25] for solving the mechanical problems of discontinuous media with the continuum mechanics theory by performing mesoscopic element failure analysis and finite element stress analysis. Combining the statistical damage theory with the numerical calculation method and considering the non-uniformity of rock material, it simulates the nonlinear behavior of rock formation and fracture. The development of the RFPA3D system aimed to build a 3D model with higher theoretical research value, and it has been more widely used in engineering.

3.2. Twin-Shear Unified Strength Criterion

In 1994, Professor Yu [26] from Xi’an Jiaotong University proposed the unified strength theory applicable to geotechnical materials—twin-shear unified strength, which holds that the failure of material begins when the combination of the two larger shear stresses applied to the twin-shear element and the positive stress applied to the element surface reaches a critical value. Its mathematical expression is:
F = { τ 13 + b τ 12 + β ( σ 13 + b σ 12 ) = c ( τ 12 + β σ 12 > τ 23 + β σ 23 ) τ 13 + b τ 23 + β ( σ 13 + b σ 23 ) = c ( τ 12 + β σ 12 τ 23 + β σ 23 )
where b is the coefficient reflecting the effect of the intermediate principal shear stress, β is the coefficient reflecting the effect of the positive stress on the failure of the material, and c is the strength parameter of the material.
In geotechnical engineering, the compressive strength parameter σ c is generally used, and Equation (1) can be expressed as:
F = { 1 α σ 1 1 1 + b ( b σ 2 + σ 3 ) = σ c ( σ 2 σ 1 + α σ 3 1 + α ) 1 α ( 1 + b ) ( σ 1 + b σ 2 ) σ 3 = σ c ( σ 2 > σ 1 + α σ 3 1 + α )
where α is the maximum ratio of the tensile to the compressive strength of the material, that is, α = σ t / σ c .
In this paper, this strength theory was introduced by simulating the damage to the surrounding rock after tunnel excavation with RFPA3D.

3.3. Modeling

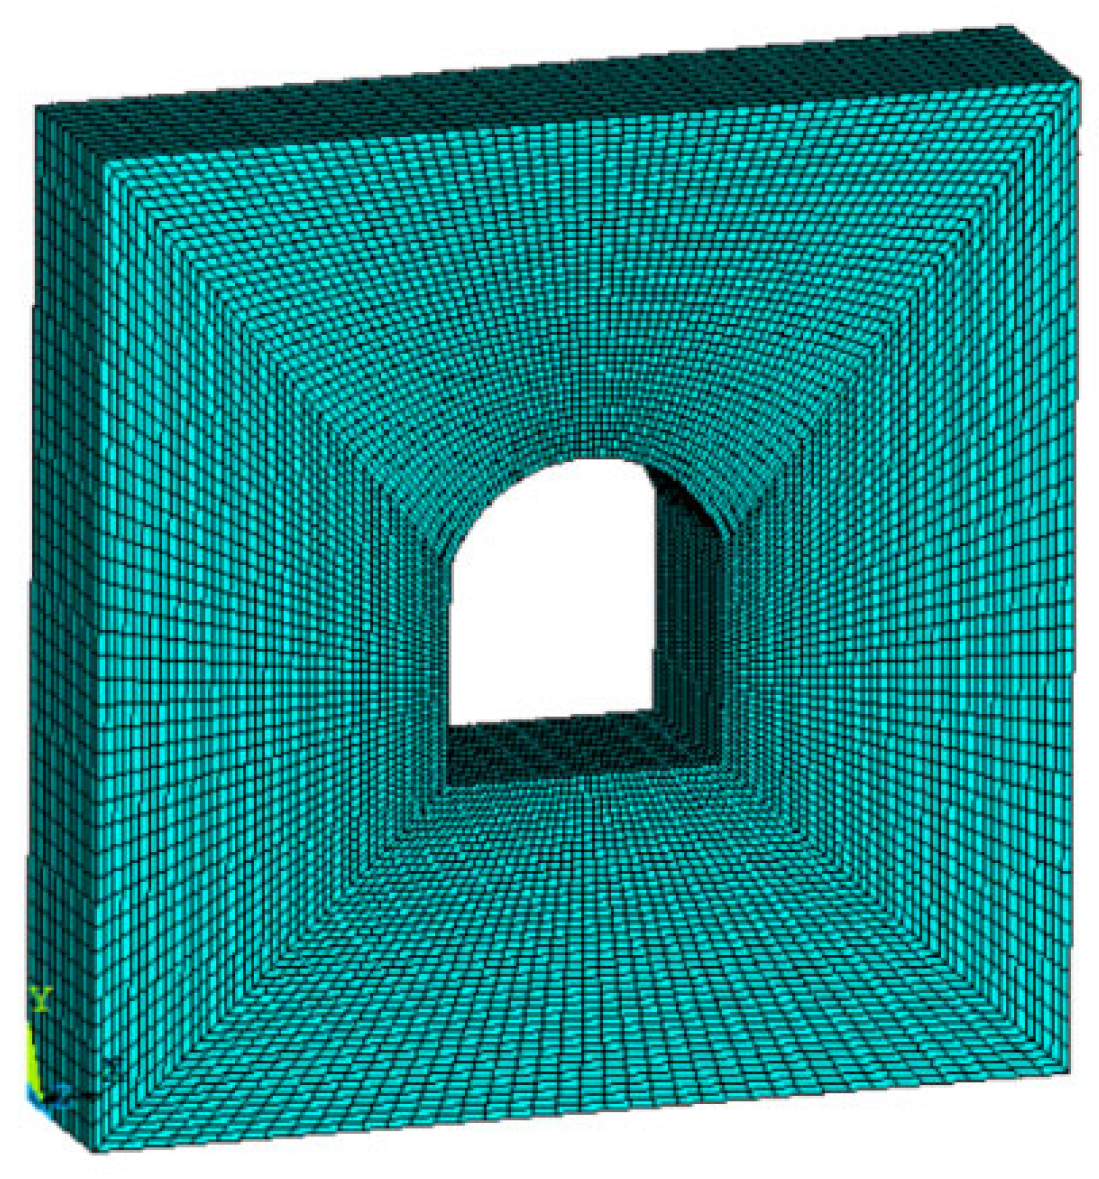
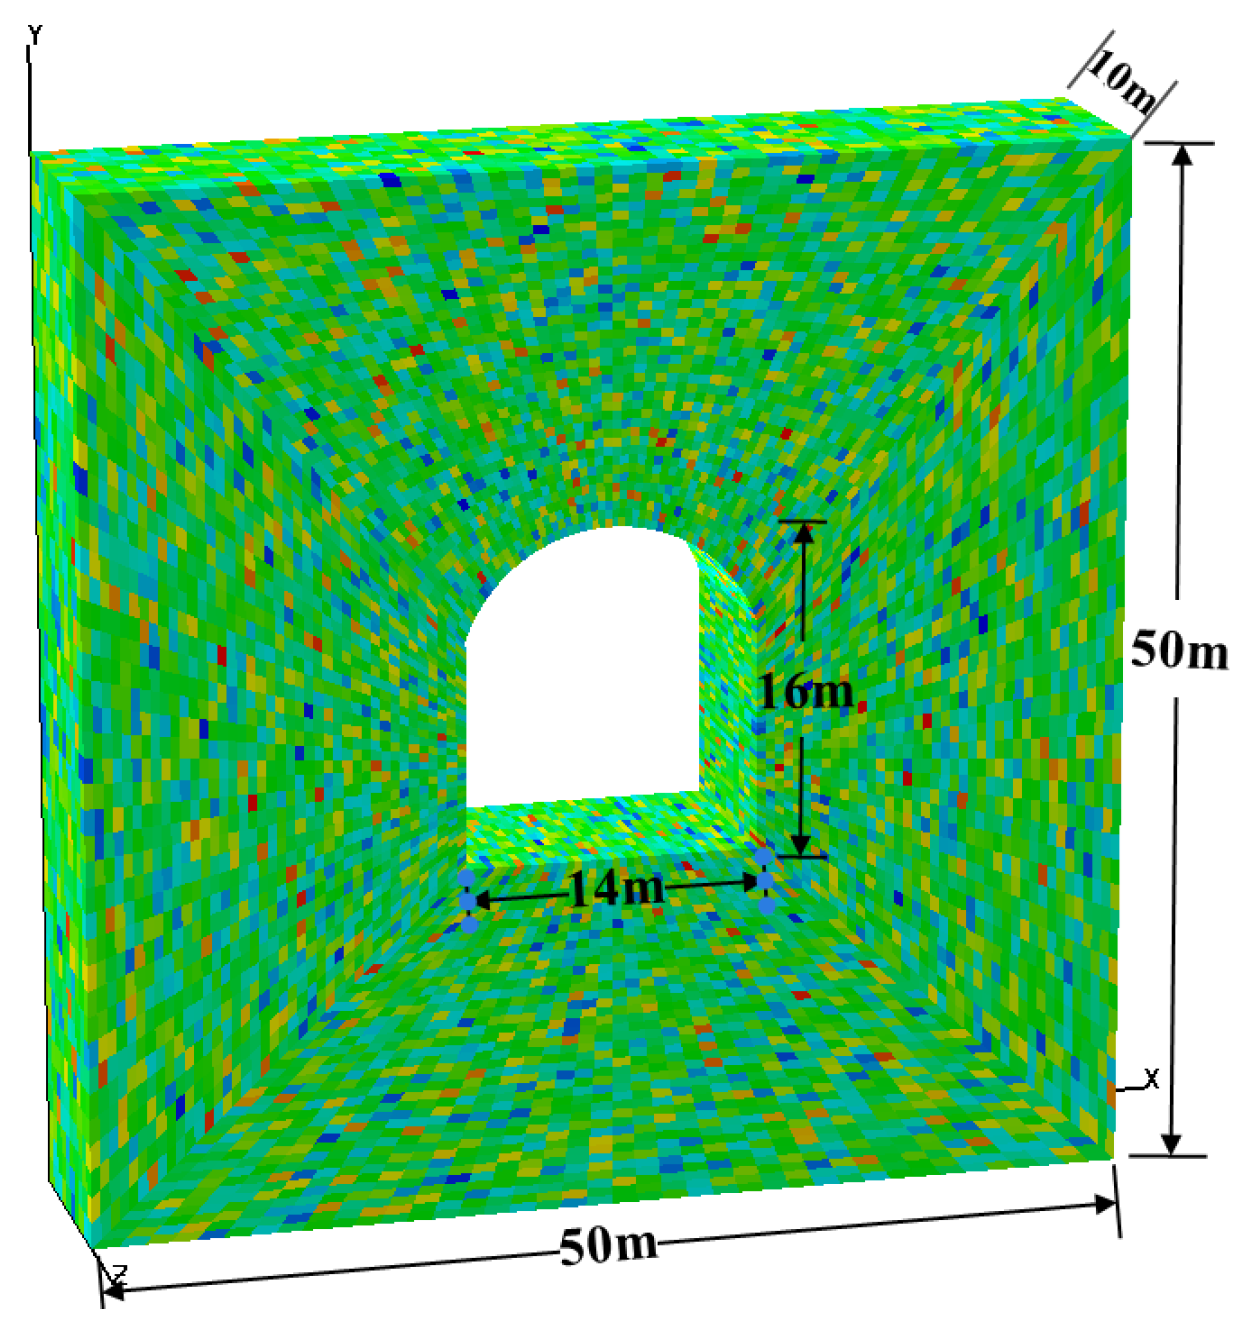
Since stakes K0+765 to K0+775 of the #2 diversion tunnel in the Xulong Hydropower Station pass through the F1 fault, due to the existence of faults, the stress and deformation distribution of surrounding rock are seriously affected. This section is dominated by class V surrounding rock, with high ground stress and high possibility of disaster. [27]. Therefore, this section was selected for the study. Since there are some limitations on the establishment of complex models in RFPA3D, the solid model can be established in the finite element analysis software ANSYS first, and the data transformation interface program AtoR can be prepared using C language to extract and import the node and element information from the ANSYS model into RFPA3D. Modeling and imposing constraints is simple in ANSYS and it is also easy to mesh the model. This will allow for the creation of the tunnel model to be constructed more quickly and conveniently [28,29,30]. According to site actual conditions, a geological model of 50 m × 50 m × 10 m was firstly established in ANSYS, and a horseshoe-shaped tunnel cavern was excavated in the middle of the model with a height of 16 m and a width of 14 m according to the actual structural and dimensional characteristics of the diversion tunnel. Then, the model was meshed to ensure that all elements were hexahedrons with eight nodes, and the sweep function was recommended in meshing, as shown in Figure 2. Finally, normal constraints were applied to a triple (0, 0, 0), and a stress boundary condition with a lateral pressure coefficient of 1 was applied to a triple (50, 50, 10) according to the actual ground stress environment of the tunnel. After the model with meshes and constraints was imported into RFPA3D, a 3D model considering the non-uniformity of the rock mass was generated according to the Weibull distribution, as shown in Figure 3.
To reveal the rupture zone, observe acoustic emission and compare with microseismic monitoring, the Mohr–Coulomb model was selected, which is more consistent with reality. The input parameters were determined by consulting the geological data obtained through field measurements; Table 1 lists the selected mechanical parameters of the rock mass. The strength reduction method [31] was employed in the calculation process, which continuously reduced the initial strength f 0 of the material, and f 0 unified the compressive (shear) and tensile strengths of the element material according to the following reduction criterion:
f 0   t r i a l = f 0 F s   trial
where f 0 t r i a l is the test strength and F s t r i a l is the test safety factor.

3.4. Modeling Results and Analysis

Figure 4 shows the distribution of the maximum principal stress. Under the action of the applied confining pressure, the maximum principal stress first started to concentrate at the bottom corner of the side wall of the tunnel, and the stress on the surrounding rock of the tunnel profile also increased immediately. As the loading continued, cracks started to be generated from the tunnel vault and bottom corners of the side wall, forming multiple main cracks that propagated around and bifurcated during the propagation process. The cracks on the vault and bottom developed faster, and those on the side wall developed slower. The tunnel was unstable at this point because the late loading stage caused all the cracks in the surrounding rock of the tunnel profile to be penetrated. Figure 5 shows the distribution of the maximum principal strain, which was constant throughout the loading and failure process of the rock mass. Figure 6 shows the changes in the elastic modulus of the rock, with the red color indicating the failure area. It can be seen that the distribution of the failure is consistent with that of the maximum principal stress.
In practical engineering, the ground stress field cannot be directly observed, but rock fracture will occur, so the acoustic emission phenomenon can be monitored to understand the failure of the surrounding rock. Figure 7 shows the spatial distribution of the acoustic emission phenomenon during the failure process of rock. The center of the sphere in the figure represents the location of the acoustic emission, and the radius of the sphere indicates the relative magnitude of the energy released from the acoustic emission. In Figure 7, the red sphere and blue sphere represent the acoustic emission events generated from the failure of elements satisfying the tensile criteria or shear criteria, respectively. As can be seen from the figure, in the initial loading stage, a large number of red spheres started to concentrate at the tunnel vault and bottom corners of the side wall, indicating that the rock damage gradually propagated at this moment. As the loading proceeded, the red spheres on both sides of the tunnel also started to increase, and there were red spheres of larger radius gathering at the tunnel vault and corners of the side wall continuously, indicating that the rock fracture intensified and the energy released increased at this time. Meanwhile, blue spheres began to appear at the tunnel vault and bottom, indicating that shear failure occurred locally, but this area was dominated by tensile failure. In the late loading stage, the red spheres kept expanding inward and the blue spheres kept increasing, indicating that the damage to the side wall kept intensifying and that more and more energy was released by micro-fractures. Especially, acoustic emissions were mainly concentrated at the tunnel vault and corners of the side wall. The damage distribution of the vault and the corners of the side walls are influenced by the in situ stress and weak structures. Moreover, the distribution of the initial in situ stress field in the tunnel surrounding rock will influence the damage range and degree. Inevitably, the increase of lateral pressure coefficients will expand the damage range and degree. Therefore, this area had a high probability of rock bursts and required intensive monitoring in the project, so that preventive measures could be taken before the disaster occurred.

4. Characteristics of Microseismic Events in the Tunnel

4.1. Microseismic Monitoring System of the #2 Diversion Tunnel

The deformation and failure caused by the excavation of underground caverns was essentially the evolution process of rock micro-fractures from initiation, growth, propagation, aggregation, and penetration, to macroscopic failure. Therefore, the aggregation and evolution characteristics of micro-fractures in the rock mass are often used as the precursor of macroscopic instability failure of the rock mass. Microseismic monitoring, as a 3D monitoring method, originated abroad when the first seismic station was established in the Ruhr coalfield in Germany in 1908 to monitor seismic events induced by mining [32]. The microseismic monitoring system can collect micro-fracture information inside the rock mass in real time for assessing the stability of the engineering rock mass. In response to the randomness and multiplicity of deformation, rock bursts, and other issues caused by the excavation and unloading of deep tunnels, the diversion tunnel project in the Xulong Hydropower Station was equipped with the high-sensitivity microseismic monitoring system produced by Canadian ESG, which could provide real-time monitoring. It mainly consists of the acceleration sensor, Paladin digital signal acquisition system, and Hyperion digital signal processing system. Figure 8 shows the network topology of the microseismic monitoring system.
The microseismic monitoring system of the #2 diversion tunnel implemented 24 h monitoring. In particular, the microseismic sensor converted the received microseismic signals into electrical signals, which were transmitted to the Paladin digital signal acquisition system through the cable and converted into digital signals with a 24-bit ADC. Finally, the digital signals were recorded and saved automatically by the Hyperion digital signal processing system. Due to the long transmission distance from the Paladin acquisition substation to the Hyperion host, they were connected by optical fiber in order to ensure the stability and integrity of the transmitted signals, and the conversion between digital signals and optical signals was completed by using an optical-to-electrical (O/E) converter. The data collected onsite could be shared through wireless network transmission, so that the Xulong camp office and the calculation and analysis center in Chengdu could download the microseismic data in real time, thus conducting risk warning and stability evaluation for the excavation of the #2 diversion tunnel based on calculation, analysis, and research.

4.2. Spatial and Temporal Distribution of Microseismic Events

The microseismic monitoring system of the diversion tunnel started to run normally on 17 December 2021, and stakes K0+765 to K0+775 of the #2 diversion tunnel were excavated from 3 June to 13 June 2022. During the construction period, a total of 104 valid events were collected after the site interference signals such as mechanical noise were removed, including 92 microseismic events.
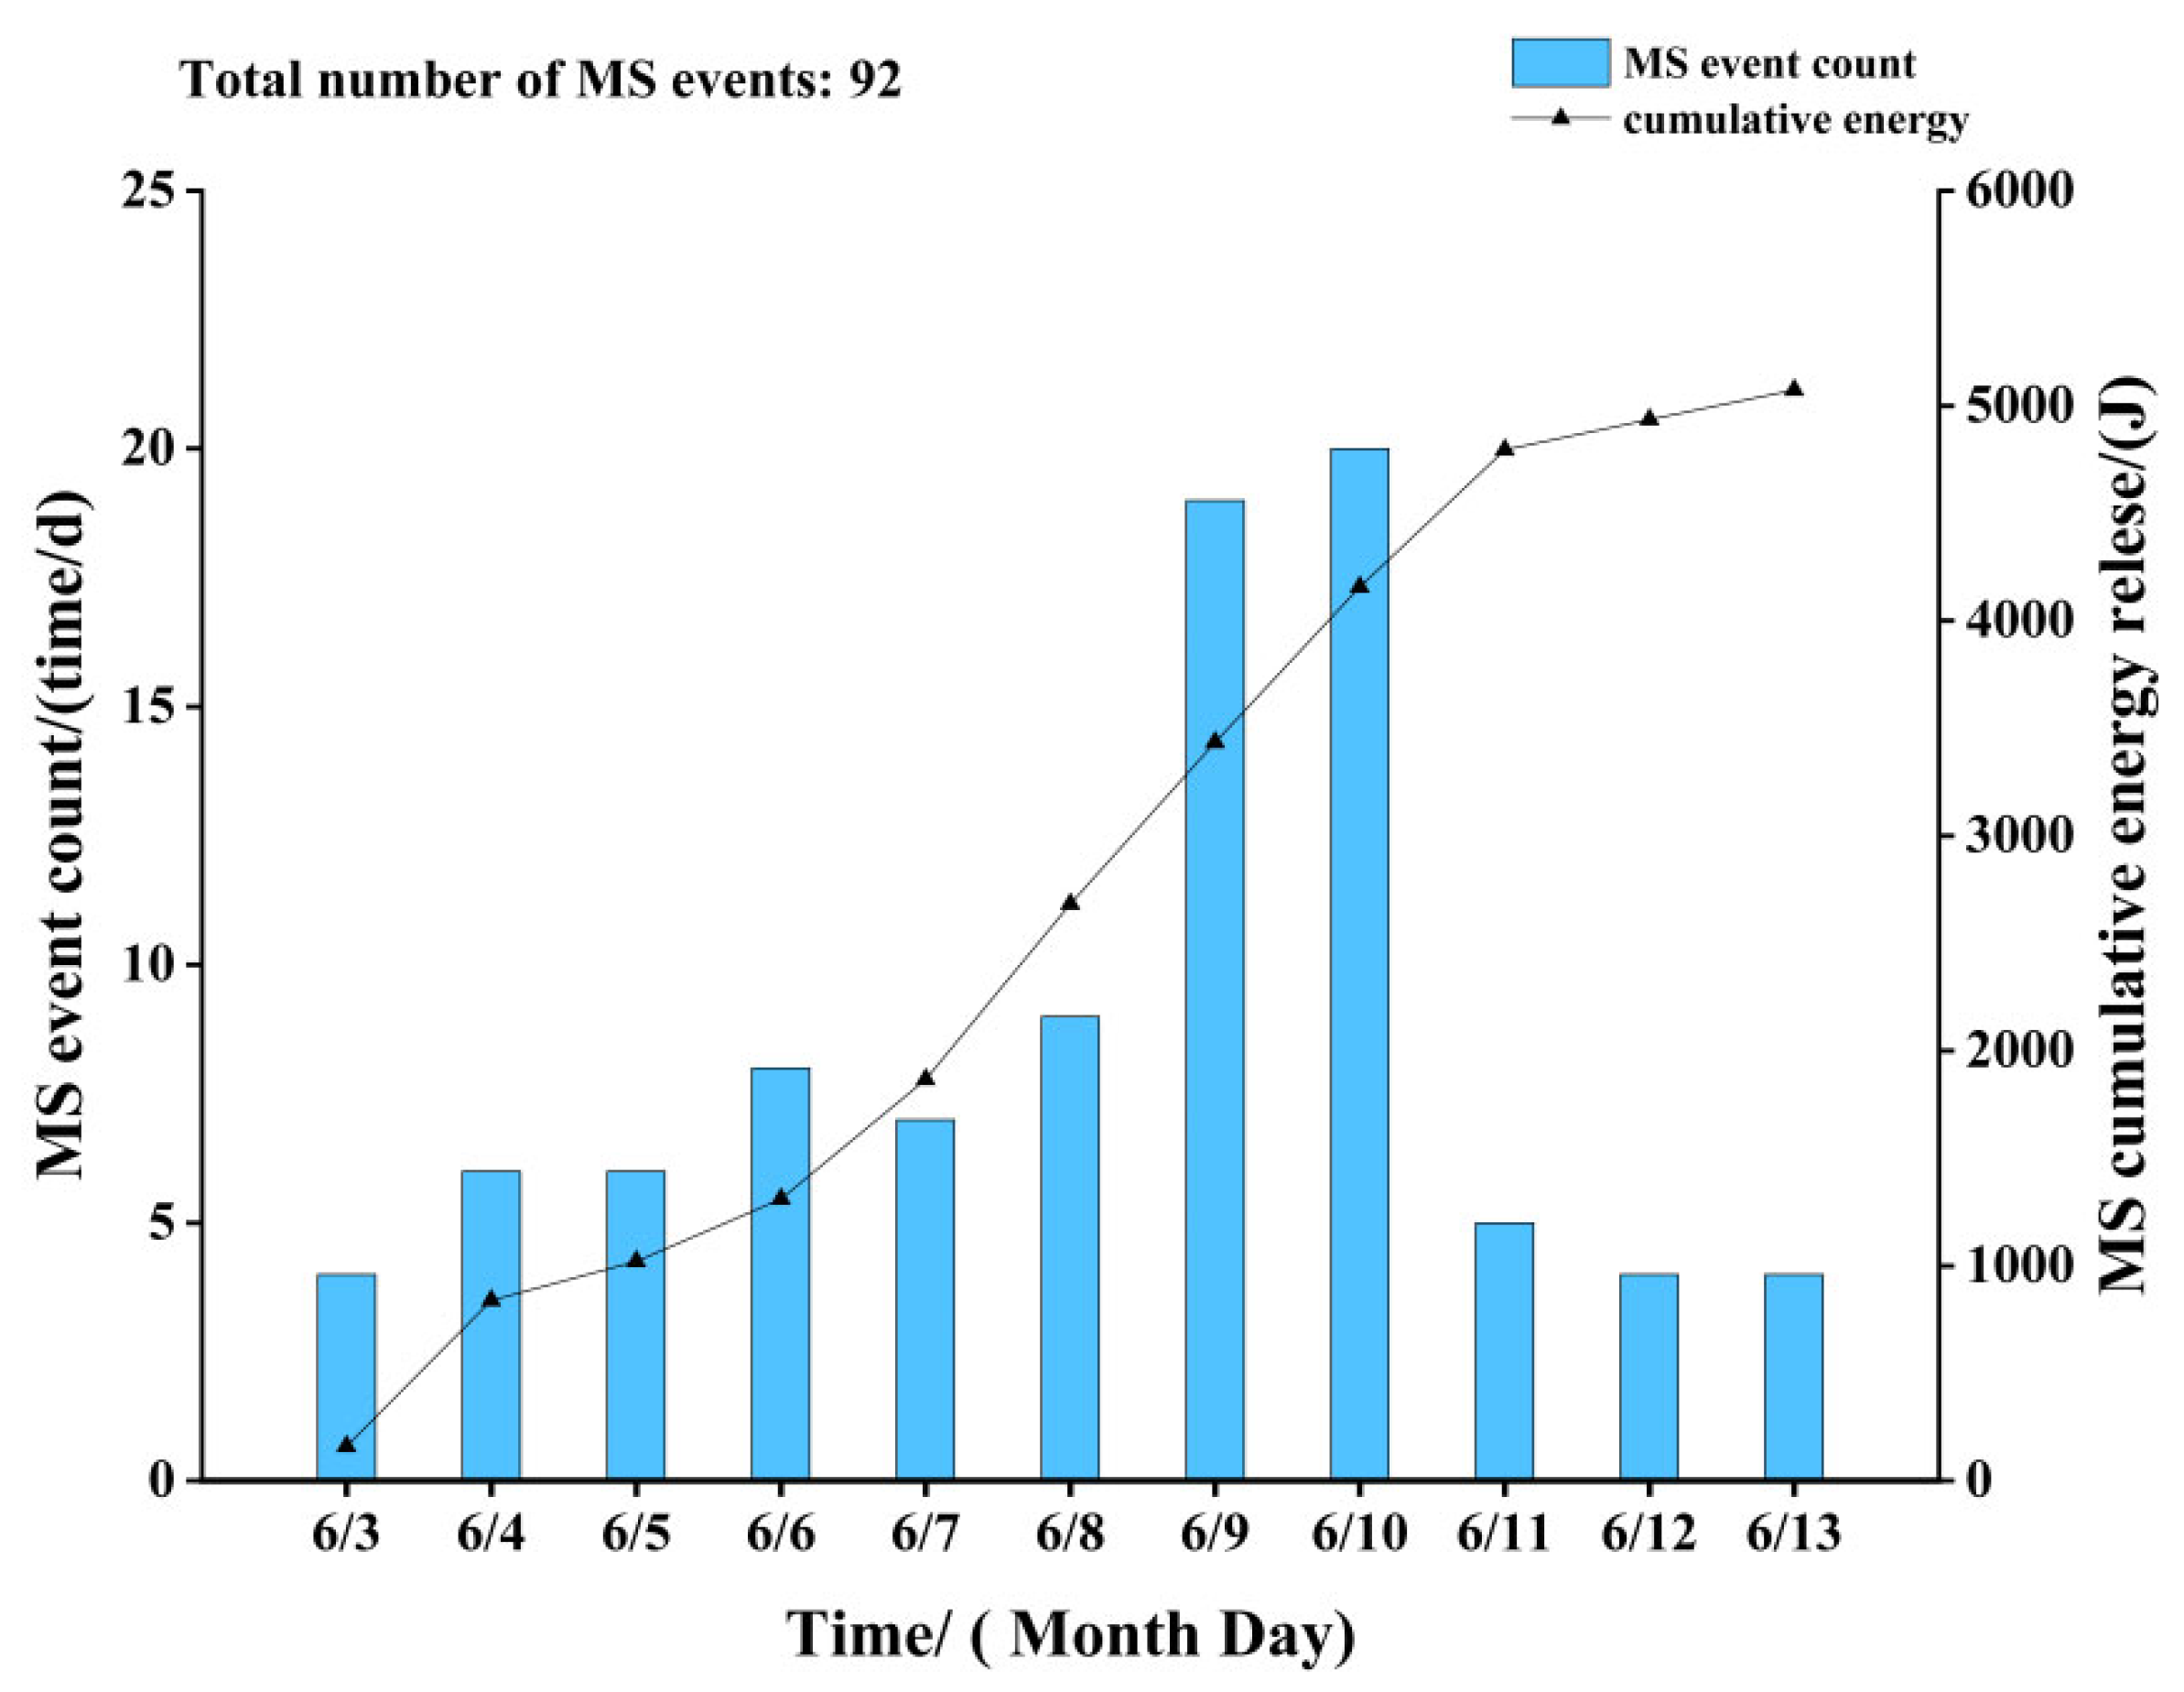
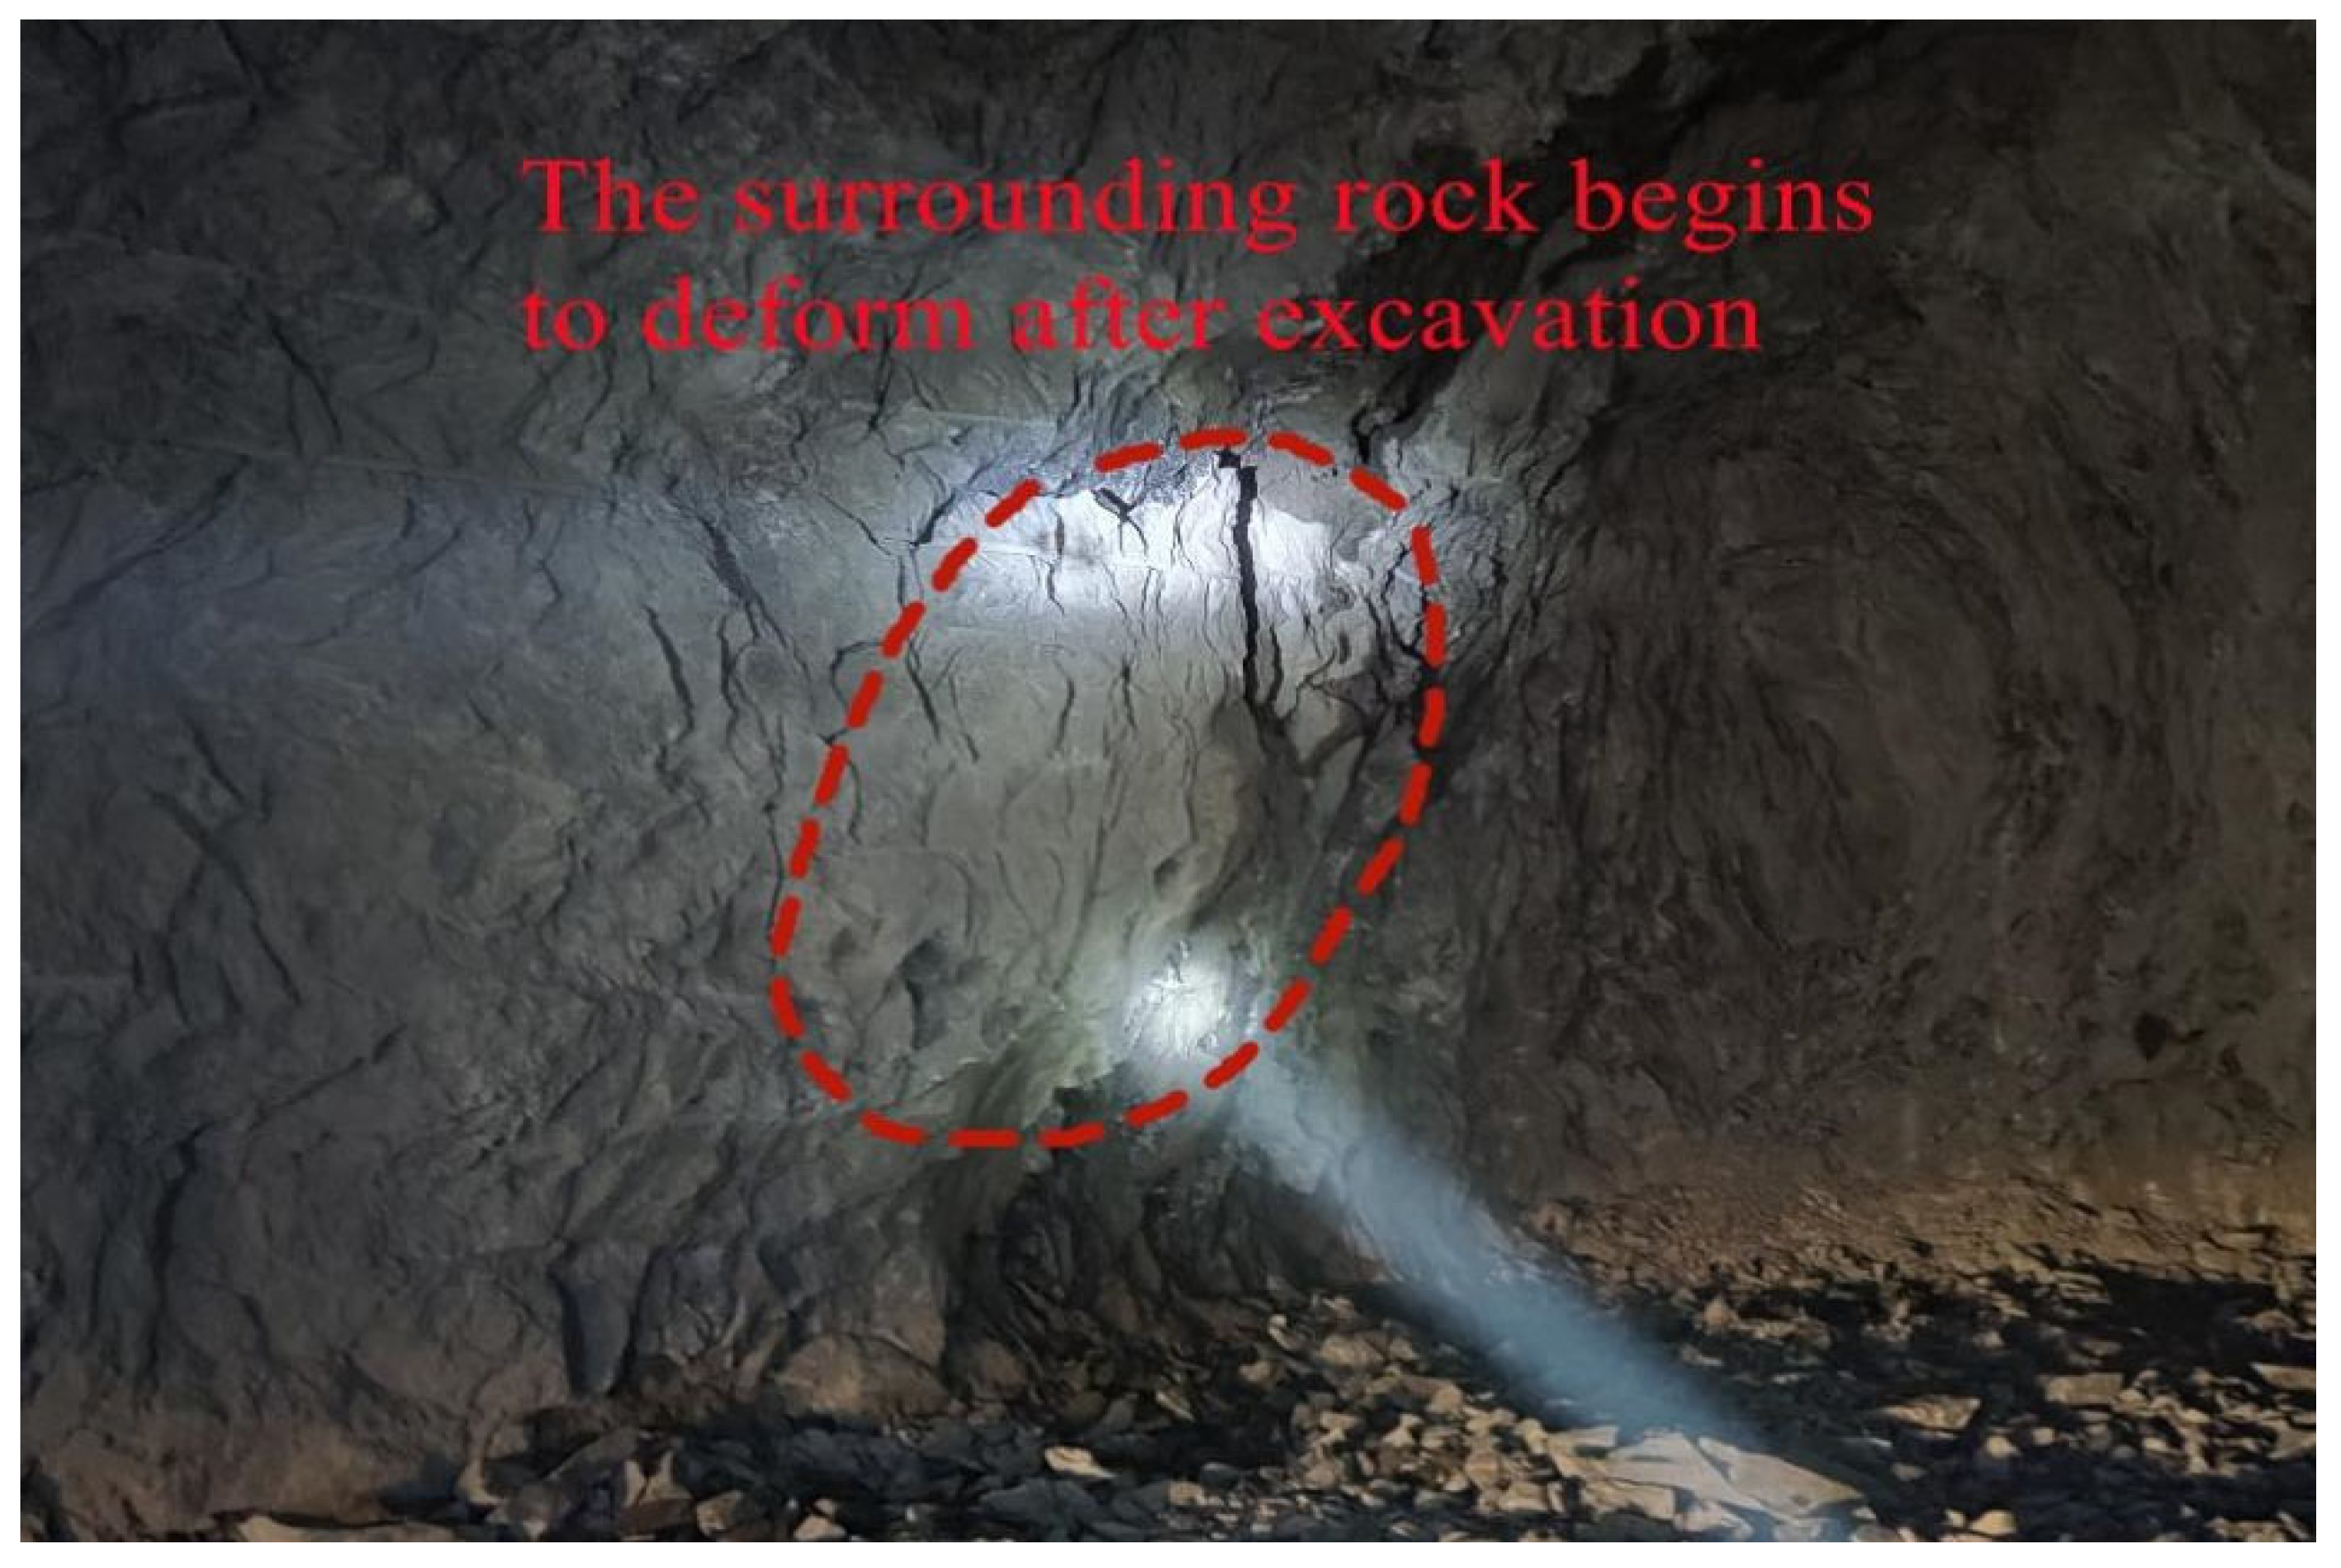
Figure 9 shows the temporal distribution of microseismic events. As can be seen from the figure, the microseismic events gradually increased from 3 June to 8 June, reached the peak on 9 June to 10 June, and maintained at about 20, and the surrounding rock was continuously disturbed. Based on the energy dissipation principle, each micro-fracture of the surrounding rock is accompanied by the release of energy. The cumulative energy released from microseismic events suddenly increased on 9 June and 10 June, indicating that frequent microseismic events intensified the release of energy. Then, the number of microseismic events decreased significantly from 11 June to 13 June and maintained at about 5. The moment magnitude was mostly distributed between −1.0 and 0.5, representing small-magnitude events, as shown in Figure 10. The site construction dynamics indicated that the site was under normal construction from 3 June to 8 June, and the construction intensity started to increase on 9 June and 10 June in order to complete the workload, which directly led to the intensification of internal micro-fractures of the rock mass and extremely frequent microseismic events. The site investigation showed that the deformation and failure of the rock mass occurred on the left front of the tunnel face (as shown in Figure 11), and there were risks of rock bursts. For construction safety purposes, the blasting work was stopped on 11 June and 12 June, and support was provided for the surrounding rock. After the support was completed on 13 June, the tunnel excavation was continued, with a much lower intensity than before, so the microseismic events remained at a low level during these days. Thus, the frequency of microseismic events could better reflect the construction intensity of underground plants.
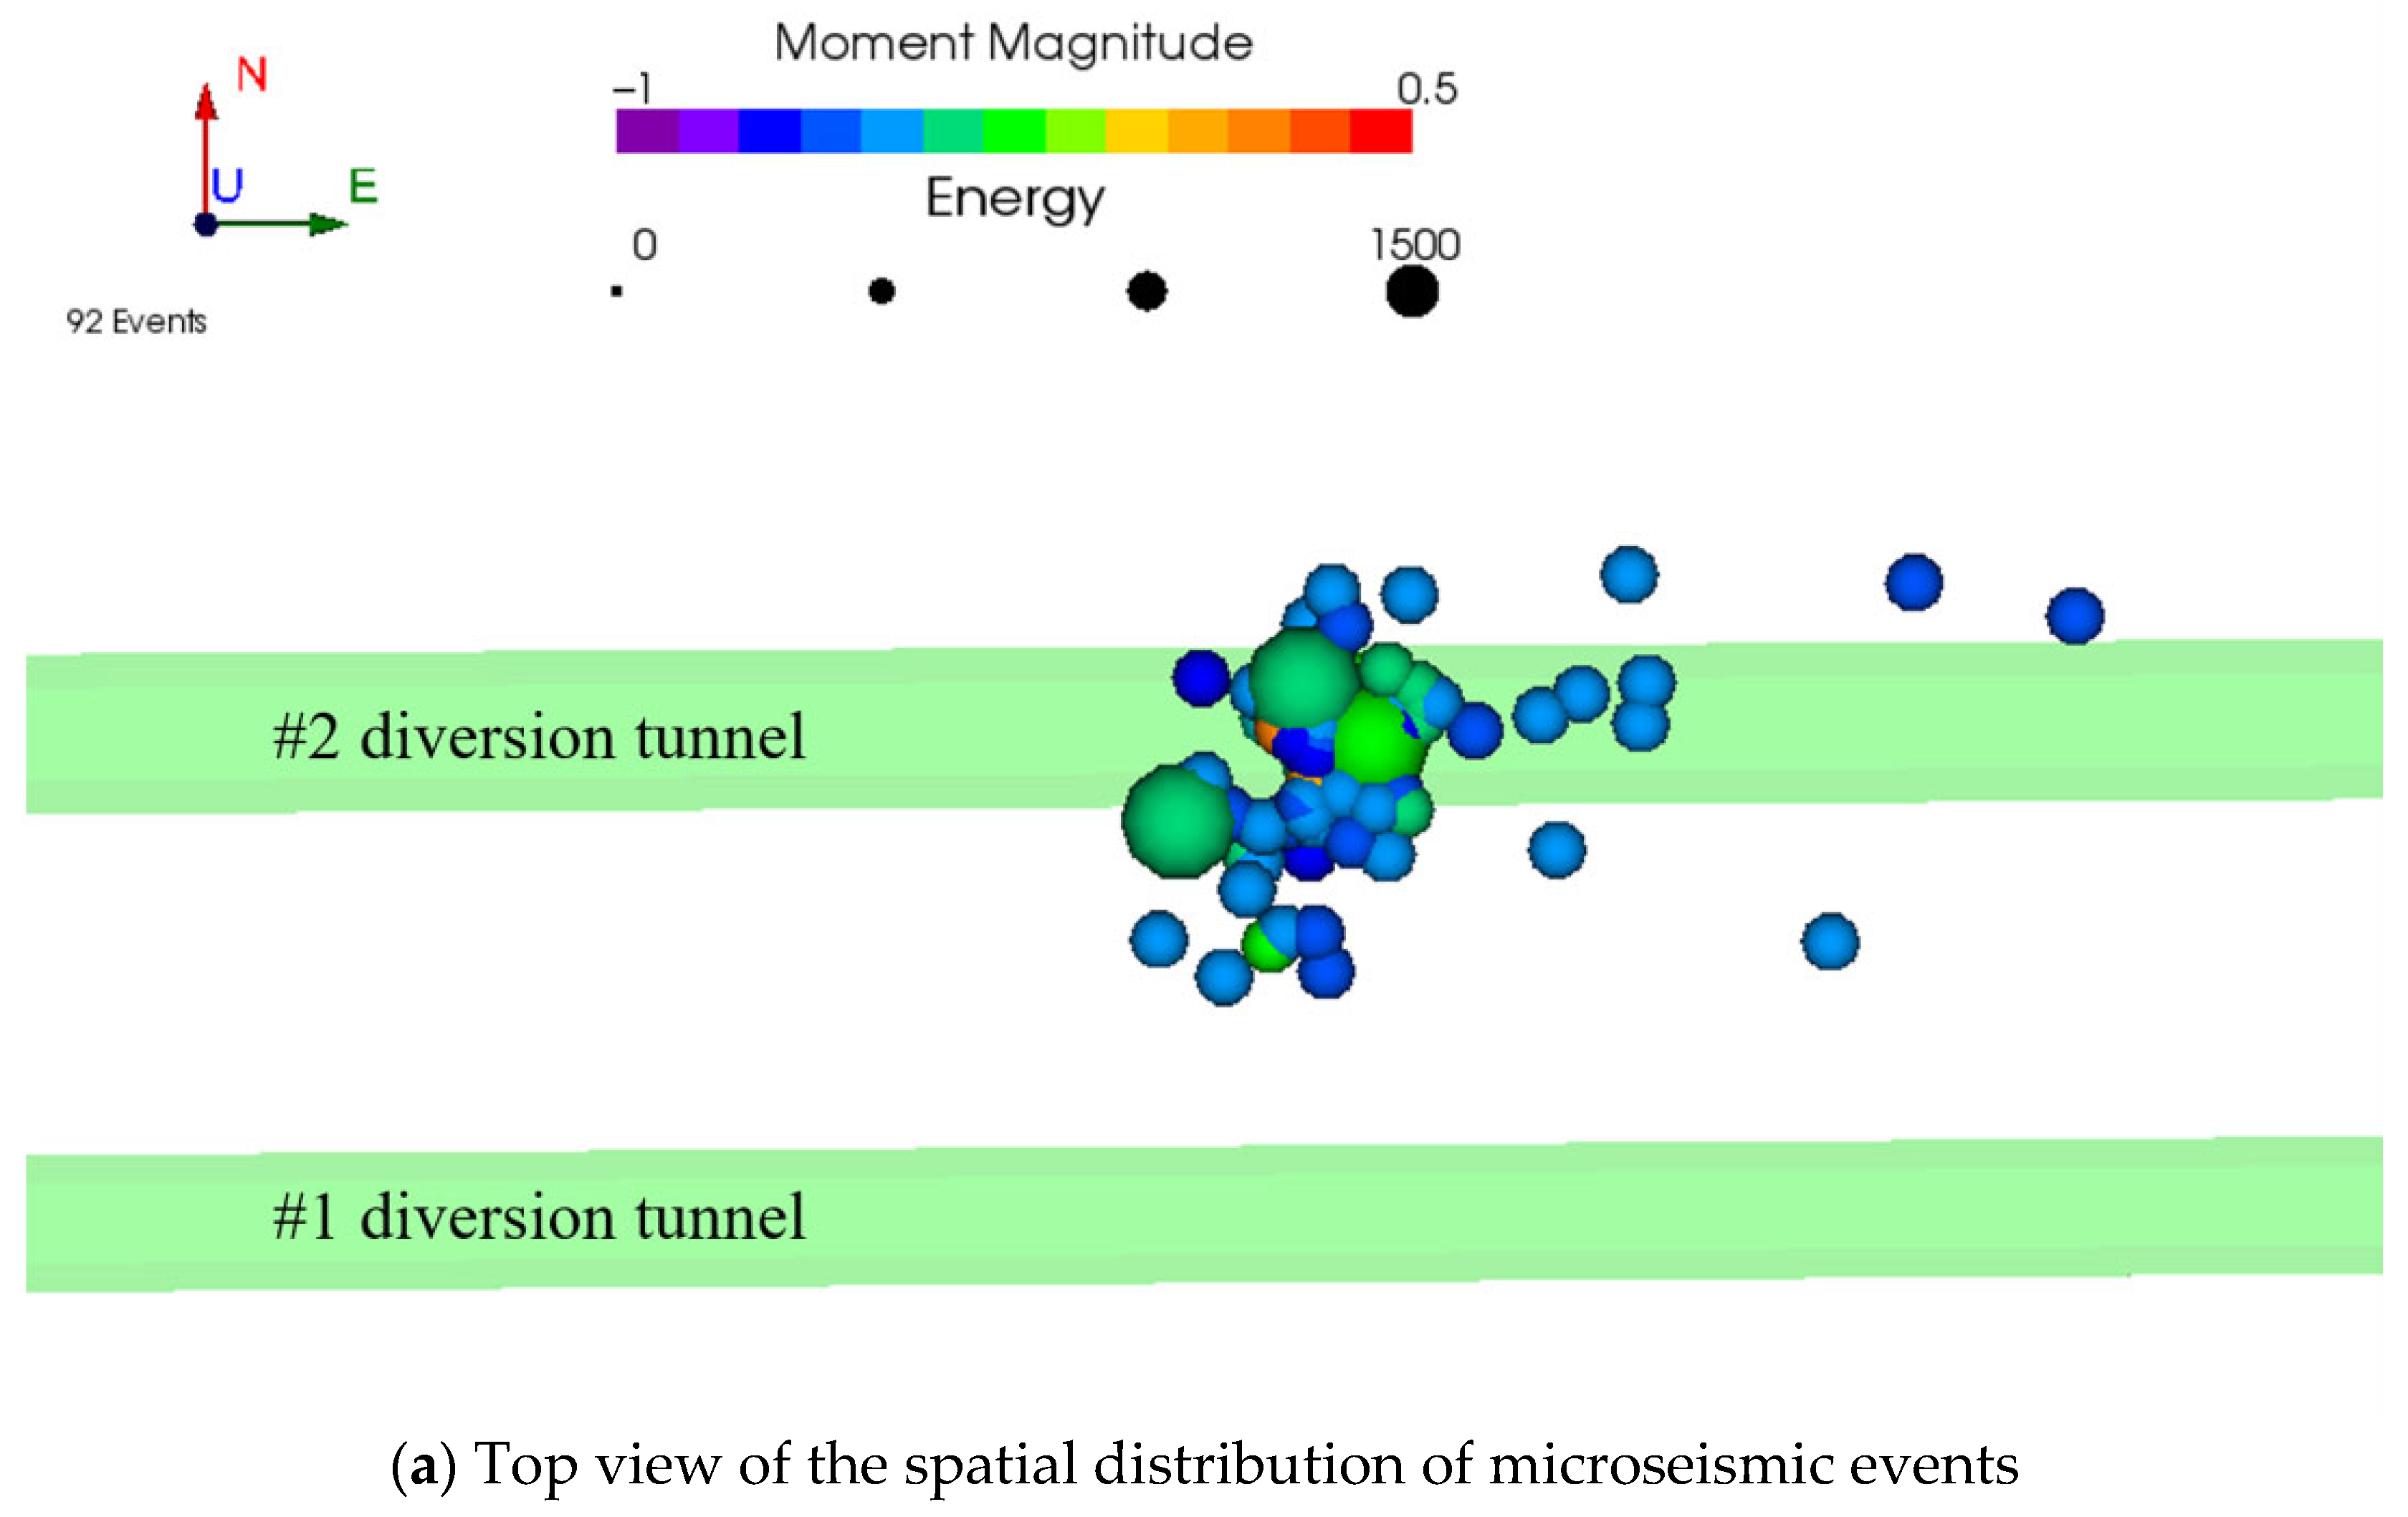
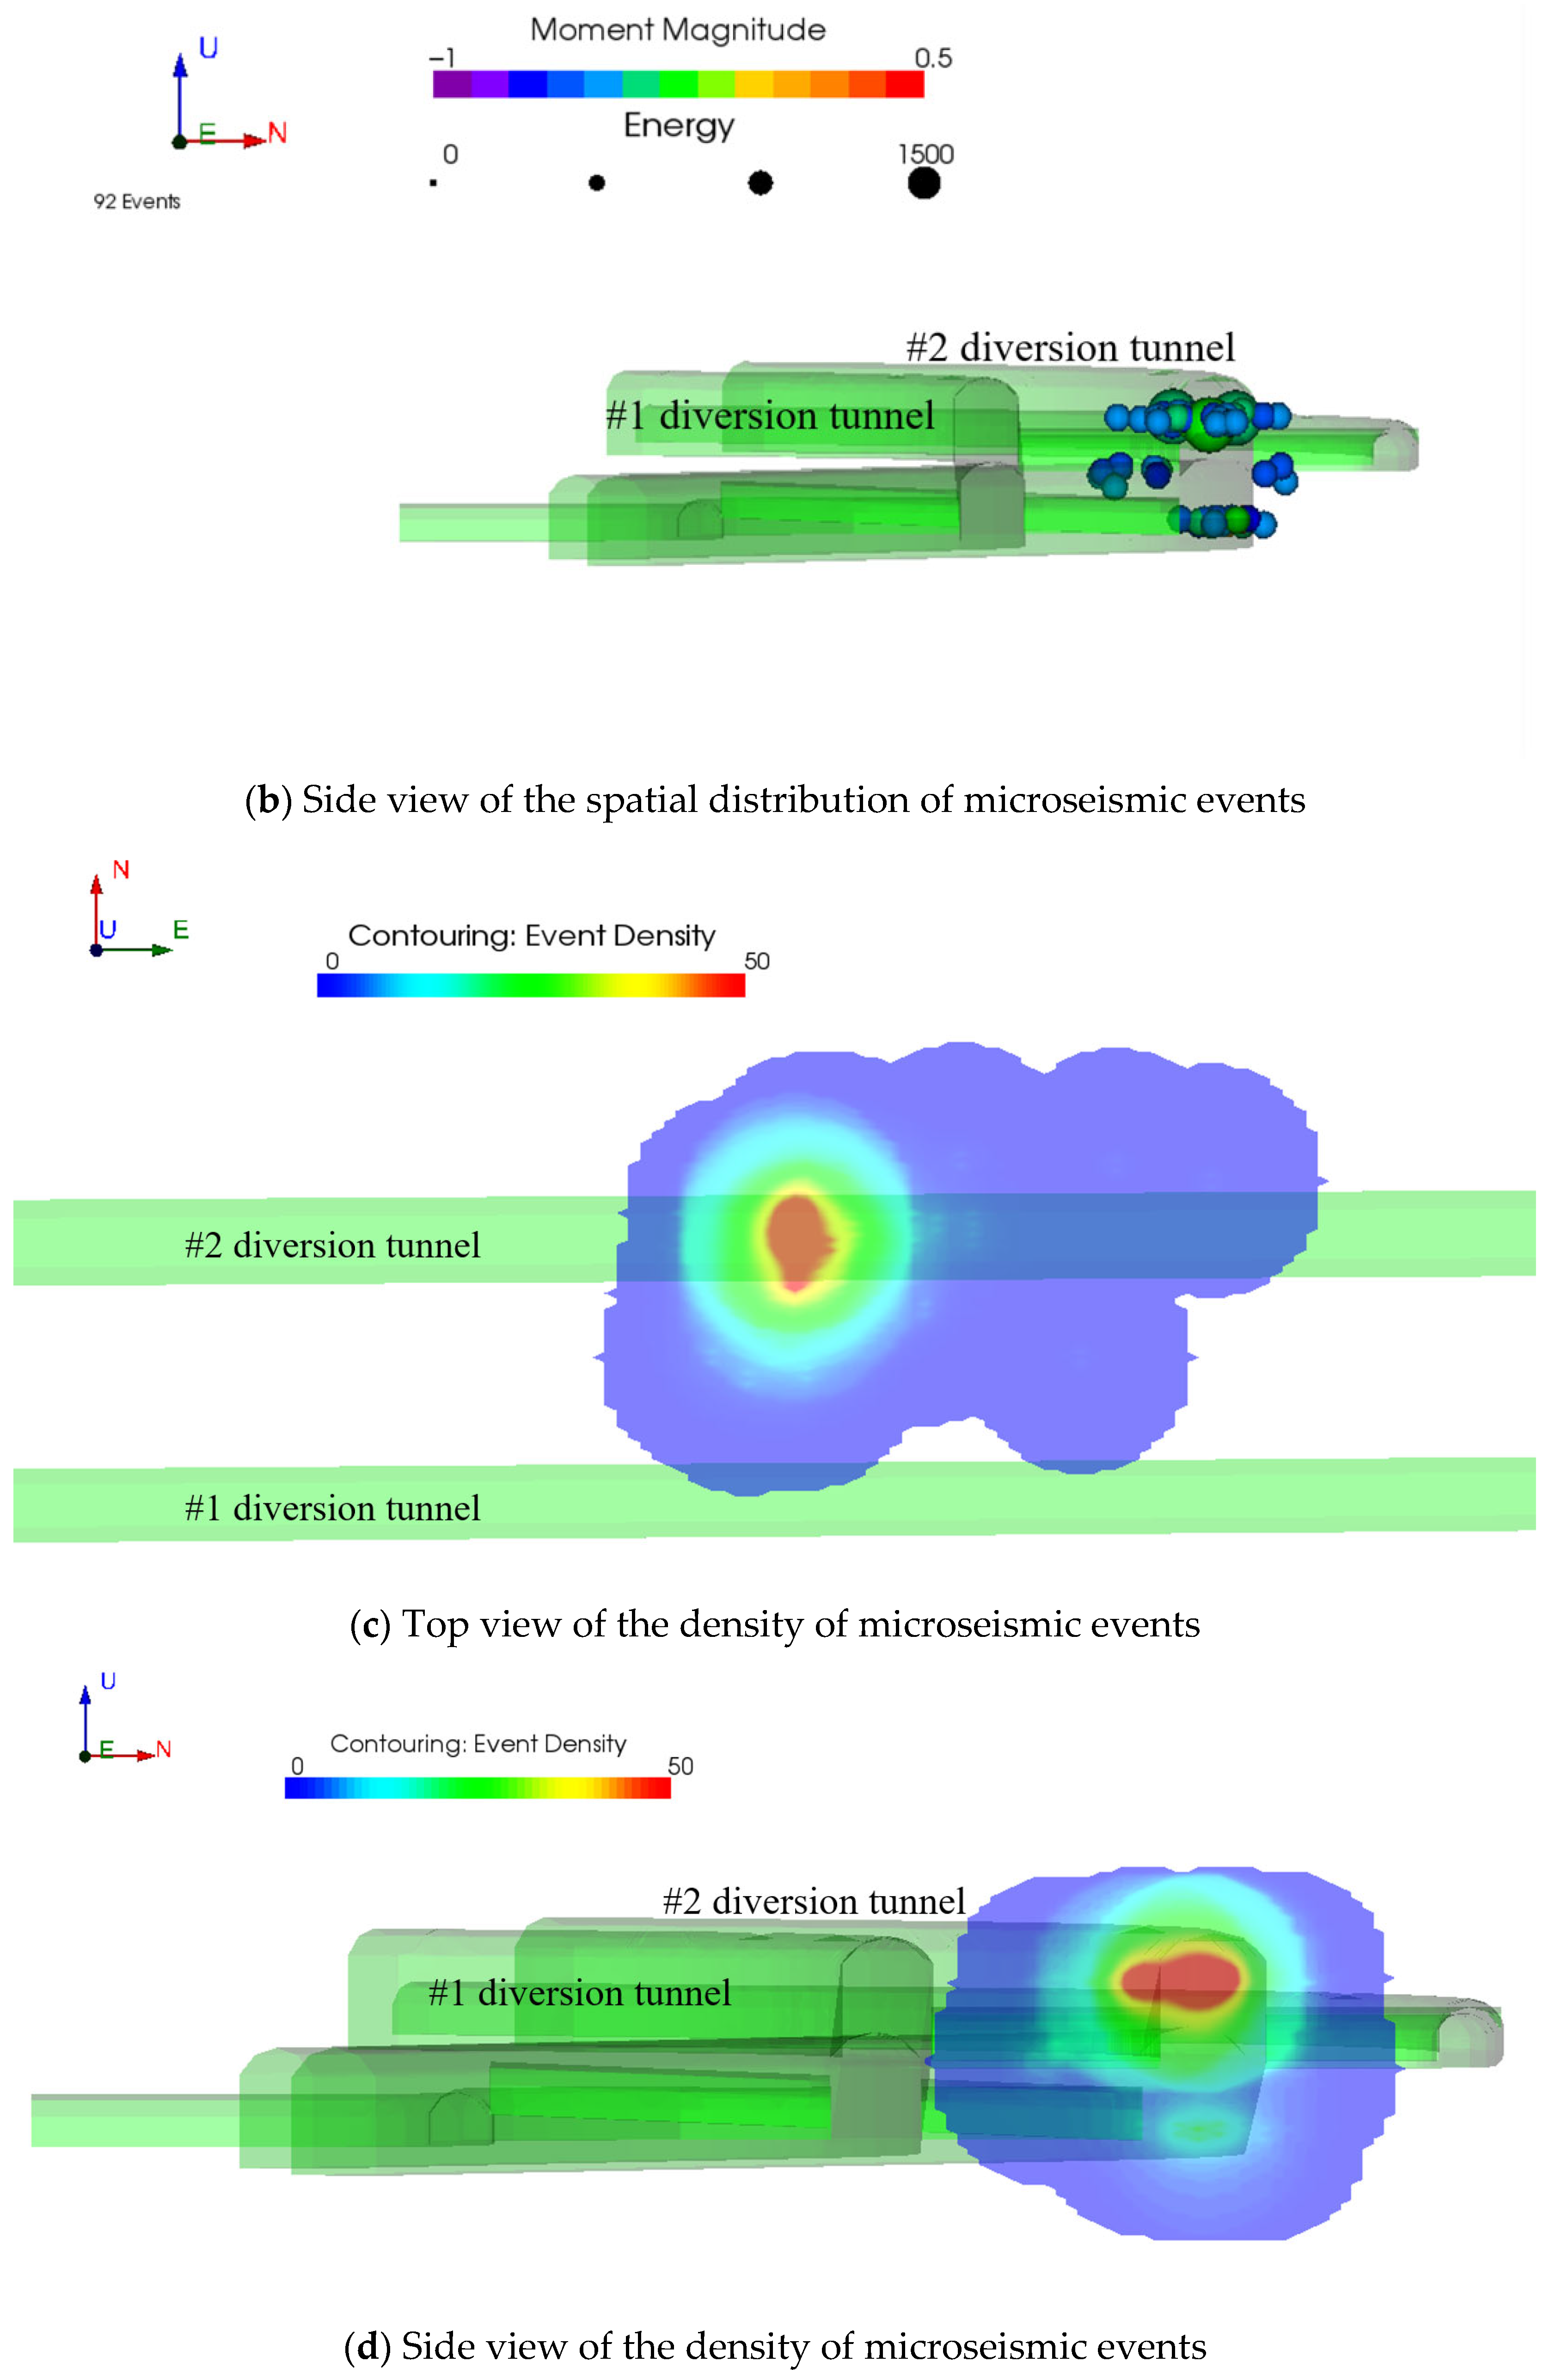
Figure 12 shows the spatial distribution of microseismic events, in which the size of the sphere represents the energy level of microseismic events, and different colors represent varying magnitudes of microseismic events. From Figure 12a,b, it can be seen that most of the microseismic events were distributed near the tunnel vault and corners of the side wall, and a few appeared near the side wall of the tunnel, indicating that most of the microseismic events were distributed at the tunnel vault or corners of the side wall. Therefore, more serious failure occurred in this area. The failure area of the surrounding rock of the tunnel can be seen from the spatial distribution of microseismic events. Figure 12c,d are the density cloud maps of the microseismic events, in which the color shades represent varying densities. It can be seen that the energy loss of the rock mass after tunnel excavation was mainly concentrated near the vault and corners of the side wall, which was consistent with the spatial distribution of microseismic events. Therefore, it can be revealed that this area was the main damage zone of the tunnel rock and there were risks of instability failure.

4.3. Comparison between Modeling Results and Microseismic Monitoring Results

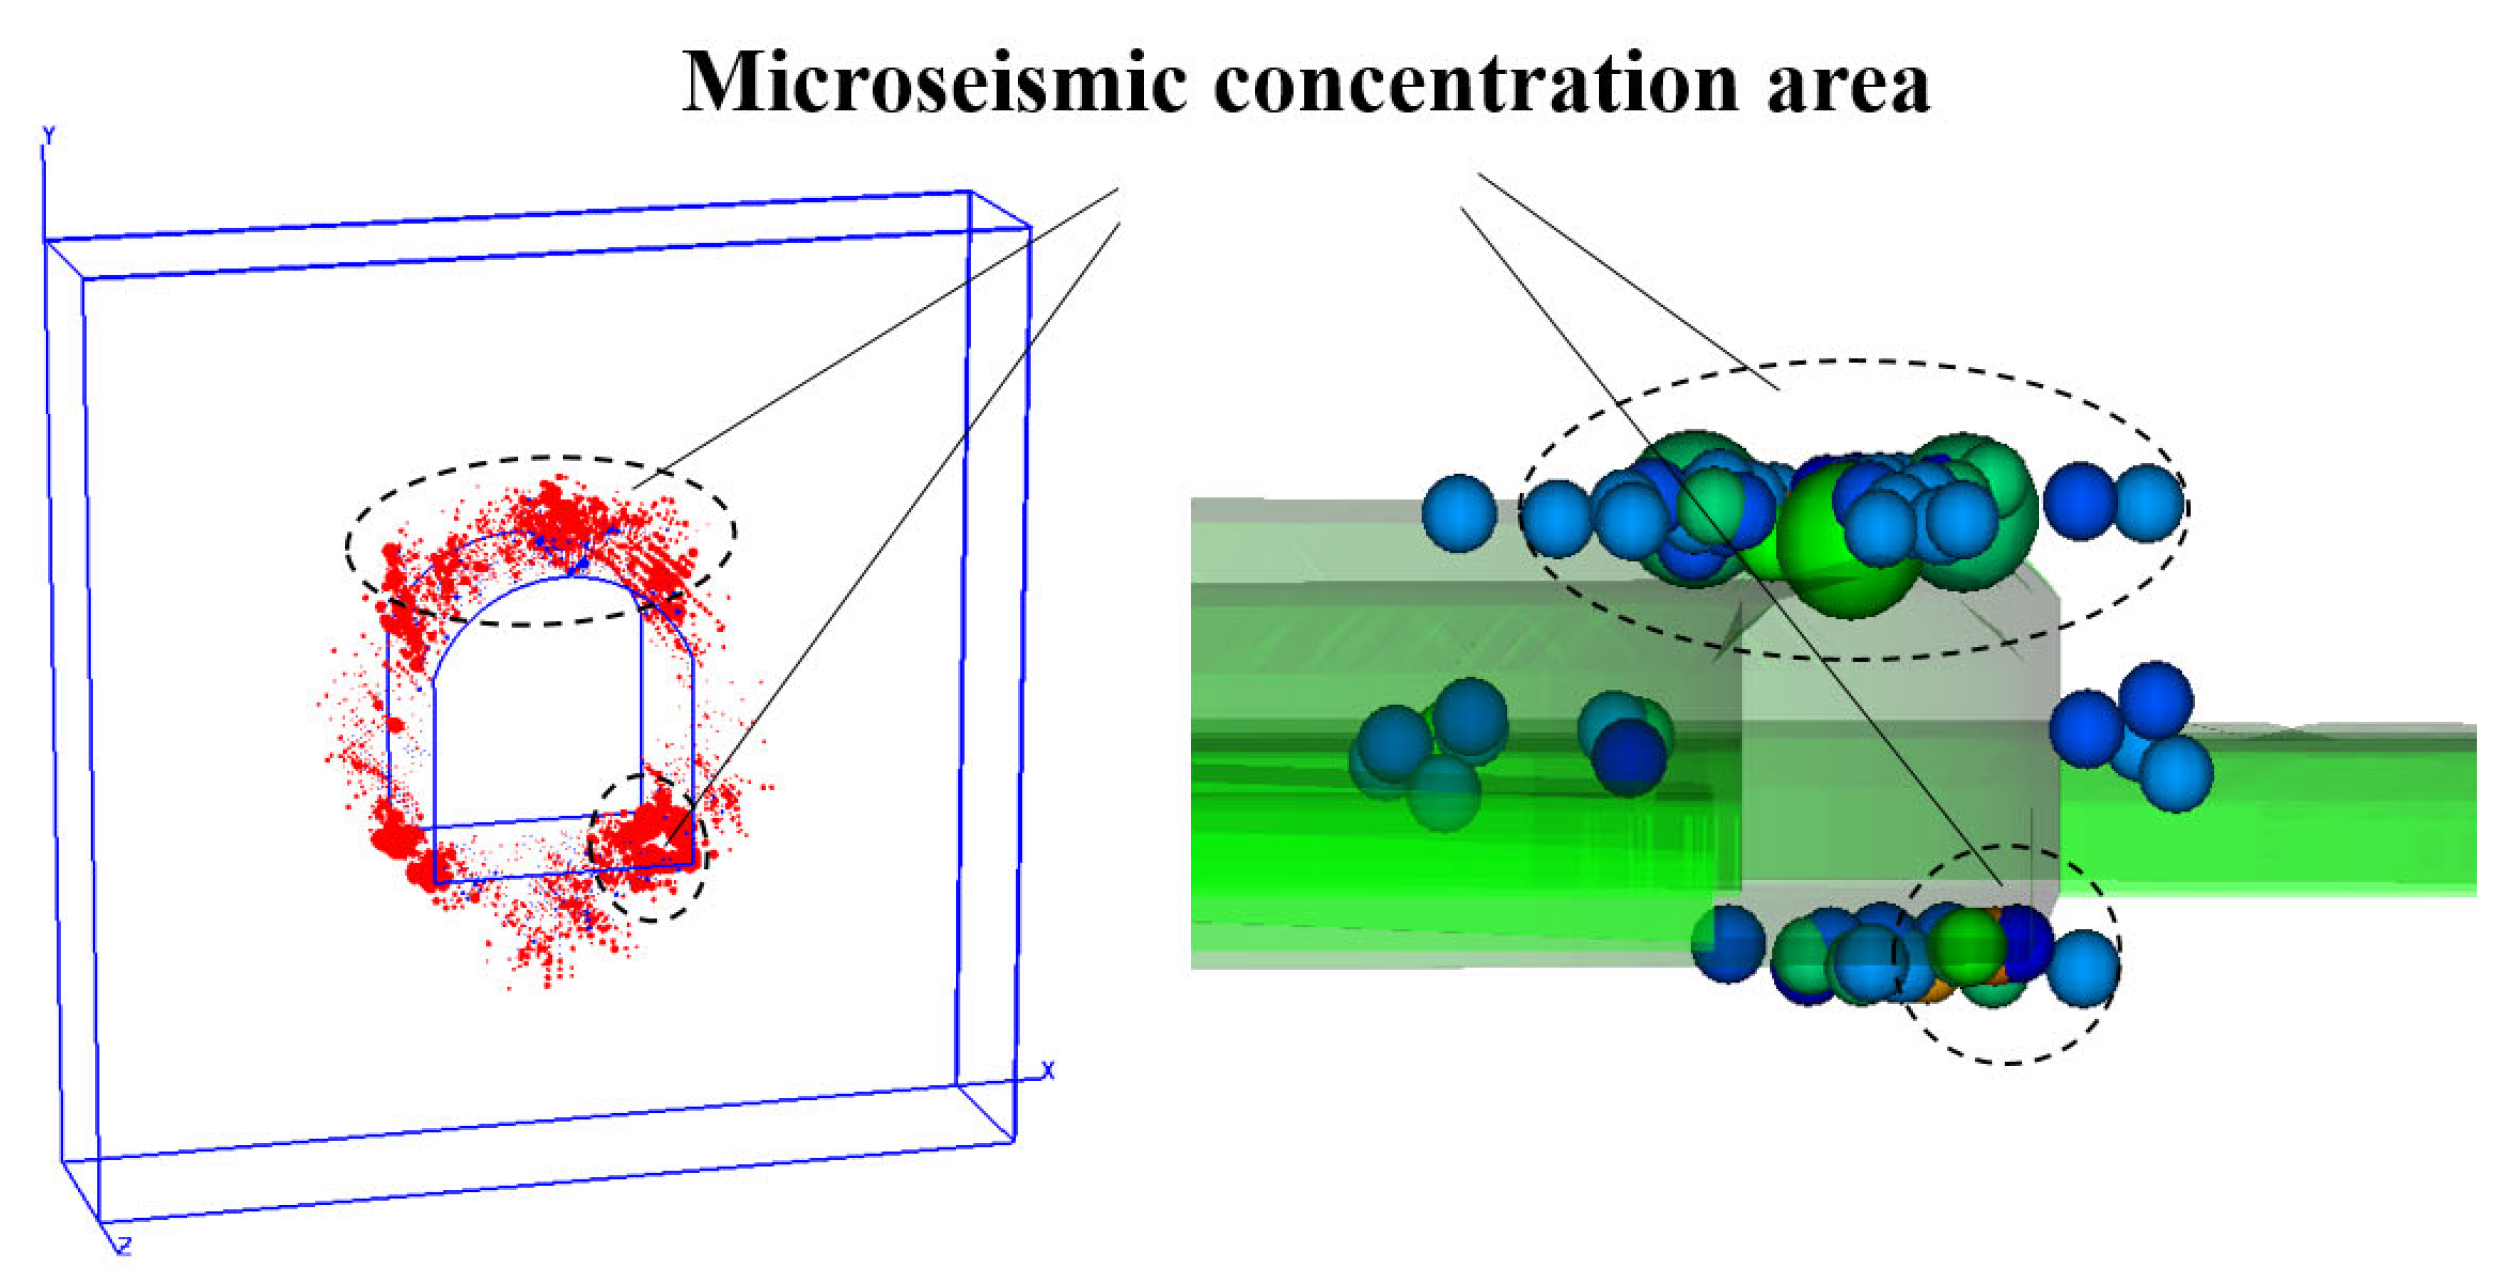
A comparative analysis of the spatial evolution of acoustic emissions during the tunnel failure after excavation modeled by RFPA3D and the monitoring data of microseismic events (as shown in Figure 13) shows that the spatial evolution of acoustic emissions based on the twin-shear unified strength theory and the strength reduction method was consistent with the distribution of detected microseismic events. They all prove that the most serious failure of the surrounding rock occurred at the tunnel vault and corners of the side wall, which had high risks of collapse and rock bursts. According to the seismological theory, the ratio of S-wave energy to P-wave energy, ES/EP, is often used as one of the indicators to reveal the failure mechanism of the surrounding rock. In particular, slip or shear failure often occurs when ES/EP ≥ 10, and tensile failure often occurs when ES/EP ≤ 3 [33]. As can be seen from Figure 10, the majority of microseismic events had ES/EP ≤ 3 in this area and a fraction of microseismic events had ES/EP ≥ 10, so the excavated section of the tunnel was dominated by tensile failure accompanied by shear failure. This conclusion is consistent with the modeling results in Figure 7, which shows that the integrated method based on the combination of field microseismic monitoring and RFPA3D modeling software can be more accurate and effective for stability analysis of the excavation of the #2 diversion tunnel in the Xulong Hydropower Station.
Tensile failure mainly occurs in the excavation of the geologically weak section of the tunnel, and the failure is concentrated at the tunnel vault and corners of the side wall. The existence of joints or faults may worsen the distribution of stress and deformation of surrounding rock. Fractures tend to occur around the locations of joints or faults due to tress concentration and weak mechanical properties of structures. In addition, the energy and magnitude of microseismic events around the structures are relatively large and the failures are dominated by tensile fractures, accompanied with some shear fractures. Therefore, it is necessary to focus on the areas during excavation.

5. Conclusions

Based on RFPA3D numerical modeling and microseismic monitoring, the stability of the excavated geologically weak section of the #2 diversion tunnel in the Xulong Hydropower Station was analyzed and evaluated, with the following conclusions reached:
(1)
Surrounding rock damage after excavation of the geologically weak section of the #2 diversion tunnel was modeled by using RFPA3D. The maximum principal stress concentrated around the tunnel profile and at the corners of the side wall in the study area, and cracks were initiated and grew from the tunnel vault and bottom corner of the side wall until they penetrated the entire profile. Acoustic emissions also started to accumulate at the vault and corners of the side wall and then propagated along the floor and side wall. The acoustic emissions at the vault and corners of the side wall gradually increased in energy, making it a key monitoring target in the study area.
(2)
Microseismic events were mainly concentrated near the vault and footwall during the excavation of stakes K0+765 to K0+775. It was dominated by tensile failure accompanied by shear failure. The frequency of microseismic events could better reflect the frequency of excavation activities in underground plants, and microseismic monitoring helped infer the damage evolution of the rock during the instability failure process of the surrounding rock and delineate the potential risk area.
(3)
The RFPA3D numerical modeling results and the data collected by the actual microseismic monitoring system were consistent, which verified the damage area of the surrounding rock in the excavated geologically weak section. The vault and corners of the side wall, in particular, sustained the most serious damage, so it is necessary to pay close attention to this area and provide timely support. Microseismic monitoring played a key role in controlling the stability of the tunnel surrounding rock, and it is required to continue to strengthen microseismic monitoring and take effective measures to ensure the safety and stability of the slope during the construction and operation periods in the subsequent construction process.

Author Contributions

H.Q. investigated the geological and construction information of the engineering and wrote the first draft of the manuscript. Z.T. conducted the literature review and carried out the numerical simulation. B.L. developed the overarching research goals and analyzed microseismic data. All authors have read and agreed to the published version of the manuscript.

Funding

The research is supported by the National Natural Science Foundation of China (No. 42177143, 42277461), the Science Foundation for Distinguished Young Scholars of Sichuan Province (Grant No. 2020JDJQ0011) and the opening project (No. SKLGP2021K007) of the State Key Laboratory of Geohazard Prevention and Geoenvironment Protection.

Institutional Review Board Statement

Not applicable.

Informed Consent Statement

Not applicable.

Data Availability Statement

The microseismic data related to this research is confidential and cannot be made public.

Acknowledgments

Thanks are given to colleagues at the hydropower station for their valuable contributions to the project. Finally, the authors would like to thank the editors and reviewers for their valuable comments and constructive suggestions.

Conflicts of Interest

The authors declare no conflict of interest.

References

  1. Xiao, Y.-X.; Feng, X.-T.; Feng, G.-L.; Liu, H.-J.; Jiang, Q.; Qiu, S.-L. Mechanism of evolution of stress–structure controlled collapse of surrounding rock in caverns: A case study from the Baihetan hydropower station in China. Tunn. Undergr. Space Technol. 2016, 51, 56–67. [Google Scholar] [CrossRef]
  2. Zhang, C.Q.; Feng, X.-T.; Zhou, H.; Qiu, S.L.; Wu, W.P. Case Histories of Four Extremely Intense Rockbursts in Deep Tunnels. Rock Mech. Rock Eng. 2012, 45, 275–288. [Google Scholar] [CrossRef]
  3. Hafeezur, R.; Abdul, M.N.; Kyoungmin, N.; Saeed, A.; Khan, M.; Han, K.Y. Impact of construction method and ground composition on headrace tunnel stability in the Neelum–Jhelum Hydroelectric Project: A case study review from Pakistan. Appl. Sci. 2021, 11, 1655. [Google Scholar]
  4. Dhawan, K.R.; Singh, D.N.; Gupta, I.D. Three-Dimensional Finite Element Analysis of Underground Caverns. Int. J. Géoméch. 2004, 4, 224–228. [Google Scholar] [CrossRef]
  5. Hao, Y.; Azzam, R. The plastic zones and displacements around underground openings in rock masses containing a fault. Tunn. Undergr. Space Technol. 2005, 20, 49–61. [Google Scholar] [CrossRef]
  6. Yazdani, M.; Sharifzadeh, M.; Kamrani, K.; Ghorbani, M. Displacement-based numerical back analysis for estimation of rock mass parameters in Siah Bisheh powerhouse cavern using continuum and discontinuum approach. Tunn. Undergr. Space Technol. 2012, 28, 41–48. [Google Scholar] [CrossRef]
  7. Ma, K.; Liu, G.Y. Three-dimensional Discontinuous Deformation Analysis of Failure Mechanisms and Movement Characteristics of Slope Rockfalls. Rock Mech. Rock Eng. 2022, 55, 275–296. [Google Scholar] [CrossRef]
  8. Song, R.; Liu, J.; Yang, C.; Sun, S. Study on the multiphase heat and mass transfer mechanism in the dissociation of methane hydrate in reconstructed real-shape porous sediments. Energy 2022, 254, 124421. [Google Scholar] [CrossRef]
  9. Cai, M.; Kaiser, P.; Morioka, H.; Minami, M.; Maejima, T.; Tasaka, Y.; Kurose, H. FLAC/PFC coupled numerical simulation of AE in large-scale underground excavations. Int. J. Rock Mech. Min. Sci. 2006, 44, 550–564. [Google Scholar] [CrossRef]
  10. Jing, L. Formulation of discontinuous deformation analysis (DDA)—An implicit discrete element model for block systems. Eng. Geol. 1998, 49, 371–381. [Google Scholar] [CrossRef]
  11. Andersson, J.C.; Martin, C.D. The Äspö pillar stability experiment: Part I—Experiment design. Int. J. Rock Mech. Min. Sci. 2009, 46, 865–878. [Google Scholar] [CrossRef]
  12. Yan, C.-B. Blasting cumulative damage effects of underground engineering rock mass based on sonic wave measurement. J. Central South Univ. Technol. 2007, 14, 230–235. [Google Scholar] [CrossRef]
  13. Li, S.; Yu, H.; Liu, Y.; Wu, F. Results from in-situ monitoring of displacement, bolt load, and disturbed zone of a powerhouse cavern during excavation process. Int. J. Rock Mech. Min. Sci. 2008, 45, 1519–1525. [Google Scholar] [CrossRef]
  14. Yan, P.; Lu, W.; Chen, M.; Hu, Y.-G.; Zhou, C.-B.; Wu, X.-X. Contributions of In-Situ Stress Transient Redistribution to Blasting Excavation Damage Zone of Deep Tunnels. Rock Mech. Rock Eng. 2014, 48, 715–726. [Google Scholar] [CrossRef]
  15. Li, B.; Ding, Q.F.; Xu, N.W.; Dai, F.; Xu, Y.; Qu, H.L. Characteristics of microseismic bvalue associated with rock mass large deformation in underground powerhouse caverns at different stresslevels. J. Cent. South Univ. 2022, 29, 693–711. [Google Scholar] [CrossRef]
  16. Li, B.; Xu, N.; Dai, F.; Zhang, G.; Xiao, P. Dynamic analysis of rock mass deformation in large underground caverns considering microseismic data. Int. J. Rock Mech. Min. Sci. 2019, 122, 104078. [Google Scholar] [CrossRef]
  17. Leśniak, A.; Isakow, Z. Space–time clustering of seismic events and hazard assessment in the Zabrze-Bielszowice coal mine, Poland. Int. J. Rock Mech. Min. Sci. 2009, 46, 918–928. [Google Scholar] [CrossRef]
  18. Hudyma, M.; Potvin, Y.H. An Engineering Approach to Seismic Risk Management in Hardrock Mines. Rock Mech. Rock Eng. 2009, 43, 891–906. [Google Scholar] [CrossRef]
  19. Ma, J.; Dong, L.; Zhao, G.; Li, X. Focal Mechanism of Mining-Induced Seismicity in Fault Zones: A Case Study of Yongshaba Mine in China. Rock Mech. Rock Eng. 2019, 52, 3341–3352. [Google Scholar] [CrossRef]
  20. Cai, M.; Kaiser, P.; Martin, C. Quantification of rock mass damage in underground excavations from microseismic event monitoring. Int. J. Rock Mech. Min. Sci. 2001, 38, 1135–1145. [Google Scholar] [CrossRef]
  21. Ma, K.; Tang, C.-A.; Xu, N.-W.; Liu, F.; Xu, J.-W. Failure precursor of surrounding rock mass around cross tunnel in high-steep rock slope. J. Central South Univ. 2013, 20, 207–217. [Google Scholar] [CrossRef]
  22. Dai, F.; Li, B.; Xu, N.; Fan, Y.; Zhang, C. Deformation forecasting and stability analysis of large-scale underground powerhouse caverns from microseismic monitoring. Int. J. Rock Mech. Min. Sci. 2016, 86, 269–281. [Google Scholar] [CrossRef]
  23. Liang, B.; Jiang, H.L.; Sun, W.J.; Jin, J.X. Numerical simulation study on seepage characteristics of multi-fractured rock mass. J. Water Resour. Water Eng. 2013, 6, 79–81. [Google Scholar]
  24. Tang, C.A.; Hudson, J.A. Rock Failure Mechanisms: Explained and Illustrated; CRC Press: Baca Raton, FL, USA, 2010. [Google Scholar]
  25. Liang, Z.Z. Three-Dimensional Failure Process Analysis of Rock and Associated Numerical Tests; Northeastern University: Shenyang, China, 2005. [Google Scholar]
  26. Yu, M.H. Unified strength theory for geomaterials and its applications. Chin. J. Geotech. Eng. 1994, 16, 1–9. [Google Scholar]
  27. Liang, C.; Zhang, G.; Li, L.; Li, B.; Luo, Y.; Li, Y.; Duan, J.; Wu, X. Efficient Fault Surface Grouping in 3-D Seismic Fault Data. IEEE Trans. Geosci. Remote Sens. 2022, 60, 5916213. [Google Scholar] [CrossRef]
  28. Wu, N.; Liang, Z.; Zhang, Z.; Li, S.; Lang, Y. Development and verification of three-dimensional equivalent discrete fracture network modelling based on the finite element method. Eng. Geol. 2022, 306, 106759. [Google Scholar] [CrossRef]
  29. Wu, N.; Liang, Z.; Li, Y.; Qian, X.; Gong, B. Effect of confining stress on representative elementary volume of jointed rock masses. Geomech. Eng. 2019, 18, 627–638. [Google Scholar]
  30. Xue, R.X.; Liang, Z.Z.; Xu, N.W. Rockburst prediction and analysis of activity characteristics within surrounding rock based on microseismic monitoring and numerical simulation. Int. J. Rock Mech. Min. Sci. 2021, 142, 104750. [Google Scholar] [CrossRef]
  31. Tang, C.A.; Li, L.C.; Li, C.W.; Ma, T.H. RFPA strength reduction method for stability analysis of geotechnical engineering. Chin. J. Rock Mech. Eng. 2006, 25, 1522–1530. [Google Scholar]
  32. Li, S.Y.; He, X.S.; Zhang, S.Q.; Lu, Q.H.; Jiang, X.Q.; Tong, X.H.; Li, T.; Guan, E.F.; Zuo, Y.; Sun, X.H.; et al. Progress and latest achievements of mine seismic monitoring technology. Prog. Geophys. 2004, 4, 853–859. [Google Scholar]
  33. Boatwright, J.; Fletcher, J.B. The partition of radiated energy between P and S waves. Bull. Seismol. Soc. Am. 1984, 74, 361–376. [Google Scholar] [CrossRef]
Figure 1. Geological axis profile of the #2 diversion tunnel.
Applsci 12 09939 g001
Figure 2. Model meshing.
Applsci 12 09939 g002
Figure 3. A 3D calculation model.
Applsci 12 09939 g003
Figure 4. Distribution of the maximum principal stress.
Applsci 12 09939 g004
Figure 5. Distribution of the maximum principal strain.
Applsci 12 09939 g005
Figure 6. Distribution of the elastic modulus.
Applsci 12 09939 g006
Figure 7. Acoustic emissions during the tunnel failure.
Applsci 12 09939 g007
Figure 8. Network topology of the microseismic monitoring system.
Applsci 12 09939 g008
Figure 9. Temporal distribution of microseismic events.
Applsci 12 09939 g009
Figure 10. Es/Ep of microseismic energy.
Applsci 12 09939 g010
Figure 11. Deformation and failure of the surrounding rock on the left side of the tunnel face.
Applsci 12 09939 g011
Figure 12. Spatial distribution of microseismic events.
Applsci 12 09939 g012aApplsci 12 09939 g012b
Figure 13. Comparison between numerical modeling and field monitoring.
Applsci 12 09939 g013
Table 1. Mechanical parameters of the rock mass.
Elastic Modulus (GPa)Uniaxial Compressive Strength (MPa)Poisson’s RatioInternal Friction Angle (°)Residual StrengthCoefficient of Confining PressureCoefficient of Homogeneity
10350.25300.125
Publisher’s Note: MDPI stays neutral with regard to jurisdictional claims in published maps and institutional affiliations.