Article

Research on Cavitation Characteristics of Two-Throat Nozzle Submerged Jet

1
Marine Engineering College, Dalian Maritime University, Dalian 116026, China
2
College of Ocean Engineering, Guangdong Ocean University, Zhanjiang 524088, China
*
Author to whom correspondence should be addressed.
Appl. Sci. 2022, 12(2), 536; https://doi.org/10.3390/app12020536
Submission received: 3 November 2021 / Revised: 20 December 2021 / Accepted: 3 January 2022 / Published: 6 January 2022
(This article belongs to the Section Marine Science and Engineering)

Abstract

:
Ship fouling not only increases ship resistance and fuel consumption but is equally a type of biological invasion, which causes severe ecological damage. Submerged cavitation jet cleaning is an environmentally friendly, high-efficiency, and energy-saving cleaning method. The nozzle structure has an essential influence on the cleaning effect. Thus, a two-throat nozzle was designed for application in submerged cavitation jet cleaning. To investigate the cavitation characteristics of the two-throat nozzle, a high-speed photographic visualization experiment and an erosion experiment concerning the submerged cavitation jet were carried out in this study. The frame-difference method (FDM) was used to analyze the dynamic changes in the cavitation cloud in a single period. The dynamic changes in the cavitation cloud and the characteristics of the submerged cavitation jet were investigated under different inlet pressures. The sample mass loss and the macroscopic and microscopic changes in surface morphology were used to evaluate the cavitation intensity of the two-throat nozzle submerged jet. The experimental results demonstrate that the two-throat nozzle has a good cavitation effect, and the cavitation cloud of the submerged jet has obvious periodicity. With the increase in inlet pressure, the length, width, and area of the cavitation cloud continue to increase, and the shedding frequency of the cavitation cloud continues to decrease. The intensity of cavitation erosion is related to target distance and impact time. There is an appropriate target distance by which to achieve the optimal cavitation effect. The collapse of cavitation bubbles near the sample surface is related to the erosion distribution on the sample surface. Moreover, the magnitude of the absolute values of the root-mean-square surface roughness and surface skewness increase with cavitation intensity. The results in this paper are helpful for a better understanding of the cavitation characteristics of the two-throat nozzle submerged jet.

1. Introduction

After a ship has sailed in the ocean for a long time, the hull’s surface immersed in the seawater will be polluted by marine organisms, which consist of biological shellfish, algae plants, and other marine organisms. The attached marine organisms increase the roughness of the hull and the resistance, leading to increased fuel consumption [1]. In addition, it has been proved that ship fouling is a critical way by which invasive aquatic organisms are transferred, which can pose a severe threat to the local ecological environment [2,3]. Therefore, effective and timely cleaning of ship fouling has a significant effect on ship energy conservation and environmental protection.
Submerged cavitation jet cleaning is a kind of ship fouling cleaning method with great potential and has attracted increasing attention. Submerged cavitation jet cleaning mainly uses micro-jets generated by the collapse of cavitation bubbles and extremely high collapse energy to achieve the purpose of cleaning. It has been shown that the micro-jet velocity can reach 70–180 m/s, the hitting pressure can reach 140–170 MPa, and the resonance frequency is about 100–1000 times/(s∙cm2) [4]. Moreover, cavitation jet cleaning has the characteristics of environmental protection, high efficiency, energy-saving properties, and high safety. It is widely used in underwater cleaning [5], cutting [6], material testing [7], underground drilling [8], and deep-sea mining [9], etc. According to previous studies, the performance of a submerged cavitation jet is closely related to the cavitation intensity. In order to improve the erosion ability of the cavitation jet, it is necessary to enhance the cavitation intensity. The cavitation erosion performance of cavitation jets is influenced by several factors, such as working conditions (upstream and downstream pressure, cavitation number), the temperature of the working fluid, the geometric parameters of the test material (offset and angle of attack), and the structural parameters of the nozzle [10,11,12,13]. To enhance the cavitation performance, many researchers have investigated the growth, development, and collapse mechanisms of cavitation bubbles and the characteristics of the cavitation clouds. Soyama et al. [14] conducted a visualization study of cavitation jets of different types of nozzles (conical, cylindrical, and trumpet) using high-speed photography technology. It was found that the shedding frequency of the cavitation cloud decreases with the increase in inlet pressure and the maximum length of the cavitation cloud. Hutli et al. [15] found that the cavitation cloud motion morphology of the cavitating jet varied with the shape and size of the nozzle. Petkovsek et al. [16] investigated the structure of the cavitation clouds and the erosion effect on aluminum foils during the collapse of vacuolated clouds by visualization experiments. They found that irregular or “broken” cavitation clouds have a more significant erosion effect on aluminum foils.
To investigate the relationship between the cavitation cloud and the cavitation intensity, Peng et al. [17] conducted high-speed photographic visualization experiments and erosion experiments. The Proper Orthogonal Decomposition (POD) method was used to analyze the spatial and temporal distribution of the cavitation cloud. The morphology of the aluminum block sample was evaluated at macroscopic and microscopic scales after erosion. The results showed that the vacuole collapse was a necessary but insufficient condition for severe cavitation. Watanabe et al. [18] investigated the structure of the cavitation cloud and the erosion characteristics of the cavitation jet by a combination of an optical microscope, a scanning electron microscope, erosion characteristic measurement, simultaneous shadowgraph imaging, and acceleration pulse measurement. It was found that the collapse of the cavitation bubbles near the sample surface was related to the erosion distribution on the sample surface. Fujisawa et al. [19] observed the collapse process of the cavitation cloud and the formation of excitation waves with and without the appearance of walls simultaneously by the frame-difference method (FDM) and the laser schlieren method. They obtained the same conclusion as that of Watanabe et al. [18]. In addition, it was also found that the collapse of the cavitation bubbles generates shock waves at the same time. Hutli et al. [13] similarly demonstrated that the annular erosion area of the sample surface matched the distribution of cavitation bubble collapse. Fujisawa et al. [20] detected the formation of pits by high-speed photography and used a sensor made of gold foil glued to a transparent glass plate. It was found that pits would be formed on the wall when the cavitation cloud collapses during the periodic movement of the cavitation jet.
As a critical device of the cavitation jet, the nozzle’s structure has a significant influence on cavitation intensity [13]. Further improving the cavitation intensity by improving the design of cavitation nozzles has become a hot topic. Several researchers have improved the cavitation effect by altering the nozzle exit geometry. Cai et al. [21] investigated the influence of different nozzle exit shapes of organ pipe nozzles on the cavitation erosion characteristics. The results showed that there is an optimal size of nozzle exit by which to obtain the maximum erosion effect. Likewise, Soyama [22] found that the erosion rate depended on the geometry of the nozzle. Li et al. [23] found that the nozzle exit angle of the organ pipe nozzle had a significant influence on the axial pressure. It was shown that the nozzle exit angle improved the efficiency of the organ pipe nozzle by affecting the interaction between the nozzle exit and the jet flow. Similarly, some researchers have optimized the resonant cavity structure of the self-excited oscillation nozzle. Cai et al. [24] investigated the effect of the contraction ratio between the upstream and downstream of the resonant cavity of the organ pipe nozzle on the frequency and the erosion characteristics of self-excited oscillation cavitation jets. It was found that there is an optimal geometric structure by which to achieve the maximum resonant amplitude and mass loss. Wang et al. [25] obtained a novel self-excited oscillating cavity structure by adopting Bessel curves to reconstruct the transition surface of the self-excited oscillating cavity walls, which can effectively utilize the pulse energy to enhance cavitation intensity. Fang et al. [26] adopted large eddy simulation to study the influence of nozzle collapse walls on the cavitation jet and found that the self-excited oscillation cavitation effect was the best when the shape of the upper and lower nozzle collapse walls was the same. Beyond this, Li et al. [27] studied the influence of feeding pipe diameter on the erosion performance from the perspective of wave propagation and damping. It was found that the feeding pipe affected the cavitation performance by affecting the aquatic waves and self-resonance. The above research focused on optimizing the geometric structure of the nozzle to enhance the cavitation performance. However, many researchers have also worked on novel nozzles and achieved satisfactory results. A concentric nozzle designed by Soyama et al. [5] successfully generated a cavitation jet in the air. Yuan et al. [28] proposed a novel nozzle with a Venturi tube and a Helmholtz resonator. The results showed that, compared with the conventional Helmholtz nozzle, the peak and average outlet pressure of the composite nozzle were increased by 45% and 12.5%, respectively.
To sum up, optimizing the nozzle geometry and designing novel structures have become necessary means by which to enhance the cavitation intensity. In this paper, a novel two-throat cavitation nozzle was designed, and high-speed photographic visualization experiments and erosion experiments were conducted. The FDM was used to analyze the cavitation cloud in a single period under different inlet pressures. Moreover, the macroscopic and microscopic evaluation of the cavitation characteristics of the two-throat nozzle submerged cavitation jet were carried out under different target distances and impact time.

2. Materials and Methods

2.1. Experimental Setup

Figure 1 shows the schematic diagram of the cavitation jet experimental system. A high-pressure piston pump was used to provide upstream pressure with a maximum pressure of 20 MPa and a flow rate of 10 L/min. A pressure gauge with a range of 0–40 MPa was used to measure the outlet pump pressure. A turbine flowmeter was used to measure the flow rate into the nozzle. A transparent polymethyl methacrylate water tank with 800 mm × 800 mm × 600 mm was used as the experimental vessel. An overflow port was arranged on the top of one side of the water tank to keep the nozzle submergence depth constant. A sliding table with a screw slider was installed on the top of the water tank. The two-throat nozzle was fixed on the screw slider with three degrees of freedom, and the repeatable positioning accuracy of the screw slider was 0.01–0.02 mm. The distance between the nozzle and the liquid level in the water tank should be greater than 200 mm to ensure that the submerged cavitation jet is not disturbed by the fluctuation of the liquid level. Filtered tap water was used as the working fluid during the experiment. As a large amount of heat will be released due to the collapse of cavitation bubbles during the experiment, the water temperature of the water tank will keep rising. Thus, the water temperature should be controlled at 15–18 °C during the experiment. The water temperature was measured using a mercury thermometer every 5 min. Once the water temperature exceeds 18 °C, the experiment should be stopped immediately. The experiment can continue after the water in the water tank is replaced. The structure of the two-throat nozzle investigated in this paper was designed based on the literature [29,30], as shown in Figure 2. According to Bernoulli’s principle, the hydrostatic pressure decreases, and bubbles are produced due to a reduction in its area when the liquid flows through the first throat of the two-throat nozzle. As the area inside the nozzle increases, the pressure rises, and the bubble ruptures to form several bubble nuclei moving downstream with the flow. Similarly, several bubble nuclei are produced in the second throat of the two-throat nozzle. Theoretically, the presence of bubble nuclei is a prerequisite for cavitation. Increasing the number of bubble nuclei can enhance the cavitation performance of the nozzle submerged jet. The structural parameters of the two-throat nozzle are shown in Table 1.

2.2. Image Analysis

A Phantom high-speed camera was used for shooting. The size of the shooting area was 256 × 256 pix, the shooting frequency was 20,000 fps, and the exposure time was 50 μs. A halogen spotlight was used to illuminate the shooting area from one side. The cavitation cloud was opaque and reflective, so it appears white in the image. In order to observe the periodic changes in the cavitation cloud, the high-speed photographic images were processed by the FDM. The FDM was used to subtract the corresponding pixels of the two images in order to weaken the similar parts of the images and highlight the changed parts of the images, as shown in Figure 3. In the figure, the generation of the cavitation cloud is shown in red, and the collapse of the cavitation cloud is shown in blue.

2.3. Cavitation Intensity Evaluation

The cavitation intensity of the two-throat nozzle submerged cavitation jet was evaluated by measuring the mass loss and surface morphology change in aluminum 1060 (Chinese Industry Standard). The chemical composition and physical properties of the sample are shown in Table 2 and Table 3. The size of all the samples was 50 mm × 50 mm × 10 mm. The surface roughness of the samples was less than 1.0 μm after being polished by 2000 mesh sandpaper and 0.5 μm metal grinding paste. Before and after each test, the samples were ultrasonically cleaned with anhydrous ethanol for 10 min. After the samples were dried, an electronic analytical balance (Mettler Toledo MS304S) with an accuracy of ± 0.1 mg was used to weigh the samples three times to calculate the mass loss of the samples. The mass loss rate was used to evaluate the effect of the impact time on the cavitation intensity of the two-throat nozzle submerged cavitation jet.
The mass loss rate ER is defined as follows:
E R = Δ m t
where Δm is the mass loss of the sample, and t is the impact time.
In order to observe the effect of the submerged cavitation jet on the microscopic morphology of the sample surface, a laser scanning confocal microscope (LEXT OLS 3000) was used to observe the three-dimensional morphology on the surface of the sample, and the experimental results were analyzed.

3. Results and Discussion

3.1. Dynamic Change in the Cavitation Cloud in a Single Period

Figure 4 shows the high-speed photographic images of the cavitation cloud under an inlet pressure of 20 MPa in a single period, where X is the width of the cavitation cloud, and Y is the length of the cavitation cloud. The interval between the two adjacent images was 0.1 ms. It can be seen from Figure 4a that the cavitation cloud generated by the two-throat nozzle submerged cavitation jet had obvious periodicity. In a single period, the cavitation cloud mainly went through four phases: inception, growth, shedding, and collapse. At 0 ms, the cavitation cloud was distributed near the nozzle exit and was in the inception phase. At 0.1 ms, the cavitation cloud began to fall off. During the period from 0.1 ms to 0.8 ms, the cavitation cloud was in the growth phase. The cavitation cloud kept moving downstream with the increase in length and width. At 0.8 ms, the cavitation cloud reached its maximum length and width at this moment. At 0.9 ms, the final stage of the collapse of the cavitation cloud was observed. In Figure 4b, it can be seen from the FDM diagram that the generation and disappearance of the cavitation cloud near the nozzle is mainly concentrated in the shear layers on both sides of the jet. Whereas, the generation and disappearance of the cavitation cloud in the downstream of the jet are mainly concentrated in the center of the jet. This is because the pressure fluctuation of the jet shear layer decreased. The environmental pressure replaced the jet shear layer pressure, which plays a significant role in the dynamic change in the cavitation cloud. According to the FDM diagram, the moment when the cavitation cloud entered the collapse phase can be determined more intuitively. The collapse of the cavitation cloud mainly occurred after the fracture of the cavitation cloud and is concentrated in the latter half of the cavitation cloud. The cavitation cloud of the previous period began to fall off at 0 ms. Whereas, the cavitation cloud of the new period generated and entered the grow phase, as indicated in the figure in red. At 0.8 ms, the cavitation cloud of the previous period collapsed completely. The collapse area was concentrated in the range of Y = 20–30 mm.
In order to investigate the effect of inlet pressure on the dynamic change of the cavitation cloud, visualization experiments with high-speed photography were carried out under the inlet pressures of 20 MPa, 15 MPa, and 10 MPa. The experimental results are shown in Figure 4, Figure 5 and Figure 6, respectively. It can be seen that the length, width, and area of the cavitation cloud had significant differences under different inlet pressures. Due to the injection flow rate and the intensification of cavitation within the shear layer, the size of the cavitation cloud increased with the increase in inlet pressure. Moreover, the asymmetry of the cavitation cloud increased as the inlet pressure increased. This indicates that the fluctuation of the cavitation cloud boundary is more severe with the increase in inlet pressure. The shedding frequency of the cavitation cloud determines the frequency of cavitation, which directly affects the effect of cavitation. By comparing the process of the cavitation cloud from shedding to complete collapse under different inlet pressures, it was found that the shedding phase of the cavitation cloud increased slightly with the increase in inlet pressure. The shedding phase of the cavitation cloud was about 0.6 ms, 0.7 ms, and 0.8 ms when the inlet pressures were 10 MPa, 15 MPa, and 20 MPa, respectively. This indicates that the shedding frequency of the cavitation cloud decreases with the increase in inlet pressure. This result is consistent with that obtained by Hutli et al. [15].

3.2. Macroscopic Evaluation of Cavitation Characteristics

The mass loss method is a standard method for the evaluation of the cavitation intensity of cavitation jets. In this paper, the cavitation performance of the submerged cavitation jet was studied under different target distances and impact times. Figure 7 shows the surface morphology change of the samples after impact by the submerged cavitation jet under different target distances when the inlet pressure was 20 MPa and the impact time was 30 min. As can be seen from the figure, the surface morphology change of the sample was mainly deep pits formed by high-speed impinging jets when the target distances were 15 mm and 20 mm. However, the cavitation effect only caused slight erosion along the periphery of the deep pits, as shown in Figure 7a,b. This phenomenon is consistent with the distribution of cavitation bubbles in the cavitation jet obtained by Satoli et al. [31] using high-speed photography. However, this is not what we expected. For the submerged cavitation jets, the collapse of the cavitation cloud occurred in the shear layer around the jet, as mentioned above. Therefore, the typical cavitation characteristic of the submerged cavitation jet was annular pits formed on the surface of the sample with the jet impact point as the center. It can be seen from Figure 7c,h, that the depth and diameter of the central pit gradually decreased and finally disappeared with the increase in target distance. In addition, the outside diameter of the annular pits formed on the surface of the sample increased first and then decreased. It reached the maximum when the target distance was 35 mm.
Figure 8 shows the mass loss of the samples under different target distances. It can be seen from the figure that there were two peaks of mass loss when the target distance increased from 15 mm to 50 mm. Moreover, the two peaks of mass loss are the unique feature of the cavitation jet [32,33,34]. The first peak of mass loss occurred when the target distance was 15 mm. As the target distance increased, the mass loss decreased from the first peak, rose to the second peak, and decreased again. The reason for the first peak is that there was a large central hole, as shown in Figure 7a, made by the high-speed impinging jet, which made up almost all of the mass loss. The second peak was caused by cavitation erosion. The cavitation bubble did not have enough time to grow and collapse on the surface of the sample when the target distance was short. The collapsed cavitation bubbles only left many dense shallow pits on the surface of the sample, resulting in less mass loss. When the target distance was 30 mm, the cavitation cloud could fully develop and collapse just as it reached the surface of the sample. The tiny cavitation bubbles were locally broken instantly to form a vast destructive ability, causing dense honeycomb-shaped pits on the surface. At this time, the collapse intensity, bubble concentration balance, and cavitation erosion were the most significant. Therefore, the mass loss of the samples caused by cavitation erosion was the largest. When the target distance was more than 30 mm, most of the cavitation bubbles collapsed and rebounded several times before reaching the surface of the sample. This will reduce the number of bubbles that can reach the surface of the sample, leading to a reduction in the cavitation effect. In addition, the impact force of the submerged cavitation jet was also weakened. As both of these effects decreased, the mass loss of the sample and the diameter of the annular pits decreased simultaneously.
Figure 9 shows the surface morphology change of the sample under different impact times when the inlet pressure was 20 MPa and the target distance was 30 mm. It can be seen that the annular area formed by cavitation erosion gradually increased with the increase in impact time. Figure 10 shows the variation of mass loss and mass loss rate with the impact time. The mass loss of the sample increased linearly with the increase in impact time. However, the mass loss rate of the sample increased rapidly at first and then increased slowly. The mass loss rate of the sample reached the maximum value at 20–30 min Then, the mass loss rate became smaller and finally stabilized. The cavitation erosion on the sample went through latent, accelerated, stable, and decaying phases in turn [23] with increasing impact time. After 90 min of erosion, the mass loss reached its peak. At this time, the mass loss rate was almost constant and reached the stable stage of cavitation erosion.

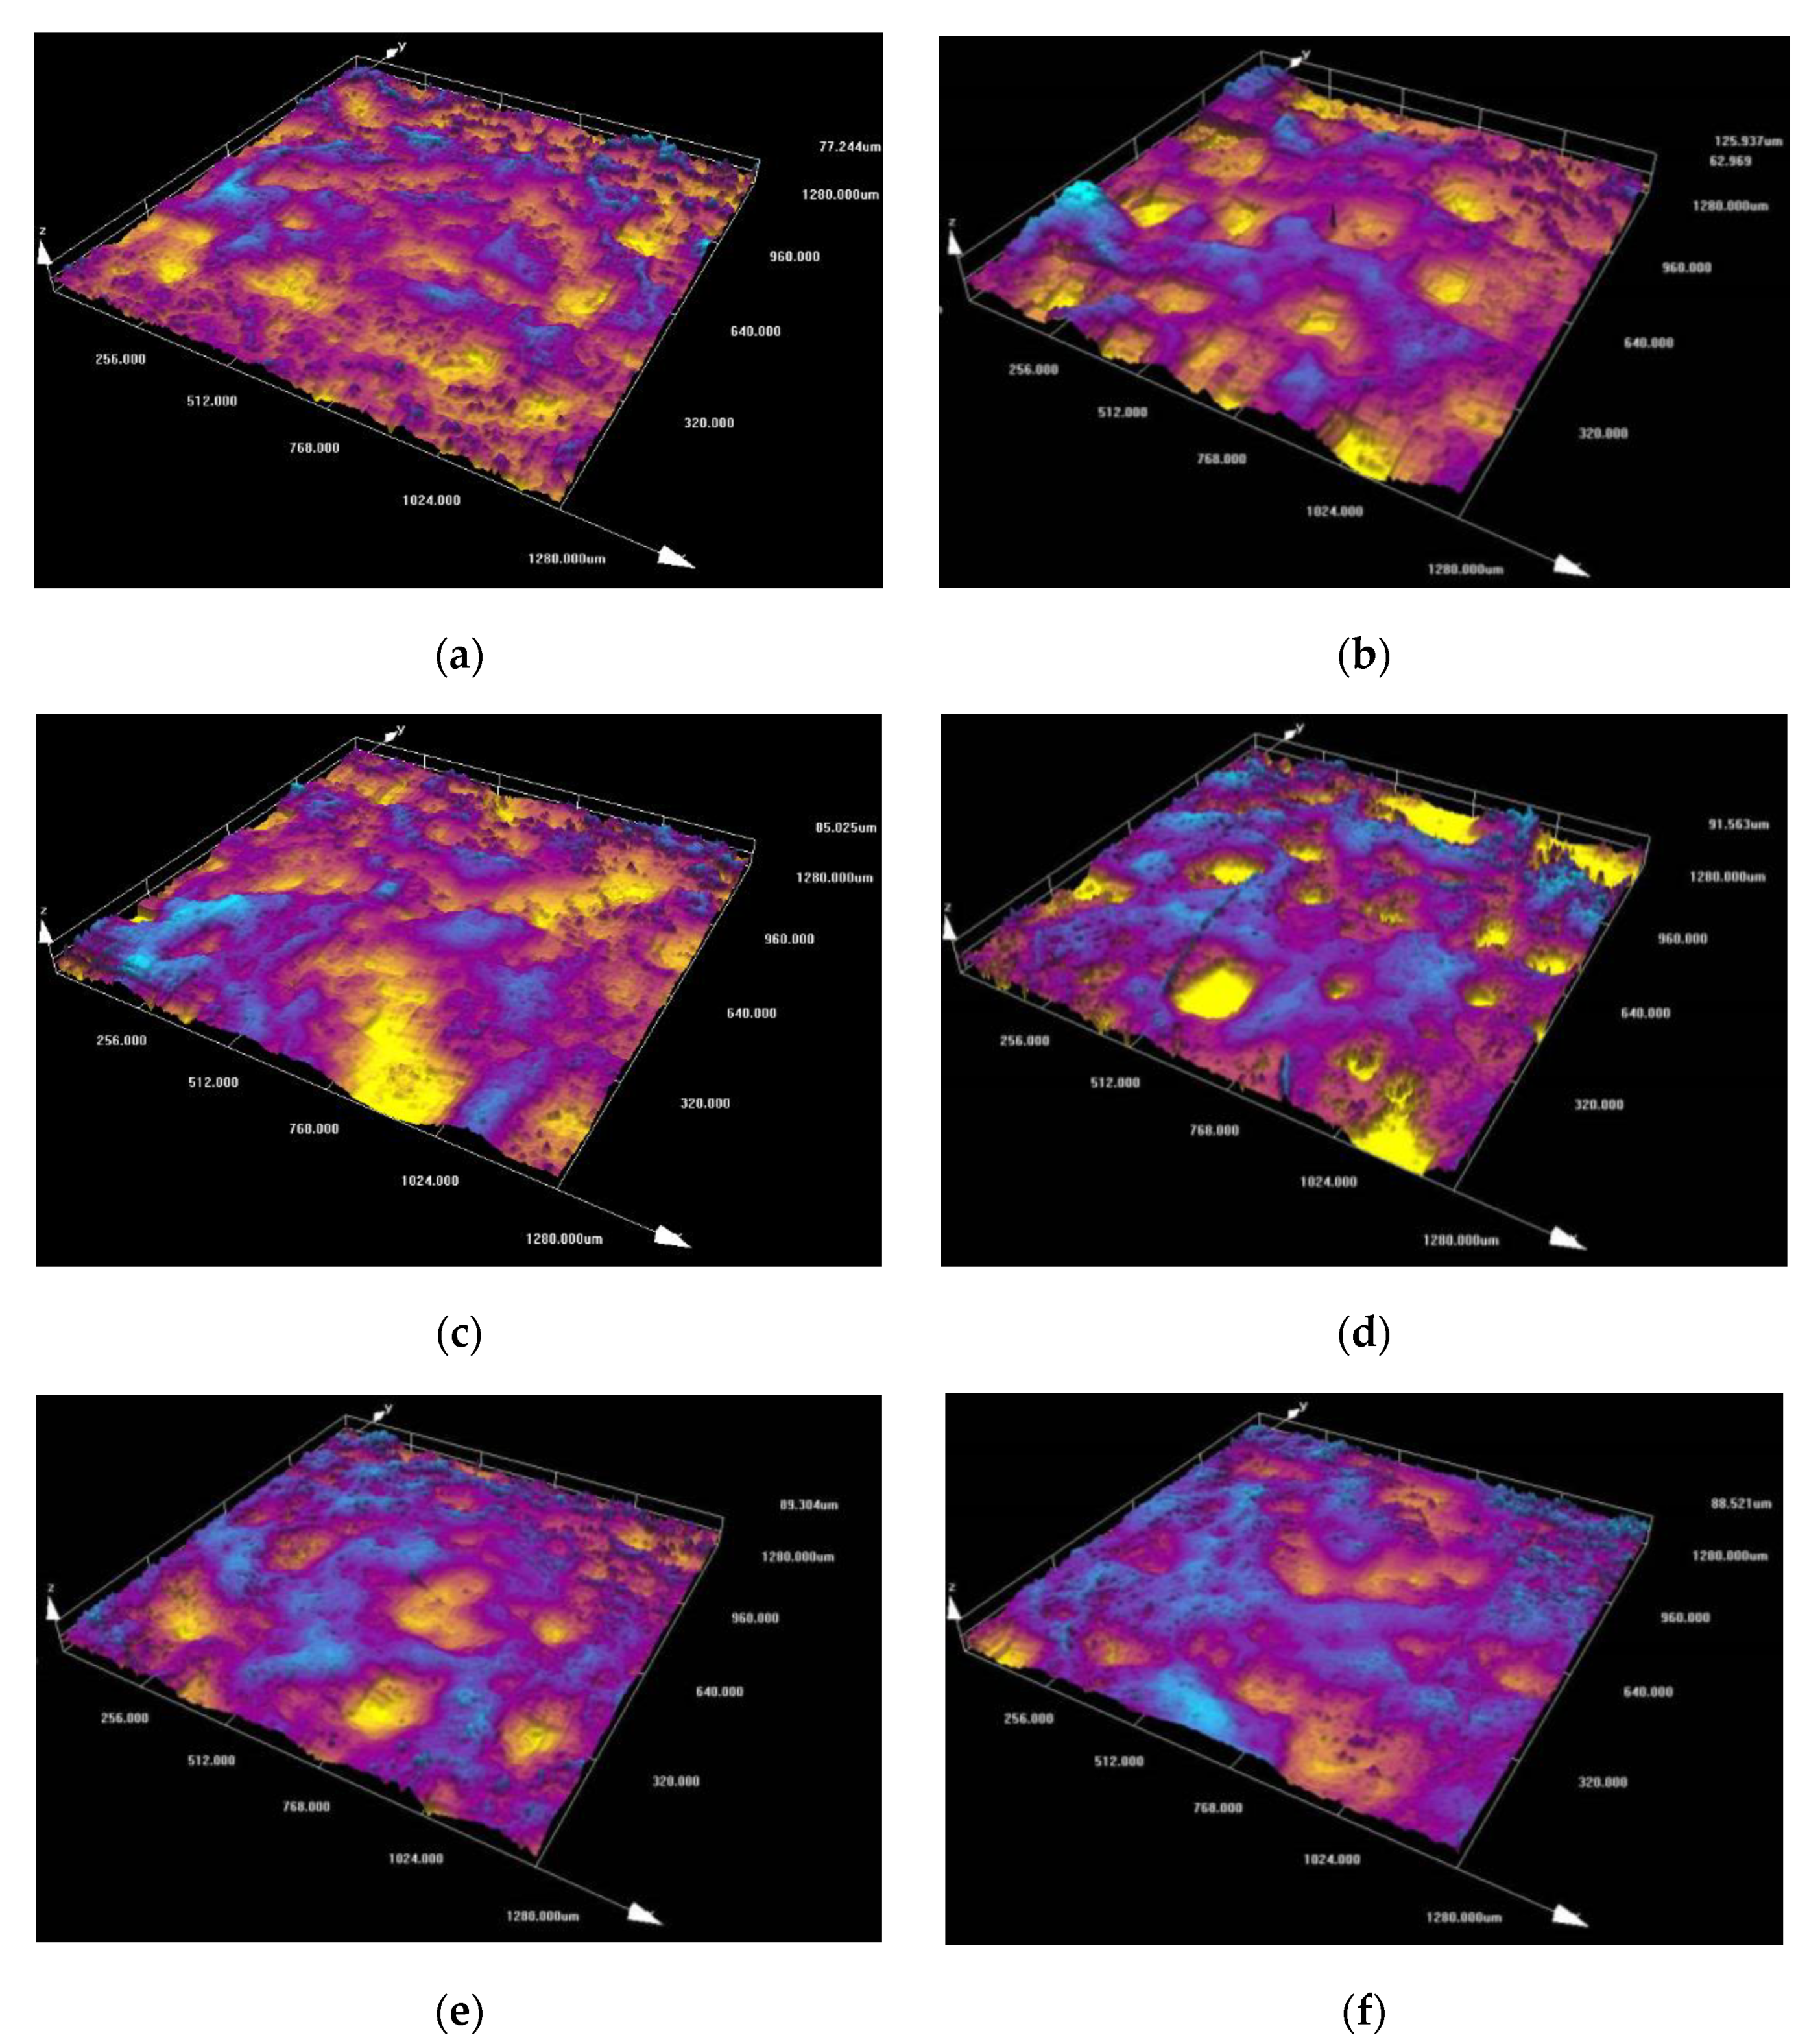
3.3. Microscopic Evaluation of Cavitation Characteristics

In order to investigate the cavitation erosion caused by the submerged cavitation jet on the sample surface, microscopic evaluation of the cavitation characteristics was carried out. A laser scanning confocal microscope was used to reconstruct the three-dimensional surface morphology of the samples. According to the analysis of Figure 7a,b, the surface morphology changes of the samples were mainly caused by the high-pressure impinging jet. In this case, the cavitation effect of the submerged cavitation jet was very weak when the target distances were 15 mm and 20 mm. Therefore, we focused on investigating the microscopic surface morphology of the samples when the target distances were in the range of 25–50 mm. The test areas are the blue box in Figure 7c,h. The size of each test area was 1280 μm × 1280 μm. Figure 11 shows the three-dimensional surface morphology of the sample under different target distances. When the target distance was 25 mm, the surface of the sample was relatively smooth despite some pitting, indicating that the degree of cavitation erosion was relatively slight. When the target distance increased to 30 mm, the center of the sample surface depressions and large cavitation pits appeared. In addition, cavitation erosion became severe due to a highly overlapping area of cavitation collapse.
The Skewness, Ssk, and root-mean-square (RMS) roughness, Sq, of the sample surface are important evaluation criteria for quantitative analysis of cavitation erosion characteristics on the surface of the samples. The definitions of Ssk and Sq are as follows:
S s k = 1 A S q 3 A Z 3 x , y d x d y
S q = 1 A A Z 2 x , y d x d y
where Z (x, y) represents the absolute height along the surface contour, and A represents the area of the sampling surface.
Figure 12 shows the variation in the RMS roughness of the sample surface under different target distances. As can be seen from the figure, the RMS roughness of all sample surfaces after impact had increased compared with that of the original surface. With the increase in target distance, the RMS surface roughness of the sample surface increased first and then decreased. When the target distance was 30 mm, the value of the RMS roughness was the largest. However, the value of the RMS roughness was the smallest when the target distance was 50 mm. This is consistent with the surface morphological characteristics of the samples described in Figure 11.
The Skewness, Ssk, is a measure of the deviation of the sample surface from the average surface height value, which is affected by convex peaks or concave valleys on the surface of the sample. When the value was less than zero, the surface morphology of the sample was a concave valley. On the contrary, the surface morphology of the sample was a convex peak when the value was greater than zero. Figure 13 shows the variation in skewness with target distance. As can be seen from the figure, the Ssk of the original sample was 0.11, which indicates that the surface height of the sample was evenly distributed and that the polishing treatment effect was satisfactory. The surfaces of the samples were subjected to different degrees of cavitation erosion under different target distances. With the increase in target distance, the absolute value of the Ssk of the sample increased first and then decreased. When the target distance was 30 mm, the absolute value of the surface deflection of the sample was the largest. At this time, large cavitation pits appeared on the surface of the sample. The above results can further explain that the sample mass loss caused by the cavitation erosion was the largest when the target distance was 30 mm.

4. Conclusions

In order to investigate the cavitation characteristics of the two-throat nozzle submerged jet, high-speed photographic visualization experiments and erosion experiments were conducted. The FDM was used to analyze the cavitation cloud in a single period under different inlet pressures. Moreover, macroscopic and microscopic evaluation of cavitation characteristics of the two-throat nozzle submerged cavitation jet were carried out under different target distances and impact times. According to the results of this study, there are the following key points:
(1)
The two-throat nozzle submerged jet cavitation cloud has obvious periodicity. With the increase in inlet pressure, the length, width, and area of the cavitation cloud increased, and the period of the cavitation cloud was slightly prolonged.
(2)
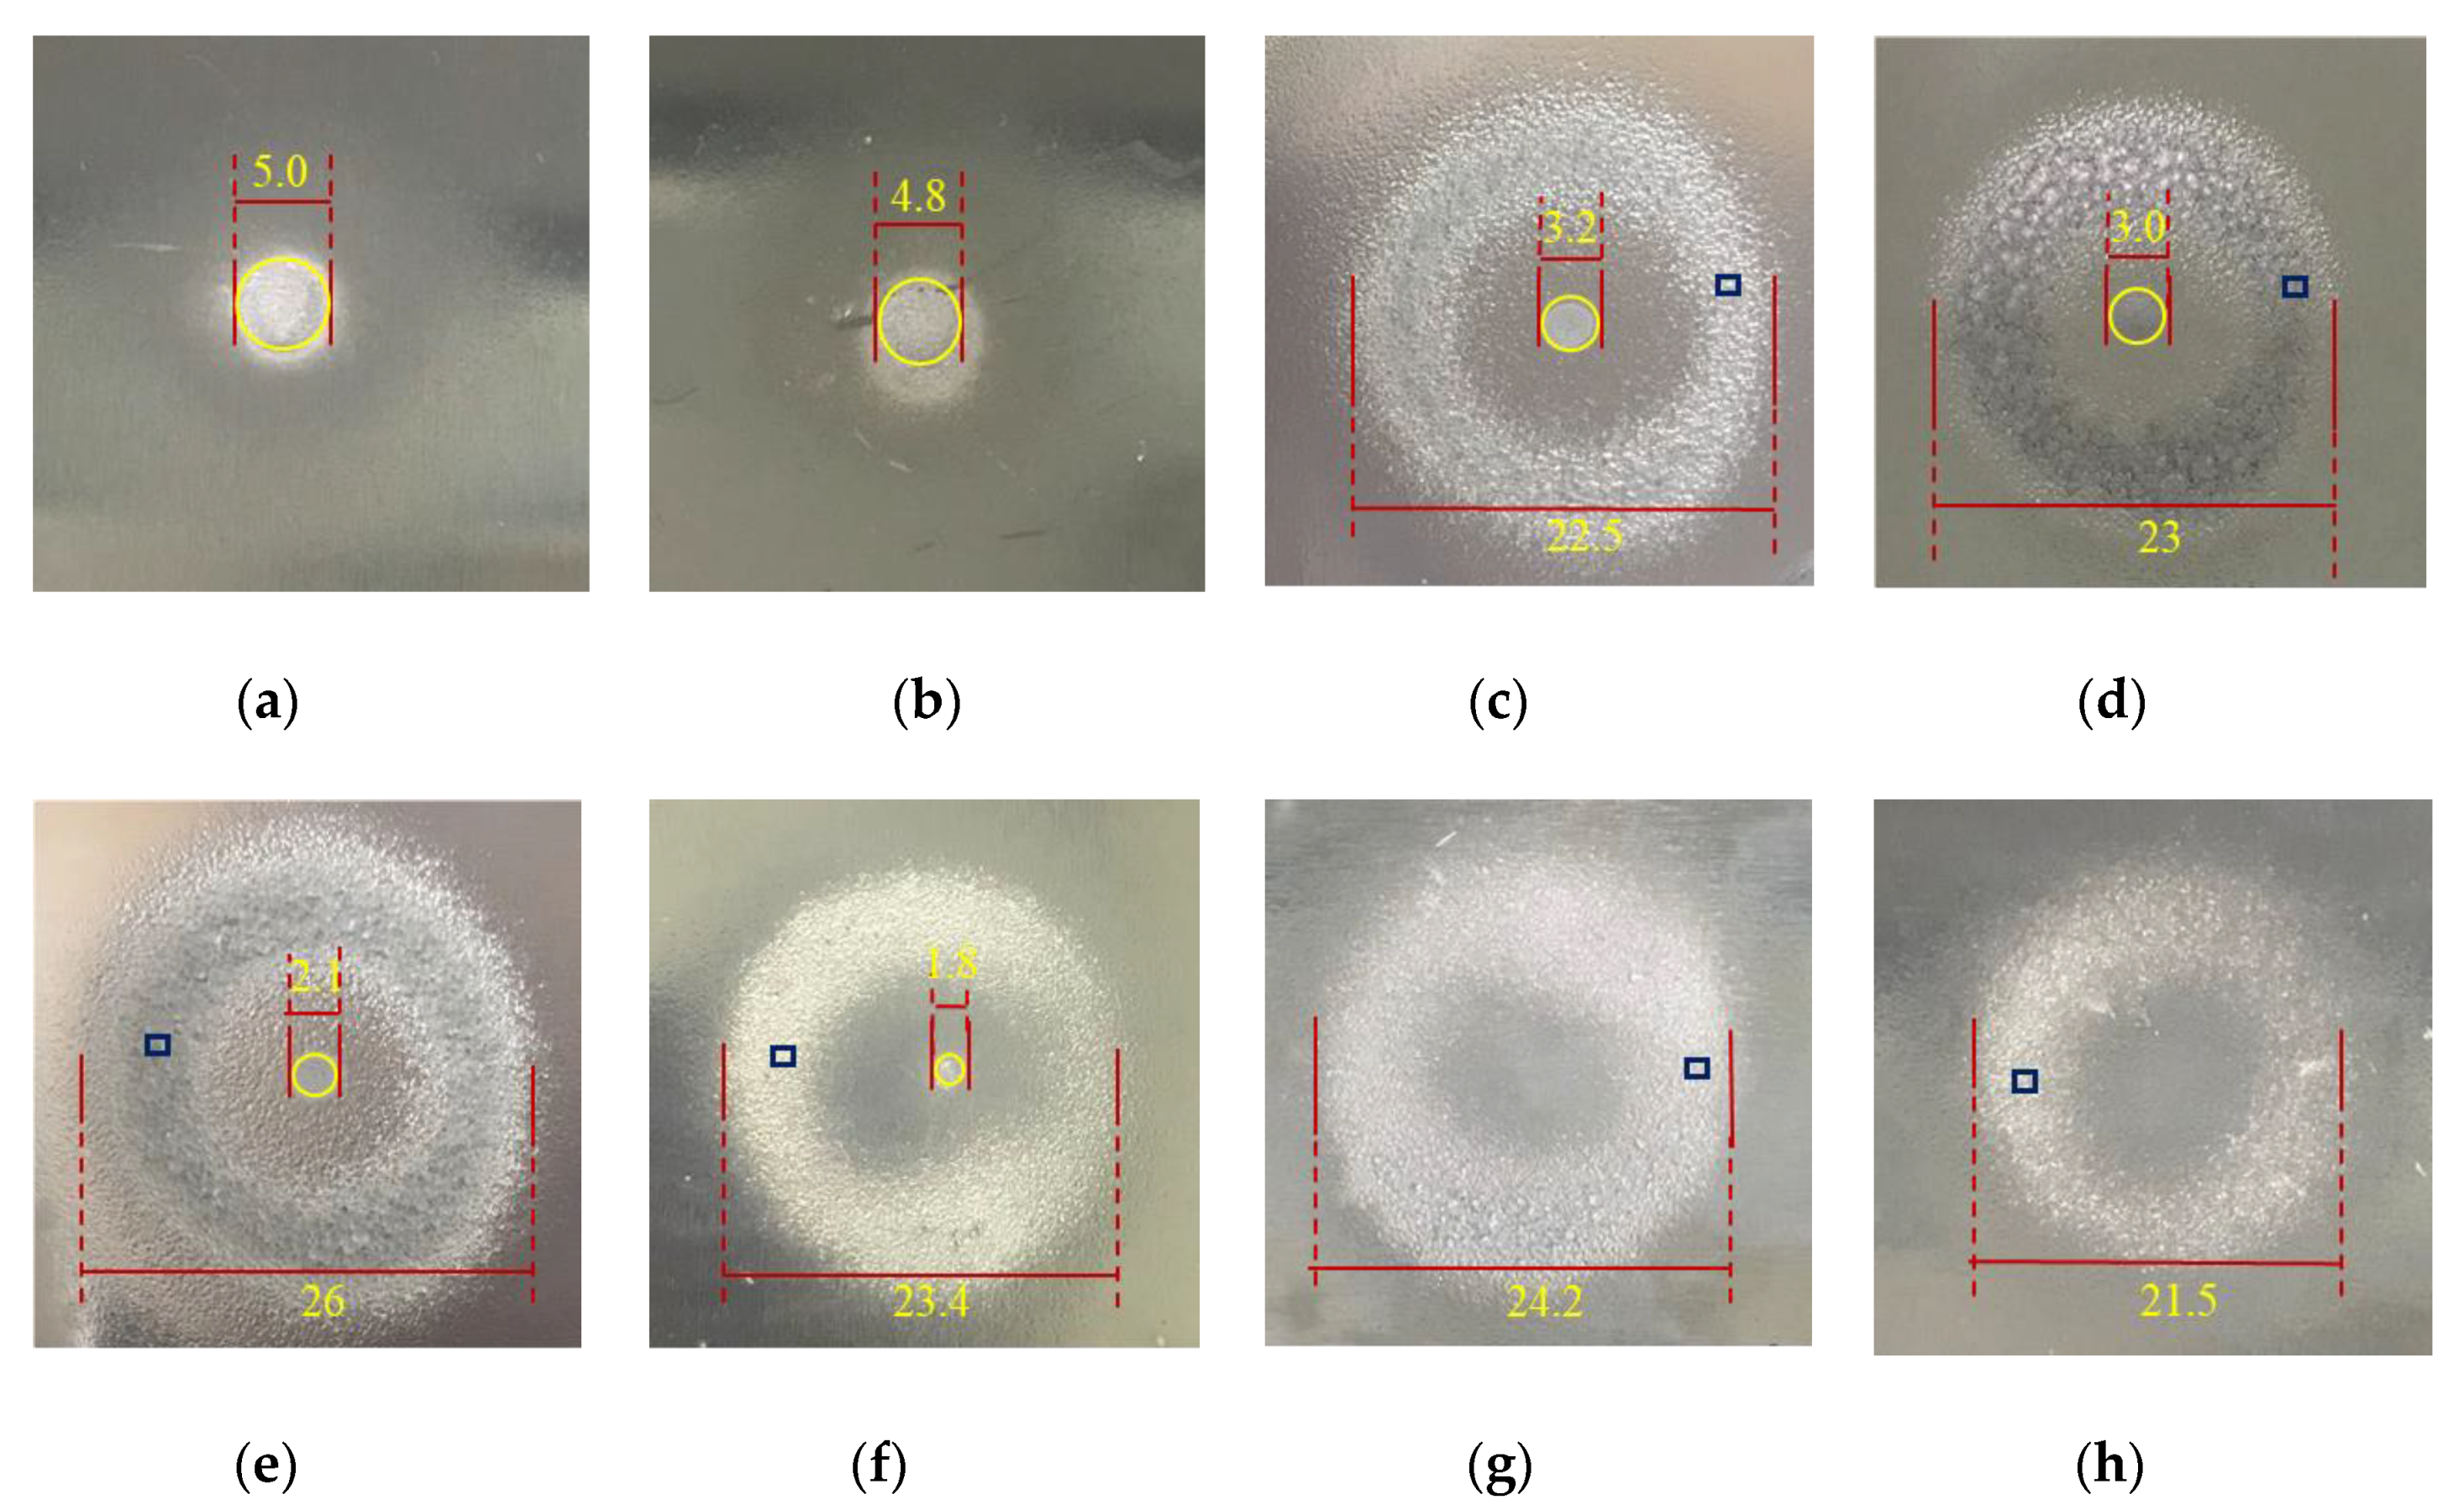
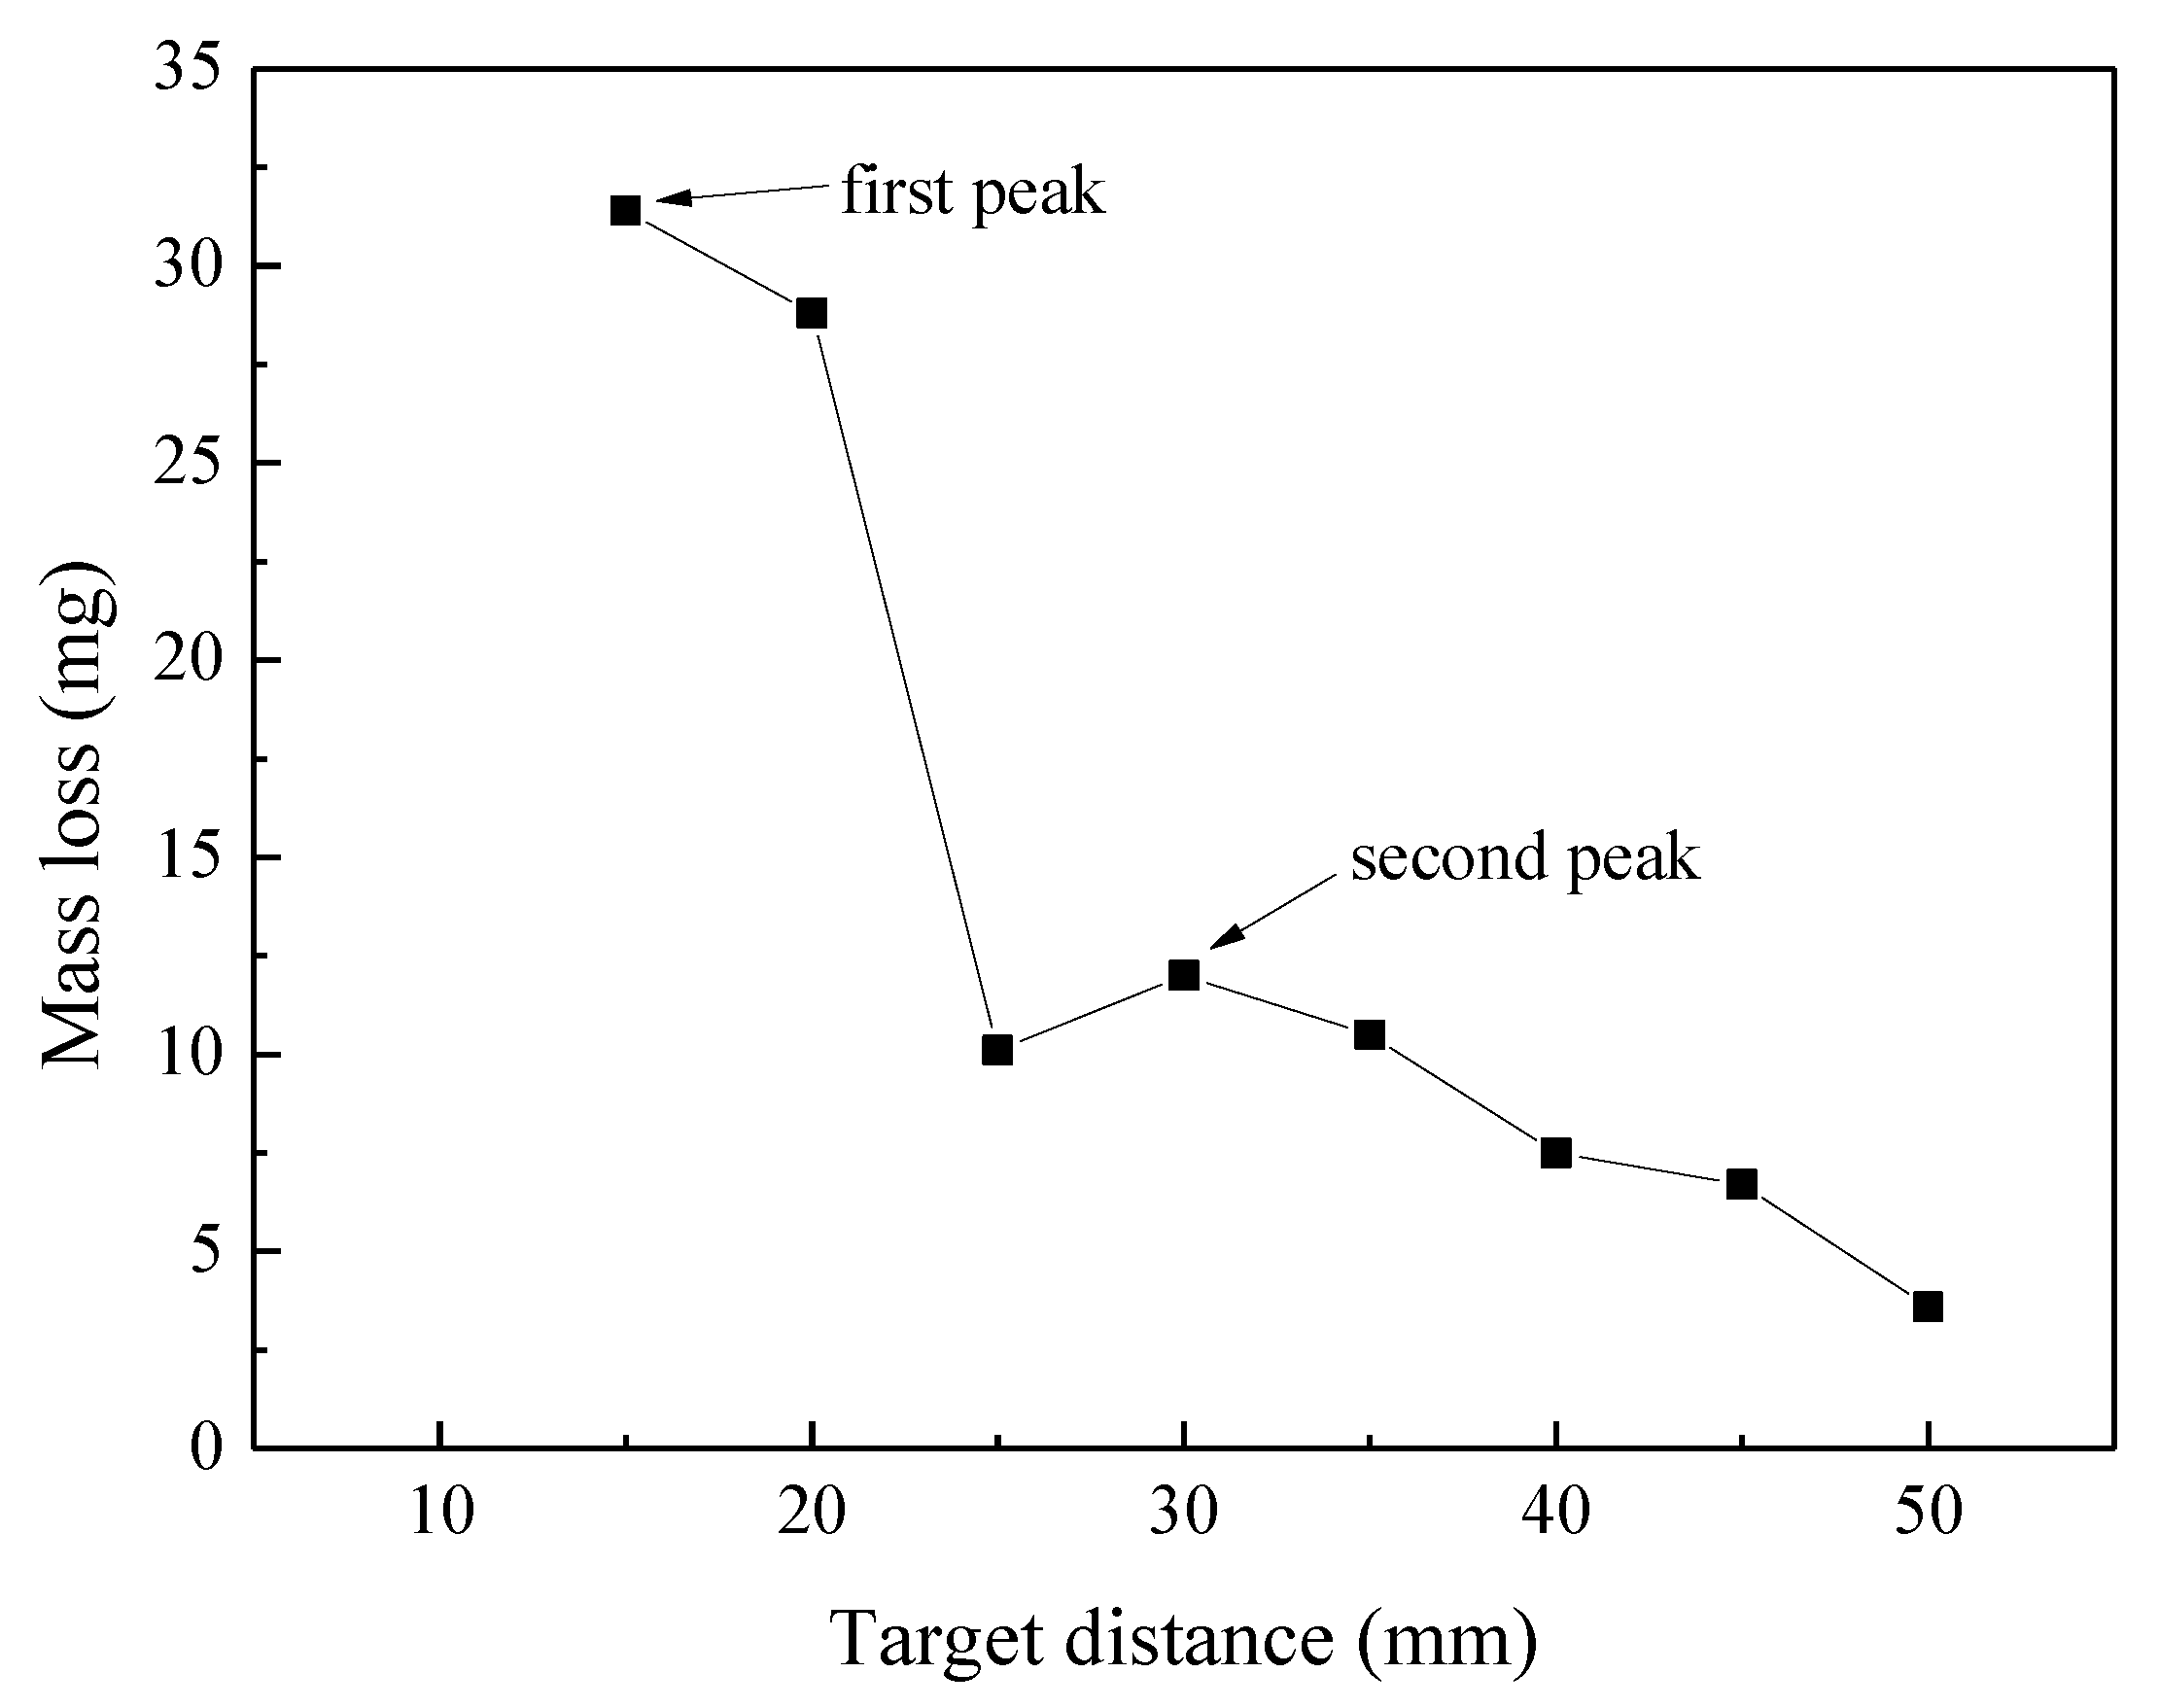
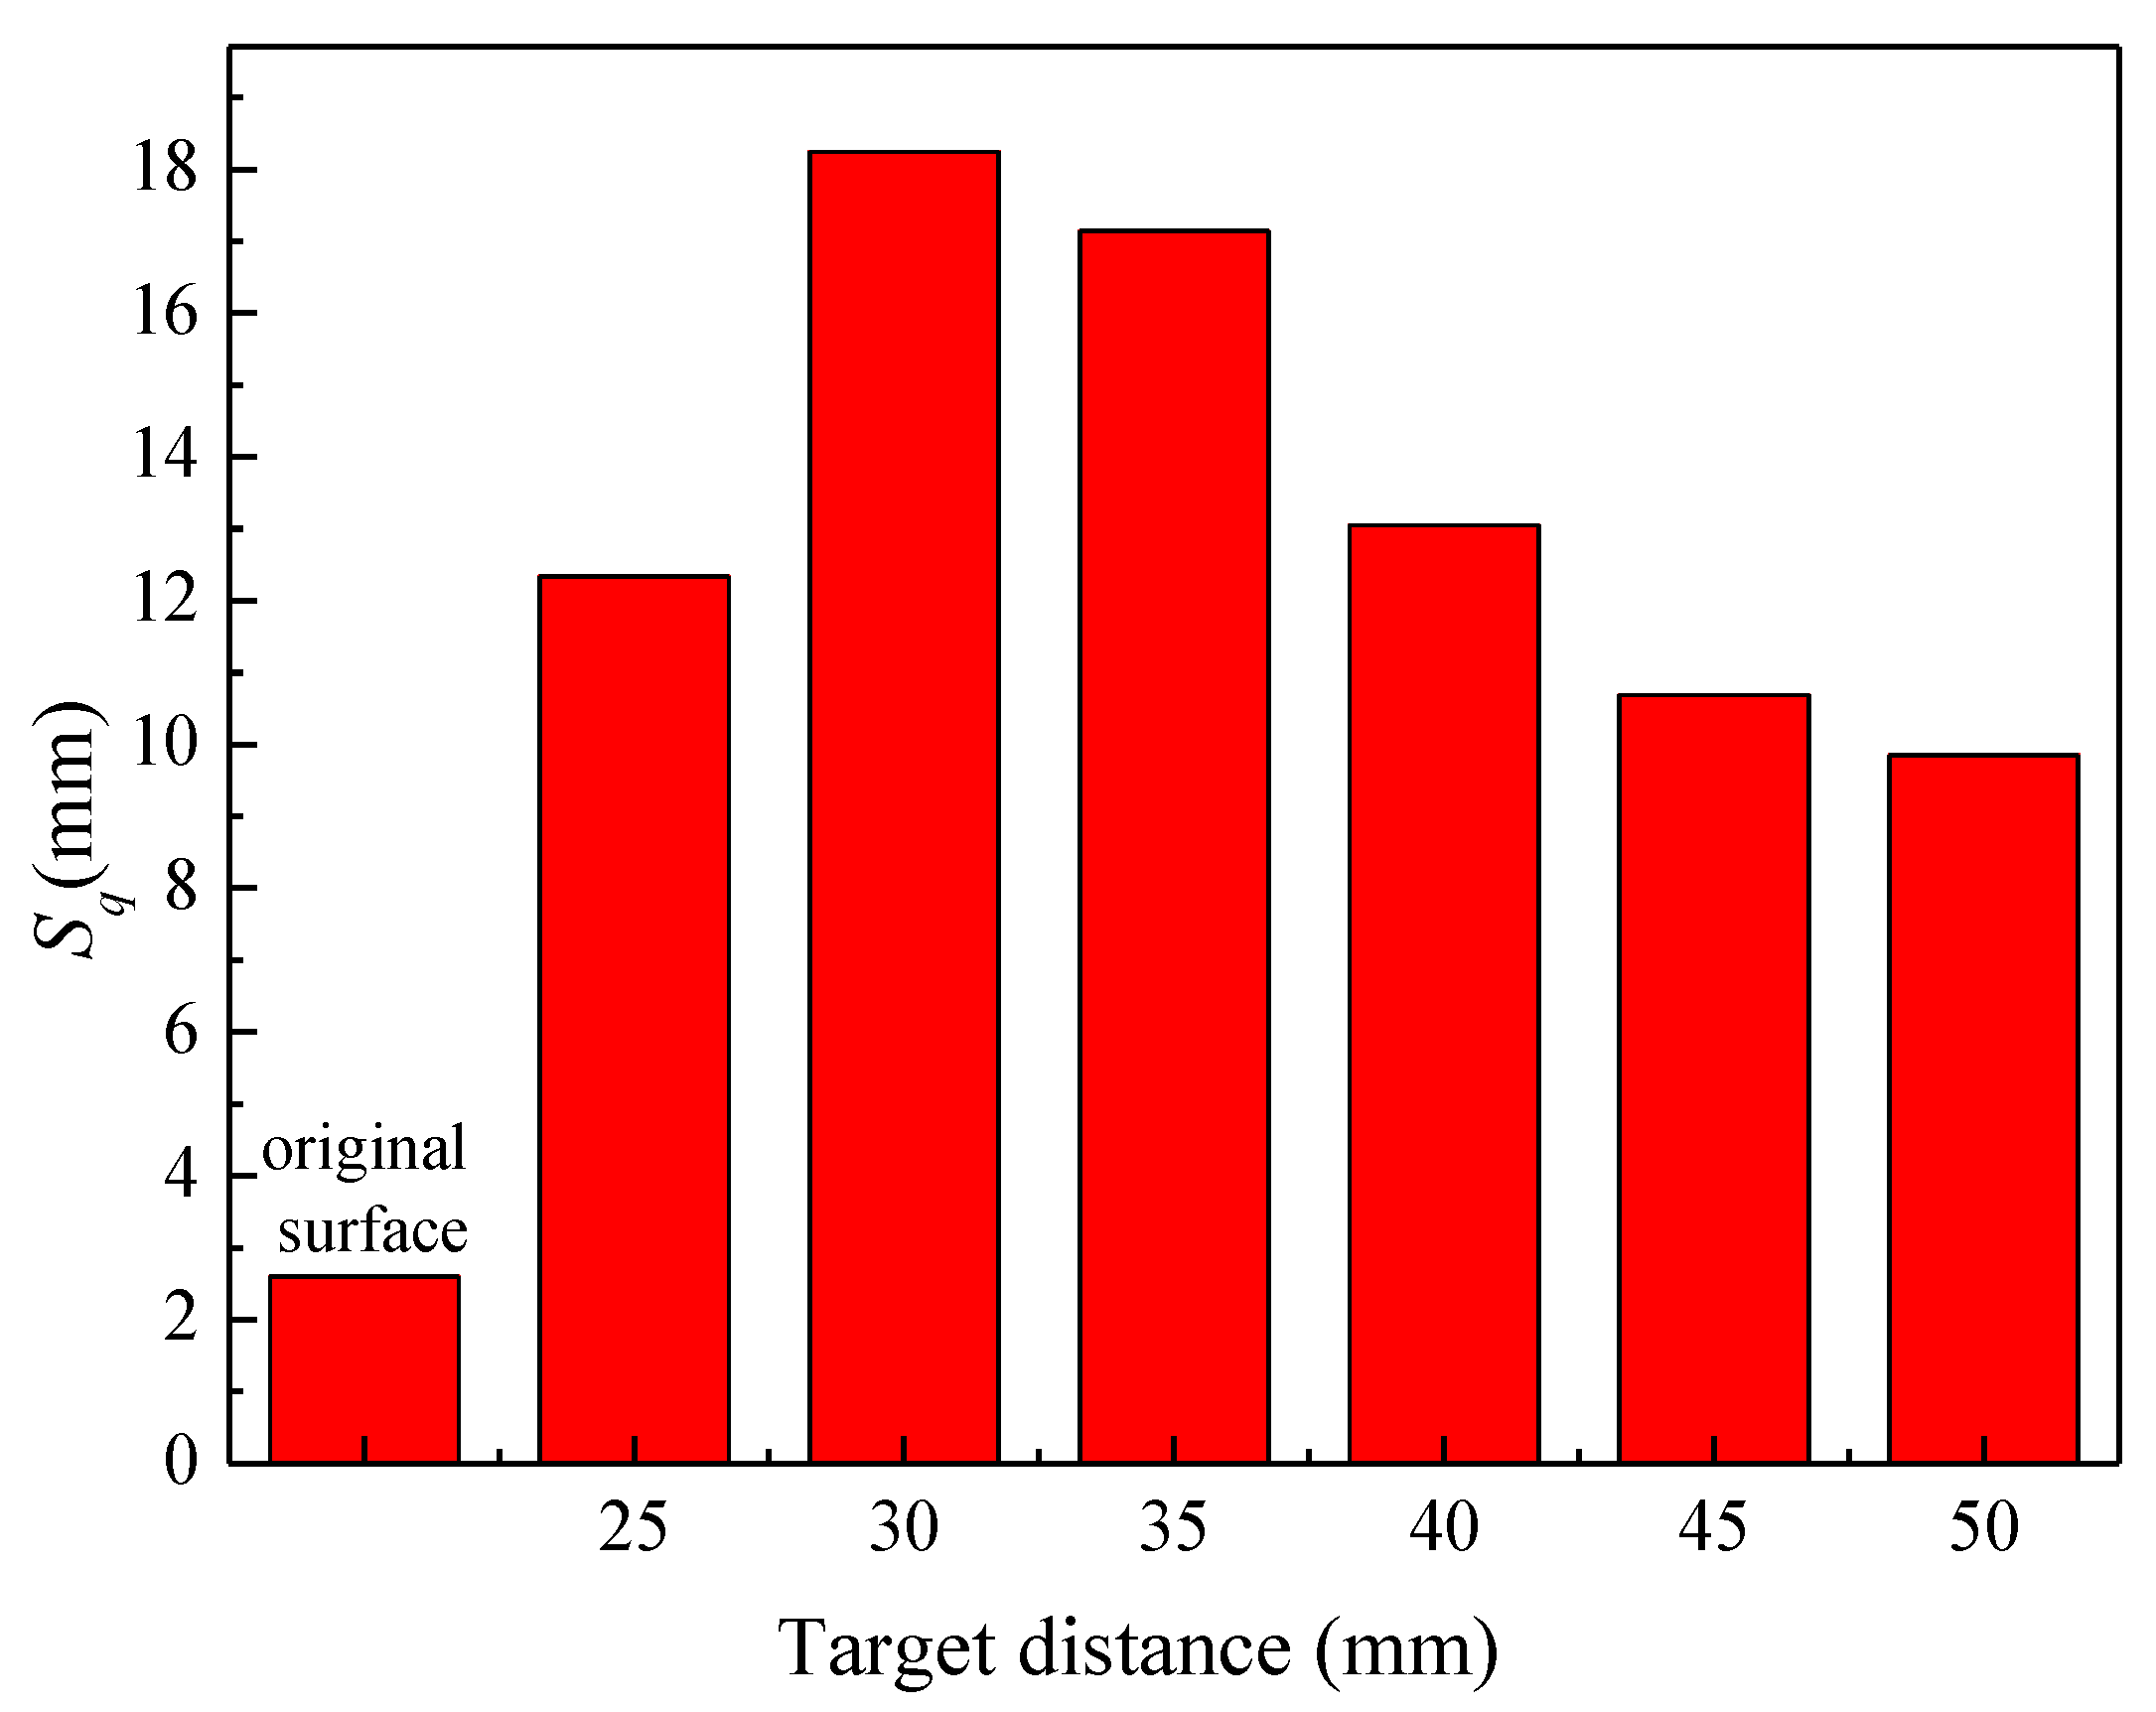
With the increase in target distance, the cavitation intensity was enhanced and then weakened, and the effect of the high-speed water jet continued to decrease. In addition, the cavitation cloud fully developed and collapsed near the sample surface to achieve the maximum cavitation effect when the target distance was 30 mm.
(3)
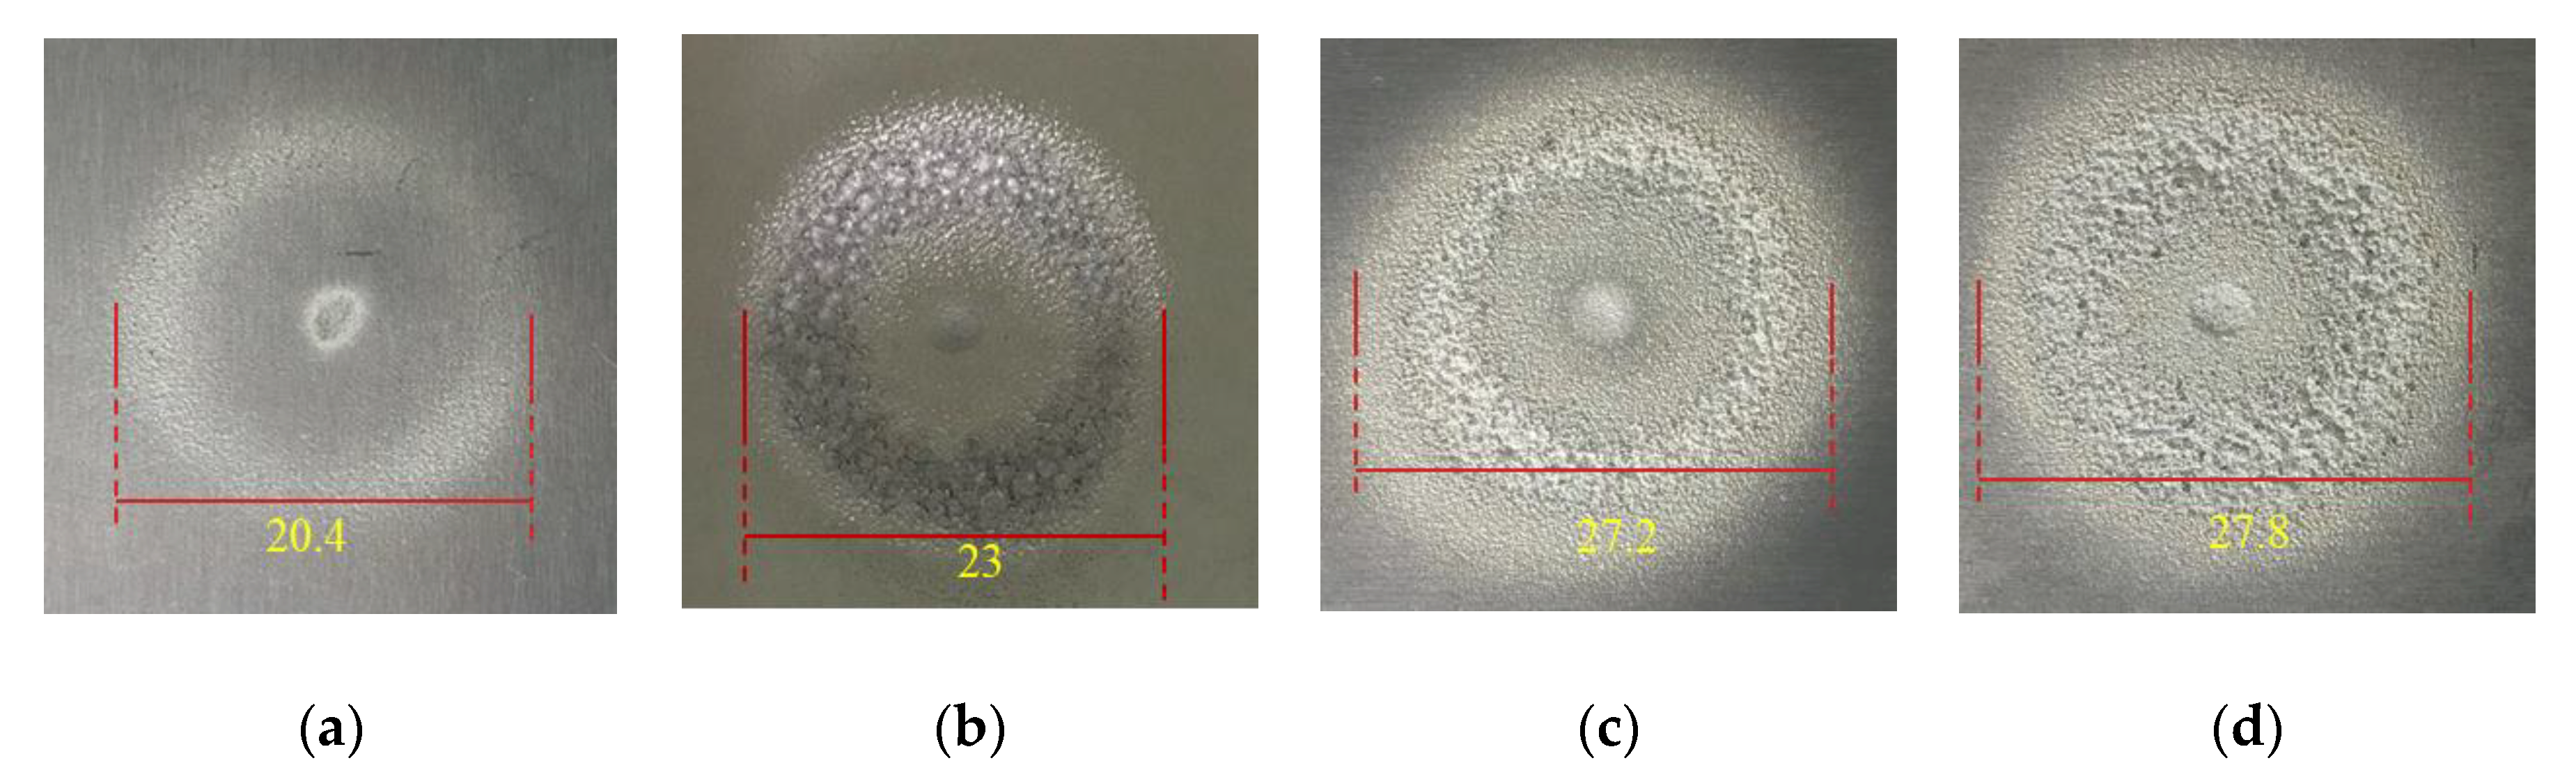
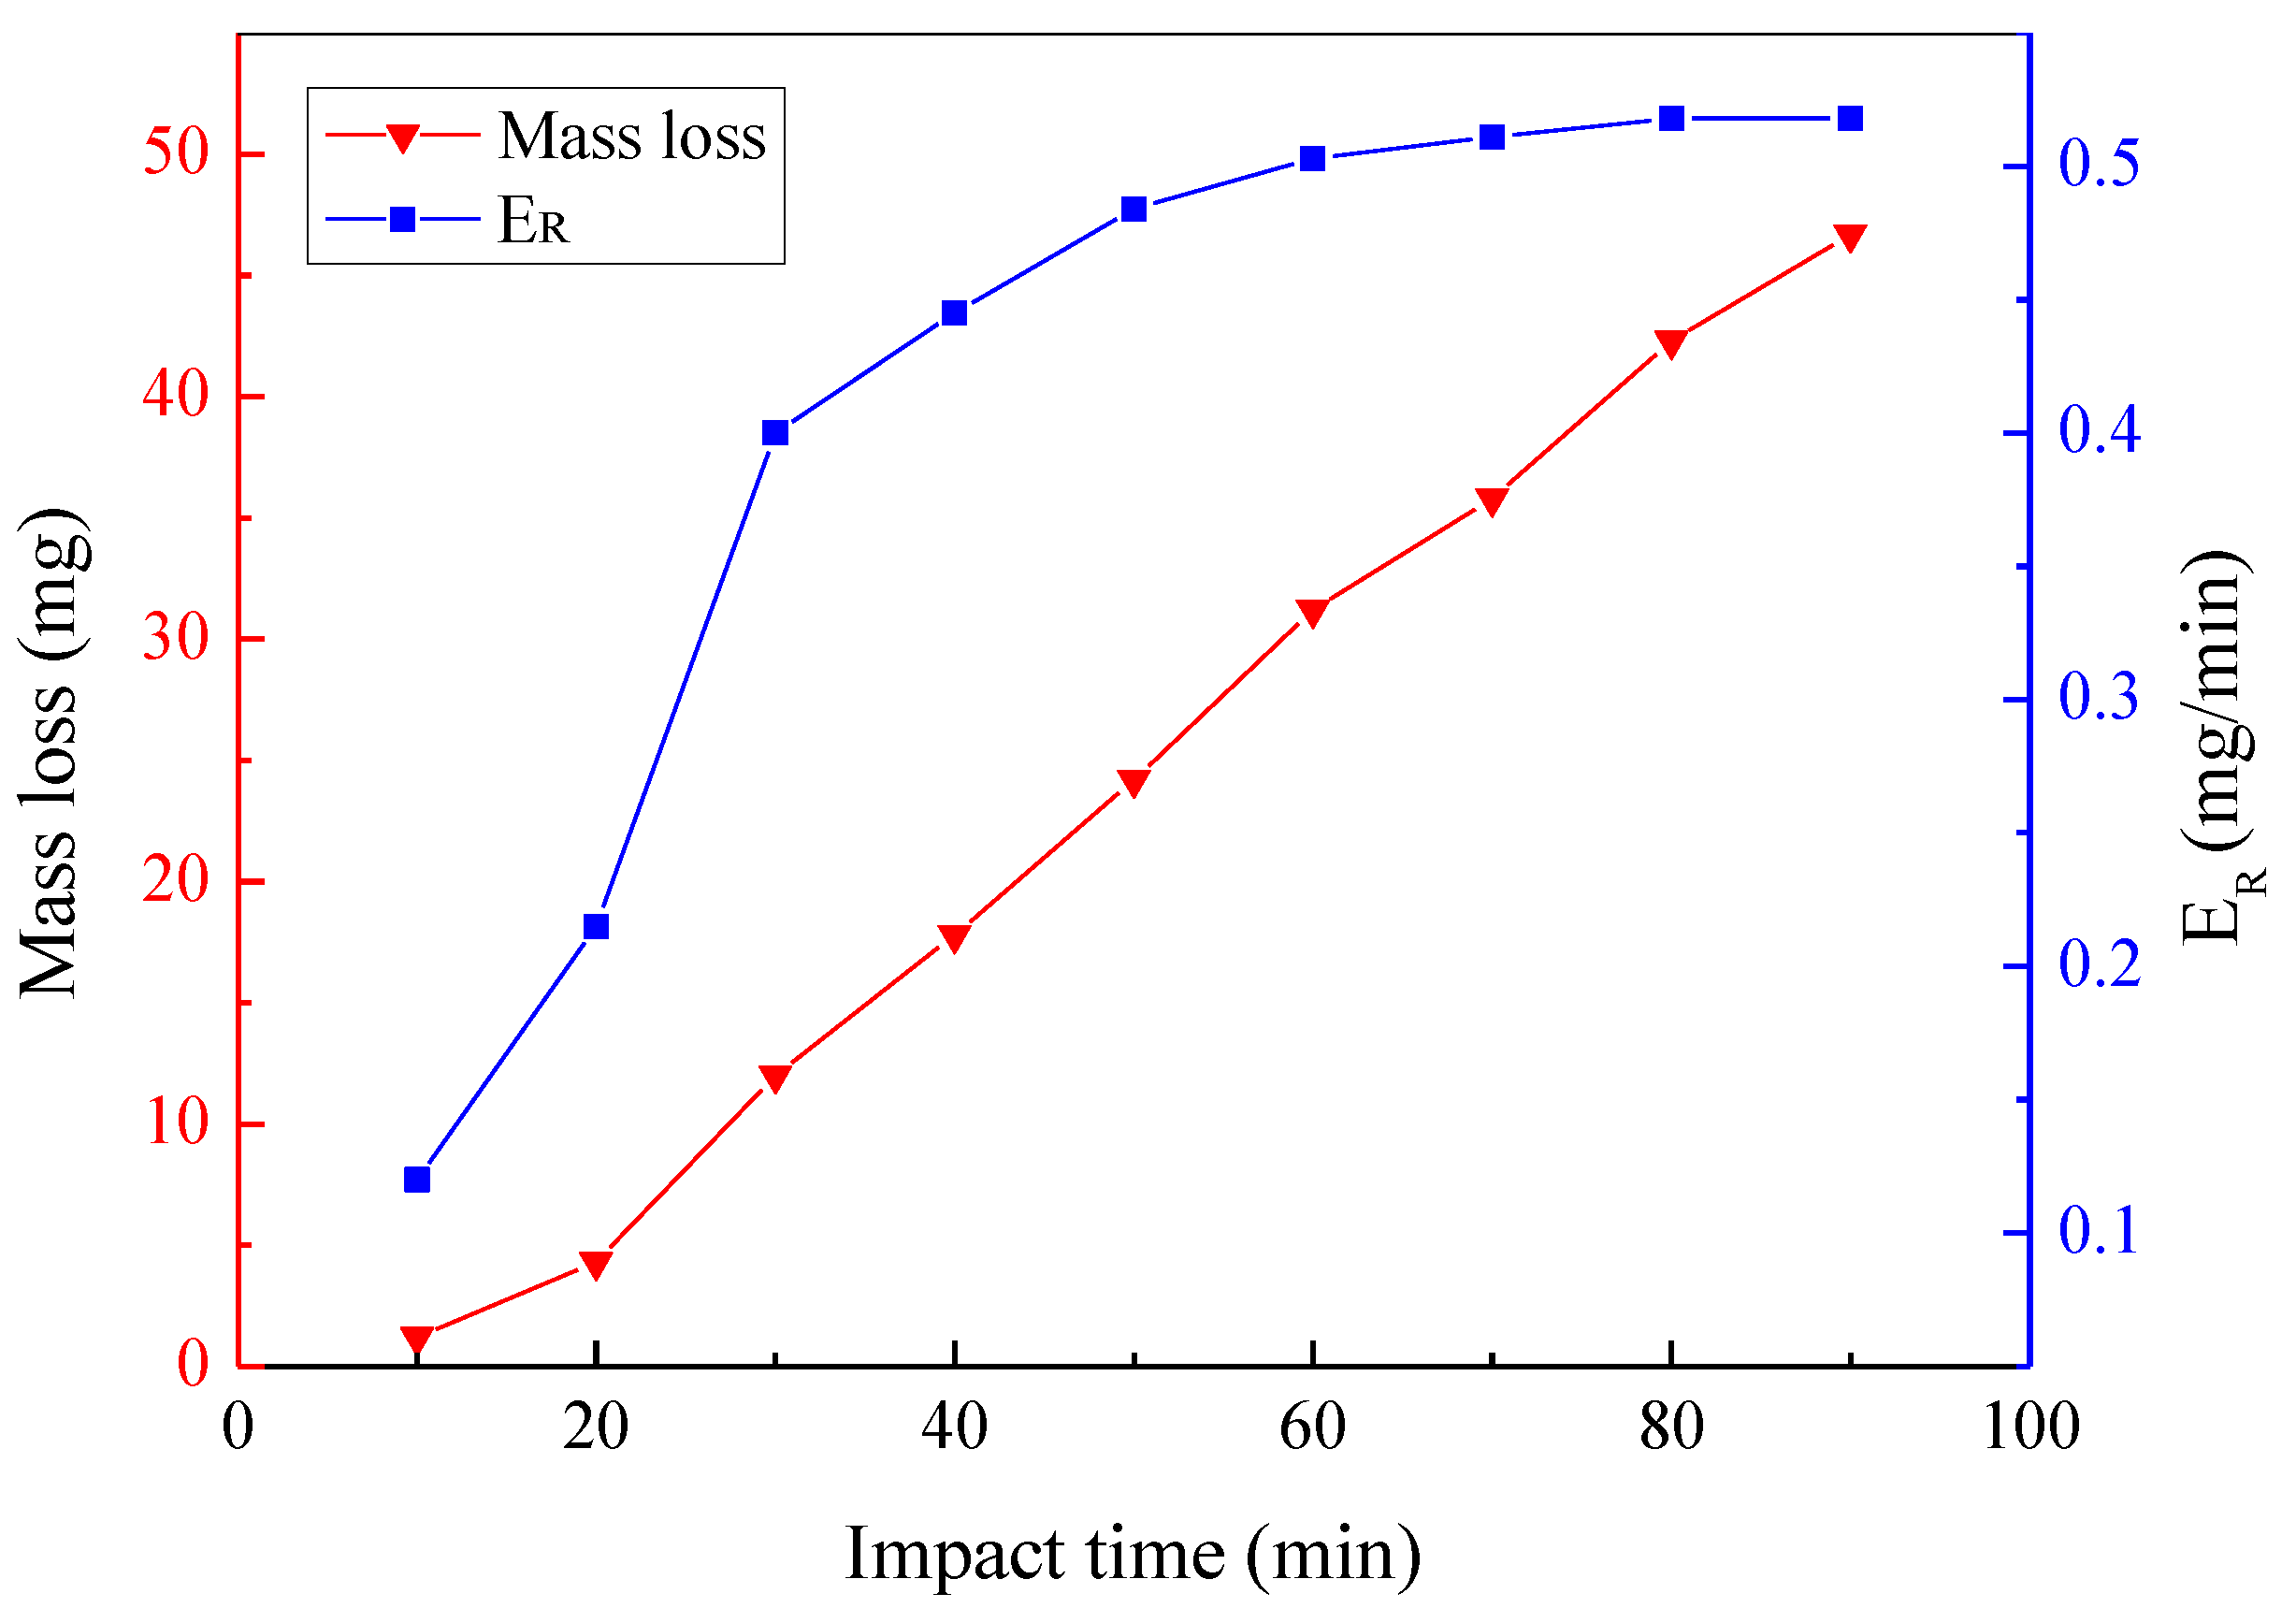
As the impact time increased, the mass loss of the sample gradually increased. The mass loss rate first increased, then decreased, and finally stabilized.
(4)
From a microscopic point of view, the large cavitation pits were highly overlapping regions of cavitation collapse. The magnitude of the absolute values of the RMS surface roughness and surface skewness increased with the increase in cavitation intensity.

Author Contributions

Conceptualization, writing, review and editing, project administration, funding acquisition, J.D.; investigation, validation, formal analysis, S.L. and R.M.; methodology, X.Z.; data analysis, S.L.; project administration, funding acquisition, X.P. All authors have read and agreed to the published version of the manuscript.

Funding

This research was funded by National Natural Science Foundation of China, grant number 51979022, and Fundamental Research Funds for the Central Universities, grant number 3132019330.

Conflicts of Interest

The authors declare no conflict of interest.

References

  1. Hua, J.; Chiu, Y.S.; Tsai, C.Y. En-route operated hydroblasting system for counteracting biofouling on ship hull. Ocean Eng. 2018, 152, 249–256. [Google Scholar] [CrossRef]
  2. Bax, N.; Williamson, A.; Aguero, M.; Gonzalez, E.; Geeves, W. Marine invasive alien species: A threat to global biodiversity. Mar. Policy 2003, 27, 313–323. [Google Scholar] [CrossRef]
  3. Godwin, L.S. Hull Fouling of Maritime Vessels as a Pathway for Marine Species Invasions to the Hawaiian Islands. Biofouling 2003, 19, 123–131. [Google Scholar] [CrossRef]
  4. Choi, J.K.; Chahine, G.L. Relationship between material pitting and cavitation field impulsive pressures. Wear 2016, 352, 42–53. [Google Scholar] [CrossRef] [Green Version]
  5. Liu, C.; Liu, G.; Yan, Z. Study on cleaning effect of different water flows on the pulsed cavitating jet nozzle. Shock Vib. 2019, 2019, 1–15. [Google Scholar] [CrossRef]
  6. Yamauchi, Y.; Soyama, H.; Adachi, Y.; Sato, K.; Shindo, T.; Oba, R. Suitable region of high-speed submerged water jets for cutting and peening. JSME Int. J. 1995, 38, 31–38. [Google Scholar] [CrossRef] [Green Version]
  7. Soyama, H. Comparison between the improvements made to the fatigue strength of stainless steel by cavitation peening, water jet peening, shot peening and laser peening. J. Mater. Process. Technol. 2018, 269, 65–78. [Google Scholar] [CrossRef]
  8. Peng, K.; Tian, S.; Li, G.; Huang, Z.; Zhang, Z. Cavitation in water jet under high ambient pressure conditions. Exp. Therm. Fluid Sci. 2017, 89, 9–18. [Google Scholar] [CrossRef]
  9. Liu, W.; Kang, Y.; Zhang, M.; Wang, X.; Li, D.; Xie, L. Experimental and theoretical analysis on chamber pressure of a self-resonating cavitation waterjet. Ocean Eng. 2018, 151, 33–45. [Google Scholar] [CrossRef]
  10. Pan, Y.; Ma, F.; Liu, B.; Cai, T. Cavitation intensity and erosion pattern of a self-excited cavitating jet. J. Mater. Process. Technol. 2020, 282, 116668. [Google Scholar] [CrossRef]
  11. Zhou, M.; Liu, H.; Wei, K. Resistance of curved surfaces to the cavitation erosion produced through high-pressure submerged waterjet. Wear 2019, 440, 203091. [Google Scholar] [CrossRef]
  12. Liu, H.; Kang, C.; Soyama, H. Experimental study of the influence of test chamber dimensions on aggressive intensity of the cavitating jet. J. Test. Eval. 2019, 48, 3588–3601. [Google Scholar] [CrossRef]
  13. Hutli, E.; Nedeljkovic, M.S.; Bonyar, A.; Legrady, D. Experimental study on the influence of geometrical parameters on the cavitation erosion characteristics of high speed submerged jets. Exp. Therm. Fluid Sci. 2017, 80, 281–292. [Google Scholar] [CrossRef] [Green Version]
  14. Soyama, H. High-Speed Observation of a Cavitating Jet in Air. J. Fluids Eng. 2005, 127, 1095–1101. [Google Scholar] [CrossRef]
  15. Hutli, E.; Nedeljkovic, M.S. Frequency in shedding/discharging cavitation clouds determined by visualization of a submerged cavitating jet. J. Fluids Eng. 2008, 130, 021304. [Google Scholar] [CrossRef]
  16. Petkovsek, M.; Dular, M. Simultaneous observation of cavitation structures and cavitation erosion. Wear 2013, 300, 55–64. [Google Scholar] [CrossRef]
  17. Peng, C.; Tian, S.; Li, G. Joint experiments of cavitation jet: High-speed visualization and erosion test. Ocean Eng. 2018, 149, 1–13. [Google Scholar] [CrossRef]
  18. Watanabe, R.; Yanagisawa, K.; Yamagata, T.; Fujisawa, N. Simultaneous shadowgraph imaging and acceleration pulse measurement of cavitating jet. Wear 2016, 358–359, 72–79. [Google Scholar] [CrossRef]
  19. Fujisawa, N.; Fujita, Y.; Yanagisawa, K.; Fujisawa, K. Simultaneous observation of cavitation collapse and shock wave formation in cavitating jet. Exp. Therm. Fluid Sci. 2018, 94, 159–167. [Google Scholar] [CrossRef]
  20. Fujisawa, N.; Kikuchi, K.; Fujisawa, K.; Yamagata, T. Time-resolved observations of pit formation and cloud behavior in cavitating jet. Wear 2017, 386-387, 99–105. [Google Scholar] [CrossRef]
  21. Cai, T.; Pan, Y.; Ma, F. Effects of nozzle lip geometry on the cavitation erosion characteristics of self-excited cavitating waterjet. Exp. Therm. Fluid Sci. 2020, 117, 110137. [Google Scholar] [CrossRef]
  22. Soyama, H. Effect of nozzle geometry on a standard cavitation erosion test using a cavitating jet. Wear 2013, 297, 895–902. [Google Scholar] [CrossRef]
  23. Li, D.; Wang, Z.; Yuan, M.; Fan, Q.; Wang, X. Effects of nozzle exit angle on the pressure characteristics of SRWJs used for deep-hole drilling. Appl. Sci. 2019, 9, 155. [Google Scholar] [CrossRef] [Green Version]
  24. Cai, T.; Pan, Y.; Ma, F.; Xu, P. Effects of organ-pipe chamber geometry on the frequency and erosion characteristics of the self-excited cavitating waterjet. Energies 2020, 13, 978. [Google Scholar] [CrossRef] [Green Version]
  25. Wang, Z.; Hu, Y.; Chen, S.; Zhou, L.; Xu, W.; Lien, F. Investigation of self excited oscillation chamber cavitation effect with special emphasis on wall shape. Trans. Can. Soc. Mech. Eng. 2019, 44, 244–255. [Google Scholar] [CrossRef]
  26. Fang, Z.; Kang, Y.; Yang, X.; Yuan, B.; Li, D. The influence of collapse wall on self-excited oscillation pulsed jet nozzle performance. IOP Conf. Ser. Earth Environ. Sci. 2013, 15, 052022. [Google Scholar] [CrossRef]
  27. Li, D.; Kang, Y.; Ding, X.; Liu, W. Experimental study on the effects of feeding pipe diameter on the cavitation erosion performance of self-resonating cavitating waterjet. Exp. Therm. Fluid Sci. 2017, 82, 314–325. [Google Scholar] [CrossRef]
  28. Yuan, M.; Li, D.; Kang, Y.; Shi, H. The characteristics of self-resonating jet issuing from the helmholtz nozzle combined with a venturi tube structure. Appl. Fluid Mech. 2020, 13, 779–791. [Google Scholar] [CrossRef]
  29. Chi, B. World’s first eject cycle for denso’s transport refrigerator. Refrig. Technol. 2008, 28, 19–26. [Google Scholar]
  30. Huang, K.; Guo, X.; Zhang, P. Influence of Structural Parameters of Two-throat Nozzle Ejector on Performance of Two-phase Flow Ejector Refrigeration System. Energy Procedia 2017, 105, 5091–5097. [Google Scholar] [CrossRef]
  31. Sato, K.; Sugimoto, Y.; Ohjimi, S. Pressure-wave formation and collapses of cavitation clouds impinging on solid wall in a submerged water jet. In Proceedings of the 7th International Symposium on Cavitation, Ann Arbor, MI, USA, 17–22 August 2009. [Google Scholar]
  32. Momma, T.; Lichtarowicz, A. A study of pressures and erosion produced by collapsing cavitation. Wear 1995, 186, 425–436. [Google Scholar] [CrossRef]
  33. Soyama, H.; Yamauchi, Y.; Adachi, Y.; Sato, K.; Shindo, T.; Oba, R. High-Speed observations of the cavitation cloud around a high-speed submerged water jet. JSME INT J B-FLUID T 2008, 22, 1919–1924. [Google Scholar]
  34. Soyama, H. Surface mechanics design of metallic materials on mechanical surface treatments. Mech. Eng. Rev. 2015, 2, 14-00192. [Google Scholar] [CrossRef] [Green Version]
Figure 1. Schematic diagram of the submerged cavitation jet experimental system.
Applsci 12 00536 g001
Figure 2. Schematic diagram of the two-throat nozzle.
Applsci 12 00536 g002
Figure 3. Frame-difference method.
Applsci 12 00536 g003
Figure 4. Dynamic change in the cavitation cloud in a single period under an inlet pressure of 20 MPa: (a) high-speed photography image of the cavitation cloud; (b) FDM diagram.
Applsci 12 00536 g004
Figure 5. Dynamic change in the cavitation cloud in a single period under an inlet pressure of 15 MPa: (a) high-speed photography image of the cavitation cloud; (b) FDM diagram.
Applsci 12 00536 g005
Figure 6. Dynamic change in the cavitation cloud in a single period under an inlet pressure of 10 MPa: (a) high-speed photography image of the cavitation cloud; (b) FDM diagram.
Applsci 12 00536 g006
Figure 7. Surface morphology change of the samples after impact by the submerged cavitation jet under different target distances (Unit in mm): (a) target distance of 15 mm; (b) target distance of 20 mm; (c) target distance of 25 mm; (d) target distance of 30 mm; (e) target distance of 35 mm; (f) target distance of 40 mm; (g) target distance of 40 mm; (h) target distance of 50 mm.
Applsci 12 00536 g007
Figure 8. Mass loss of the samples under different target distances.
Applsci 12 00536 g008
Figure 9. Surface morphology change of the samples at different impact times (unit in mm): (a) t = 10 min; (b) t = 30 min; (c) t = 60 min; (d) t = 90 min.
Applsci 12 00536 g009
Figure 10. Variation of mass loss and mass loss rate with impact time.
Applsci 12 00536 g010
Figure 11. Three-dimensional surface morphology of the samples under different target distances: (a) target distance of 25 mm; (b) target distance of 30 mm; (c) target distance of 35 mm; (d) target distance of 40 mm; (e) target distance of 45 mm; (f) target distance of 50 mm.
Applsci 12 00536 g011
Figure 12. Variation in RMS roughness of the sample surface with target distance.
Applsci 12 00536 g012
Figure 13. Variation in skewness with target distance.
Applsci 12 00536 g013
Table 1. Structural parameters of the two-throat nozzle.
Parameter DescriptionSymbolValueUnits
First throat diameter d11.5mm
Second throat diameter d21.0mm
Connection diameter d34mm
Inlet diameter D5mm
Entrance length L15mm
Length of outlet diffusion angleL211mm
First throat inlet constriction angle α60°
First throat outlet diffusion angle ß30°
Second throat inlet constriction angle γ27°
Second throat outlet diffusion angle θ20°
Table 2. Chemical composition of the sample (mass%).
AlSiCuMgZnMnTiFe
99.6≤0.25≤0.05≤0.03≤0.05≤0.03≤0.03≤0.35
Table 3. Physical properties of the sample.
Density/kg·m−3Elasticity Modulus/GPaTensile Strength/MPaOffset Yield Stength/MPaSurface Roughness/μmVickers Hardness HV0.2
27107180351.531
Publisher’s Note: MDPI stays neutral with regard to jurisdictional claims in published maps and institutional affiliations.

