Article

Reliable Fault Tolerant-Based Multipath Routing Model for Industrial Wireless Control Systems

1
Department of Electrical and Electronic Engineering, Universiti Teknologi PETRONAS, Seri Iskandar 32610, Perak, Malaysia
2
Department of Robotics and Mechatronics Engineering, Faculty of Engineering and IT, Taiz University, Taiz 6169, Yemen
*
Author to whom correspondence should be addressed.
Appl. Sci. 2022, 12(2), 544; https://doi.org/10.3390/app12020544
Submission received: 6 November 2021 / Revised: 30 November 2021 / Accepted: 3 December 2021 / Published: 6 January 2022
(This article belongs to the Special Issue Wireless Sensor Networks: Technologies, Applications, Prospects)

Abstract

:
Communication in industrial wireless networks necessitates reliability and precision. Besides, the existence of interference or traffic in the network must not affect the estimated network properties. Therefore, data packets have to be sent within a certain time frame and over a reliable connection. However, the working scenarios and the characteristics of the network itself make it vulnerable to node or link faults, which impact the transmission reliability and overall performance. This article aims to introduce a developed multipath routing model, which leads to cost-effective planning, low latency and high reliability of industrial wireless mesh networks, such as the WirelessHART networks. The multipath routing model has three primary paths, and each path has a backup node. The backup node stores the data transmitted by the parent node to grant communication continuity when primary nodes fail. The multipath routing model is developed based on optimal network planning and deployment algorithm. Simulations were conducted on a WirelessHART simulator using Network Simulator (NS2). The performance of the developed model is compared with the state-of-the-art. The obtained results reveal a significant reduction in the average network latency, low power consumption, better improvement in expected network lifetime, and enhanced packet delivery ratio which improve network reliability.

1. Introduction

Industrial wireless sensor networks (IWSNs) are a promising technology in process automation transmission, since they permit integrating the concepts of Industry 4.0 (I4.0) with the industrial Internet of Things (IIoT) [1,2]. IWSNs have received a lot of attention because of their numerous benefits and industrial applications such as control, inventory, and monitoring systems based on obtained information to enhance productivity and offer cost reduction [3]. By 2025, the globally recognized IWSNs market is predicted to hit USD 8.67 billion [4]. IWSN benefits include flexibility, versatility, reduced infrastructure, low maintenance, and scalability [5,6]. An IWSN is composed of access points (APs), a gateway and a collection of wireless sensor nodes. The APs link these sensor nodes to the gateway, where the latter supplies the network automation by providing the required connections to the respective plant. The gateway is attached to a device called a network manager (NM), which is in charge of network management, scheduling, routing, admission control, and setup. The use of centralized management allows for network control as well as the simplification of node hardware and software. Wireless standards such as ISA SP100.11a, WirelessHART (WH), and WIA-PA standards are widely implemented in IWSN applications [5,7]. These standards typically form mesh networks, with nodes acting as routers to improve communication path availability [8]. Figure 1 shows an example of WirelessHART mesh network structure. In most IWSN applications, real-time, low-latency, and reliable data communications are required [9]. Another prerequisite is low energy consumption, as batteries are frequently utilized to supply nodes [10]. One of the most basic requirements of IWSNs is to extend the network lifetime. The energy consumption of sensor nodes has the most significant impact on the network’s lifetime [11]. It is often a complex mission to optimize the network performance and to meet such requirements due to the topologies’ characteristics, devices, and properties of a wireless network such as signal interruption, interference, shared platform, and transmission power [10,12].
Meanwhile, it is unpredictable in working scenarios, where interfering variables such as electromagnetic waves, vibration, and temperature might lead to network failures or faults such as operating software faults, asynchronous clock, radio frequency conflicts, depleted battery, and path losses [13,14]. This will significantly reduce the reliability of sensor nodes, and diminish or disrupt the normal functioning of wireless networks. The network’s performance has been severely hampered, and it will face significant hurdles in terms of adaptability, robustness, and reliable data transmission [15]. The reliability and accuracy of data transmission are intimately linked to successfully implement wireless networks. These concerns remain unresolved in terms of fundamental theory and engineering techniques [16].
Based on the working scenario of a network and its very own characteristics, failure of links or nodes might arise while the network process is running. These failures will have an effect on the topology stability and data transmission reliability, and consequently, degrade the overall comprehensive network performance. The network’s health is crucial for wireless sensor networks to operate reliably, transmit data reliably, and optimize performance [15]
For these reasons, it is necessary to build fault-tolerant based multi-hop and routing mechanisms that require the least amount of additional computation despite the fact that they may also require additional communication in order to construct or recover the damaged paths due to a node or link failure [17]. Network stability and reliability are improved by the use of fault tolerance methods, which employ techniques or algorithms to grant a reliable data transfer in order to increase the reliability and stability of networks [16]. Fault tolerance is simply a matter of evaluating all possible abnormal states in a timely manner and devising a fault-tolerant control strategy. The purpose is to adapt to a wide variety of network abnormalities and deliver a highly trusted computing solution once network failures or mistakes have been recognized. Fault tolerance technology plays an essential role in enhancing the wireless sensor network reliability and robustness [18]. It is a critical technical challenge that must be resolved and has developed into a significant research field in wireless sensor networks [19].
Multipath routing is regarded to be an efficient method of enhancing fault tolerance and transmission reliability [20]. The purpose of multipath transmission technology, which is based on network encryption, is to transport the encrypted data across numerous pathways placed between the source and destination nodes [21]. Some of the delivered data packets at the sink node can be reassembled into the form of original packets sent by the source node. Multipath routing enhances the trade-off between multiple routes and transmission bandwidth through the technique of redundant pathways and load balancing to achieve reliable transmission and fault tolerance [22]. Additionally, the multipath routing technique takes into account minimizing the transmission delay and energy consumption balancing in wireless sensor networks [23]. As a result, the construction of multipath routing is the study’s main focus in order to improve the fault tolerance and reliability of industrial wireless network.
This work exhibits a new contribution of designing and developing a fault tolerance multipath routing (MPR) network model, such that the high reliability of wireless mesh networks can be realized. The main aims are to achieve better coverage and connectivity via fewer routers and pathways of network layout by utilizing a network planning algorithm. The MPR model structure is composed of three different pathways that have different lengths. The shortest path always has a faster data transmission rate given that all nodes and edges are the same. The other two paths are of the same length and behave as alternative paths for the case of shortest path transmission failure. A fault model is considered to verify and evaluate the robustness of the developed MPR model and monitor the behavior of the network with the existence of link failure. The effectiveness of the developed MPR is verified using WirelessHART, stack which was implemented in the Network Simulator 2 (NS2) [24]. Consequently, the results are analyses and compared with three of the existing routing algorithms namely: Han [25], Kunzel [26], and QLRR [4] using performance criteria such as expected network lifetime (ENL), average network latency (ANL), and packet delivery ratio (PDR).
The rest of this article is categorized as follows: Section 2 provides background information transmission reliability, fault tolerance, and summarizes related works regarding wireless solutions. Section 3 explains the methodology and the simulation setup. Results and discussion are explained in Section 4. Lastly, this paper is concluded in Section 5.

2. Literature Review

2.1. Fault Tolerance and Multipath Transmission Technologies

The wireless network that adopts the technology of multipath transmission associated with fault tolerance has the purpose of transmitting the data packets through multiple routes created between the source and destination nodes. It reassembles a specific number of encrypted packets delivered at the sink node into the original packets at the source node. The approach of redundant routing and network encoding is used to increase both load balancing and transmission capacity, resulting in improved fault tolerance and data transmission reliability, as well as improved performance.
Multipath routing technologies including geographical routing, QoS based routing, and energy-aware routing have been proposed by numerous researchers [27]. An algorithm called kautz-based real-time, fault-tolerant, and energy-efficient (REFER) was proposed for the development of an efficient fault-tolerant routing protocol that identifies the multiple shortest paths from the source node to the sink node and performs multicasting between and within the cells of the Kautz graph [28]. Authors in [29] proposed a distributed width-controllable braided multipath routing (WC-BMR) based on local neighbor data for the purpose of collecting data in wireless sensor networks. Similarly, authors in [30] proposed a multipath prefix routing (MPR), which is based on multipath routing protocol in a wireless sensors network. Geographic routing systems such as GEAM (Geographic Energy-Aware non-interfering Multipath), DGR (Directional Geographical Routing) and GPSR (Greedy Perimeter State Routing) are assessed and analyzed as efficient routing techniques [20].
Multipath routing may, however, require some optimization when it is subjected to multiple function issues in the presence of certain conditional variable constraints. The algorithm is enhanced with other measures for evaluating the network’s performance, such as routing stability, energy consumption, network delay, and packet delivery ratio. In particular, the huge number of sensor nodes deployment and meanwhile the existence of faulty nodes in the dynamic topology network has become a key issue in how to enhance the convergence and optimization performance.
On the other hand, the definition of fault tolerance is simply the ability to determine various types of unusual conditions in a specific time and to devise a suitable fault-tolerant control method to instantaneously handle various network abnormalities while continuing to sustain network reliability and stability. Reliable transmission is a crucial measure for evaluating the performance of the transmission, which is primarily indicated by the error rate of packets and the successful packet transmission rate. Multipath routing, in wireless sensor networks, is essentially a redundant routing approach. It serves as a fault tolerance mechanism, preventing effects generated by fault links or nodes. Hence, adopting the strategy of multipath routing into industrial wireless networks is necessary to provide fault tolerance through multipath transmission to enhance the transmission reliability performance.
Disjoint path vector (DPV) is a distributed topology-based fault-tolerant control algorithm that was developed to resolve the k-degree any cast topology control issue. It is able to tolerate up to k-1 node failures in worst-case scenario by satisfying the k-vertex super node connectivity and ensuring k-vertex-disjoint pathways to supreme nodes [31]. The adaptive disjoint path vector (ADPV) technique proposed by authors in [32] is used to ensure the connectivity of super nodes in the event of node failures. Fault tolerance and fault detection in the wireless sensor networks are modeled and analyzed in [33]. Lee et al. [34] proposed an efficient technique for the recovery objective that aims to construct inter-partition bi-connected topology while deploying the fewest relay nodes and minimizing the longest path between partition pairs. Connection restoration and reliable transmission are achieved using the full 2-connectivity restoration algorithm (F2CRA) and the partial 3-connectivity restoration algorithm (P3CRA) which were proposed by authors in [16]. Meanwhile, Shih et al. in [35] proposed the grade diffusion method paired with the genetic algorithm that is used to develop fault tolerance-based fault node recovery algorithm. A proactive fault tolerance method was proposed in [36], to prevent faults from affecting the network. Their method detects the fault after the network starts running. However, this method was not evaluated for the reliability requirements, such as packed delivery rate and network lifetime.

2.2. Latest IWSN Simulation Solutions

Network simulators are commonly used to test and evaluate networks and communication protocols. Thus, a comprehensive summary of the most relevant works about simulators utilized in the domain of IWSNs, emphasizing the simulations accuracy, is discussed in this section. We studied the amount of complexity applied in the simulations (that enables more detailed simulations) and the measures employed in the simulator assessment.
For instance, Bayou et al. in their study [37] presented a WirelessHART implementation in OMNET++ for the purpose of conducting security experiments in the network. The model implemented the Network Manager as well as the entire protocol stack using the physical layer features of InetManet [38]. This demonstrated that it is possible to implement a complete IWSN protocol stack on a simulator. Liu et al. [39] adapted a commonly used industrial process model (Process Control Challenge Problem, known as Tennessee Eastman [40]) by incorporating wireless communication links in the model between process control, actuators, and sensors. The findings of the simulation demonstrate that the process may be carried out via wireless communication links. This work evaluated the impact of different wireless layouts and setups on the process operation. OMNET++ was the simulator utilized, while models from the MiXiM and INET frameworks are utilized for the wireless channel template and the address resolution protocol (ARP), respectively. The WirelessHART protocol is used in the simulation and concentrates on the layers of Medium Access Control (MAC) and Physical (PHY). The authors provided the source code online, which can be found at [41]. The process variables deviation from their nominal values, as well as the estimated period for which the plant can function normally, are the performance metrics that are being evaluated. During simulation, a modification of access points positions as well as the packet error rate of the RF communications was performed. However, neither the functionalities of the WirelessHART gateway nor a complete stack of WirelessHART protocol were implemented in the simulator.
The authors in [42] proposed simulated ZigBee, WirelessHART and ISA100.11a networks using Castalia and Pymote. The performance metrics evaluated in their work are device energy consumption, the number of transmitted packets, and throughput. The widely available generic models were employed during simulations (i.e., the MAC layer and Physical layer of IEEE 802.15.4 models for the simulations of ISA100.11a and throughput Test generic application). Neither the functionalities of WirelessHART and ISA100.11a gateway nor the communication stack of all layers has been implemented in this work.
Meanwhile, Herrmann et al. in [43] proposed an ISA100.11a model for ns-3 that implements a simplified application layer as well as the standard’s data link and physical layers. The source code of this work is available online at [44]. On the other hand, the simulator proposed by authors in [45] is a cycle-accurate type which is used for WSNs and it is called Avrora. Scalability in real-time is up to as many as 25 nodes, which it can handle. Unlike ATEMU [46], Avrora aims for highly accurate timing with improved performance. This is achieved by extracting fine granularity parallelism within the WSN simulation.
In [47], the authors proposed an energy consumption based mathematical model for wireless sensor nodes. It takes into account the communications, acquisition, and processing of the energy consumption. The study in [48] discussed the simulation significance of the impact of CPU load on the IWSN and the benefits of doing so. For precise simulation of wireless sensor nodes, the ns-2 simulator [49] has been integrated with the RTSim [50] program. The evaluation is done based on the IEEE 802.15.4 communication standard [51]. The research work in [52] proposed an algorithm to plan the network structure, which determines the routes that are necessary to be deployed. However, validating the network latency issues and the packet loss mitigation techniques were not considered.
The implementation of WirelessHART and ISA100.11a in a refinery was discussed in [53]. A new simulator, known as the RF Propagation Simulator (RFSim) has been developed to aid with the implementation process. It estimates the quality of an RF signal in the vicinity of a manufacturing facility or a commercial establishment. The findings of the simulation were compared to those obtained from on-site measurements, and they appeared promising. The authors pointed out that the majority of work published on sensor network implementation is limited to a 1D or 2D environment, while considering 3D environments as an open issue at this time. In [51], an enhanced industrial WSN model was proposed and evaluated. The model integrated an ns-3 network simulator with the functional communication stack of the ISA100.11a standard. The simulation accuracy was validated using different scenarios such as node-in-the-loop and hardware-in-the-loop (HIL).
A full stack of WirelessHART and gateway implementation is proposed in [24] which was done on the ns-2 simulator [49]. To ensure that the model is accurate, the authors put up identical networks both on real hardware and in the simulator. The performance of both real and simulated networks was compared based on the network’s energy consumption, real-time packet transfer, throughput and communication scheduling, and network reliability (i.e., received signal level average and ratio of failed transmission). The efficiency of management was measured in terms of performance delay and overhead during the procedures of service request and joining. The performance of the simulator in wireless mesh networks is also evaluated with particular attention paid to the network’s responsiveness in the event of link and node failure. Furthermore, three different lossy networks were evaluated in terms of packet delivery rate. These assessments have shown that the real network results have common sense when compared to the simulated results. Hence, the versatility of the suggested model made it applicable in a variety of situations and scenarios.
Studies have made it possible to indulge various aspects of hardware in simulation scenarios in order to improve the accuracy of the simulation results. This is referred to as hardware-in-the-loop. Authors in [54] integrated physical wireless nodes with the TOSSIM simulator at the level of radio communication. The proposed work showed the viability of a WSN comprising both physical and simulated nodes. This was accomplished through the use of a physical Dual Base Stations pair as a bridge linking simulated and physical environments. Hence, a real-time simulation is achieved. Although the technology enables communication between simulation environment node and real environment nodes, the position and number of real nodes are bounded by the linking devices capabilities.
Studies in [55,56] stated that the easy way to deploy a WSN in a certain layout is to evaluate the WSN software using software-in-the-loop simulation method. This is achieved by the integration of the software on the installed wireless sensor network with a sensor device and simulated environment.
A simulation of radio hardware is demonstrated in [57], which shows how it can be integrated into the simulation. Physical phenomena and real hardware are used to implement physical Medium and the Physical Layer of IEEE 802.15.4, respectively, in this Radio-in-the-Loop (RIL) method. Software implements communication layers above these, comprising the MAC layer of IEEE 802.15.4. As a result, the experimental results are more realistic than the pure simulation results. The OMNeT++ network simulator was employed in this work, and the interface to the hardware is relying on the PcapNG data format and the inter-process communication known as Linux/Unix. The radio utilized is an IEEE 802.15.4 compatible ATmega128RFA1 operating a customized Contiki OS application [58]. However, the latency induced by the adaption between the hardware and software simulation components is not measured in this study. WirelessHART and other IWSN protocols (such as ISA100.11a) require low latency at the MAC layer to ensure appropriate operation of the slotted transmission scheme; severe latency would degrade communication.
An IWSN simulator has to be versatile (to facilitate multiple types of use-case situations), fast (hence efficient computational time), and accurate (to estimate the behavior of the IWSN system physical deployment correctly). Table 1 summarizes the main properties of previous industrial WSN simulation methods compared to the model described in this article.

3. Methodology and System Model

This section illustrates the network deployment mechanisms and network planning procedures for ensuring transmission reliability in WirelessHART networks. Furthermore, the simulation setup is also described in this section.

3.1. Graph Routing in WirelessHART

The WirelessHART standard specifies three categories of graph routing for accomplishing various transmission purposes: broadcast, uplink, and downlink. The broadcast graph is used to send general messages from the gateway to each node in the network. Each field device’s data is uploaded to the gateway using the uplink graph. Finally, the gateway uses the downlink graph to transmit unicast data to unique field devices. The network manager creates and updates all these routing graphs, which are then downloaded to each node.
Figure 2 demonstrates an example of graph routing in WirelessHART mesh networks namely broadcast ( G B ), uplink ( G U ), and downlink ( G d ) graphs. Each of the routing graph topologies consists of four nodes, two access points (AP1 and AP2), and one gateway (GW). The arrows in Figure 2 represent the hops in the routing direction, from source to destination, where the message will be forwarded.

3.2. Network Planning Procedures

Considering the industrial factory layout, the norm is to have the machines located in predefined positions. Since field devices are connected to machines in an industrial factory, their locations are considered fixed. As a result, the focus in this work is to ensure that all field devices are reliably connected by positioning gateways, access points, and routers in the right places. Without loss of generality, it is assumed that an industrial factory usually has dimensions of W meters by L meters in the form of a square or rectangular layout. The field devices represented by the red squares are arranged within the factory, as shown in Figure 3a.
The first phase in network planning is gridding the factory environment into multipath triangular cells. If required, a router should be deployed on each vertex edge in Figure 3b. To ensure compatibility, each triangular cell’s edge length should not exceed the specific transmission range of the WirelessHART standard, i.e., a single transmission link hop is represented by one vertex edge.
The second phase is to coordinate the access points. They are placed in a position based on the least total hops to the field devices in the layout of the factory. It is performed by calculating the shortest hops between any field device and any vertex. The position of the access point can be defined in this manner, as shown in Figure 4a. For simplicity, we show one access point at the center of the network layout located at the same distance of each field device. The gateway is connected to the access point through cables; therefore, locating it is relatively less constrained.
In phase three of network planning, routes between field devices and access points are planned. The routing protocol is known to detect the highly suitable router subset of all routers in the network to link field devices to access points. In contrast, the process of network planning works differently when determining the required routers is done first and then deploying them wherever needed. This paper considers the principle of multipath routing, which employs the principle of a shortest path with least routers and shortest hops to create a network planning algorithm as shown by the Algorithm of multipath routing protocol. The access points are connected to the gateway on a wired basis, therefore the placement of the gateway in the network is not a constraint. Figure 4b shows the deployment of the routers along the paths extended between the field devices and the access point. Table 2 provides the variables used in this paper along with their notations.

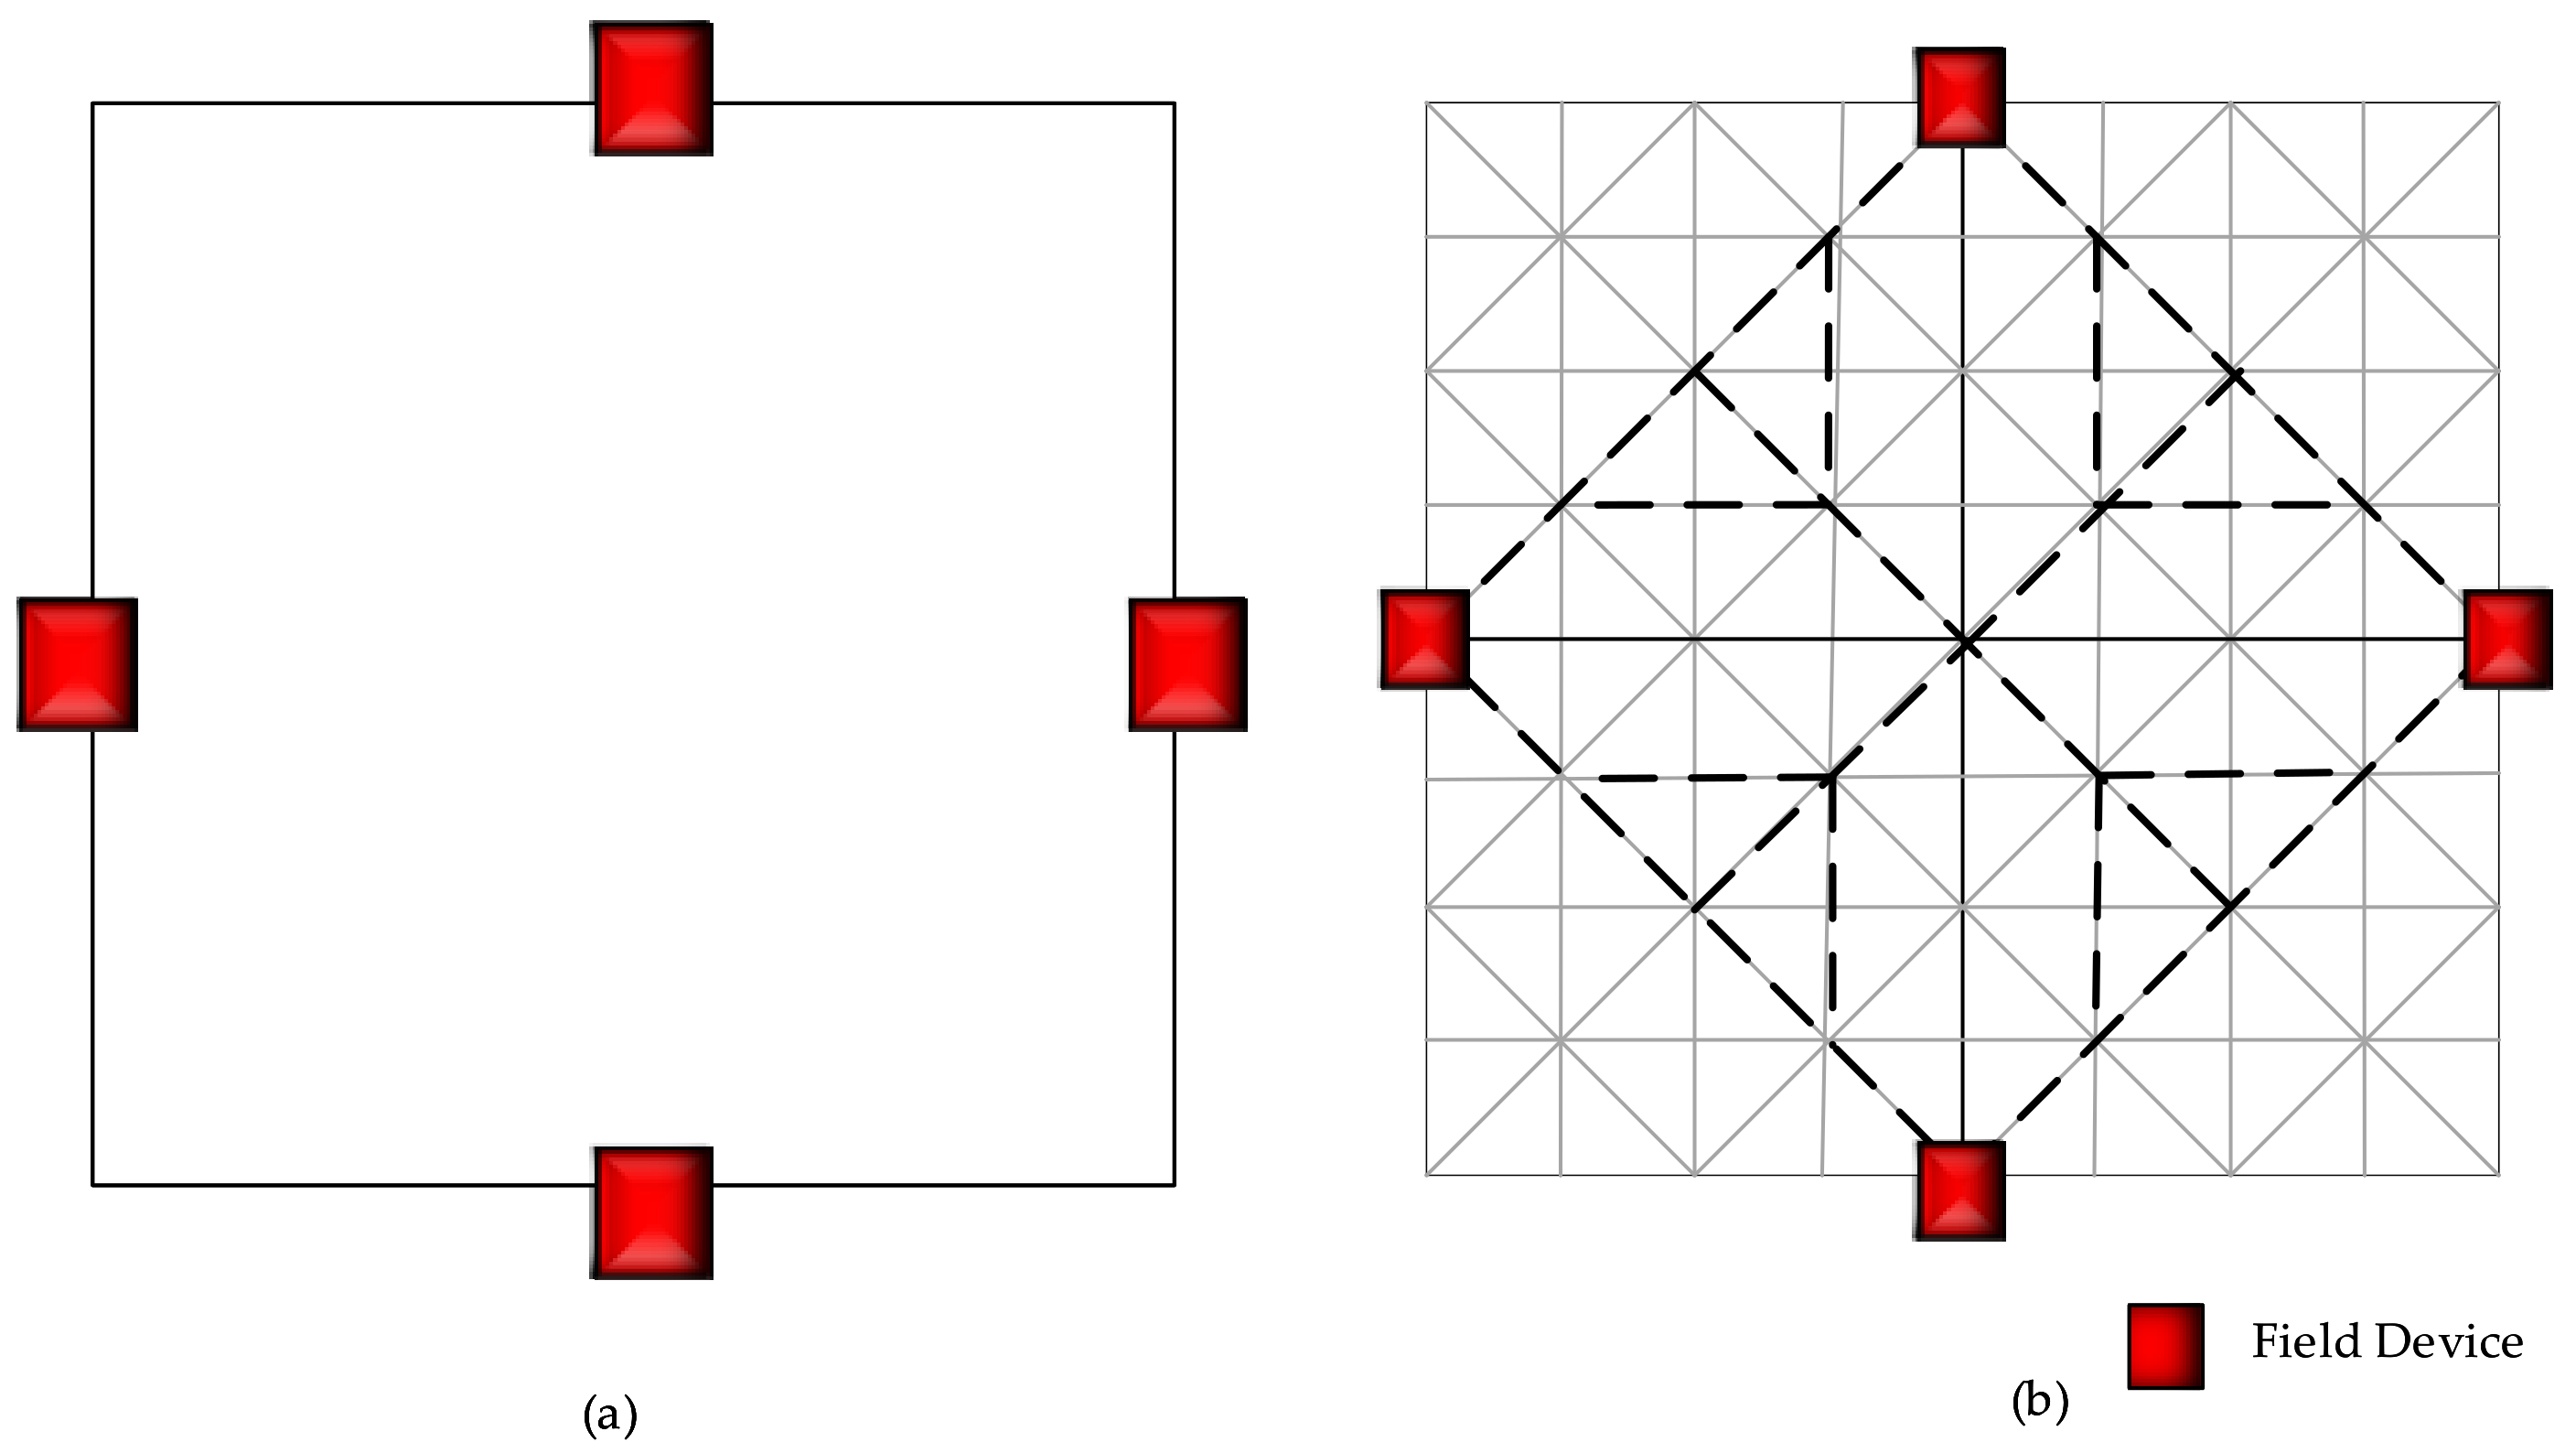
3.3. Network Deployment Structures

The primary method for meeting the routing reliability requirements is to find appropriate WirelessHART mesh network deployment structures. We use the developed structure in Figure 2 as an example. The figure indicates the possibility of obtaining a reliable network layout to guarantee transmission reliability by overlapping three separate routing graphs and ignoring the connection directions, as shown in Figure 5. One can see that there are more than three paths, while nodes 5 and 4 are only used for backup. The gateway is represented by node 9, and the access points AP1 and AP2 are represented by nodes 7 and 6, respectively. The multipath structure conveys the data through three different paths. Thus, between the gateway and the sink node, at least three different routes exist. For instance, when considering the paths from the gateway to Node 1, there are three redundant routes, (9→7→3→1), (9→8→1), and (9→6→2→1). Nodes 5 and 4 are backup nodes that hold the same set of data being forwarded by the access points to the successive nodes. The data is being momentary stored in the case of any data interruption in the main route. As seen in Figure 5, there are two types of routes, represented by solid and dashed lines. The solid line represents a default path (DP) from a specific node, while the dashed line represents an alternative path (AP) from the previous node. Usually, the main node has the tendency to receive the data forwarded through the default path.
There are other methods to build the WirelessHART’s mesh network besides the above structure. The authors in [52] proposed triangle and square structures that can also produce reliable transmission. Each node in the triangle-based network structure gets two degrees of incoming and outgoing communication. As a result, a minimum of three separate paths that exist between the gateway and each node are formed. On the other hand, every node in the square structure has three outgoing and incoming communication degrees. As a result, there are four possible routes between the gateway and each node. In this article, we constructed the network with more focus on the triangle-based network structure.

3.4. Simulation Setup

The simulations are performed on NS-2 with the WirelessHART simulator [24], which was validated by comparing it to existing WirelessHART networks [8,24]. The simulation parameters are similar to those mentioned in the literature for IWSN monitoring applications that use WH. The network manager polls the type of battery and presents the predicted lifetime of the battery from nodes using the energy model [8] and simulator changes [26]. The battery lifetime in the WirelessHART standard is expressed in form of an integer that represents days. This value keeps decreasing as the simulation continues running. As the industrial WSNs are sensitive to variable wireless channel circumstances, a generic route loss model is included for RSL estimation (two-ray ground-reflection) with a power transmission of 0 dBm and a maximum contact range of 40 m [24]. On the physical layer, there is a probability model for packet loss for indoor layouts that uses the same transceiver family as the energy model [59]. Kunzel et al. added the alarm path down command to the application layer so that nodes can report broken connections with neighbors to the network when a keep-alive message is not exchanged between linked nodes after a particular period of time [26]. We also used the adaptation proposed by [4], which tweaked the simulator to calculate the percentage of reliable nodes (PRN) in the uplink graph and test PDR and average latency by tracking the utmost frame number snippet that may be found in wirelessHART’s network layer. One gateway was placed in the edge of a 20 × 20 m field, with two access points located 7 m in the left and 7 m to the gateway’s right side. The rest of the nodes are planned in organized pathways contracting multipath routing as in our proposed model. Wired and reliable links between the access points and the gateway are considered [60]. The nodes are assigned to numbers based on their distance from the gateway. According to [4], 50% of the nodes were powered by industrial-standard batteries (3.6 V, 17 Ah) while the other 50% of the nodes were line powered. Table 3 shows the NS-2 simulation parameters.
Each simulation begins with the gateway and access points start-up. According to the topology’s sequence number, after 5 min the first node is activated and followed by the rest of the nodes each i minute time interval. Listening to the channel for advertising packets by a node from its default parent (DP) happens before joining the operation. After entering, it demands bandwidth from the network manager, receives configurations (links and routes), and begins transmitting sensor measurements to the gateway over a 32-s cycle. Every 15 min, health reports are submitted, and the network manager performs a battery life polls each 1-min time interval. This routine of management is run every 10 min or when a new device enters the network. Simulation parameters used in [24,26] are considered in this simulation.
Algorithm 1: Algorithm of Multipath Routing Protocol (MPR).
Input: Dimension of factory: W meters L meters; Location
    ( X i , Y i ) of all field devices, i N D ; T triangle cells edge length.
Output: Set of multipath routers N R with their positions ( X j , Y j ) , j N R
  1: convert the factory area into grid of T length edge triangle cells, and obtain the positions
    ( X v , Y v ) of each vertex v , v N V .
  2: Calculate: the least link H number ( a , b ) between two random nodes, a , b N V U N D
  3: Figure out the vertices that satisfies argmin j N V and H ( j , 1 ) = 1   i = 1 N D H ( i , j ) to represent the location of
   access point number one A 1
   LOOP Process
  4: for field device I N D do
  5:    Figure out the closest vertices of the two neighbors R 1 and R 2 where R 1 , R 2 N V .
      In the first step, set Edge1= ( R 1 , R 2 ), Edge2= (∅, ∅), and subset of planned routers
       N R i = ∅ for ith field device.
  6:   while Edge1 ≠ AP, Edge2 ≠ AP do
  7:    Let P1=P2=∞
  8:    for Non-free Edge k, k ∈ 1, 2 do
  9:     Use the set of vertices N V to figure out different vertex of R3,k
        which satisfying the terms and conditions:
  10:     TC1: H (R3,k, Edgek(1)) = 1;
  11:     TC2: H (R3,k, Edgek(2)) = 1;
  12:     TC3: R3,k= argmin j N V and j N R i H(j, A1) + H(j, A2).
  13:     Then, count routing hops number from R3,k to access points A1 and A2,
        i.e., Pk=H(R3,k, A1) + H(R3,k, A2).
  14:    end for
  15:    if P1 ≤ P2 then
  16:     R3=R3,1, R1= Edge (1), and R2= Edge (2);
  17:    else
  18:     R3=R3,2, R1= Edge (1), and R2= Edge (2);
  19:    end if
  20:     N R i = N R i R3
  21:    Edge1= (R1, R3), Edge2= (R2, R3)
  22:  end while
  23:   N R = N R N R i
  24: end for
  25: return N R with locations (Xj,Yj), j N R .

3.5. Fault Model

The evaluation of MPR fault tolerance characteristics is done by simulating fault model in the wireless network. The fault model is mainly based on link failures, which lead to packet loss in the failing link. The data packet drops are simulated by introducing random link failures on different links in the MPR model for random periods of time. The link failure is introduced to the network in the primary and alternative pathways. This is performed in two ways. First, by referring to Figure 5 the links joining nodes 8 to 1 on the primary path and 3 to 1 on the first alternative path are down at random times for random duration. Second, the link joining nodes 2 to 1 on the second alternative path is down for intermittent periods of time after the links in the primary path and the first alternative path are fault free. It is worth noting that any routing path is only usable if it is free of link failures. The evaluation parameters such as ANL, ENL, and PDR in the presence and absence of packet drops due to link faults are thoroughly discussed in Section 4.

4. Results and Discussion

In this section, the evaluation of the proposed modifications for the Kunzel [26], Han [25], and QLRR [4] protocols are presented. The proposed multipath routing (MPR) model shown in Section 3.3 was applied to Kunzel, Han, and QLRR algorithms to produce MPRKunzel, MPRHan, and MPRQLRR, respectively. The performance of the proposed model was compared with the original algorithm by evaluating average network latency (ANL), expected network lifetime (ENL), and packet delivery rate (PER). These three factors play essential roles in determining the reliability of IWSNs.

4.1. Average Network Latency (ANL)

The evaluation of the proposed model was performed by comparing its performance with the three algorithms mentioned above. The gray boxplots in Figure 6 depict the average network latency of the WirelessHART network simulated with the Han [25] algorithm. The simulation was performed with the original Han network layout and the MPR proposed network topology, a fault tolerance-based model. It can be observed that implementing the MPR model with Han’s algorithm has significantly improved the network performance by reducing the average network latency. The boxplots show approximate reductions of 1.25 s and 1 s in the median and mean ANL, respectively.
On the other hand, Kunzel’s [26] approach was developed using Q-Learning to build graph routes for WSANs which utilizes a centralized management scheme. They adapted a Q-learning algorithm that uses and adjusts agents’ weights to reliably build graphs. In this work, the proposed MPR model was implemented on the original Kunzel algorithm. Thereafter, the performance was evaluated in terms of average network latency, as indicated in the blue boxplots in Figure 6. The proposed MPR model has led to a significant reduction in the average network latency. The boxplot depicts the median of ANL, which has decreased from 2.8 s to 1.2 s. Similarly, the mean of ANL was reduced from 2.8 s to 1.25 s. As a result, the performance of the Kunzel protocol has been improved with the implementation of the MPR model as the ANL was reduced by 1.6 s.
Q-Learning reliable routing (QLRR) [4] creates a routing graph that is used by nodes to send data to a gateway. A weighted cost equation is used to select nodes and neighbors (graph edges) during the graph construction process. The green boxplots in Figure 6 depict the ANL of the MPR model over QLRR and the ANL of the QLRR itself. One can see in Figure 6; the MPRQLRR method results in expediting the data delivery rate by reducing the ANL. The QLRR originally has a median and mean ANL of approximately 2.5 s, which were further reduced to 1.5 s when the MPR method is applied. In this regard, it can be said that MPR has improved the network performance as the average network latency is decreased by a factor of 1 s.
In summary, the model proposed in this study has improved the network latency of all the base algorithms. Among the three protocols, the MPRKunzel outperforms the other two algorithms by having the least average network latency. On the other hand, the MPRQLRR results in an ANL median of 1.6 s, which outperforms the MPRHan, whose ANL median is 1.8 s. In other words, the MPRHan has the worst performance than others, as observed in Figure 6.

ANL with Packet Drop

Figure 7 depicts the boxplot of the ANL when packet drops occur at different links of the MPR model. It can be observed that the proposed model is robust where the average network latency in all of the utilized algorithms was not very affected by the packet drop (PD). When the response is compared with the condition of no packet drop, the median and the mean of the data has no significant difference. Despite the small effect due to the packet drop, the ANL of the WSAN over the proposed MPR model still outperforms the original algorithm shown in Figure 6 as elaborated in Section 4.1.

4.2. Expected Network Lifetime (ENL)

The lifetime of a wireless network is a significant factor in establishing a highly efficient network. It can be enhanced by controlling the power consumption of the nodes. In this subsection, an ENL evaluation of the proposed MPR with the associated routing algorithms is performed. The gray boxplots of Figure 8 show the expected network lifetime (ENL) of the simulation run using the WirelessHART simulator with Han [25] and MPR-based Han algorithms. The collected data are originally based on the estimated number of days, which was converted to years for simplicity. It can be observed in Figure 8 that implementing the proposed MPR model with Han and QLRR algorithms has drastically improved the network performance through increasing the expected network lifetime. As for the Han algorithm, the boxplot shows a vast increment of ENL mean, where MPRHan and Han have produced a mean of 10 years and 5.5 years, respectively.
Likewise, the Kunzel [26] algorithm was further investigated with the association of MPR to evaluate the latter effect in terms of the expected network lifetime. The WirelessHART simulator was tested with the original Kunzel and the MPR-based Kunzel layouts, which in turn produced the expected network lifetime chart as depicted by the blue boxplots in Figure 8. One can see in the figure that the MPR model has enhanced the network lifetime expectation. Originally, running the WirelessHART simulator with the Kunzel algorithm led to an ENL mean of approximately 6.5 years. This number was significantly increased when MPR is used and has led to an increment of the ENL mean by 4 years. In other words, it can be observed from Figure 8 that MPR-based Kunzel and Kunzel produced ENL mean values of 10.5 years and 6.5 years, respectively.
Moreover, the proposed model was further evaluated on the QLRR [4] algorithm for the expected network lifetime factor. The MPR model has influenced the QLRR network in a way that led to increasing the ENL by a huge factor. This is observed from the green boxplots in Figure 8, where the original mean ENL of the QLRR algorithm was 5.6 years and then increased to 11 years as the MPR method was applied in the network. The MPR model outperforms the original network topology by more than two times the ENL median. In this context, it can be said that the proposed MPR model has significantly contributed to enhancing the network performance where the power consumption, in this case, is lessened, resulting in extending the nodes lifetime and hence increasing the factor of expected network lifetime.
The bottom line is that the proposed MPR method has enhanced the expected network lifetime of three algorithms. The overall improvement of the network lifetime, including the three selected algorithms, can be observed by looking at the MPR based boxplots in Figure 8. It can be clearly noted that the proposed MPR model has produced the highest ENL when it is implemented with the QLRR algorithm. The QLRR method outperforms other methods by having a mean ENL of 11 years when implemented over the proposed MPR method. To wrap up, network life is an essential measure in wireless networks. This study, in turn, proposed an MPR model that makes the state-of-the-art algorithms more effective and better performance.

ENL with Packet Drop

Figure 9 depicts the boxplot of the ENL when packet drops occur at different links of the MPR model. It can be observed that the proposed model is robust where ENL in all of the utilized algorithms was not very affected by the packet drop. When the response is compared with the situation of no packet drop, the average and the mean of the data is nearly the same. The MRPQLRR was the algorithm least affected by the packet drop where the mean ENL remains the same. Despite the small effect due to the packet drop, the ENL of the WSAN over the proposed MPR model still outperforms the original algorithms shown in Figure 8 as discussed in Section 4.2.

4.3. Average Energy Consumption

MPR has been proven to be efficient for minimizing the power consumption by choosing the location of the routers and reducing the transmission pathways between source and sink nodes. Having many unplanned nodes in the network decreases the efficiency of the network in terms of power consumption rate. The average energy consumption decreases when the packets are transmitted via multipath routes in which sensor nodes on alternative paths are not scheduled to consume energy for complying with the requirement of coverage and connectivity. Therefore, the developed MPR model has achieved better results in terms of energy consumption as compared to the other algorithms as the transmission is performed through the shortest path, which helps the other sensor nodes in the network preserve their energy. Figure 10 shows the energy consumption of the MPR as compared to the algorithm associated with MPR itself. MPR consumes a lower energy amount as compared to the other algorithms used in the state of the art. Due to the low consumption rate of MPR, it significantly prolongs the IWSN lifetime.

4.4. Packet Delivery Ratio (PDR)

One more critical factor to consider in this paper is the packet delivery ratio (PDR). The data collected from the simulation of the original protocols and the proposed MPR method were projected into boxplots and discussed accordingly.
Several repetitions of the simulation were performed using the Han [25] algorithm with original topology and MPR-based topology to get statistics of PDR. Those statistics are depicted in blue boxplots in Figure 11. The proposed MPR method has shown a high rate of reliability when simulated with the Han algorithm. This reliability is expressed through the percentage of the packet delivery rate, as shown in Figure 11. A vast improvement was achieved when comparing the original PDR of the Han algorithm with MPR-based Han. The mean and median of PDR were enhanced by more than 3%, in which the PDR median of Han statistical results is 95.6% while the PDR median of MPRHan is 99.5%.
In the same context, the MPR model is tested on the Kunzel [26] algorithm for evaluating the packet delivery rate. MPR model has shown an increment of the PDR by a remarkable factor. This can be observed in the blue boxplots in Figure 11, as the original median of the Kunzel algorithm was approximately 96.3% and was then increased to 99.2% as the MPR method was used in the network. The median and the mean of the Kunzel original statics are identical; however, the MPR-based Kunzel showed a slight difference between these two parameters. However, it can be seen that the proposed MPR model has significantly contributed to enhancing the network reliability where the packed delivery ratio was increased, resulting in enriching the nodes with the data required to keep the IWSN running sufficiently and reliably.
Similarly, the packet delivery ratio of the QLRR [4] algorithm was evaluated over the original topology and MPR proposed topology. The result of the simulation can be observed in the green boxplots in Figure 11. The proposed MPR method has increased the rate of reliability when being simulated with the QLRR algorithm. The enhancement of reliability is achieved by increasing the packet delivery ratio, as shown in Figure 11. The improvement added to the network was significant when comparing the original PDR of the QLRR algorithm with MPR-based QLRR. An approximate PDR percentage of 4% was the enhancement added in the mean and median values. The PDR mean and median of QLRR statistical results are 94.8% and 95.2%, while the PDR mean and median of MPRQLRR are 99.2% and 99.5%, respectively.
In summary, the MPR model proposed in this study has improved the transmission reliability of the three utilized algorithms. When comparing the effectiveness of the MPR model in association with the state-of-the-art algorithms, it was found that MPRHan outperforms the other two algorithms by having the highest mean and median of PDR. On the other hand, the MPRQLRR showed a better performance than MPRKunzel in terms of mean and median values, as shown in Figure 11. In other words, the MPRKunzel algorithm has the worst performance, which recorded the lowest mean and median of 98.8% and 99.2%, respectively. This is because the Han algorithm builds graphs trying to reduce the number of hops from the gateway, which is easily achieved with the proposed MPR method.

PDR with Network Link Failures

Figure 12 depicts the boxplot of the PDR when random link failures are introduced at different links of the MPR model. It can be observed that the proposed model is robust where the PDR in all of the utilized algorithms was not very affected by the packet drop. When the response is compared with the condition of no packet drop (PD), the average and the mean of the MPRKunzel and MPRQLRR data is nearly the same. Despite the small effect due to the packet drop, the PDR of the WSAN over the proposed MPR model still outperforms the original algorithms shown in Figure 11 as discussed in Section 4.4.

4.5. Performance Assessments and Comparison

The performance assessment and comparison with the state-of-the-art are presented in Table 4. It presents the comparison of the proposed MPR method with the literature regarding their route construction objectives, constructed graphs and routes, the definition of a primary path for each node, and the performance metrics used in the analyses. Because battery-powered devices dominate IWSNs, most algorithms try to extend the lifetime of the network. The latency and use of communication resource reductions are based on the definition criterion of the main route, which uses the degree (distance in hops) from the gateway. The metrics of performance evaluation are packet delivery ratio, network lifetime, latency, reliability, and graphs’ average characteristics.

5. Conclusions

This article investigated industrial wireless mesh networks planning for featuring high reliability and low latency. In complying with WirelessHART network reliability requirements, we developed a multipath routing (MPR) model that builds three main pathways. Each path is composed of multiple nodes with a different number of hops. The MPR algorithm sets the priority of data transmission over the shortest path; however, the alternative paths are always there for tolerating any transmission errors. The MPR method was simulated with three different existing algorithms, where the simulations were conducted on a WirelessHART simulator considering IWSN applications. The results reveal significant reductions of the average network latency (ANL) in all algorithms as well as significant improvements of the expected network lifetime (ENL) and packet delivery ratio (PDR). Furthermore, the evaluation of MPR fault tolerance characteristics is done by introducing link failures to different links in the MPR model for random periods of time. The link failures are introduced to the network in the primary and alternative pathways. The method has demonstrated robustness, which showed a consistent performance that outperforms the original algorithms.

Author Contributions

Conceptualization, H.A.; methodology, H.A., F.A.H.; software, H.A.; validation, H.A., F.A.H., A.A., and I.I.; formal analysis, H.A., A.A., and I.I.; investigation, H.A., F.A.H.; resources, H.A., P.A.M.D.; data curation, H.A.; writing—original draft preparation, H.A.; writing—review and editing, F.A.H., A.A.A., and P.A.M.D.; visualization, A.A., I.I.; supervision, F.A.H.; project administration, F.A.H.; funding acquisition, A.A.A. All authors have read and agreed to the published version of the manuscript.

Funding

This research was funded by Universiti Teknologi PETRONAS, Yayasan UTP Fundamental Research Grant Scheme (YUTP) cost centers 015LC0-045 and 015LC0-140.

Institutional Review Board Statement

Not applicable.

Informed Consent Statement

Not applicable.

Data Availability Statement

Not applicable.

Acknowledgments

The authors would like to thank the Department of Electrical and Electronics Engineering, Universiti Teknologi PETRONAS for their support.

Conflicts of Interest

The authors declare no conflict of interest.

References

  1. Sha, M.; Gunatilaka, D.; Wu, C.; Lu, C. Empirical study and enhancements of industrial wireless sensor–actuator network protocols. IEEE Internet Things J. 2017, 4, 696–704. [Google Scholar] [CrossRef]
  2. Da Xu, L.; He, W.; Li, S. Internet of things in industries: A survey. IEEE Trans. Ind. Inform. 2014, 10, 2233–2243. [Google Scholar]
  3. Papan, J.; Segec, P.; Kvet, M. Enhanced Bit Repair IP Fast Reroute Mechanism for Rapid Network Recovery. Appl. Sci. 2021, 11, 3133. [Google Scholar] [CrossRef]
  4. Künzel, G.; Indrusiak, L.S.; Pereira, C.E. Latency and Lifetime Enhancements in Industrial Wireless Sensor Networks: A Q-Learning Approach for Graph Routing. IEEE Trans. Ind. Inform. 2020, 16, 5617–5625. [Google Scholar] [CrossRef]
  5. Winter, J.M.; Muller, I.; Soatti, G.; Savazzi, S.; Nicoli, M.; Becker, L.B.; Netto, J.C.; Pereira, C.E. Wireless coexistence and spectrum sensing in industrial Internet of Things: An experimental study. Int. J. Distrib. Sens. Netw. 2015, 11, 627083. [Google Scholar] [CrossRef]
  6. Niu, J.; Cheng, L.; Gu, Y.; Shu, L.; Das, S.K. R3E: Reliable reactive routing enhancement for wireless sensor networks. IEEE Trans. Ind. Inform. 2013, 10, 784–794. [Google Scholar] [CrossRef]
  7. Devan, P.A.M.; Hussin, F.A.B.; Ibrahim, R.; Bingi, K.; Abdulrab, H.Q. Fractional-Order Predictive PI Controller for Dead-Time Processes With Set-Point and Noise Filtering. IEEE Access 2020, 8, 183759–183773. [Google Scholar] [CrossRef]
  8. Nobre, M.; Silva, I.; Guedes, L.A. Routing and scheduling algorithms for WirelessHARTNetworks: A survey. Sensors 2015, 15, 9703–9740. [Google Scholar] [CrossRef] [Green Version]
  9. Vera-Pérez, J.; Silvestre-Blanes, J.; Sempere-Payá, V.; Cuesta-Frau, D. Multihop Latency Model for Industrial Wireless Sensor Networks Based on Interfering Nodes. Appl. Sci. 2021, 11, 8790. [Google Scholar] [CrossRef]
  10. Tilwari, V.; Dimyati, K.; Hindia, M.; Fattouh, A.; Amiri, I.S. Mobility, residual energy, and link quality aware multipath routing in MANETs with Q-learning algorithm. Appl. Sci. 2019, 9, 1582. [Google Scholar] [CrossRef] [Green Version]
  11. Han, Y.; Byun, H.; Zhang, L. Energy-Balanced Cluster-Routing Protocol Based on Particle Swarm Optimization with Five Mutation Operators for Wireless Sensor Networks. Sensors 2020, 20, 7217. [Google Scholar] [CrossRef]
  12. Devan, P.; Hussin, F.A.; Ibrahim, R.; Bingi, K.; Khanday, F.A. A Survey on the application of WirelessHART for industrial process monitoring and control. Sensors 2021, 21, 4951. [Google Scholar] [CrossRef]
  13. Ji, S.; Li, Q.; Cao, W.; Zhang, P.; Muccini, H. Quality Assurance Technologies of Big Data Applications: A Systematic Literature Review. Appl. Sci. 2020, 10, 8052. [Google Scholar] [CrossRef]
  14. Aljohani, S.L.; Alenazi, M.J. MPResiSDN: Multipath resilient routing scheme for SDN-enabled smart cities networks. Appl. Sci. 2021, 11, 1900. [Google Scholar] [CrossRef]
  15. Wu, Z.; Xiong, N.; Huang, Y.; Xu, D.; Hu, C. Optimizing the reliability and performance of service composition applications with fault tolerance in wireless sensor networks. Sensors 2015, 15, 28193–28223. [Google Scholar] [CrossRef] [Green Version]
  16. Zeng, Y.; Xu, L.; Chen, Z. Fault-tolerant algorithms for connectivity restoration in wireless sensor networks. Sensors 2016, 16, 3. [Google Scholar] [CrossRef] [Green Version]
  17. Hadjidj, A.; Bouabdallah, A.; Challal, Y. HDMRP: An efficient fault-tolerant multipath routing protocol for heterogeneous wireless sensor networks. In Proceedings of the International Conference on Heterogeneous Networking for Quality, Reliability, Security and Robustness, Huston, TX, USA, 17–19 November 2010; Springer: Berlin/Heidelberg, Germany, 2010; pp. 469–482. [Google Scholar]
  18. Al-Turjman, F. Price-based data delivery framework for dynamic and pervasive IoT. Pervasive Mob. Comput. 2017, 42, 299–316. [Google Scholar] [CrossRef]
  19. Hasan, M.Z.; Al-Rizzo, H.; Günay, M. Lifetime maximization by partitioning approach in wireless sensor networks. EURASIP J. Wirel. Commun. Netw. 2017, 2017, 1–18. [Google Scholar] [CrossRef] [Green Version]
  20. Al-Ariki, H.D.E.; Swamy, M.S. A survey and analysis of multipath routing protocols in wireless multimedia sensor networks. Wirel. Netw. 2017, 23, 1823–1835. [Google Scholar] [CrossRef]
  21. Ahad, A.; Tahir, M.; Sheikh, M.A.; Ahmed, K.I.; Mughees, A. An Intelligent Clustering-Based Routing Protocol (CRP-GR) for 5G-Based Smart Healthcare Using Game Theory and Reinforcement Learning. Appl. Sci. 2021, 11, 9993. [Google Scholar] [CrossRef]
  22. Ding, Y.; Chen, R.; Hao, K. A rule-driven multi-path routing algorithm with dynamic immune clustering for event-driven wireless sensor networks. Neurocomputing 2016, 203, 139–149. [Google Scholar] [CrossRef]
  23. Tang, L.; Lu, Z.; Fan, B. Energy efficient and reliable routing algorithm for wireless sensors networks. Appl. Sci. 2020, 10, 1885. [Google Scholar] [CrossRef] [Green Version]
  24. Zand, P.; Mathews, E.; Havinga, P.; Stojanovski, S.; Sisinni, E.; Ferrari, P. Implementation of wirelesshart in the ns-2 simulator and validation of its correctness. Sensors 2014, 14, 8633–8668. [Google Scholar] [CrossRef] [PubMed] [Green Version]
  25. Han, S.; Zhu, X.; Mok, A.K.; Chen, D.; Nixon, M. Reliable and real-time communication in industrial wireless mesh networks. In Proceedings of the 2011 17th IEEE Real-Time and Embedded Technology and Applications Symposium, Chicago, IL, USA, 11–14 April 2011; pp. 3–12. [Google Scholar]
  26. Künzel, G.; Cainelli, G.P.; Müller, I.; Pereira, C.E. Weight adjustments in a routing algorithm for wireless sensor and actuator networks using Q-learning. IFAC-PapersOnLine 2018, 51, 58–63. [Google Scholar] [CrossRef]
  27. Rahiminasab, A.; Tirandazi, P.; Ebadi, M.; Ahmadian, A.; Salimi, M. An energy-aware method for selecting cluster heads in wireless sensor networks. Appl. Sci. 2020, 10, 7886. [Google Scholar] [CrossRef]
  28. Shen, H.; Li, Z. A Kautz-Based Wireless Sensor and Actuator Network for Real-Time, Fault-Tolerant and Energy-Efficient Transmission. IEEE Trans. Mob. Comput. 2016, 15, 1–16. [Google Scholar] [CrossRef]
  29. Sun, X.; Chen, H.; Wu, X.; Yin, X.; Song, W. Opportunistic communications based on distributed width-controllable braided multipath routing in wireless sensor networks. Ad Hoc Netw. 2016, 36, 349–367. [Google Scholar] [CrossRef]
  30. Maimour, M.; Bidai, Z. A multipath prefix routing for wireless sensor networks. Wirel. Pers. Commun. 2016, 91, 313–343. [Google Scholar] [CrossRef] [Green Version]
  31. Bagci, H.; Korpeoglu, I.; Yazıcı, A. A Distributed Fault-Tolerant Topology Control Algorithm for Heterogeneous Wireless Sensor Networks. IEEE Trans. Parallel Distrib. Syst. 2015, 26, 914–923. [Google Scholar] [CrossRef]
  32. Deniz, F.; Bagci, H.; Korpeoglu, I.; Yazıcı, A. An adaptive, energy-aware and distributed fault-tolerant topology-control algorithm for heterogeneous wireless sensor networks. Ad Hoc Netw. 2016, 44, 104–117. [Google Scholar] [CrossRef] [Green Version]
  33. Munir, A.; Antoon, J.; Gordon-Ross, A. Modeling and analysis of fault detection and fault tolerance in wireless sensor networks. ACM Trans. Embed. Comput. Syst. (TECS) 2015, 14, 1–43. [Google Scholar] [CrossRef]
  34. Lee, S.; Younis, M.; Lee, M. Connectivity restoration in a partitioned wireless sensor network with assured fault tolerance. Ad Hoc Netw. 2015, 24, 1–19. [Google Scholar] [CrossRef]
  35. Shih, H.C.; Ho, J.H.; Liao, B.Y.; Pan, J.S. Fault node recovery algorithm for a wireless sensor network. IEEE Sens. J. 2013, 13, 2683–2689. [Google Scholar] [CrossRef]
  36. Park, P.; Ghadikolaei, H.S.; Fischione, C. Proactive fault-tolerant wireless mesh networks for mission-critical control systems. J. Netw. Comput. Appl. 2021, 186, 103082. [Google Scholar] [CrossRef]
  37. Bayou, L.; Espes, D.; Cuppens-Boulahia, N.; Cuppens, F. WirelessHART NetSIM: A WirelessHART SCADA-based wireless sensor networks simulator. In Security of Industrial Control Systems and Cyber Physical Systems; Springer: Berlin/Heidelberg, Germany, 2015; pp. 63–78. [Google Scholar]
  38. INETMANET Framework for OMNEST/OMNeT++ 4.0. Available online: https://github.com/inetmanet/inetmanet/ (accessed on 20 September 2021).
  39. Liu, Y.; Candell, R.; Lee, K.; Moayeri, N. A simulation framework for industrial wireless networks and process control systems. In Proceedings of the 2016 IEEE World Conference on Factory Communication Systems (WFCS), Aveiro, Portugal, 3–6 May 2016; pp. 1–11. [Google Scholar]
  40. Downs, J.J.; Vogel, E.F. A plant-wide industrial process control problem. Comput. Chem. Eng. 1993, 17, 245–255. [Google Scholar] [CrossRef]
  41. Liu, Y.; Candell, R.; Lee, K.; Moayeri, N. Tennessee Simulator Federated with OMNET++ Networking Model. 2016. Available online: https://github.com/usnistgov/tesim_omnetpp (accessed on 20 September 2021).
  42. Al-Yami, A.; Abu-Al-Saud, W.; Shahzad, F. Simulation of industrial wireless sensor network (IWSN) protocols. In Proceedings of the 2016 IEEE Conference on Computer Communications Workshops (INFOCOM WKSHPS), Cambridge, UK, 6–8 April 2016; pp. 527–533. [Google Scholar]
  43. Herrmann, M.J.; Messier, G.G. Cross-layer lifetime optimization for practical industrial wireless networks: A petroleum refinery case study. IEEE Trans. Ind. Inform. 2018, 14, 3559–3566. [Google Scholar] [CrossRef]
  44. Messier, G. ISA100.11a ns3 Simulation Code. 2018. Available online: https://github.com/ggmessier/ns3-isa100.11a/ (accessed on 26 February 2020).
  45. Avrora. Avrora–The AVR Simulation and Analysis Framework. Available online: http://compilers.cs.ucla.edu/avrora/ (accessed on 20 September 2021).
  46. Polley, J.; Blazakis, D.; McGee, J.; Rusk, D.; Baras, J.S. ATEMU: A fine-grained sensor network simulator. In Proceedings of the 2004 First Annual IEEE Communications Society Conference on Sensor and Ad Hoc Communications and Networks (IEEE SECON 2004), Santa Clara, CA, USA, 4–7 October 2004; pp. 145–152. [Google Scholar]
  47. Martinez, B.; Monton, M.; Vilajosana, I.; Prades, J.D. The power of models: Modeling power consumption for IoT devices. IEEE Sens. J. 2015, 15, 5777–5789. [Google Scholar] [CrossRef] [Green Version]
  48. Pagano, P.; Chitnis, M.; Lipari, G.; Nastasi, C.; Liang, Y. Simulating real-time aspects of wireless sensor networks. EURASIP J. Wirel. Commun. Netw. 2009, 2010, 1–19. [Google Scholar] [CrossRef] [Green Version]
  49. The Network Simulator–ns-2. Available online: https://www.isi.edu/nsnam/ns/ (accessed on 20 September 2021).
  50. Palopoli, L.; Lipari, G.; Abeni, L.; Di Natale, M.; Ancilotti, P.; Conticelli, F. A tool for simulation and fast prototyping of embedded control systems. In Proceedings of the 2001 ACM SIGPLAN Workshop on Optimization of Middleware and Distributed Systems, New York, NY, USA, 19 June 2001; pp. 73–81. [Google Scholar]
  51. Padrah, Z.; Pastrav, A.; Palade, T.; Ratiu, O.; Puschita, E. Development and Validation of an ISA100. 11a Simulation Model for Accurate Industrial WSN Planning and Deployment. Sensors 2021, 21, 3600. [Google Scholar] [CrossRef]
  52. Chen, Q.; Zhang, X.J.; Lim, W.L.; Kwok, Y.S.; Sun, S. High Reliability, Low Latency and Cost Effective Network Planning for Industrial Wireless Mesh Networks. IEEE/ACM Trans. Netw. 2019, 27, 2354–2362. [Google Scholar] [CrossRef]
  53. Savazzi, S.; de Souza, R.H.; Becker, L.B. Wireless network planning and optimization in oil and gas refineries. In Proceedings of the 2013 III Brazilian Symposium on Computing Systems Engineering, Niteroi, Brazil, 4–8 December 2013; pp. 29–34. [Google Scholar]
  54. Li, W.; Zhang, X.; Tan, W.; Zhou, X. H-tossim: Extending tossim with physical nodes. Wirel. Sens. Netw. 2009, 1, 324. [Google Scholar] [CrossRef] [Green Version]
  55. Alonso-Eugenio, V.; Guerra, V.; Zazo, S.; Perez-Alvarez, I. Software-in-loop simulation environment for electromagnetic underwater wireless sensor networks over STANAG 5066 protocol. Electronics 2020, 9, 1611. [Google Scholar] [CrossRef]
  56. Clavijo-Rodriguez, A.; Alonso-Eugenio, V.; Zazo, S.; Perez-Alvarez, I. Software-in-loop simulation of an underwater wireless sensor network for monitoring seawater quality: Parameter selection and performance validation. Sensors 2021, 21, 966. [Google Scholar] [CrossRef] [PubMed]
  57. Boehm, S.; Koenig, H. SEmulate: Seamless network protocol simulation and radio channel emulation for wireless sensor networks. In Proceedings of the 2019 15th Annual Conference on Wireless On-demand Network Systems and Services (WONS), Wengen, Switzerland, 22–24 January 2019; pp. 111–118. [Google Scholar]
  58. Dunkels, A.; Gronvall, B.; Voigt, T. Contiki-a lightweight and flexible operating system for tiny networked sensors. In Proceedings of the 29th Annual IEEE International Conference on Local Computer Networks, Tampa, FL, USA, 16–18 November 2004; pp. 455–462. [Google Scholar]
  59. Liu, W.; Xia, Y.; Zheng, D.; Xie, J.; Luo, R.; Hu, S. Environmental impacts on hardware-based link quality estimators in wireless sensor networks. Sensors 2020, 20, 5327. [Google Scholar] [CrossRef]
  60. Künzel, G.; Cainelli, G.P.; Pereira, C.E. A weighted broadcast routing algorithm for wirelesshart networks. In Proceedings of the 2017 VII Brazilian Symposium on Computing Systems Engineering (SBESC), Curitiba, Brazil, 6–10 November 2017; pp. 187–192. [Google Scholar]
Figure 1. WirelessHART mesh network structure.
Applsci 12 00544 g001
Figure 2. An example of the broadcast graph ( G B ) (a), uplink graph ( G U ) (b), and downlink graph ( G d ) (c).
Applsci 12 00544 g002
Figure 3. (a) Original layout of factory, (b) Phase 1: forming multipath triangular cells grid.
Applsci 12 00544 g003
Figure 4. (a) Phase 2: place access point, (b) Phase 3: plan routes and place the routers.
Applsci 12 00544 g004
Figure 5. Proposed network structure of the deployment.
Applsci 12 00544 g005
Figure 6. Average Network Latency (ANL) performance comparison.
Applsci 12 00544 g006
Figure 7. ANL with and without packet drop.
Applsci 12 00544 g007
Figure 8. Expected network lifetime (ENL) performance comparison.
Applsci 12 00544 g008
Figure 9. ENL with and without packet drop.
Applsci 12 00544 g009
Figure 10. Energy consumption performance comparison.
Applsci 12 00544 g010
Figure 11. Packet delivery ratio (PDR) performance comparison.
Applsci 12 00544 g011
Figure 12. Packet delivery ratio (PDR) with and without packet drop.
Applsci 12 00544 g012
Table 1. Existing IWSN simulation Methods.
Reference of IWSN SimulatorObjective of WorkWireless StandardExternal Interface Implementation, Network Management, Communication StackMetrics of Evaluation
[37]SecurityWirelessHARTNetwork Manager, Complete Stack of WirelessHARTRate of successful transmitted data collection at the presence of security attack
[39]Link failure impact on industrial processWirelessHARTNetwork Manager with fixed allocated resource, full stack of WirelessHART, the challenge problem known as Tennessee Eastman Process ControlImperfect wireless links with process parameter variation
[42]IWSN protocols simulation ComparisonZigBee, WirelessHART ISA100.11aMAC and PHY layers, basic layer applicationRF signal level, energy consumption, communication statistics
[43]Energy consumption based-WSN OptimizationWirelessHART, ISA100.11aMAC, PHY layersEnergy consumption based-Network lifetime
[47]Energy consumption based mathematical modelIEEE 802.15.4Not applicableConsumption rate of energy
[48]Load processing impact on communicationIEEE 802.15.4PAN coordinator and IEEE 802.15.4 stackNetwork delay and CPU load performance
[53]Discussing Signal quality on the deployment of IWSN.WirelessHART, ISA100.11aNot applicableQuality of RF signal
[24]WirelessHART network simulationWirelessHARTNetwork Manager, full WirelessHART stackEnergy consumption, reliability, PDR, management overhead
[54]Testbed based HIL simulationIEEE 802.15.4Network management, TinyOS stackConsumption of energy
[57]Hardware and simulation integration at RF levelIEEE 802.15.4Application model, MAC, Physical layersStrength of signal
The proposed fault tolerance based multipath routingImplementation of Multipath routing on WirelessHART simulatorWirelessHARTExisting Network Manager, full WirelessHART stackAverage latency, lifetime, packet delivery ratio
Table 2. Variables and symbols notations.
GGraph routing
VSet of Nodes
ESet of Edges
GWGateway
A 1 , A 2 Access Points
AP A 1 , A 2
TEdge length of each triangular cell
N R Routers subset
N D Field Devices
N V Number of Vertices
X i , Y i Position of field device
H ( a , b ) Shortest number of hops between nodes a and b
Table 3. Parameters of NS-2 simulator.
ParameterValue
Number of routersGateway, 2 APs
Number of nodes8
Simulation area 20 × 20
Frequency band and channel 2.4   GHz ,   11 26 channels
Data rate 250 kb / s
Minimum superframe size (simulated network)200 slot
Sensing range 20 m
Path loss exponent 2.0
Radio propagation modelShadowing model
Battery Power3.5 V, 17 Ah
Reference distance 1.0 m
Mac retransmission3
Application traffic model2
Table 4. Performance comparison of MPR with literature.
MethodRoutesObjectivesPerformance MetricsPDR%
Han [25]Uplink, downlink, broadcastLifetime, resource usageLatency; reliable nodes percentage; successful route construction ratio.95.5
Kunzel [26]BroadcastLifetime, transmission errorsGraph’s average and maximum number of hops; battery-powered nodes’ count; percentage of routing nodes; percentage of reliable node percentage.96.3
QLRR [4]UplinkReliability, network performanceAverage network latency (ANL); expected network lifetime (ENL); percentage of routing nodes.95.4
The Proposed MethodMultipathReliability, network latency, network lifetimePacked delivery rate; energy consumption-based network lifetime; network performance based on average network latency.99.5
Publisher’s Note: MDPI stays neutral with regard to jurisdictional claims in published maps and institutional affiliations.

