Article

Failure Assessment of Embankment Dam Elements: Case Study of the Pirot Reservoir System

1
Faculty of Engineering, University of Kragujevac, 34000 Kragujevac, Serbia
2
Jaroslav Černi Water Institute, 11226 Beograd, Serbia
3
Faculty of Civil Engineering, University of Belgrade, 11000 Belgrade, Serbia
*
Author to whom correspondence should be addressed.
Appl. Sci. 2022, 12(2), 558; https://doi.org/10.3390/app12020558
Submission received: 3 December 2021 / Revised: 21 December 2021 / Accepted: 30 December 2021 / Published: 6 January 2022

Abstract

:
The paper presents a functionality investigation of the key dam elements based on finite element analysis. A detailed analysis of filtration processes, dam strength, and the surrounding rock mass was conducted. Dam elements whose potential damage could jeopardize the normal functioning of the embankment dam have been identified. A particular emphasis was placed on the analysis of dam elements that have been identified as weak points. A numerical analysis of the impact of individual grout curtain zone failure on leakage under the dam body, a strength analysis of the overflow section, as well as the analysis of the slope stability that can compromise the functioning of the spillway have been performed. To analyze the partial stability of individual structural elements, a new measure of local stability was introduced as the remaining load-bearing capacity. As a case study, the Zavoj dam, which is a part of the Pirot reservoir system in the Republic of Serbia, was used. Investigation revealed that local damage to the grout curtain will not significantly increase leakage under the dam body, the overflow section is one of the most robust elements of the dam, but the slope above the spillway can compromise the functioning of the overflow and thus the safety of the entire dam. Based on the analysis of the results of the remaining load-bearing capacity, the dependence of the spillway capacity on earthquake intensity has been defined. The established relationship represents a surrogate model for further assessment of dynamic resilience of the complex multipurpose reservoir system, within the scope of the advanced reservoir system management.

1. Introduction

Dams are basic structures for water resources management, from irrigation, electricity production, water supply, to flood control, and more [1]. However, partial damage or complete collapse of a dam can cause catastrophic consequences, from huge costs, to the worst case, loss of life and property. Overflow, internal erosion, slope instability, and earthquakes are the most common causes of dam failure [2]. During the construction of an embankment dam, there are frequent variations in the characteristics of the material within the quasi-homogeneous zone, which increases the probability of material degradation in some parts of the structure and thus greater water flow through this zone [3]. Leakage through the body of the dam or foundation leads to the occurrence of internal erosion, which causes the appearance of piping, eventually leading to the collapse of the dam [4,5]. In the analysis of slope stability (on the dam body or on the surrounding rock mass), a deterministic approach is most often used, whereby the assessment of the global safety factor is performed for specific values of material parameters. However, in this way, the initial variations in material characteristics or those caused by water flow through the ground are not considered, so the safety factor calculated in this way is not completely reliable and does not fully represent the safety of the object [6]. The concept of global stability of the geotechnical structures is commonly used in the analysis of the safety of complex structures by determining the global safety factor [7,8,9,10]. However, the conclusion that the structure is stable under the considered acting loads does not always mean the structure is safe, especially when it comes to structures such as dams and reservoirs with accompanying elements [11,12,13]. For this reason, in addition to the analysis of the global safety factor, it is necessary to conduct analyses of the impact of damage that in the short term does not endanger the stability of the structure, but in the long term can affect its stability. In order to overcome the previously noted shortcomings, authors propose the principle of partial stability assessment by introducing a new local stability measure called remaining load-bearing capacity and implemented in the PAK software package [14], used for the analysis of filtration and strength of geotechnical structures. This new measure provides an overview of zones whose partial stability is potentially compromised, regardless of the fact that the global stability of the facility is not impaired. This is especially important in complex systems such as a multi-purpose reservoir, where a local loss of stability not compromising the global stability of the facility may activate other mechanisms that would compromise the stability of the entire facility. To conduct this analysis, it is necessary to identify the critical (weak) elements of the system and then to analyze their impact on the functionality of the system for hypothetical scenarios and thus on the long-term safety and operation of the system. In this analysis, the finite-element based method [14,15] was used to simulate the filtration processes and stress-strain behavior of the dam and the surrounding rock mass. The global short-term stability of the structure was analyzed using the strength reduction method [16,17]. The analysis used the case study of the Zavoj dam and accumulation near the city of Pirot in the Republic of Serbia [18,19]. The effect of an earthquake, used as a critical load, is modelled by applying the maximum value of seismic acceleration at the dam site in two orthogonal directions, for a 1000 year return period [20]. Occurrence of earthquakes in southeast Europe is causing growing concern to the operators of the large complex reservoir systems, as in the last decade multiple significant earthquakes were recorded: Serbia 2010—5.5 moment magnitude scale (MMS) [21], Albania 2019—6.4 MMS [22], Croatia 2020—6.9 MMS [23], etc. Apart from the apparent risk to the safety of the structures, significant risks related to the reduced functionality of these systems need to be addressed and analyzed in detail. In the case of the Pirot reservoir, three key elements whose damage, induced by earthquake, affects the functionality of the system have been identified. The results of the functionality analysis of the individual elements of this system represent the input data in the analysis of system dynamics whose implementation was carried out by applying the concept of dynamic resilience [24,25].
The paper is structured in the following manner: first, in the Theoretical Basis section, recapitulation is provided for the equations governing filtration, strength analysis, and shear stress reduction. Additionally, the concept of the remaining load-bearing capacity is introduced and explained in detail. The section About Zavoj Dam covers basic technical data and description of the Zavoj Dam as a part of the Pirot complex reservoir system. It is followed by Section 4, where the basic information about the finite element model is provided, along with the subsections describing identification of the weak points in the structure, used material parameters, loads, and boundary conditions. Section 4 concludes with the description of the three analyzed scenarios. Section 5 first covers the results of the filtration and stability analysis and then presents more details for the investigation of the impacts in three chosen scenarios. The section is concluded with the derivation of the surrogate model for further system dynamics analysis. Finally, general and case-specific conclusions are presented.

2. Theoretical Basis

2.1. Governing Equations of Filtration

Flow through a porous medium is described by Darcy’s law, which in the case of a three-dimensional continuum [26,27,28] is described using the following equation:
q = k i ,
where k represents a permeability matrix and i is a hydraulic gradient:
i = φ .
Total potential φ is defined as:
φ = p γ + h ,
where p represents the pore pressure, γ is the unit weight of fluid (unit weight of water), and h is the distance from the reference level.
According to the continuity equation and Darcy’s law (1), a hydrodynamic equation for steady state flow [29] is formulated as:
( k φ ) = Q ,
where Q is the flow generated per unit volume. Boundary conditions in solving the flow problem through porous media can be either specified as potential or specified volumetric flux.

2.2. Governing Equation of Strength Analysis

Analysis of strength determines the displacement, stress, strain, and other relevant variables introduced as internal variables [15,29]. In static conditions, the following equilibrium must be fulfilled at each material point:
· σ + F V = 0 ,
where σ represents the stress tensor, whereas F V is the vector of body forces. Boundary conditions can be specified as displacements or specified load (force or pressure).
Using equilibrium Equation (5) and corresponding boundary conditions [15], a virtual work principle representing a basic equilibrium equation in mechanic of deformable body can be represented as:
V σ δ ε d V = V F V δ u d V + S σ F S δ u d S .
where δ ε represents virtual strain corresponding to virtual displacement δ u , and F S is the vector of surface forces.
In the stress-strain analysis of the dam, the Mohr–Coulomb constitutive model was used for simulation of mechanical behavior of the dam and surrounding rock mass [30,31]. Yield surface of the used constitutive model is the function of stress state and can be formulated using stress invariants as:
f = I 1 3 sin ϕ + J 2 D ( cos θ 1 3 sin θ sin ϕ ) c cos ϕ ,
where I 1 and J 2 D are the first stress invariant and second deviatoric stress invariant, respectively, θ represents Lode’s angle, c is cohesion of the material, and ϕ is the internal friction angle of the material. In the case when the stress point reaches the yield surface (material failure), the value of the yield function (7) is equal to zero. This condition can be used to determine the maximum value (failure) of the second deviatoric stress invariant J 2 D .

2.3. Shear Strength Reduction

The shear strength reduction method of is one of the most commonly used methods for determining the safety factor of geotechnical structures. Global safety factor (Fs) of the object represents a ratio of available shear strength of the material and shear stresses occurring in a material [32,33]. In other words, structure instability occurs when the shear stress τ in the material exceeds the available shear strength of the material τ f , or:
F s = τ f τ .
The global safety factor of the structure represents the maximum value of the shear strength reduction factor at which the structure is stable. In the numerical sense, the structure is stable if there is a convergence of numerical solutions and/or if the displacement increment is not too large.

2.4. Remaining Load-Bearing Capacity
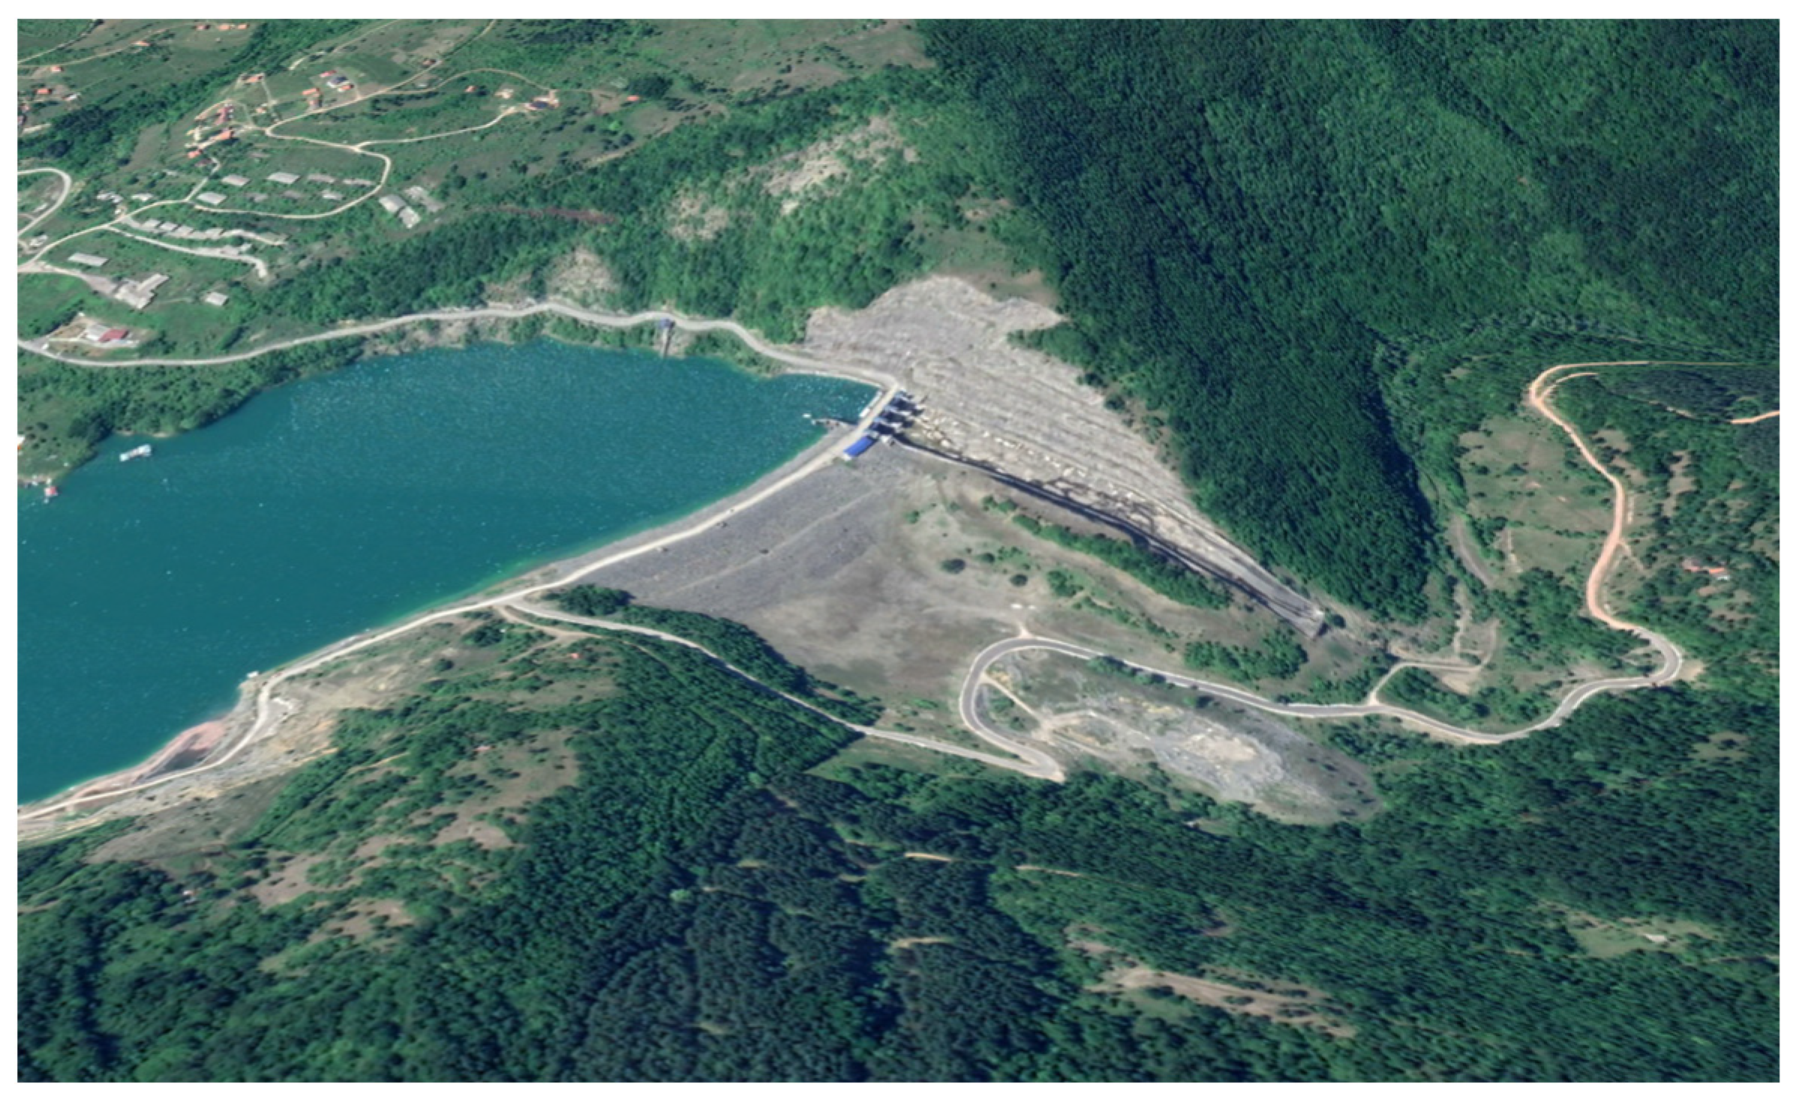
In order to analyze the load-bearing capacity of the structure and obtain the remaining load-bearing capacity at each integration point of the model, a new vector is formed. This new vector represents a measure of the distance of the stress point from the failure surface for the same value of the first stress invariant (Figure 1). The remaining load-bearing capacity of the material is expressed in relation to limit value of the stress at which fracture occurs. In other words, this quantity shows the distribution of the unused strength of the material.
The residual load-bearing capacity (in percentage) can be calculated at each finite element integration point, independent of the constitutive model, according to the following equation:
R P = ( 1 q q max ) · 100 % .
In Equation (9), the quantity q max represents the distance of the failure surface for a specific stress state (for a known value of the first stress invariant I 1 ). The quantity q represents the distance of the stress point for the same stress state (same value of I 1 ).
The distance to the failure surface q max , for a specific stress state, can be calculated by using the second invariant of deviatoric stress:
q max = 3 J 2 D .
The value of the second invariant of deviatoric stress J 2 D is calculated using the failure surface equation of the corresponding constitutive model. In the case of the Mohr–Coulomb constitutive model, which was used in the analysis of stability in this paper, the value of the second invariant of deviatoric stress, for the specific stress state can be calculated using (7), as:
J 2 D = c cos ϕ 1 3 I 1 sin ϕ cos θ 1 3 sin θ sin ϕ .
The distance to the stress point q can also be calculated by applying the second invariant of deviatoric stress [34] according to:
q = 3 J 2 D * ,
where the second invariant of deviatoric stress is calculated as:
J 2 D * = I 2 + 1 3 I 1 2 .
In Equation (13) the quantities I 1 and I 2 represent the first and second stress invariants, respectively. These stress invariants [29,35] were calculated for the current stress state according to the expressions:
I 1 = σ x + σ y + σ z ,
I 2 = ( σ x σ y + σ y σ z + σ z σ x ) + σ x y 2 + σ y z 2 + σ z x 2 .
By substituting relations (10)–(15) into expression (9), the residual load-bearing capacity at each integration point of the finite element is calculated and the field of the remaining load-bearing capacity in the entire structure is formed.

3. About Zavoj Dam

The Zavoj dam and reservoir on the Visočica river are located 13 km northeast of Pirot city in the Republic of Serbia. The construction of the Zavoj dam began in 1983 and was completed in 1989. The main purpose of the accumulation is to provide water for the production of electricity in HPP Pirot. In addition to this primary purpose, the Zavoj reservoir serves to accept the flood wave and reduce sediments in the valley of the Južna and Velika Morava river, water supply, and more [18,19].
The Zavoj dam is a rockfill dam with an upstream and downstream support body made of compacted stone embankment, an upstream sloping clay core, and corresponding filter layers between the clay core and the stone embankment (Figure 2).
Basic characteristics of the dam:
  • Dam crest elevation: 617.5 m asl,
  • Maximum water level: 615.9 m asl,
  • Operating water level: 612.5 m asl,
  • Minimum operating level: 568.0 m asl,
  • Elevation of the dam foundation: 531.5 m asl,
  • Length of the dam in the crest: 250.0 m,
  • Width of the dam in the crest: 10.0 m,
  • Spillway gates 3 m × 9.0 m.
The dam body is created in accordance with Figure 2 and consists of seven different materials. The surrounding rock mass consists of alternating layers of bank sandstones and sandy clays. However, due to the lack of data on the distribution of quasi-homogeneous zones, here it was assumed that the surrounding rock mass is homogeneous. A photo of the Zavoj dam with its surroundings is shown in Figure 3.
The overflow section of the dam is an open channel spillway and is located on the left side of the dam. The spillway crest is at 606.0 m above sea level. The spillway has three gates, 9 m wide and 10.2 m high. The width of the pillars between the overflow fields is 2.5 m. The bridge that connects the dam with the left bank crosses the spillway gate section. The spillway is located in a deep cut, with a slope of 3:1, has trapezoidal cross-section, and is 25 m wide and 300 m long. At the end of the spillway there is a sky-jump bucket. All these structure elements are included in the developed finite element model of the dam with the surrounding rock-mass.

4. Numerical Model of the Zavoj Dam

4.1. Finite Element Model

For developing a 3D model of the Zavoj dam, the available 2D drawings [36] were used as the base. The created 3D model was the basis for developing the finite element model of the dam and surrounding rock mass using Femap program [37]. The model was developed on the basis of geometry, engineering-geological structure of the terrain, and exploitation conditions in accordance with the requirements of numerical solvers. Numerical analyses of filtration processes and strength were performed using the software package PAK [14] in which the methods presented in the Theoretical Basis section were implemented.
The boundaries of the finite element model have been moved further from the dam structure (about 3.5 and 1.5 times the dam height away from the dam body) in order to reduce the influence of boundary conditions on the numerical results of filtration and strength analysis (Figure 4).
To create the finite element model of the dam with the surrounding rock mass, tetrahedral finite elements with midside nodes (10-node per finite element) were used. The developed model of the dam consists of approximately 98,000 finite elements and about 140,000 nodes. During the development of the numerical model, special attention was paid to the detailed modeling of the dam structure with collapsing elements. The following groups of structural elements were formed, representing quasi-homogeneous zones:
  • Dam body:
    Clay core,
    Multilayer sand filters,
    Upstream dam body,
    Downstream dam body,
  • Grouting curtain,
  • Concrete spillway,
  • Surrounding rock mass.

4.2. Identification of the Structurally Critical (Weak) Elements

In order to conduct a numerical analysis of the impact of damage to individual dam elements on the functioning of a complex multi-purpose reseroir system, the identification of the potentially weak structure elements was performed. As structural elements whose potential loss of functionality would affect the operation of this multipurpose system, the impact of damage to the grout curtain on leakage under the dam, damage to the overflow zone, as well as damage to the rapids was analyzed. For numerical analysis of hypothetical scenarios such as loss of water resistance function of the grout curtain, this volume is divided into six regions, so it is possible to independently manage the material parameters, i.e., filtration coefficients (Figure 5).
By changing the coefficients of filtration, it is possible to establish the dependence of the amount of water that leaks under the dam body as a function of reservoir water levels and the damaged zone of the grout curtain.
In the finite element model, the overflow section and spillway were modeled in detail (Figure 6). The strength analysis of the overflow gates zone should provide an answer as to whether these parts of the structure can be damaged by the seismic loads and jeopardize the functioning of segment gates. If there is a possibility of such damage, its impact on the function of the elements for water evacuation will be analyzed.
In addition to exceeding the strength of the concrete overflow under the acting of seismic load, the functioning of these elements may be endangered by the total or partial loss of stability of the slope above the spillway. Loss of stability of this part of the structure could cause a reduction in the overflow capacity, which would jeopardize the normal functioning of the dam and lead to its compromised stability.

4.3. Material Properties

The main goal of numerical simulations conducted within this paper is to verify the proposed methodology for the analysis of the damage impact to individual parts of the dam. For that reason, the calibration of material parameters was not performed, but they were taken from the literature [38]. The adopted material parameters used in numerical simulations of filtration and stress-strain processes are shown in Table 1. The names of the materials in the Table 1 are in accordance with the material names defined in Figure 2.
In order to analyze the impact of the loss of water resistance function of the grout curtain parts on the total flow through the curtain, numerical simulation of filtration processes with local increase of the filtration coefficient of individual regions was performed. The values of the filtration coefficients in individual regions (r1 to r6 in Figure 5) have been increased [39] thousands of times (from 1 × 10⁻⁸ to 1 × 10⁻²).

4.4. Loads and Boundary Conditions

The boundary conditions for numerical analyses correspond to the natural boundary conditions of the dam, with the application of hypothetical scenarios that can occur during dam exploitation. The boundary conditions of filtration analyses are presented by total potential: all surfaces affected by reservoir water have the total potential corresponding to the reservoir water level, and all surfaces affected by downstream water have a total potential corresponding to the water level in the river just below the dam.
Boundary conditions in numerical analysis of strength are given by displacements: the translation of nodes belonging to the sides of the model are fixed in directions perpendicular to the surface, whereas the translation of the nodes on the bottom side of the model are fixed in all directions (natural boundary conditions). Hydrostatic pressure corresponding to the water depth are applied on all surfaces of the model that are below the water level.

4.5. Functional Assessment of Dam Elements

The presented analysis is a part of broader research conducted within the consideration of the integral function ability of a multipurpose reservoir system. Numerical assessment of partial stability of the dam elements and the surrounding rock mass identified key elements of the structure whose potential failure or loss of stability could affect the normal functioning of this system. The analysis identified the following scenarios and their failure mechanisms:
  • Scenario 1: Damage to the grout curtain—loss of water resistance function due to effect of seismic loads;
  • Scenario 2: Damage to the overflow section with sluice gates—functionality can be reduced due to occurrence of seismic loads;
  • Scenario 3: Damage to the slope above the spillway chute—slope may lose stability as a result of seismic loads, reduce the capacity of the spillway, and prevent evacuation of water at high levels in the reservoir.
As noted above, the load scenario used in all conducted analyses is the effect of seismic loads. Seismic load was applied using seismic acceleration in two directions, independently: in the water flow direction and in the dam axis direction.
For all conducted analyses of stability, the remaining load-bearing capacity was calculated according to the theory presented in the previous section. In the conducted analysis, it was adopted that in all finite elements in which the bearing capacity is less than 2.5%, there is a high possibility of local loss of stability and collapse. This is especially important in areas where the loss of local stability would jeopardize the functioning of other elements of the system. One of such elements is the spillway. The spillway was divided lengthwise into ten parts, so that the length of one segment approximately corresponds to the width of the spillway section, as shown in Figure 7. The volume of the slope above the spillway was divided in the same way: one segment of the rock mass above the spillway corresponds to one zone of the spillway. The volume of rock mass elements in which the remaining load-bearing capacity is below the adopted limit is compared with the volume of the corresponding spillway segment. The ratio of the volume of the spillway segment and the volume of the finite elements of the slope that have lost load-bearing capacity is presented as the degree of functionality reduction of the spillway segment, accordingly, the spillway functionality of the segment was calculated as:
C i = ( 1 V i , s l V i , s w ) 100 % ,
where C i represents capacity of the ith segment of the spillway, V i , s l is the volume of finite elements of the ith segment with remaining load-bearing capacity less than 2.5%, and V i , s w is the volume of the ith segment of the spillway. The effective capacity of the entire spillway C represents the minimum value of the capacity of any spillway segment.

5. Results and Discussion

The results of numerical analyses of filtration and strength are presented below. The results of the filtration for the case of dam operation without damage are shown and then the results of the analysis with grout curtain damage. Within the strength analysis, the results of the seismic load effect on the dam are presented and then the results of the seismic load impact on the overflow section and spillway.

5.1. Analysis of Filtration

Within the conducted numerical analyses of filtration on the dam and the surrounding rock mass, for different reservoir water levels, fields of filtration quantities were obtained: total potential, velocity gradient, pore pressure, depth of water, and more. In addition to the fields above, the filtration forces necessary for the analysis of stability were calculated. Total potential for different reservoir water levels in case of dam normal operation is shown in Figure 8.
The presented fields of physical quantities are calculated under steady state flow conditions, i.e., they do not consider rapid changes of the reservoir water level.

5.2. Analysis of Stability

The results of the stability analysis of the dam exposed to seismic loading are presented below. The results are, as noted earlier, shown for the case of seismic acceleration in two directions: direction of water flow and the direction of the dam axis.

5.2.1. Seismic Load in the Dam Axis Direction

In the case of the seismic loading in the dam axis direction, the field of total displacement, plastic strain (Figure 9), as well as the fields of remaining load-bearing capacity are shown later. From the presented results for specific load case, it can be seen that the maximum displacement occurs in the middle of the dam crest. In contrast to displacement, highest values of plastic strain occur in the clay core, as well as in the sides of the dam, on the upstream and downstream supporting dam body, and at the junction of the dam and the rock mass.
The reason for such response is the difference in the stiffness of the dam body material in relation to the rock mass, which is especially emphasized during seismic acceleration.

5.2.2. Seismic Load in the Water Flow Direction

In the case of seismic loading in the water flow direction, the field of total displacement, plastic strain (Figure 10), and the field of remaining load-bearing capacity are shown later. As in the case of seismic loading in the dam axis direction, the maximum value of displacement occurs in the dam crest, whereas the maximum values of plastic strain occur in the clay core. The value of plastic strain that occurs in the sides of the dam is lower than in the previous case.
This distribution of plastic strain is expected because the clay core is the material with the lowest strength in the model.

5.3. Hypothetical Scenarios Results

5.3.1. Damage of Grout Curtain (Scenario 1)

The results of the filtration analysis in case of damage of the grout curtain for different reservoir water levels are shown in Figure 11. Grout curtain damages are, as previously noted, presented by increasing the filtration coefficient of the corresponding zone. Results shown in Figure 11 show the filtration rates through the grout curtain in case of maximum reservoir water level.
From the presented results, it can be seen that in case of grout curtain damage, there are multiple increases in the filtration rates. This conclusion has a significant impact on the occurrence of soil erosion in the layers below the dam body, which can affect the long-term safety of the entire structure. Regarding the analysis of the total flow through the grout curtain for different reservoir water levels and in the case of individual zone damage of the grout curtain, the results are shown in Figure 12.
It can be seen that the damage to some regions has a smaller impact on the change in the total flow through the grout curtain. This primarily refers to the zones of the grout curtain, which are located at higher altitudes, on the left and right side of the dam body (regions 1 and 6 in Figure 5).
Potential damage to regions 2 and 5 (Figure 5) has the greatest impact on increasing the total flow through the grout curtain. The impact of the damage on the total flow through the grout curtain decreases with the damage to the curtain regions located in the deeper layers of the rock mass (regions 3 and 4 in Figure 5). This response can be explained by the fact that zones 1 and 6 are located at high altitudes and almost no water reaches them, i.e., they are affected by upper water with low hydrostatic pressure. Zones 3 and 4 are located in the deeper layers of the rock mass below the dam, nestled between two zones with low permeability, so such a rock mass reduced the amount of water that reaches the grout curtain. Leakage through the grout curtain ranges from 2 × 10⁻⁴ m3/s to 7.6 × 10⁻⁴ m3/s, which is a small quantity in relation to the average annual flow of the Visočica river. However, damage to the grout curtain increases the possibility of local erosion, which can have a progressive character and endanger the safety of the facility for a longer period of time. The fact that water losses through the grout curtain represent a loss of energy, and thus a financial loss, which is not insignificant, cannot be ignored either.

5.3.2. Overflow Strength Analysis (Scenario 2)

In case of seismic load in the direction of dam axis, from the displacement field of the overflow section, as well as remaining load-bearing capacity field of the overflow section (Figure 13), it can be concluded that there is no real possibility of damage in this part of the structure.
The overflow section represents a very robust part of the structure, and there will be no major relative displacement of the overflow side walls, but only translation of the entire section. This displacement cannot jeopardize the operation of the overflow shutter. Therefore, this part of the structure is not endangered under extreme loads such as an earthquake.
In case of a seismic load in the direction of water flow, the overflow section is also not endangered. This is concluded on the basis of small values of relative displacement, as well as large values of the remaining load-bearing capacity of this part of the structure for the considered load case (Figure 14).

5.3.3. Analysis of Spillway Functionality (Scenario 3)

Regarding the remaining load-bearing capacity field used to assess the partial stability of the structure parts, it can be seen that in case of seismic acceleration in the dam axis direction, this quantity has the lowest value at the junction of the dam and the rock mass on the left side of the structure (Figure 15a). This is expected because the maximum values of plastic strain occur at the same part. Additionally noted and important for the analysis of functionality of the overflow section, is that on the slope located just above the overflow, there is a significant zone where the remaining load-bearing capacity is almost consumed, along the entire length of the overflow (Figure 15b). As the plastic strain in this part of the structure does not have significant values compared to the values in the dam body, it is likely that for the considered load case there will be no loss of global slope stability. However, there is a real possibility of a partial loss of stability of the slope under the effect of seismic loading, which would lead to the collapse of part of the slope and reduce the capacity of the spillway.
In the case of seismic load in the water flow direction, the remaining load-bearing capacity is almost non-existent in the clay core, to the left and right of the dam, as well as on the slope in the rock mass upstream of the dam (Figure 16a). As in the previous load case, the remaining load-bearing capacity is significantly reduced on the slope just above the spillway (Figure 16b). Plastic strain in this area is relatively small, so there will be no loss of global stability of this part. However, there is a real possibility of local instability, which would cause a part of the slope to collapse into the spillway and reduce its functionality.
Such local instability can have serious consequences, as such a scenario could lead to water overflowing over the spillway walls, which would lead to erosion of the slope below the spillway and loss of global stability of the facility and uncontrolled release of water from the reservoir.
The analysis of the influence of seismic load intensity on the spillway capacity reduction was performed for different values of seismic acceleration. The results of this analysis are presented as the dependence of the spillway capacity on the magnitude of the seismic acceleration, which is shown in Figure 17 for two seismic loading directions.
Based on the dependence of the spillway capacity on the value of seismic acceleration in two orthogonal directions, the effective capacity was calculated, so the capacity for the worst case was used. The dependence of the effective spillway capacity on the seismic acceleration value is shown in Figure 18.
The dependence formed in this way can be approximated by a third-degree nonlinear equation:
C = 1 + 0.0529 a + 0.0843 a 2 0.7087 a 3 ,
where C represents the spillway capacity, and the quantity a represents the normalized value of the maximum seismic acceleration (from 0 to 1). This approximation (red line in Figure 18) represents a surrogate model of the FEM model behavior, which can be used in the assessment of dynamic resilience of the analyzed multipurpose reservoir system.
Using the proposed procedure, the partial stability of the object is analyzed for load intensities (in this case earthquakes) that do not endanger the global stability of the object, but can compromise its long-term stability. Analysis of filtration provides information on the location of the grout curtain, whose damage would considerably increase the water flow under the dam body. It also provides information on which degradation would be most threatening to the long-term stability of the dam due to erosion caused by large velocity gradients.
Regarding the analysis of the partial stability of the slope above the spillway, the relationship between the load intensity and the spillway capacity was defined by applying the field of the remaining load-bearing capacity of the material. The relationship between the intensity of an earthquake less than that which would jeopardize the global stability of the object and the capacity of the spillway is significant for the long-term stability of the object. Reducing the capacity of the spillway would jeopardize the evacuation of water from the reservoir, which could lead to an increase in the water level above the maximum allowable level. This would jeopardize the global stability of the facility and cause consequences for people and property. The disadvantage of the remaining load-bearing capacity concept in the analysis of partial stability is that this vector shows the current state of the load (not irreversible) and in the stability assessment must be analyzed together with plastic strain field.

6. Conclusions

The paper presents an analysis of the functionality of the dam elements of the multi-purpose water system, using the finite element method, for the example of the Zavoj dam. Numerical analyses of the filtration and stability of the facility were conducted, and key structural elements whose potential damage could cause a collapse or loss of water system performance were identified. The key elements whose functionality were analyzed are the grout curtain, the overflow section with the sluice gates, and the spillway, i.e., the slope above the spillway. In recent years, earthquakes have been a frequent occurrence in Serbia and the surrounding area. For this reason, seismic load has been used as a load scenario in the conducted stability analyses presented in this paper. The impact of the grout curtain damage and loss of water resistance function on the change of flow under the dam body was analyzed, as was the possibility of damaging the overflow section and sluice gates, as well as the loss of partial stability of the slope above the spillway, whose potential damage would reduce the capacity of the spillway. Based on the results of numerical simulations, it was concluded that damage to the grout curtain in different zones would not significantly increase leakage under the dam body. In the worst-case scenario, the amount of leachate below the dam would increase several times in relation to the nominal conditions. This increase in flow is almost negligible in relation to the average annual flow of the river Visočica, but damage to the grout curtain could cause local erosion, which can be progressive and, in the long term, can compromise the global stability of the structure. Additionally, water losses represent a loss of energy, and thus significant financial loss.
By analyzing the strength of the concrete overflow section and the sluice gates, it is clear that this element of the structure is very robust, and during an earthquake of the highest intensity there is no real possibility of damage. This conclusion is supported by the large amount of remaining load-bearing capacity of this part of the structure. During an earthquake of the highest intensity, the displacement of the entire part of the overflow may occur, whereas the relative displacement in the sluice gates region is small and this displacement will not compromise their function.
Numerical analyses of stability have shown that the spillway, i.e., the slope above the spillway, is the weakest element of this structure due to seismic loading. For the purposes of partial stability analysis, a new measure called remaining load-bearing capacity was introduced. It has been shown that due to the effect of seismic loading, either in the direction of the waterflow or in the direction of the dam axis, a partial loss of stability of this slope can occur. At the same time, a part of the terrain could bury and fill the spillway along the entire length or one of its parts and thus significantly reduce the performance of the spillway to release outflows during the flood events. This hypothetical scenario can occur in the case of the simultaneous action of an earthquake and a reservoir high water level, which would cause catastrophic consequences for the dam itself and thus for the population and property downstream of the dam. Based on the conducted analyses using the finite element method, a functional dependence between the earthquake intensity and the spillway capacity was formed, i.e., a surrogate model.
Considering the simplicity of the surrogate model, it can be incorporated within the system of dynamic approach intended to simulate the functionality of the water system elements under the stress such as multiple hazard events: earthquakes and floods.

Author Contributions

Numerical analysis and results presentation, D.R.; conceptualization, supervision, methodology and writing, D.R., M.S., D.I. and M.Ž.; funding acquisition and project organization, M.S. and N.M. All authors have read and agreed to the published version of the manuscript.

Funding

Science fund of the Republic of Serbia for the support through the project of the PROMIS call, 6062556, DyRes_System: “Dynamics resilience as a measure for risk assessment of the complex water, infrastructure and ecological systems: Making a context”.

Institutional Review Board Statement

Not applicable.

Informed Consent Statement

Not applicable.

Data Availability Statement

Not applicable.

Acknowledgments

The authors express the gratitude to the Science fund of the Republic of Serbia for the support through the project of the PROMIS call, 6062556, DyRes_System: “Dynamics resilience as a measure for risk assessment of the complex water, infrastructure and ecological systems: Making a context”.

Conflicts of Interest

The authors declare no conflict of interest.

References

  1. Haghighi, T.A.; Kløve, M.H. Development of a new index to assess river regime impacts after dam construction. Glob. Planet Change 2014, 122, 186–196. [Google Scholar] [CrossRef]
  2. Foster, M.; Fell, R.; Spannagle, M. The statistics of embankment dam failures and accidents. Can. Geotech. J. 2000, 37, 1000–1024. [Google Scholar] [CrossRef]
  3. Athani, S.S.; Solanki, C.H.; Dodagoudar, G.R.; Shukla, S.K. Finite-element analysis of strains in seepage barriers of the earth dam. Dams Reserv. 2019, 29, 87–96. [Google Scholar] [CrossRef]
  4. Hekmatzadeh, A.A.; Zarei, F.; Johari, A.; Torabi Haghighi, A. Reliability analysis of stability against piping and sliding in diversion dams, considering four cutoff wall configurations. Comput. Geotech. 2018, 98, 217–231. [Google Scholar] [CrossRef] [Green Version]
  5. Meehan, C.L.; Kumar, S.; Pando, M.A.; Coe, J.T.; Saliba, F.; Nassar, R.B.; Khoury, N.; Maalouf, Y. Internal Erosion and Piping Evolution in Earth Dams Using an Iterative Approach. In Proceedings of the Eighth International Conference on Case Histories in Geotechnical Engineering, Philadelphia, PA, USA, 24–27 March 2019; pp. 67–75. [Google Scholar]
  6. Xu, Z.; Yang, J.; Zhang, Q.; Yang, P. Reliability analysis for slope stability of embankment dam. In Proceedings of the 85th Annual Meeting of International Commission on Large Dams, Prague, Czech Republic, 3–7 July 2017. [Google Scholar]
  7. Yu, Y.; Xie, L.; Zhang, B. Stability of earth–rockfill dams: Influence of geometry on the three-dimensional effect. Comput. Geotech. 2005, 32, 326–339. [Google Scholar] [CrossRef]
  8. Huanga, M.; QinJia, C. Strength reduction FEM in stability analysis of soil slopes subjected to transient unsaturated seepage. Comput. Geotech. 2009, 36, 93–101. [Google Scholar] [CrossRef]
  9. Liu, Y.; Wu, Z.; Chang, Q.; Li, B.; Yang, Q. Stability and reinforcement analysis of rock slope based on elastic-plastic finite element method. J. Cent. South Univ. 2015, 22, 2739–2751. [Google Scholar] [CrossRef]
  10. Ziccarelli, M.; Rosone, M. Stability of Embankments Resting on Foundation Soils with a Weak Layer. Geosciences 2021, 11, 86. [Google Scholar] [CrossRef]
  11. Escuder-Bueno, I.; Mazzà, G.; Morales-Torres, A.; Castillo-Rodríguez, J. Computational Aspects of Dam Risk Analysis: Findings and Challenges. Engineering 2016, 2, 319–324. [Google Scholar] [CrossRef] [Green Version]
  12. Tasnim Nahar, T.; Cao, A.; Kim, D. Risk Assessment of Aged Concrete Gravity Dam Subjected to Material Deterioration under Seismic Excitation. Int. J. Concr. Struct. Mater. 2020, 14, 1–17. [Google Scholar]
  13. Wu, Z.; Xu, B.; Gu, C.; Li, Z. Comprehensive evaluation methods for dam service status. Sci. China Technol. Sci. 2012, 55, 2300–2312. [Google Scholar] [CrossRef]
  14. Kojić, M.; Slavković, R.; Živković, M.; Grujović, N. PAK-Finite Element Program for Linear and Nonlinear Structural Analysis and Heat Transfer; Faculty of Mechanical Engineering, University of Kragujevac: Kragujevac, Serbia, 1999. [Google Scholar]
  15. Kojić, M.; Slavković, R.; Živković, M.; Grujović, N. Finite Element Method 1, Linear Analysis; Faculty of Mechanical Engineering, University of Kragujevac: Kragujevac, Serbia, 1998. (In Serbian) [Google Scholar]
  16. Rakić, D.; Živković, M.; Milivojević, N.; Divac, D. Stability analysis of a concrete gravity dam using shear strength reduction method. Ann. Fac. Eng. Hunedoara—Int. J. Eng. 2017, 15, 117–122. [Google Scholar]
  17. Dawson, E.M.; Roth, W.H.; Drescher, A. Slope stability analysis by strength reduction. Géotechnique 1999, 49, 835–840. [Google Scholar] [CrossRef]
  18. PE Electric Power Industry of Serbia; Energoprojekt—Hidroinženjering AD. Built Design, General Report (In Serbian: Projekat Izvedenog Objekta, Opšti Izveštaj); Electric Power Industry of Serbia: Belgrade, Serbia, 2005. [Google Scholar]
  19. United Electric Power Industry Belgrade-Working Organization in the Process of Establishment HP Zavoj; SOUR Energoprojekt, RO Projektovanje, OOUR Hidroinženjering Belgrade. Hydropower Plant Zavoj, Main Design, Book XIII—Hydromechanic and Mechanic Equipment. Notebook 2—Hydromechanic Equipment, Mechanic Part; United Electric Power Industry: Belgrade, Serbia, 1988. (In Serbian) [Google Scholar]
  20. Tsompanakis, Y. Earthquake Return Period and Its Incorporation into Seismic Actions; Encyclopedia of Earthquake Engineering, Technical University of Crete: Crete, Greece, 2014. [Google Scholar]
  21. Radovanović, M.; Stevančević, M.; Milijašević, D.; Mukherjee, S.; Bjeljac, Ž. Astrophysical analysis of earthquake near Kraljevo (Serbia). J. Geogr. Inst. Jovan Cvijic SASA 2011, 61, 1–15. [Google Scholar]
  22. Mavroulis, S.; Lekkas, E.; Carydis, P. Liquefaction Phenomena Induced by the 26 November 2019, Mw = 6.4 Durrës (Albania) Earthquake and Liquefaction Susceptibility Assessment in the Affected Area. Geosciences 2021, 11, 215. [Google Scholar] [CrossRef]
  23. Markušić, S.; Stanko, D.; Penava, D.; Ivančić, I.; Bjelotomić Oršulić, O.; Korbar, T.; Sarhosis, V. Destructive M6.2 Petrinja Earthquake (Croatia) in 2020—Preliminary Multidisciplinary Research. Remote Sens. 2021, 13, 1095. [Google Scholar] [CrossRef]
  24. Ignjatović, L.; Stojković, M.; Ivetić, D.; Milašinović, M.; Milivojević, N. Quantifying Multi-Parameter Dynamic Resilience for Complex Reservoir Systems Using Failure Simulations: Case Study of the Pirot Reservoir System. Water 2021, 13, 3157. [Google Scholar] [CrossRef]
  25. King, L.M.; Simonovic, S.P.; Hartford, D.N.D. Using system dynamics simulation for assessment of hydropower system safety. Water Resour. Res. 2017, 53, 7148–7174. [Google Scholar] [CrossRef]
  26. Schrefler, B.; Zhan, X. A fully coupled model for water flow and airflow in deformable porous media. Water Resour. Res. 1993, 29, 155–167. [Google Scholar] [CrossRef]
  27. Lewis, R.W.; Schrefler, B.A. The Finite Element Method in the Static and Dynamic Deformation and Consolidation of Porous Media; John Wiley & Sons Ltd.: Chichester, UK, 1998. [Google Scholar]
  28. Wolfgang, K. Groundwater Modelling: An Introduction with Sample Programs in Basic; Elsevier: New York, NY, USA, 1986. [Google Scholar]
  29. Bathe, K.J. Finite Element Procedures; Massachusetts Institute of Technology: Cambridge, MA, USA, 1996. [Google Scholar]
  30. Hoek, E. Strength of rock and rock masses. ISRM News J. 1994, 2, 4–16. [Google Scholar]
  31. Hoek, E.; Carranza-Torres, C.; Corkum, B. Hoek-Brown failure criterion—2002 edition. In Proceedings of the 5th North American Rock Mechanics Symposium and the 17th Tunnelling Association of Canada: NARMS-TAC 2002, Toronto, ON, Canada, 7–10 July 2002. [Google Scholar]
  32. Nian, T.; Jiang, J.; Wan, S.; Luan, M. Strength Reduction FE Analysis of the Stability of Bank Slopes Subjected to Transient Unsaturated Seepage. EJGE 2011, 16, 165–177. [Google Scholar]
  33. Rakić, D.; Živković, M.; Vulović, S.; Divac, D.; Slavković, R.; Milivojević, N. Embankment dam stability analysis using FEM. In Proceedings of the 3rd South-East European Conference on Computational Mechanics ECCOMAS and IACM Special Interest Conference, Kos Island, Greece, 12–14 June 2013. [Google Scholar]
  34. Potts, D.; Zdravković, L. Finite Element Analysis in Geotechnical Engineering: Finite Element Analysis in Geotechnical Engineering, Theory (Vol 1); Thomas Telford Publishing: London, UK, 1999. [Google Scholar]
  35. Reddy, J. An Introduction to Continuum Mechanics, with Application; Cambridge University Press: New York, NY, USA, 2008. [Google Scholar]
  36. Jaroslav Černi Water Institute. Innovative Project of Technical Monitoring of the Dam “Zavoj"; Jaroslav Černi Water Institute: Belgrade, Serbia, 2020. (In Serbian) [Google Scholar]
  37. Siemens PLM. Femap User Guide; Version 12; Siemens Product Lifecycle Management Software Inc.: Plano, TX, USA, 2018. [Google Scholar]
  38. Jaroslav Černi Water Institute. Dam “Vlasina”, 6—Report on Preliminary Analyzes Using Soft Models of Filtration and Stress-Strain Processes on the Dam; Jaroslav Černi Water Institute: Belgrade, Serbia, 2016. [Google Scholar]
  39. Rogers, D. Hoover Dam: Operational Milestones, Lessons Learned, and Strategic Import. In Proceedings of the Hoover Dam 75th Anniversary History Symposium, Las Vegas, NV, USA, 21–22 October 2012. [Google Scholar]
Figure 1. Remaining load-bearing capacity definition.
Applsci 12 00558 g001
Figure 2. Zavoj dam cross-section with quasi-homogeneous zones.
Applsci 12 00558 g002
Figure 3. Zavoj dam—photo of the construction site.
Applsci 12 00558 g003
Figure 4. Finite element model of the Zavoj dam.
Applsci 12 00558 g004
Figure 5. Grout curtain regions whose damage was analyzed—downstream view.
Applsci 12 00558 g005
Figure 6. Discretized spillway of the Zavoj dam.
Applsci 12 00558 g006
Figure 7. Segments of the slope used in analysis of spillway capacity reduction.
Applsci 12 00558 g007
Figure 8. Total potential φ (m asl) for different reservoir water levels: (a) rwl = 568 m asl, (b) rwl = 580 m asl, (c) rwl = 590 m asl, (d) rwl = 600 m asl, (e) rwl = 610 m asl, (f) rwl = 615.9 m asl.
Applsci 12 00558 g008
Figure 9. Seismic acceleration ax = 0.19 g: (a) total translation t (m) and (b) equivalent plastic strain e P (−).
Applsci 12 00558 g009
Figure 10. Seismic acceleration ay = 0.19 g: (a) total translation t (m) and (b) equivalent plastic strain e P (−).
Applsci 12 00558 g010
Figure 11. Total velocity through grout curtain v (m/s) for rwl = 615.9 m asl and damaged: (a) region r1, (b) region r2, (c) region r3, (d) region r4, (e) region r5, (f) region r6.
Applsci 12 00558 g011
Figure 12. Flow through grout curtain for different damaged zones.
Applsci 12 00558 g012
Figure 13. Overflow section for ax = 0.19 g: (a) total translation t (m), (b) remaining load-bearing capacity RC (%).
Applsci 12 00558 g013
Figure 14. Overflow section for ay = 0.19 g: (a) total translation t (m), (b) remaining load-bearing capacity RC (%).
Applsci 12 00558 g014
Figure 15. Remaining load-bearing capacity RC (%) for ax = 0.19 g: (a) whole model and (b) slope above spillway.
Applsci 12 00558 g015
Figure 16. Remaining load-bearing capacity RC (%) for ay = 0.19 g: (a) whole model and (b) slope above spillway.
Applsci 12 00558 g016
Figure 17. Spillway capacity C (%) vs. seismic acceleration in: (a) x direction, (b) y direction.
Applsci 12 00558 g017
Figure 18. Effective spillway capacity C (%) vs. seismic acceleration.
Applsci 12 00558 g018
Table 1. Material properties of the dam model.
Materialk (m/s)E (kPa)ν (−)γ (kN/m3)c (kPa)ϕ (°)ψ (°)
Clay core1 × 10−101.42 × 1050.4517.015.0220
Filter 11 × 10−66.86 × 1050.318.088.726.326.3
Filter 21 × 10−57.13 × 1050.320.057.222.122.1
Upstream rockfill1 × 10−32.16 × 1050.321.088.726.326.3
Downstream rockfill1 × 10−32.16 × 1050.321.057.222.122.1
Bedrock1 × 10−76.00 × 1060.226.0254.448.748.7
Grout curtain1 × 10−832.0 × 1060.3524.07160.035.435.4
Concrete1 × 10−932.0 × 1060.224.07160.035.435.4
Publisher’s Note: MDPI stays neutral with regard to jurisdictional claims in published maps and institutional affiliations.

