Article

Stability Improvement Method for Embankment Dam with Respect to Conduit Cracks

1
Institute of Agricultural Science, Chungnam National University, Daejeon 34134, Korea
2
Department of Agricultural and Rural Engineering, Chungnam National University, Daejeon 34134, Korea
3
Rural Research Institute, Korea Rural Community Corporation, Ansan 15634, Korea
*
Author to whom correspondence should be addressed.
Appl. Sci. 2022, 12(2), 567; https://doi.org/10.3390/app12020567
Submission received: 21 October 2021 / Revised: 5 January 2022 / Accepted: 5 January 2022 / Published: 7 January 2022
(This article belongs to the Section Agricultural Science and Technology)

Abstract

:

Featured Application

In this study, the inside of a conduit was monitored to visually reproduce the erosion phenomenon caused by a crack in the conduit in an embankment. In addition, a model that can dramatically reduce erosion based on the dispersion principle of water pressure is proposed. The dispersion effect of water pressure was verified via pore water pressure measurements and 3D FEM analysis.

Abstract

In recent years, as the number of reservoir embankments constructed has increased, embankment failures due to cracks in aging conduits have also increased. In this study, a crack in a conduit was modeled based on the current conduit design model, and the risk of internal erosion was analyzed using a large-scale model test and three-dimensional deformation–seepage analysis. The results show that when cracks existed in the conduit, soil erosion and cavitation occurred near the crack area, which made the conduit extremely vulnerable to internal erosion. Herein, a model is proposed that can reduce internal erosion by applying a layer of sand and geotextiles on the upper part of the conduit located close to the downstream slope. In the proposed model, only partial erosion occurred inside the conduit, and no cavitation appeared near the crack in the conduit. The results suggest that internal erosion can be suppressed when the water pressure acting intensively on the crack in the conduit is dispersed by the drainage layer. To validate these results, the pore water pressure, seepage line, and hydraulic gradient were investigated to confirm the erosion phenomenon and reinforcement effect.

1. Introduction

Old embankments can have high variability in their filling material because of the low level of compaction and are generally known to exhibit unique heterogeneity [1]. These characteristics result in uncertainty regarding the stability of an aging embankment due to structural defects, which can increase the potential risk in an emergency.
One way to describe failure mechanisms of embankment dams that are associated with the uncontrolled flow of water is through internal erosion. Internal erosion can be a threat to the future stability of the embankment due to cracks in the aging conduit. It is highly dependent on the compaction of the embankment zone, the ratio of clay particles, the water content, and the erosion rate, and it is known to be caused by various factors, such as structural defects or construction failures inside the embankment [2,3,4,5]. In particular, the boundaries between a conduit structure constructed of concrete and the embankment zone, the impervious cores, and their shoulders can make the conduit more prone to internal erosion owing to the difference in material properties and differential settlement [6,7,8,9,10]. A condition in which such internal erosion persists causes piping. Here, piping refers to a phenomenon in which soil and water in the embankment zone are discharged to the slope as erosion gradually develops inside the embankment [11].
A failure due to a conduit crack occurred at the Sandae Reservoir in Korea in April 2013 [12]. The failure, due to internal erosion caused by a conduit crack, resulted in a concave circular shape being dug out around the conduit on the downstream slope, which gradually expanded to the top of the embankment. The failure width of the embankment, which started on the slope around the conduit, was approximately 12.2 m. The time that elapsed between the leaked water appearing on the downstream slope and the failure occurring was approximately 3 h, which is extremely short. An embankment failure due to conduit cracks is a rare case, but since conduits continue to deteriorate, these failures suggest that measurement strategies to deal with conduit cracks and failure problems will be important in the future.
The conduits of small reservoirs are mostly circular in shape and have a small diameter. This type of structure is a poor environment for reinforcing the inside of a conduit because access by personnel and equipment is restricted. Therefore, reinforcement is carried out outside the conduit. Currently, the reinforcement of conduits is based on the results of investigating the leakage using photographic equipment, and a full or partial repair and reinforcement are conducted according to the level of damage [13]. There are various methods for reinforcing a conduit, such as grouting, waterproof mortar, and high-density polyethylene (HDPE) slip lining of the pipe [14], and drilling is required in many cases. However, reinforcement by drilling requires a careful approach, as it can affect the reinforcement effectiveness by introducing new problems due to hydrofracturing, internal erosion, and the contamination of filters and drainage materials in the embankment zone [15,16].
Therefore, in this study, an improvement model was developed as a way to minimize the uncertainty of reinforcement due to drilling and maintain the reinforcement effect in the long term. The improvement model aims to delay internal erosion by applying a drainage layer (geotextile and sand layers) that can distribute the water pressure on the upper and downstream slopes of the conduit without drilling. In order to evaluate the effectiveness of the improvement model, the current model was constructed based on a conduit with a circular shape and a small diameter. For the current model and the improvement model, the erosion characteristics due to cracks occurring in the conduit were evaluated by a large-scale indoor model test and three-dimensional deformation–seepage analysis. The results discussed in this study provide basic data that can be put into practical use on the embankment site of an old reservoir in the future.

2. Materials and Methods

2.1. Target Reservoirs and Samples

In embankments over 50 years old, cores and filters are often not functional due to aging [17]. An embankment under these conditions may exhibit the same seepage behavior as a homogeneous embankment, and if a crack occurs in the conduit, the risk of failure may be high. The Gyeryong reservoir has a zoned-fill-type structure, and its condition has been deteriorating since the year it was built (1964), meaning that its condition is now close to that of an embankment aged over 50 years; thus, it was selected as a target reservoir for this study. Table 1 shows the physical and mechanical properties of the samples used in the model.

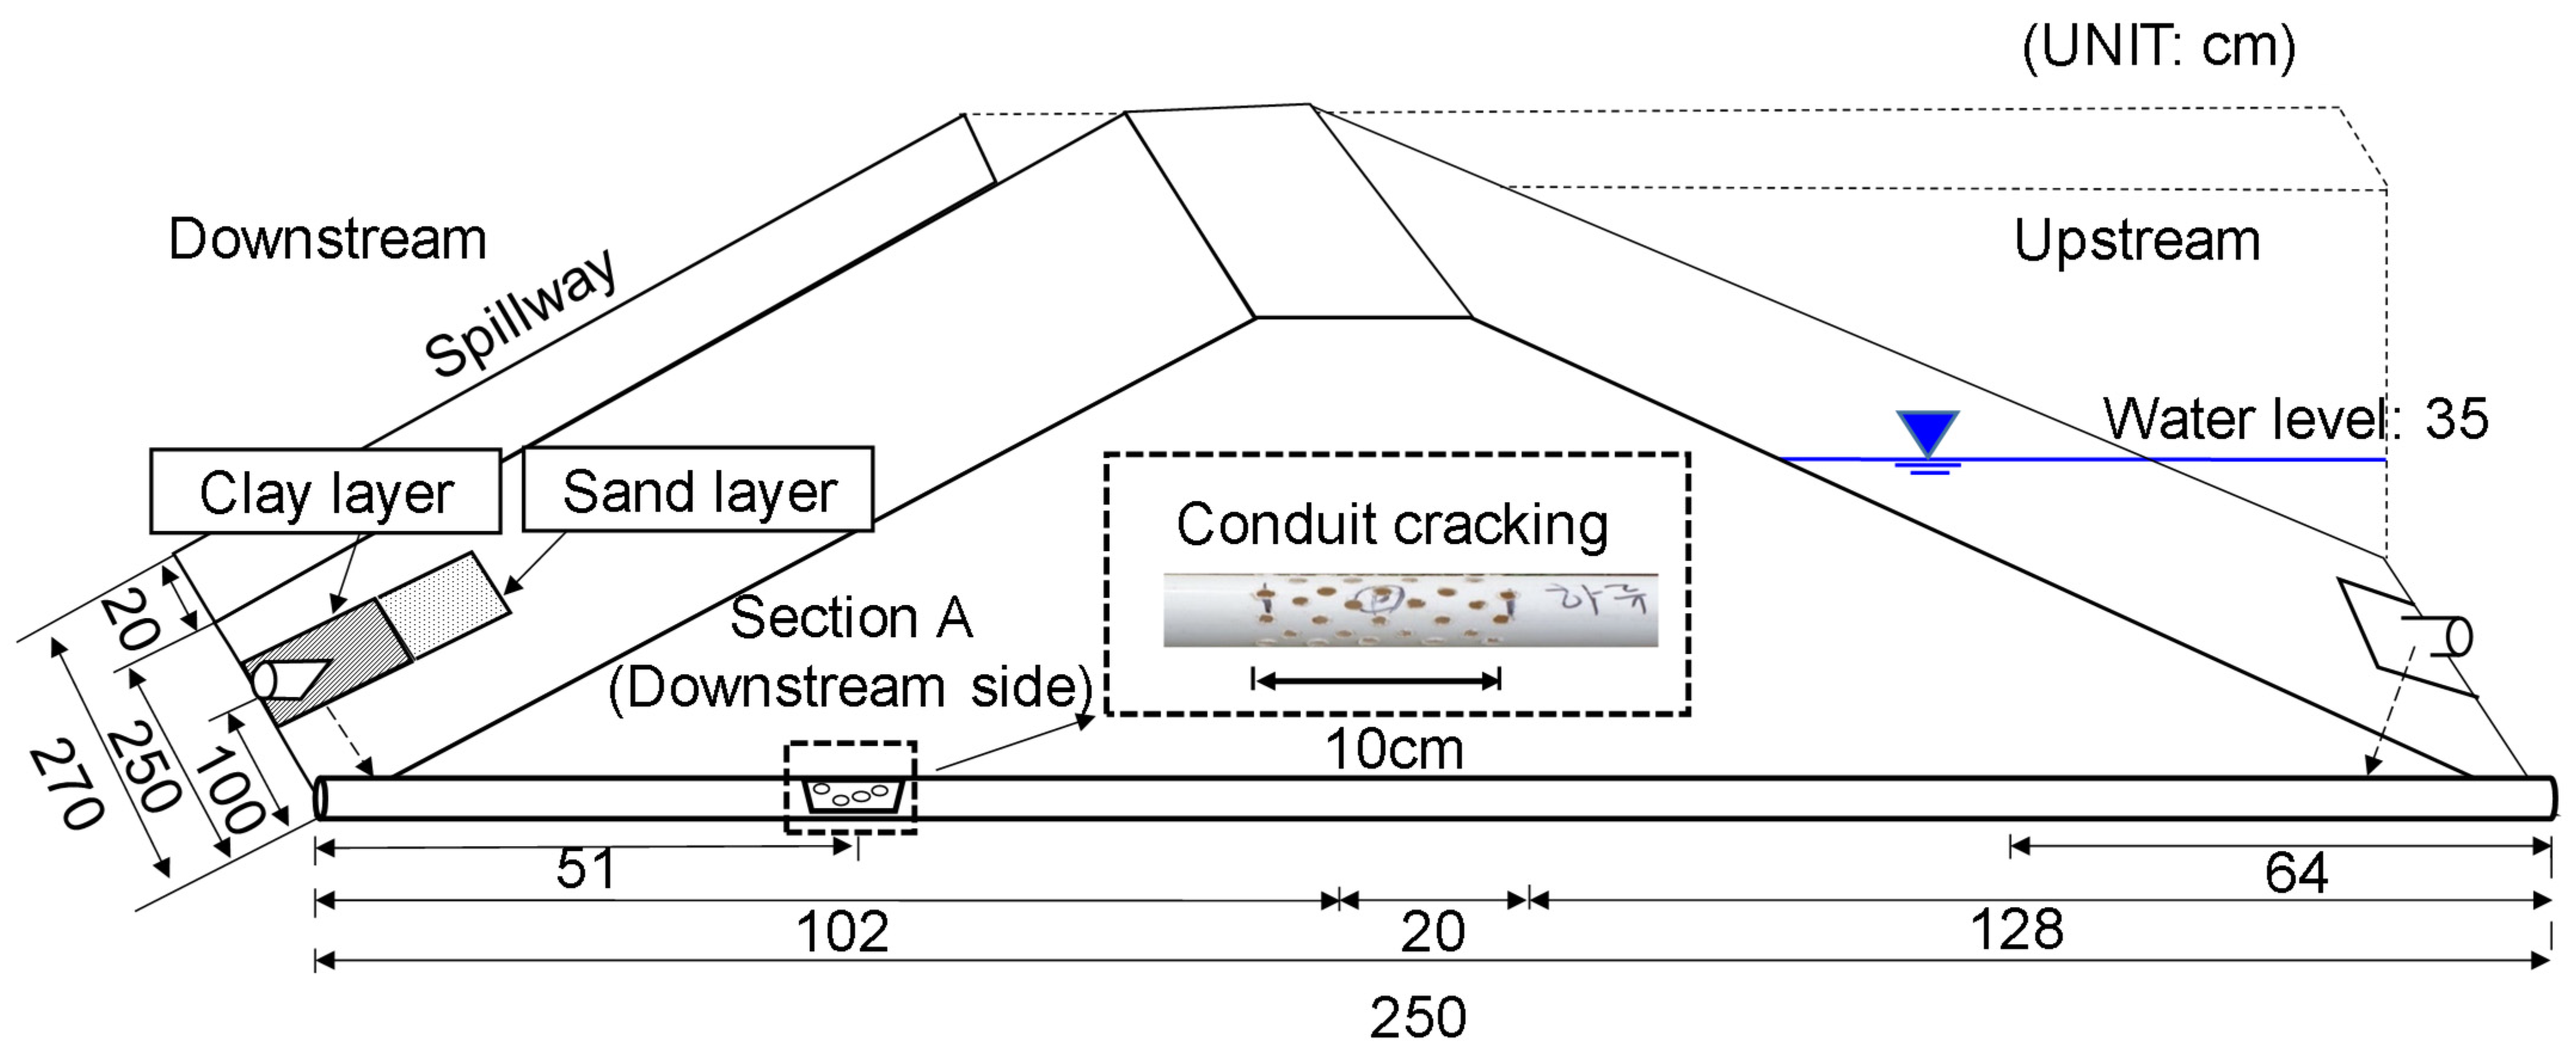
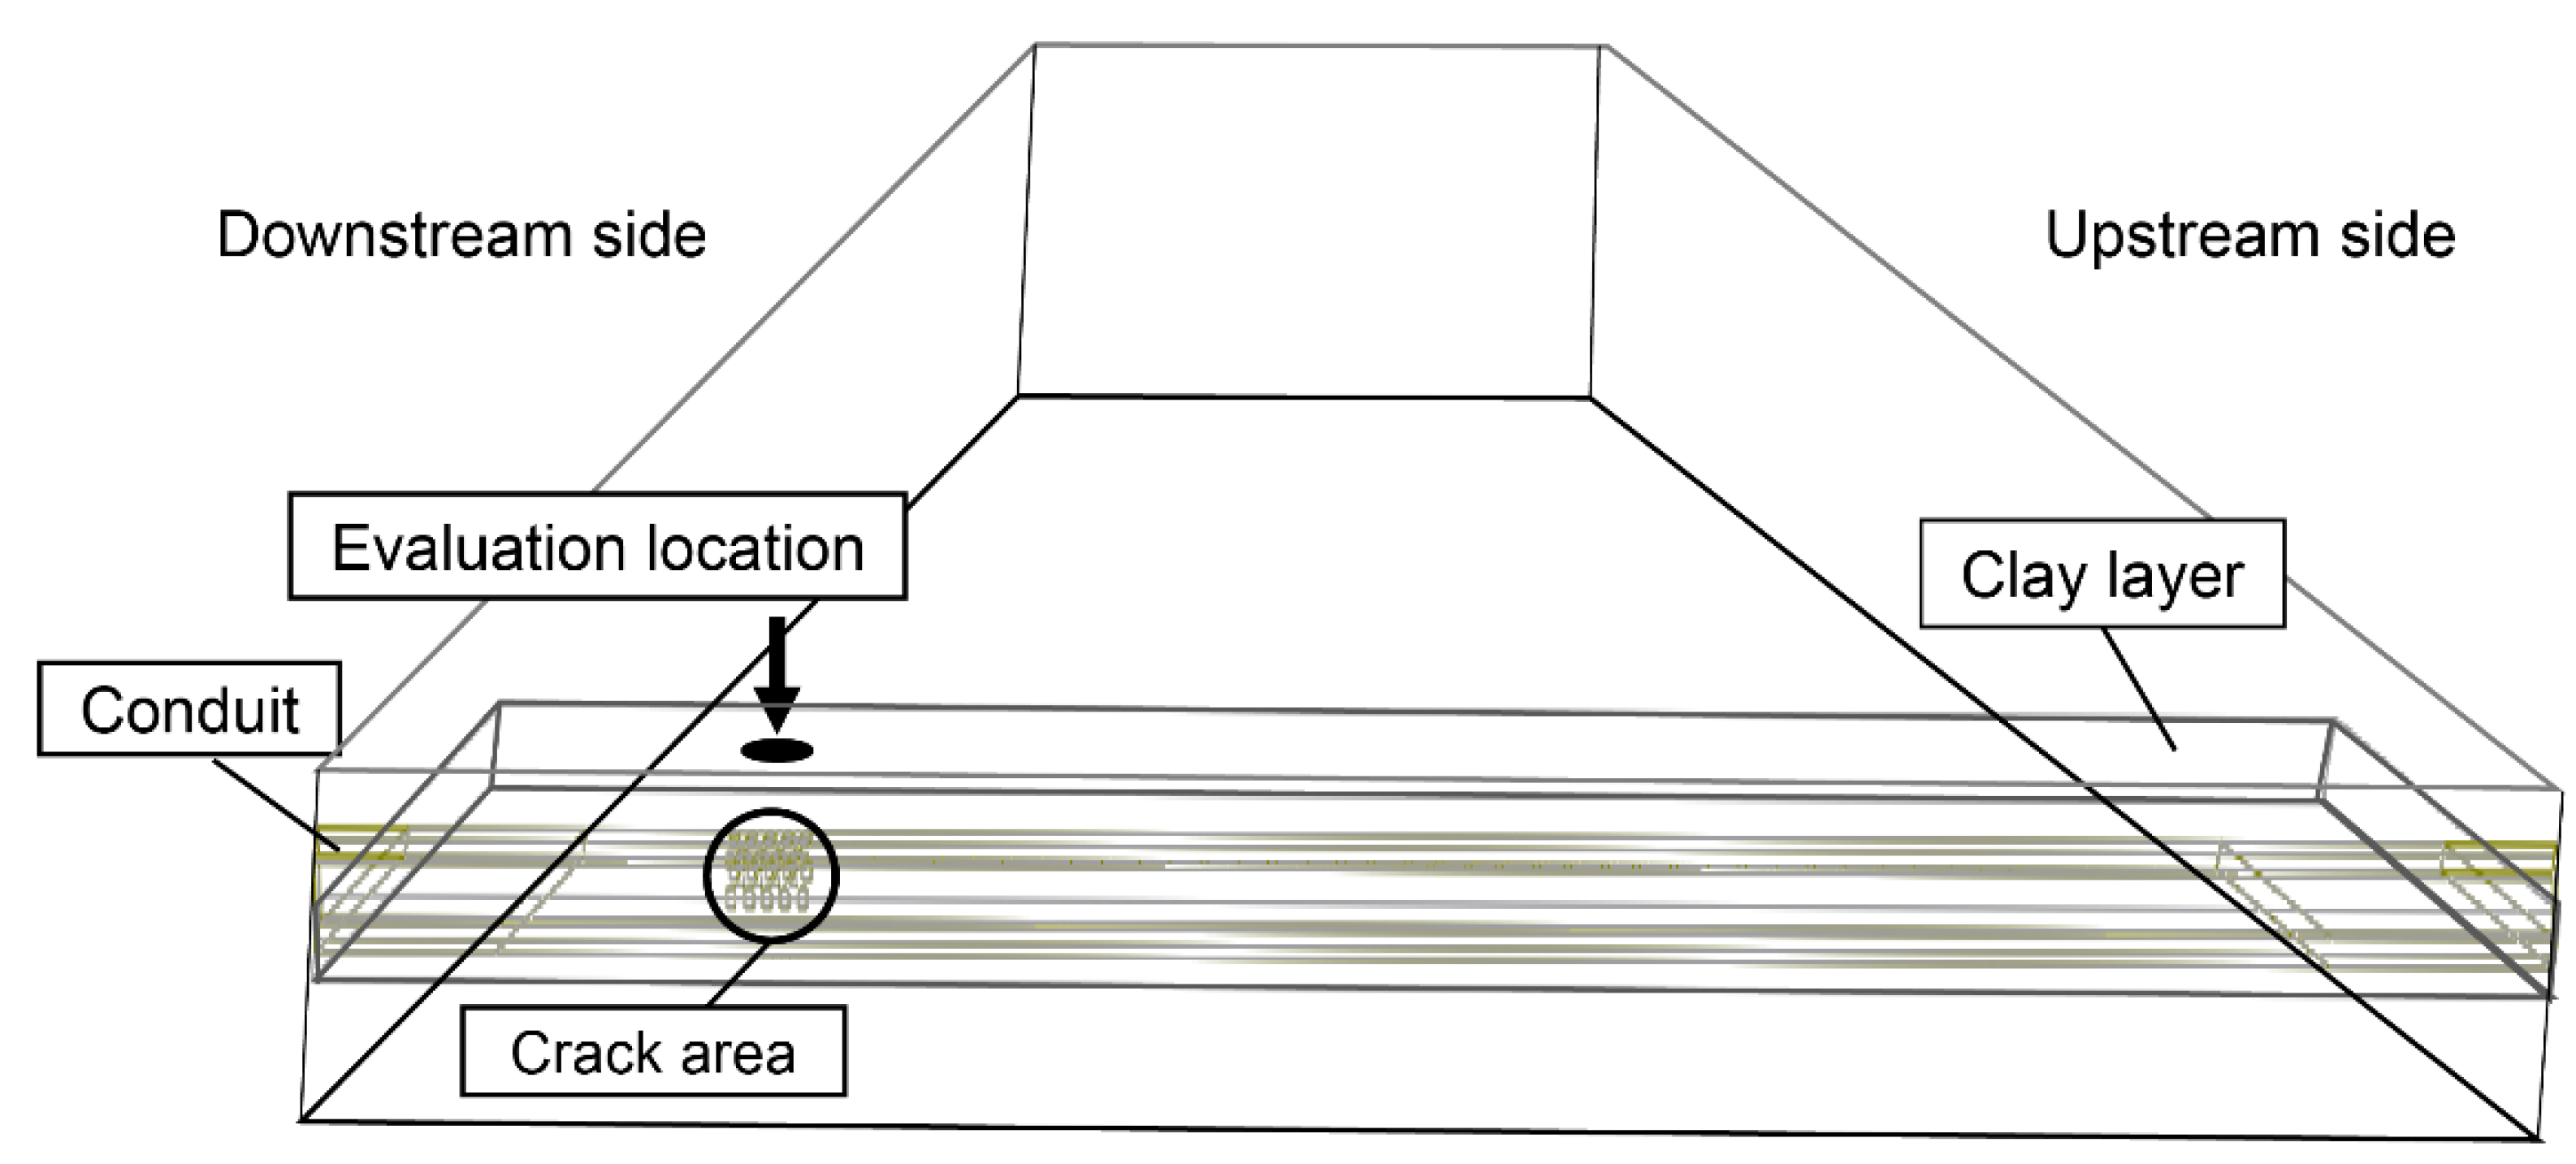
2.2. Measurement Location and Experimental Conditions

In this study, the experimental model was designed to be 1/30 of the prototype. The height (H), width (W), and length (L) of the model were 51, 250, and 270 cm, respectively. The embankment model was equipped with a pore water pressure gauge (rated capacity: 50 kPa) that can be applied to the scale of a reduced model, and it was installed in each section (P1, P2, and P3) of the upper part of the conduit. Figure 1 shows the cross-section of the experimental model and the installation location of the pore water pressure gauge. The model conduit was composed of a pipe with a length of 250 cm and a diameter of φ50 mm based on design criteria [13], where the width of the crack area for the pipe was 10 cm, and the diameter of the crack was φ8–10 mm.

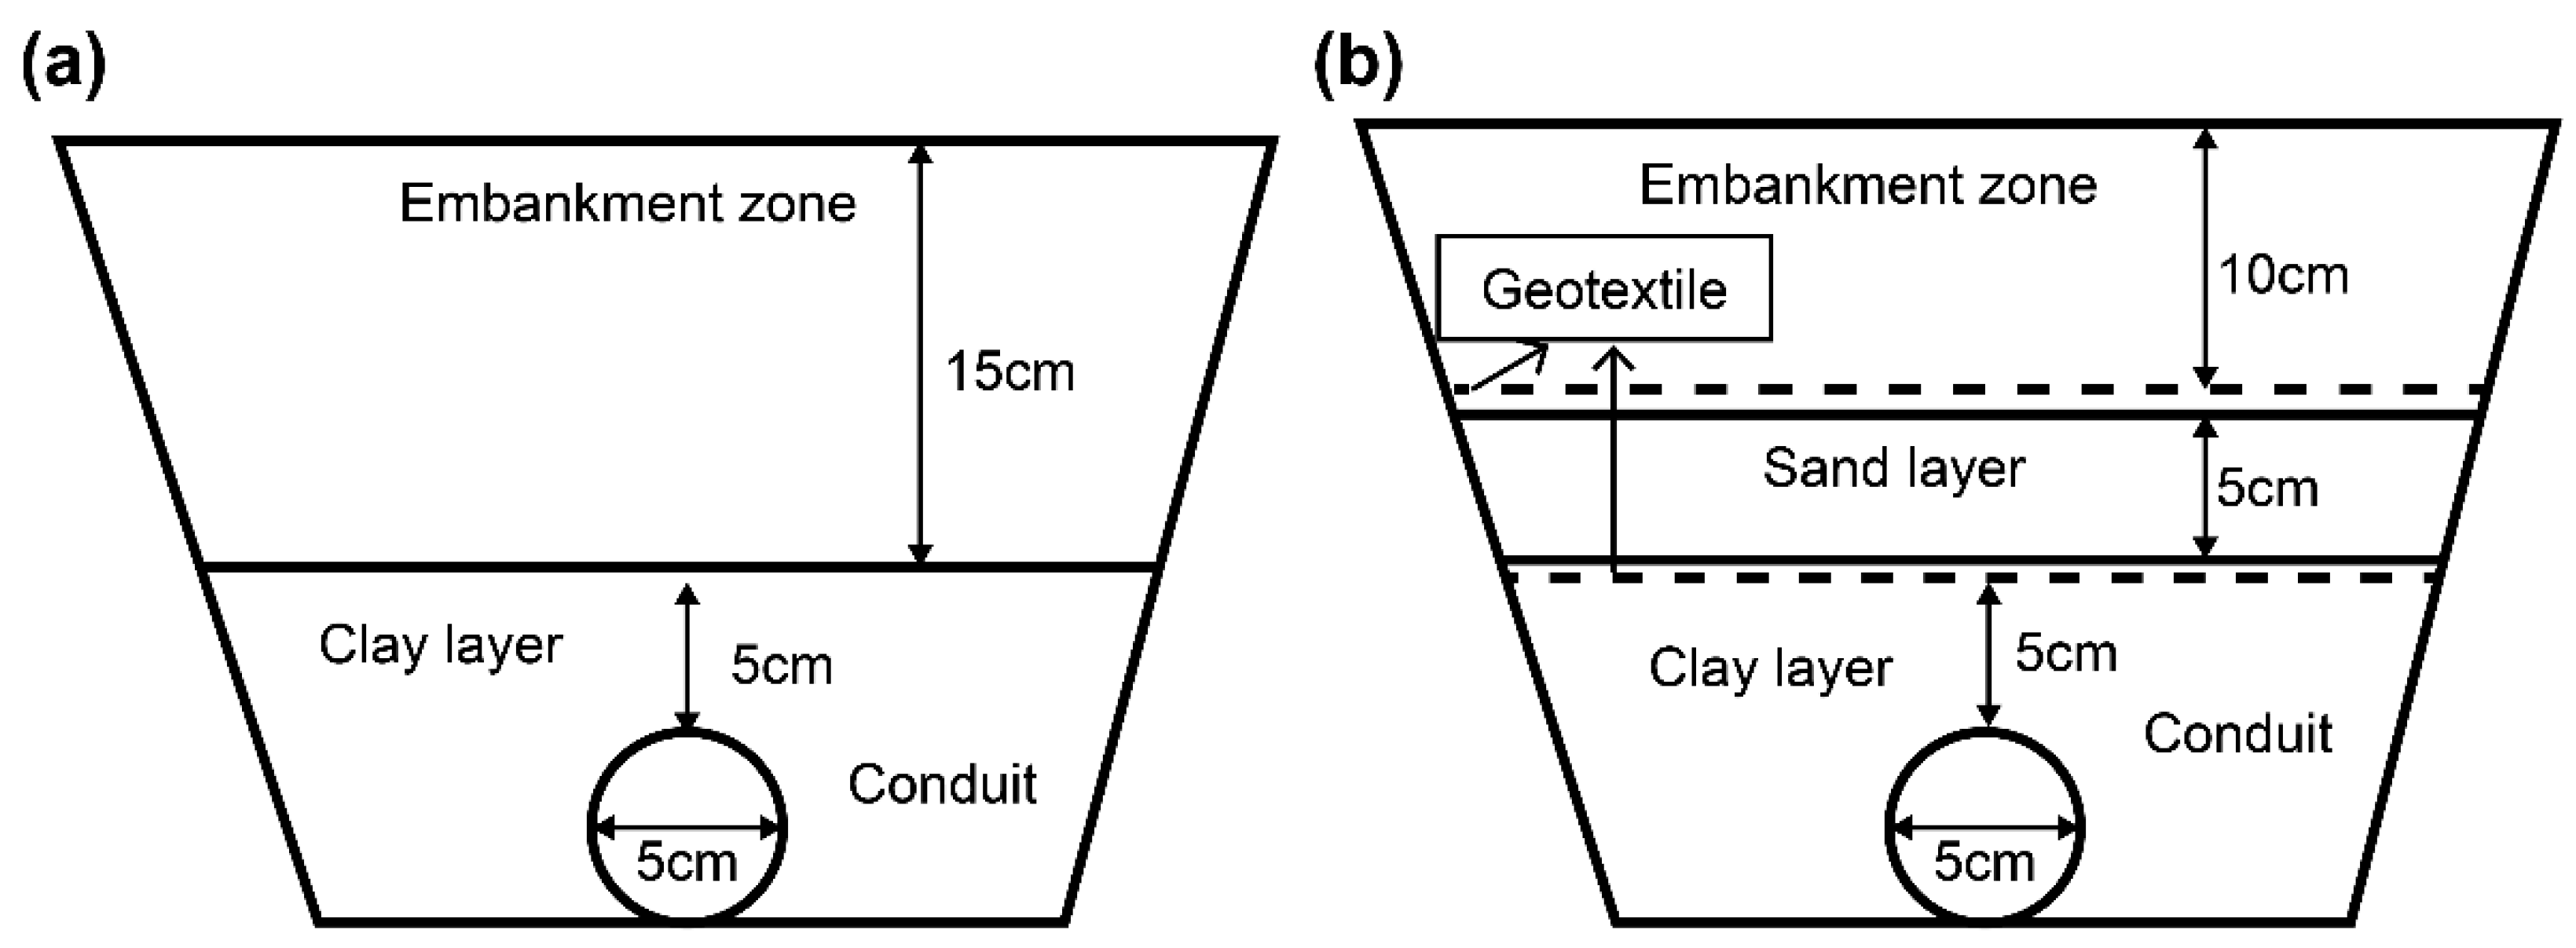
2.3. Experimental Models

The experimental models for the conduit were the current model, which was used at the site, and the improvement model proposed in this paper. Figure 2 shows an overview of the current and improvement models.
The current model covered the outside of the conduit with a layer of clay to relieve water pressure on the conduit. Most old reservoirs (over 50 years) in Korea are designed similarly to the current model. However, as the facilities have recently deteriorated, the structural environment of these conduits has become increasingly uncertain regarding the stability of the embankment. For example, the loss of clay particles over time is unavoidable, which naturally increases the pressure that the conduit receives from water. Furthermore, increased water pressure in aging small reservoirs can potentially cause problems such as erosion and piping phenomena on the downstream slopes. In a fill-type embankment, the failure rate of the piping is high (30.5%) [18]; thus, it was necessary to additionally devise a method to reduce the water pressure on the downstream slope.
In this context, the improved model presented in this study is a method of applying a layer of sand and geotextiles on top of the clay layer in the current model. The purpose of this additional layer is to install a sand layer on the downstream slope to prevent the leaking water from rising to the downstream embankment zone and to apply geotextile to prevent the loss of soil particles.
In a general embankment dam, a drainage structure such as a toe drain or filter is located at the end of the downstream slope of the embankment to stably drain the seepage water. However, when erosion starts at a crack in the conduit, the drainage structure installed at the end of the downstream slope induces rapid drainage of the seepage water, which may increase the risk of internal erosion.
Here, the general premise of the improvement model is that when a sand layer and geotextile are placed on the upper part of the conduit, the water pressure concentrated on the crack surface of the conduit is dispersed into the sand layer to induce a delay of internal erosion. The improved model differs from the general embankment dam drainage structure in that it is designed in consideration of the prevention of potential piping due to conduit cracks. Table 2 lists the experimental cases for the current model and the improvement model.
In the current model, the erosion characteristics and the effectiveness of reinforcement were evaluated under cracking conditions in the conduit (Section A).

3. Results and Discussion

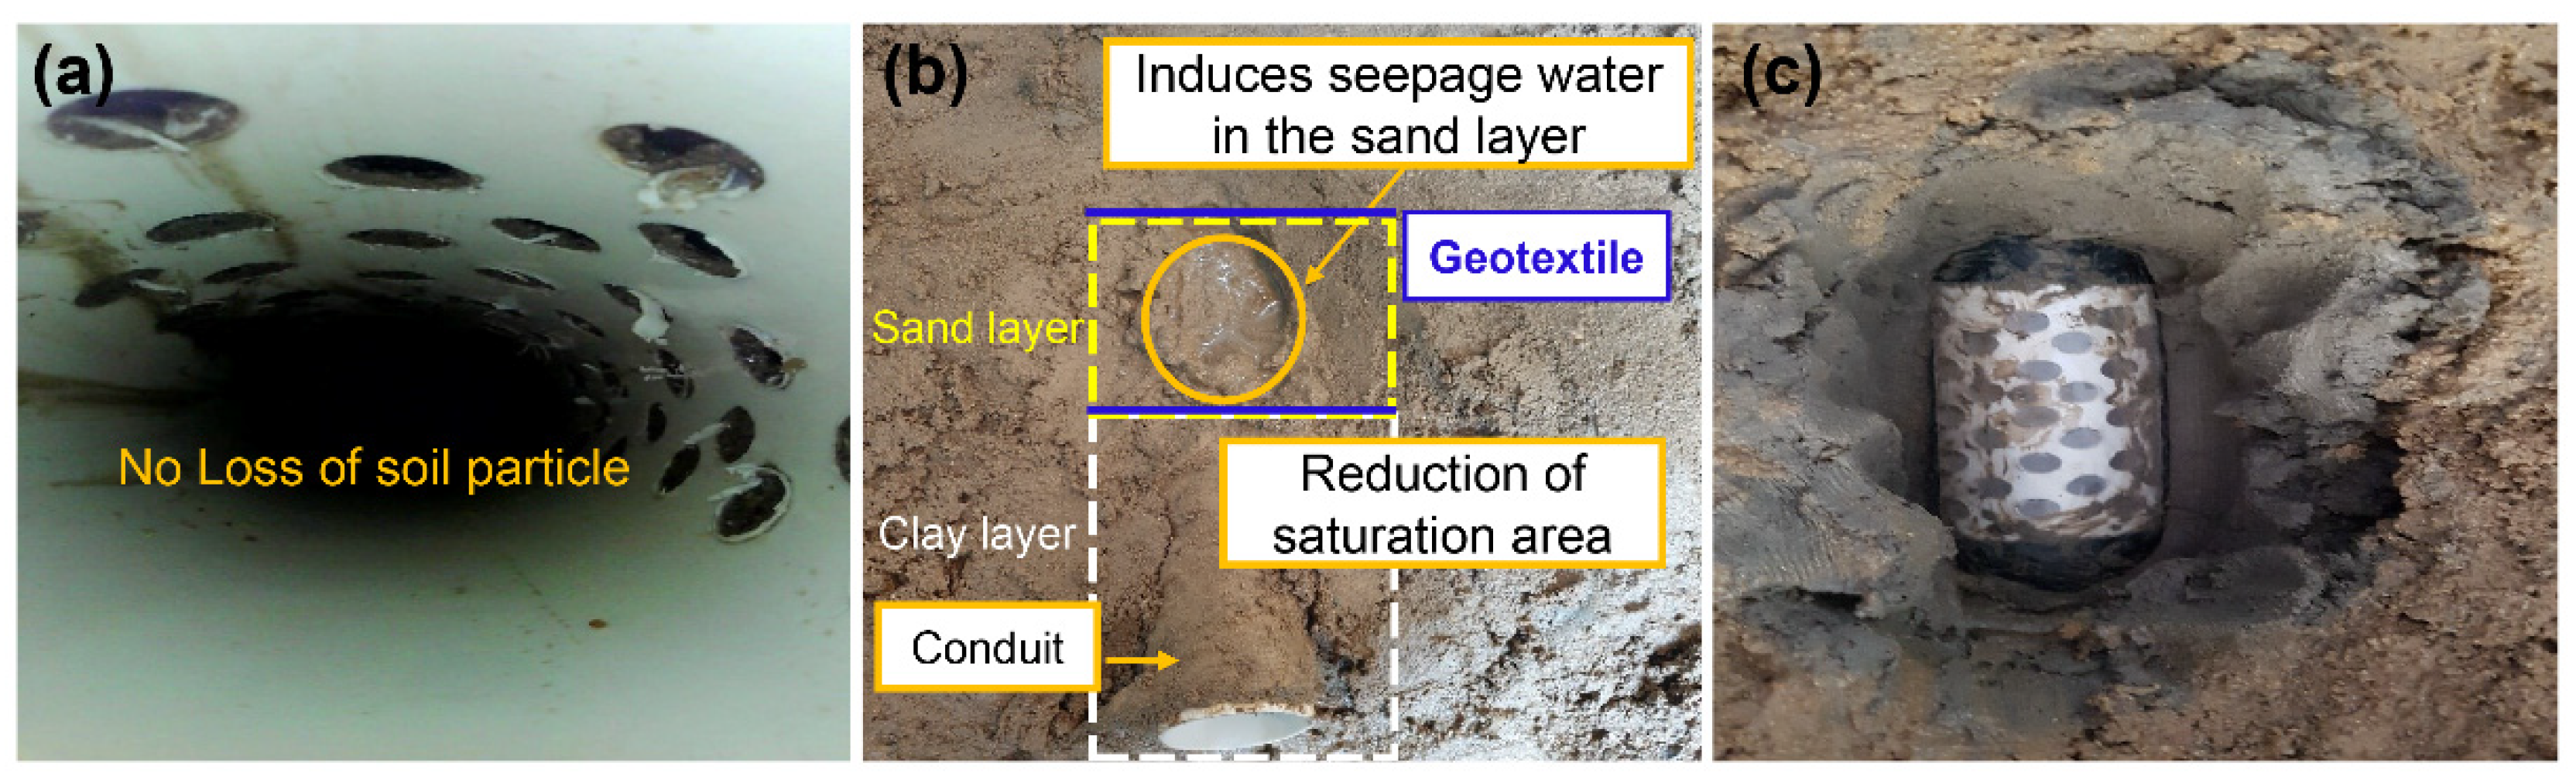
3.1. Investigation of Erosion of Current and Improvement Models

In order to compare the erosion phenomena in the current model and the improvement model, the embankment model requires conditions close to a steady state. Here, steady state means that most of the infiltration has occurred, and there is no change in the water pressure.
The experiment was initiated after the embankment model reached a steady state through preliminary experiments, and the pore water pressure was measured for 48 h (2 days) at the full water level (H = 35 cm).
In Case 1—Crack, soil loss was observed at the outlet and inside the conduit, as shown in Figure 3a, indicating no resistance to erosion. The downstream slope was slightly dry, as shown in Figure 3b. This dry state indicates that the soil and water in the embankment zone were flowing within the conduit through its cracked area. Therefore, the seepage water did not reach the downstream slope, and the downstream slope remained dry. In Figure 3c, it can be observed that cavitation occurred due to erosion in the clay layer near the crack in the conduit. In this experiment, the cause of cavitation is considered to be the erosion of clay particles into the conduit cracks. It is assumed that the initially formed small cavitation gradually expanded into the left and right fill zones and the upper soil layer as erosion progressed.
In general, it is believed that if the embankment zone has a high degree of compaction, cavitation is less likely to occur owing to the high density of soil. The model embankment constructed in this study had a compaction degree of approximately 95%, similar to that of the actual embankment dam. Experimental results clearly show that even if the compaction or strength of the embankment is high, structural defects, such as conduit cracks, can create a special environment wherein cavitation can occur. Cavitation is suggested as one of the causes that can lead to the failure of an embankment dam [19]. Generally, the causes of embankment accidents and failures are investigated, but they are difficult to specify because they are diverse. However, the results obtained in this study are considered important for the field of embankment dams, as cavitation due to conduit cracks was identified.
Consequently, Case 1—Cracks did not lead to the failure of the embankment, but the current model clearly showed that the cavitation risk due to the internal erosion of the embankment zone could be high once conduit cracks occur.
In the condition reinforced by a geomembrane (Case 1—Reinforcement), no soil loss or erosion occurred inside or outside the conduit, as shown in Figure 4a,b. However, a wide wet area in a loose state was observed on the downstream slope, as shown in Figure 4b. This indicates that the seepage line inside the embankment was formed on the top of the clay layer. These results show that the clay layer was functioning normally, but it should be noted that over a long period of time, structural defects occurred in the conduit, and a potential failure might form in the downstream slope.
Figure 5 and Figure 6 depict the leakage of soil into the conduit, the downstream slope, and the erosion of soil around the cracked area of the conduit. In the crack condition (Case 2—Crack), the amount of soil loss inside the conduit was markedly smaller than that in the current model (Case 1—Crack), as shown in Figure 5a. For the erosion area at the bottom of the conduit, the improvement model was found to have approximately 1.7 times less erosion than the current one; this proved it to be effective in reducing internal erosion. Meanwhile, locally wet areas were observed in the downstream slope, as shown in Figure 5b. This shows that the seepage water concentrated in the crack area of the conduit was partially dispersed in the sand layer. In contrast to Case 1—Crack, no cavitation was observed in the vicinity of the conduit in Case 2—Crack, despite the erosion inside the conduit, as shown in Figure 5c. These results are associated with the layers of sand and geotextiles in the cracked area of the conduit suppressing the erosion rates. Under the condition of geomembrane reinforcement (Case 2—Reinforcement), there was no loss of soil inside the conduit, and the area around it was stable against erosion, as shown in Figure 6a,c. In addition, on the downstream slope, the wet area decreased considerably, as the seepage water in the embankment was dispersed throughout the sand layer, as shown in Figure 6b.
The improvement model analyzed in this study used the combined effect of the sand and geotextile layers in the downstream slope to suppress cavitation, even in the presence of other structural defects (such as cracks in the piping). Therefore, it can be concluded that the improvement model is a reliable method to improve the safety of an embankment compared to the current method. Furthermore, applying the improvement model to the downstream slope is simple and does not require drilling, which can be a great advantage in terms of constructability.

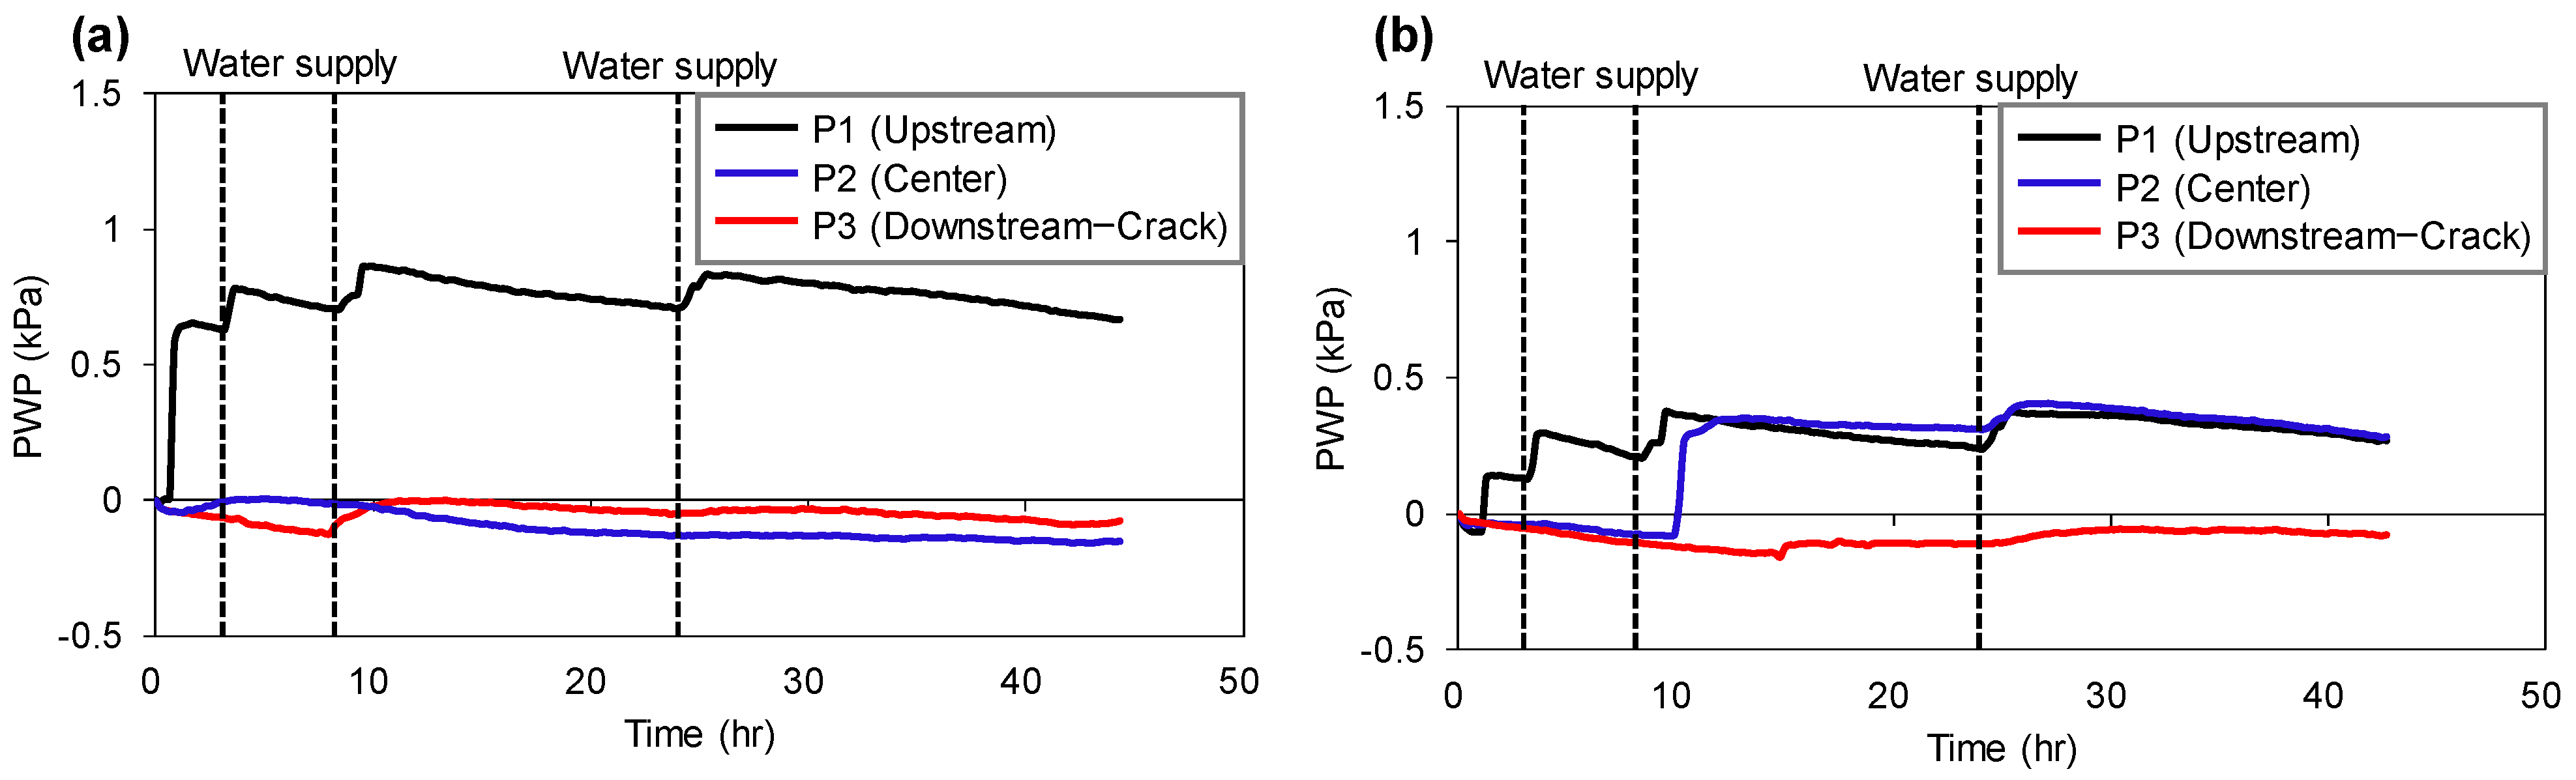
3.2. Pore Water Pressure Distribution: Model Experiment

The pore water pressure gauge was located at a height of 20 cm from the foundation, and when the measurement started, the model embankment was saturated. Therefore, this measurement result reveals a condition in which negative pore water pressure may occur, depending on the fluctuation condition of the water level. Figure 7 shows the change in pore water pressure in the current model and the improvement model when a crack occurs in the conduit on the downstream slope.
In Case 1—Crack, the upstream pore water pressure (P1) shows a continuous decrease, which indicates that the crack in the conduit was affected by leakage. The change in the downstream pore water pressure (P3) was insignificant because the leak from the conduit crack escaped to the lower part of the point where the pore water pressure gauge was installed, and the effect of the water pressure was not observed. This trend provided the same measurement results in all cases. In addition, the water pressure change was small at the center pore water pressure (P2). The results show that leakage was extensive in the downstream conduit cracks, and thus, the seepage water did not reach the pore pressure gauge located in the center of the embankment zone. The embankment cross-section with these conditions suggests that the risk of internal erosion around the downstream conduit crack area may increase because the seepage water proceeds at the conduit crack area.
In Case 2—Crack, the pore water pressure trends on both the upstream side (P1) and downstream side (P3) were similar to those of Case 1—Crack, but only the pore water pressure (P2) at the center side increased. The increase in the central pore water pressure (P2) indicates that water leakage is induced by the sand layer and geotextile installed on the downstream slope.
These results indicate that the sand layer and geotextile disperse the water pressure acting intensively on the conduit crack area and show that these additional layers are effective in reducing the risk of internal erosion by delaying the leakage’s velocity.

3.3. Seepage Line and Hydraulic Gradient: Numerical Analysis

3.3.1. Analysis Conditions

Seepage analysis in embankment dams provides useful information for estimating the influence of seepage behavior according to the shapes of substructures inside the embankment and the physical properties of their materials, water level conditions, and soil–water characteristic curve. In this study, three-dimensional transient analysis was conducted to identify the effects of conduit cracks and reinforced conduits on the embankment. Transient analysis provides information supporting the validity of experimental results by evaluating the erosion potential of the seepage line and the hydraulic gradient. The analysis was performed using the elastic model (Geotextile) and Mohr–Coulomb model (Clay, Embankment, Sand) of GTS NX 3D with the finite element method applied [20]. The dimensions, analysis parameters (Table 2), water level (H: 35 cm), and time boundary (1 day = 86,400 s) of the cross-section of the embankment dam were the same as those of the experimental model in this study. Additionally, the foundation of an impermeable layer was configured to allow the leak to flow only in the embankment zone due to cracks in the conduit. The mesh used Delaunay triangulation. The mesh size was about 0.03 m, and 357,027 elements were generated. Table 3 and Table 4 show the input parameters used for 3D transient analysis. The soil–water characteristic curves were applied to silty clay (clay layer), sandy clay (embankment zone), and sand (sand layer) based on the van Genuchten data [21]. At the present stage, only the cavitation potential in the experiment is presented, and cavitation modeling was not included in this analysis.

3.3.2. Change in Seepage Line

The seepage line was examined based on the conditions of fluctuations in the water level after 2, 3, 10, and 24 h to provide additional evidence for the experimental results of conduit cracking.
In Case 1—Crack (Figure 8a), the seepage line had a concave shape and was concentrated in the crack area of the conduit. This concave shape of the seepage line means that the leakage occurred in the conduit crack area and is considered a condition in which internal erosion can easily occur. Case 1—Reinforcement (Figure 8b) is a condition in which the crack area of the conduit is reinforced by the geomembrane, and the seepage line indicates a stable state, with the embankment functioning normally.
Figure 8c,d show the improvement model, in which the sand layer and geotextile were applied to minimize internal erosion in this study. The seepage line of Case 2—Crack (Figure 8c) was formed at the crack site of the conduit for the initial 3 h, but the seepage line dropped to the end of the downstream slope under the water level condition at 24 h. These results show that the model not only reduces erosion due to the promotion of drainage in the sand layer above the clay layer but also provides a useful function to stably drain the seepage water inside the embankment. Case 2—Reinforcement (Figure 8d) is the condition in which the crack area of the conduit was reinforced by the geomembrane in the improvement model. Unlike Case 1—Reinforcement, the seepage line of Case 2—Reinforcement appeared to gather at the end of the downstream slope under all of the time conditions (0–24 h), which was interpreted as the condition in which the embankment is in its most stable state. The seepage lines analyzed in this study are considered to be valid data that can support the reliability of the internal erosion results in the model experiments.

3.3.3. Change in Hydraulic Gradient

The initial stage of internal erosion depends on the relationship between the critical hydraulic gradient and the permeability coefficient of the soil [22,23], and it is known that the risk of piping increases under conditions in which internal erosion continues [24]. The hydraulic gradient for internal erosion is approximately one-fifth to one-third of the critical hydraulic gradient for soil stability, and a change in strength occurs at a hydraulic gradient of 0.5 or higher [25]. A stability evaluation to evaluate for the risk of internal erosion, as described above, has an important meaning, and the safety factor (Fs) calculated by the ratio of the critical hydraulic gradient and the exit hydraulic gradient is mainly used [26].
In this study, the critical hydraulic gradient (Icr) of the model embankment was 0.99. The relationship between the critical hydraulic gradient and a standard safety factor (Fs) value of 2.0 can ensure safety only when the calculated exit hydraulic gradient (Iexit) is less than approximately 0.5. In this study, based on the current model and the improvement model, the tendency of the hydraulic gradient was evaluated, and the hydraulic gradient for the reduction in internal erosion was analyzed numerically. Figure 9 shows the evaluation position of the exit hydraulic gradient at the boundary between the clay layer and the embankment layer on the downstream slope. Figure 10a,b show the comparison results of the hydraulic gradient over a period of time in the current model and the improvement model.
As shown in Figure 10a, Case 1—Crack (current model) had a hydraulic gradient in the range of 3.6–4.0 between the clay layer and the embankment zone and exceeded the safety conditions for the internal erosion suggested in this study. In the current model, if a crack occurs in a conduit, erosion may be inevitable regardless of fluctuations in the water level, and it was determined that the possibility of it developing into a piping phenomenon is high. Case 2—Crack (improvement model) had a hydraulic gradient of 0.42–0.44 and satisfied the safety conditions for internal erosion. Despite the small scale of the cross-section of the drainage layer in Case 2—Crack, the hydraulic gradient was reduced compared to Case 1—Crack; thus, the improvement model was confirmed to be effective for increasing the resistance to internal erosion.
In Figure 10b, Case 1—Reinforcement (the current model) was a condition in which the embankment zone and conduit functioned normally without structural faults; thus, the hydraulic gradient was small. The hydraulic gradient showed a tendency to increase gradually but satisfied the safety condition for internal erosion. In Case 2—Reinforcement (improvement model), the hydraulic gradient tended to be partially irregular, but there was no increase. These results are considered to indicate stability against internal erosion.
The hydraulic gradient results presented in this study are summarized as follows. As the hydraulic gradient calculated in the analysis has a wide range depending on the soil–water characteristics, physical properties of soil, and shape of the structure, the occurrence of piping cannot be guaranteed, even if the hydraulic gradient increases. However, because it can be an important indicator of anomalies that may cause the embankment to be unstable, the analytical approach has some rationality. In the improvement model, the sand layer suppresses the hydraulic gradient concentrated in the conduit crack area. Therefore, if the width and height of the sand layer are appropriately considered in the crack area of the conduit, internal erosion can be delayed. In addition, in terms of disaster reduction, it is expected that the risk of embankment failure due to piping can be reduced.

4. Conclusions

In this study, a large-scale model test and three-dimensional deformation–seepage analysis were performed to understand the effect of internal erosion due to conduit cracking on the stability of the embankment dam in the current design model. In addition, the reinforcement effect of the proposed improvement model, which aimed to reduce internal erosion, was evaluated, and its validity was discussed.
Under the cracking condition in a conduit, the current design method for conduits was evaluated as having a high risk of embankment failure due to the occurrence of cavitation with erosion near the cracked area. In the improvement model, which applies a layer of sand and geotextile, although erosion occurred, cavitation did not appear near the conduit. These results are related to the effect of the drainage layer dispersing the water pressure in the improvement model, indicating that the erosion velocity can be suppressed.
In the current model, as a result of reinforcing the cracked area of the conduit with a geomembrane, a wide saturation area in a loose state was observed on the downstream slope. Saturated areas on slopes near the conduit can increase the risk of disasters due to increased internal erosion in case of an emergency. The improvement model proposed in this study is expected to provide the embankment with additional stability compared to the current model because the saturation area of the downstream slope is greatly reduced.
The pore water pressure, hydraulic gradient, and seepage line investigated in this study are valid data that can support the results of internal erosion in this model experiment. These data explain the relationship between conduit cracks and the stability of the embankment and can be used as fundamental data for the reduction in internal erosion.
Despite the small crack scale of the conduit, piping may occur due to internal erosion under low water level conditions. The improvement model proposed in this study is a useful method that can improve the safety of the embankment compared to the current method because it can suppress the development of cavitation and piping, even if structural defects, such as cracks, occur in the conduit.

Author Contributions

Software, J.-H.R.; investigation, J.H. and J.-W.S.; writing—review and editing, Y.-H.L.; project administration, supervision, and conceptualization, D.-W.L. All authors have read and agreed to the published version of the manuscript.

Funding

This work was supported by the Basic Science Research Program through the National Research Foundation of Korea (NRF), funded by the Ministry of Education (grant no. 2019R1I1A3A01058517), and the National Research Foundation of Korea (NRF) grant funded by the Ministry of Science, ICT & Future Planning of the South Korean Government (grant no. 2019R1C1C1007100). In addition, this work was supported by the Korea Institute of Planning and Evaluation for Technology in Food, Agriculture and Forestry (IPET) through the Agricultural Infrastructure and Disaster Response Technology Development Project, funded by the Ministry of Agriculture, Food and Rural Affairs (MAFRA) (grant no. 320002-01).

Institutional Review Board Statement

Not applicable.

Informed Consent Statement

Not applicable.

Data Availability Statement

The study did not report any data.

Acknowledgments

We would like to thank the Rural Research Institute and Korea Rural Community Corporation for their support (data and administrative) to prevent disasters caused by cracks in conduits.

Conflicts of Interest

The authors declare no conflict of interest.

References

  1. Skempton, A.W. Embankments and cuttings on the early railways. Constr. Hist. 1996, 11, 33–49. [Google Scholar]
  2. Coleman, S.E.; Andrews, D.P.; Grant Webby, M.G. Overtopping breaching of noncohesive homogeneous embankments. J. Hydraul. Eng. 2002, 128, 829–838. [Google Scholar] [CrossRef]
  3. Fell, R.; Wan, C.F.; Cyganiewiewicz, J.; Foster, M. Time for development of erosion and piping in embankment dams. J. Geotech. Geoenviron. Eng. 2003, 129, 307–314. [Google Scholar] [CrossRef]
  4. Flores-Berrones, R.; Ramírez-Reynaga, M.; Jose Macari, E. Internal erosion and rehabilitation of an earth-rock dam. J. Geotech. Geoenviron. Eng. 2011, 137, 151–160. [Google Scholar] [CrossRef]
  5. Fox, G.A.; Felice, R.G.; Midgley, T.L.; Wilson, G.V.; Al-Madhhachi, A.T. Laboratory soil piping and internal erosion experiment: Evaluation of a soil piping model for low-compacted soils. Earth Surf. Process. Landf. 2014, 39, 1137–1145. [Google Scholar] [CrossRef]
  6. Lee, D.W.; Noh, J.J. Behavior of failure on agricultural reservoirs embankment by riprap reinforcement method. J. Korean Soc. Agric. Eng. 2014, 56, 63–73. (In Korean) [Google Scholar]
  7. Lee, Y.H.; Lee, T.H.; Lee, D.W. Overtopping model experiments and 3-D seepage characteristics of the embankment of deteriorated homogeneous reservoirs. J. Korean Soc. Agric. Eng. 2019, 61, 13–23. (In Korean) [Google Scholar]
  8. Ngambi, S.; Nakano, R.; Shimizu, H.; Nishimura, S. Cause of leakage along the outlet conduit underneath a low fill dam with special reference to hydraulic fracturing. Trans. Jpn. Soc. Irrigation Drain. Reclam. Eng. 1997, 188, 263–272. [Google Scholar]
  9. Tran, D.Q.; Nishimura, S.; Senge, M.; Nishiyama, T. Research on cause of dam failure from viewpoint of hydraulic fracturing—Case study of a dam failure in Vietnam. Int. J. GEOMATE 2018, 14, 86–94. [Google Scholar] [CrossRef]
  10. Tran, D.Q.; Nishimura, S.; Senge, M.; Nishiyama, T. Effects of culvert shapes on potential risk of hydraulic fracturing adjacent to culverts in embankment dams. Int. J. GEOMATE 2018, 15, 38–44. [Google Scholar] [CrossRef]
  11. Wan, C.F.; Fell, R. Investigation of rate of erosion of soils in embankment dams. J. Geotech. Geoenviron. Eng. 2004, 130, 373–380. [Google Scholar] [CrossRef]
  12. Korea Rural Community Corporation (KRC). Report on the Failure of the Embankment of the Angang Sandae Reservoir; Report of Korea Rural Community Corporation; KRC: Naju-si, Korea, 2013. (In Korean) [Google Scholar]
  13. Ministry of Agriculture, Food and Rural Affairs (MAFRA). Agricultural Infrastructure Design Standards; MAFRA: Sejong, Korea, 2002. (In Korean) [Google Scholar]
  14. Cesare, J.A.; Brauer, D.J. Pinery Dam Outlet Conduit Repair, Biennial Geotechnical Symposium 2004. 26 April 2012. Available online: https://doi.org/10.1061/40758(151)13 (accessed on 6 December 2021).
  15. Federal Energy Regulatory Commission (FERC). Guidelines for Drilling in and near Embankment Dams and Their Foundations, Version 3.1; Division of Dam Safety and Inspections; FERC: Washington, DC, USA, 2016. [Google Scholar]
  16. US Army Corps of Engineers (USACE). Engineering and Design—Drilling in Earth Embankment Dams and Levees; ER 1110-1-1807; USACE: Washington, DC, USA, 2014. [Google Scholar]
  17. Lee, Y.H.; Park, S.Y.; Tokida, K.I.; Lee, D.W. Three-dimensional seepage characteristics of reservoir embankment considering interval of horizontal filter. Int. J. Offshore Polar Eng. 2018, 28, 80–86. [Google Scholar] [CrossRef]
  18. Foster, M.A.; Fell, R.; Spannagle, M. The statistics of embankment dam failures and accidents. Can. Geotech. J. 2000, 37, 1000–1024. [Google Scholar] [CrossRef]
  19. Federal Emergency Management Agency (FEMA). Technical Manual: Conduits through Embankment Dams: Best Practices for Design, Construction, Problem Identification and Evaluation, Inspection, Maintenance, Renovation, and Repair; FEMA: Washington, DC, USA, 2005. [Google Scholar]
  20. MIDAS IT. Midas Geotechnical and Tunnel Analysis System (Midas GTS). 2020. Available online: https://www.midasgeotech.com/blog/tag/geotechnical-engineering (accessed on 20 October 2020).
  21. Carsel, R.F.; Parrish, R.S. Developing joint probability distributions of soil water retention characteristics. Water Resour. Res. 1988, 24, 755–769. [Google Scholar] [CrossRef] [Green Version]
  22. Ojha, C.S.P.; Singh, V.P.; Adrian, D.D. Influence of porosity on piping models of levee failure. J. Geotech. Geoenviron. Eng. 2001, 127, 1071–1074. [Google Scholar] [CrossRef]
  23. Ojha, C.S.P.; Singh, V.P.; Adrian, D.D. Determination of critical head in soil piping. J. Geotech. Geoenviron. Eng. 2003, 129, 511–518. [Google Scholar] [CrossRef]
  24. United States Society on Dams (USSD). The Aging of Embankment Dams. 2010. Available online: https://www.ussdams.org/wp-content/uploads/2016/05/aging.pdf (accessed on 20 October 2020).
  25. Ke, L.; Takahashi, A. Strength reduction of cohesionless soil due to internal erosion induced by one-dimensional upward seepage flow. Soils Found. 2012, 52, 698–711. [Google Scholar] [CrossRef] [Green Version]
  26. Terzaghi, K.; Peck, R.B. Soil Mechanics in Engineering Practice, 2nd ed.; John Wiley and Sons, Inc.: New York, NY, USA, 1967; p. 729. [Google Scholar]
Figure 1. Experimental model and measurement location.
Applsci 12 00567 g001
Figure 2. Comparison between conduit models: (a) current model, (b) proposed improvement model.
Applsci 12 00567 g002
Figure 3. Crack conditions in current model (Case 1—Crack): (a) soil particle loss inside conduit, (b) surface conditions of downstream slope, (c) erosion in near-conduit-filling zone.
Applsci 12 00567 g003
Figure 4. Reinforcement condition of current model (Case 1—Reinforcement): (a) no loss of soil particles inside conduit, (b) formation of wide wet area outside the conduit, (c) reinforced crack area using membrane.
Applsci 12 00567 g004
Figure 5. Crack conditions in the improved model (Case 2—Crack): (a) modest loss of soil particles in the conduit, (b) sand and geotextile layers in the downstream slope, and (c) minimal soil loss near the conduit-filling zone.
Applsci 12 00567 g005
Figure 6. Reinforced conditions of improvement model (Case 2—Reinforcement): (a) zero loss of soil particles due to reinforced geomembrane, (b) reduced wet area in the downstream slope, and (c) stability against erosion in the filling zone near the conduit.
Applsci 12 00567 g006
Figure 7. Changes in pore water pressure due to conduit cracking: (a) current model (Case 1—Crack), (b) improvement model (Case 2—Crack).
Applsci 12 00567 g007
Figure 8. Changes in seepage line in current and improvement models: (a) Case 1—Crack, (b) Case 1—Reinforcement, (c) Case 2—Crack, (d) Case 2—Reinforcement.
Applsci 12 00567 g008
Figure 9. Location of hydraulic-gradient evaluation.
Applsci 12 00567 g009
Figure 10. Time histories of variations in hydraulic gradients under (a) crack and (b) reinforcement conditions.
Applsci 12 00567 g010
Table 1. Physical and mechanical properties of samples used in the model.
Sample G s P I
(%)
W o p t
(%)
γ m a x
(kN/m3)
c
(kPa)
° k v
(m/s)
USCS
Clay layer2.768.6-13.6629.4303.70 × 10−9CL
Embankment2.659.28.617.7516.70242.37 × 10−7SC
Sand layer2.65NP12.717.000337.82 × 10−4SP
Geotextile------1.00 × 10⁻³-
G s = specific gravity, P I = plasticity index, W o p t = optimum moisture content, γ m a x = maximum dry density, c = cohesion, ∅° = internal friction angle, kv = coefficient of permeability, USCS = unified soil classification system.
Table 2. Experimental cases for the current model and the improvement model.
ModelCase NumberCrack Location of
Conduit
Section
Location
Current modelCase 1—CrackDownstream sideSection A
Case 1—Reinforcement--
Improvement modelCase 2—CrackDownstream sideSection A
Case 2—Reinforcement--
Table 3. Parameters used in analysis.
Sampleν e 0 c
(kPa)
° k x
(m/s)
Clay layer0.400.9829.4303.70 × 10−9
Embankment0.350.4816.70242.37 × 10−7
Sand layer0.330.500337.82 × 10−4
Geotextile0.30---1.00 × 10⁻³
ν = Poisson’s rate, e 0   = initial void ratio, c = cohesion, ∅° = internal friction angle, k x = horizontal coefficient of permeability.
Table 4. Parameters of the soil–water characteristic curve used in the analysis.
Sample θ s θ r α n m ( 1 1 / n )
Clay layer0.380.0070.81.090.083
Embankment0.460.0341.61.370.270
Sand layer0.430.04514.52.680.627
θ r   = residual water content, θ s   = saturated water content, α ,   n ,   m   = curve fitting parameters.
Publisher’s Note: MDPI stays neutral with regard to jurisdictional claims in published maps and institutional affiliations.

