Article

Study on Vertically Distributed Aerosol Optical Characteristics over Saudi Arabia Using CALIPSO Satellite Data

1
Engineering Research Center of Environmental Laser Remote Sensing Technology and Application of Henan Province, Nanyang Normal University, Wolong Road No. 1638, Nanyang 473061, China
2
Key Laboratory of Natural Disaster and Remote Sensing of Henan Province, Nanyang Normal University, Wolong Road No. 1638, Nanyang 473061, China
3
College of Civil Engineering, Nanjing Forestry University, Nanjing 210037, China
4
Henan School of Surveying and Land Information Engineering, Henan Polytechnic University, Jiaozuo 454000, China
5
School of Marine Sciences, Nanjing University of Information Science & Technology, Nanjing 210044, China
6
Department of Ecology and Water Resources Management, Tashkent Institute of Irrigation and Agricultural Mechanization Engineers, Tashkent 100000, Uzbekistan
7
Department of Civil Engineering, College of Engineering, King Khalid University, Abha 61421, Saudi Arabia
8
Department of Civil Engineering, High Institute of Technological Studies, Mrezgua University Campus, Nabeul 8000, Tunisia
*
Author to whom correspondence should be addressed.
Appl. Sci. 2022, 12(2), 603; https://doi.org/10.3390/app12020603
Submission received: 26 September 2021 / Revised: 11 December 2021 / Accepted: 27 December 2021 / Published: 9 January 2022

Abstract

:
The optical characteristics of vertically distributed aerosols over Saudi Arabia were investigated using the Cloud-Aerosol Lidar and Infrared Pathfinder Satellite Observation (CALIPSO) data from 2007 to 2019. The study region was divided into three parts (Region I: Tabuk, Makkah, Al Madinah, Asir, Al Bahah, Jizan, Riyadh, Mecca, Medina, the eastern region, Kassim, Hale, Asir, Baha, Tabuk, the northern border region, Jizan, Najilan, and Jufu. Region II: Ar, Al, Ha, Al, and Najran. Region III Al Hudud ash Shamaliyah and Ash Sharqiyah) to understand regional aerosol characteristics by performing interannual and seasonal analysis for nine aerosol types during the day and nighttime. We found that the aerosol optical depth (AOD) estimates were the highest over eastern Saudi Arabia (region III) and were seemingly driven by the presence of an expansive desert in the region. As anticipated, the AOD observations were substantially higher in spring and summer than in autumn and winter owing to the frequent occurrence of dust events during the former. Daytime observations exhibited higher AOD values than those at nighttime, which might be related to higher daytime anthropogenic activities. The estimates of the base height of the lowest aerosol layer (HB1) and the top altitude of the highest aerosol layer (TAH) were altered depending on the topography (the higher the altitude, the higher the annual mean value of HB1 and TAH). The aerosol layers (N) were relatively abundant over region III, seemingly due to the relatively stronger atmospheric convection over this region. The volume depolarization ratio of the lowest aerosol layer (VDR1) was considerable during the night due to deposition at nighttime, and VDR1 was relatively substantial in spring and summer. The color ratio of the lowest aerosol layer (CR1) estimates over regions II and III was higher at night. We report a weak positive correlation between the thickness of the lowest aerosol layer (HTH1) and the AOD of the lowest aerosol layer (AOD1) in the three regions, a strong positive correlation between TAH and N, and a negative correlation between the AOD proportion of the lowest aerosol layer (PAOD1) and N in Saudi Arabia. In this paper, the optical and physical properties of aerosols in Saudi Arabia have been studied for 13 years. Our results could provide references for researchers and the government, and relevant departments with data support on the aerosol layer to help control air pollution in Saudi Arabia.

1. Introduction

Atmospheric aerosols are characterized as solid and liquid suspended particles, forming a relatively unstable suspension system in the atmosphere [1,2,3]. Aerosol particles range in size across five orders of magnitude, from 0.001–100 µm, and exhibit complex and diverse morphologies [4,5]. Aerosols affect the formation and distribution of clouds in the atmosphere by scattering and absorbing solar radiation, thus directly affecting the energy balance of climate [6,7,8] Apart from their impact on the climate, aerosols also significantly impact the air quality and human health, as they can contribute to the production of photochemical smog, haze, and acid rain. Prolonged exposure to adverse atmospheric conditions with excessive concentration of aerosols (especially particulate matter PM2.5 particles) increases the risk of the development of lung and respiratory diseases [9,10,11,12].
The aerosol distribution strongly varies in time and space, while the mechanism of their climate effects is complex and uncertain, thus necessitating studies on the variability of aerosol optical and physical properties [1,13,14,15,16]. Therefore, long-term observations and analysis of aerosols are the key tools for a comprehensive understanding of aerosol characteristics [17,18,19,20]. Concurrently, they can deepen scientific understanding of aerosol environmental effects and may help provide theoretical support for the institutions and agencies to aid the introduction of environmental protection policies.
Presently, data on aerosol optical properties are mainly retrieved through ground measurements and satellite observations. Ground measurements are mostly performed through a solar photometer network, such as the Global Aerosol Sun Photometer Monitoring Network (AERONET) established by NASA providing global aerosol observation data, and the ground-based aerosol observation network established by China (CARSNET) providing aerosol observation data in China. The scientific community has published a plethora of studies on the basic characteristics of aerosols whose data have been retrieved using high-resolution sun photometer-based observations from AERONET and CARSNET [21,22,23,24,25,26]. However, due to the limited number of ground measurement sites, data on the large-scale aerosol distribution characteristics cannot be obtained. Satellite observations can alleviate the deficiency of ground observations by providing larger spatial coverage of aerosol data. These datasets help establish a basis for studying aerosol optical properties at a global scale. For instance, the high-frequency moderate resolution imaging spectroradiometer (MODIS) carried by the Terra and Aqua satellites launched by NASA has enabled the monitoring of global aerosol optical properties [13,22,27]. Although satellites have many advantages over ground stations, the accuracy of satellite data is slightly lower than that of ground stations [10,26,28].
NASA also launched the active remote sensing instrument on-orbit initiated Cloud-Aerosol Light Detection And Ranging and Infrared Pathfinder Satellite Observation (CALIPSO) mission initiated in 2006 [20]. The Cloud-Aerosol Lidar with orthogonal polarization (CALIOP) consists of an active optical remote sensing sensor with a dual-wavelength polarization channel. CALIOP is used to continuously monitor aerosols with high spatio-temporal resolution and to provide a high-resolution vertical profile of aerosol properties. Overall, CALIOP is used to obtain the three-dimensional spatial and temporal information of the vertical distribution of aerosols, along with their optical and microphysical characteristics [16,29,30,31]. It is essential to study the large-scale three-dimensional distribution of physical and aerosol optical properties to quantify the aerosols’ direct and indirect effects.
In Saudi Arabia, economic and industrial development has led to an increase in anthropogenic emissions and has enhanced the aerosol concentration [32]. Moreover, a considerable portion of its territory comprises deserts and semi-deserts, which predetermines an increased intensity of exposure to the atmospheric aerosols that critically affect the life and health of its residents [15,18,33,34,35,36]. There is no effective way to prevent and/or reduce the negative social impacts of atmospheric aerosols in Saudi Arabia. Owing to this reason, the spatiotemporal variations of aerosols are not explicitly quantified. Presently, there are relatively fewer studies available on the optical properties of aerosols in Saudi Arabia based on ground measurements and satellite observations. The AOD trend over Saudi Arabia has been mainly studied using long-term MODIS and AERONET data [17,37,38,39,40,41,42,43,44].
Sabetghadam et al. [45] examined the seasonal variations and characteristics of aerosol emissions over the Middle East areas. They showed that the area with the highest AOD value (i.e., large aerosols) during spring and summer, and this was attributed to the coarse particles emitted from the desert in this area as a predominant factor. Khan Alam et al. [46] studied the seasonal distribution of AOD in the Arabian Peninsula, Middle East, and Central Asia and concluded that AOD values were significantly higher in spring and summer, as the sandstorms in Saudi Arabia, Iraq, Iran, and southwest Pakistan were more frequent in spring and summer than in autumn and winter. Moreover, precipitation during the colder months can help remove aerosols, thus lowering AOD. Sabetghadam et al. [45] also computed the average AOD value based on their retrievals in the Middle East from 2001 to 2019. The AOD ranged ranges between 0.0 and 1.7 over the different geographical locations. The highest AOD was mainly observed in spring and summer, whereas the lowest AOD was mainly detected in autumn and winter.
A comprehensive understanding of the impact of aerosols on climate and urban air quality depends on a systematic, accurate quantification of the physical, chemical, and optical properties of aerosols with their spatiotemporal and vertical distributions. According to the literature, there are limited studies available on the vertical distribution of different aerosol layers over Saudi Arabia during the day and nighttime. Therefore, this study analyzed the vertical distribution of the optical and physical characteristics of daytime and nighttime aerosols over Saudi Arabia from 2007 to 2019 using CALIOP Level 2 Version 4 aerosol layer products. The results of this study will advance the ability to predict atmospheric aerosols, thus aiding the formulation of strategies for the improvement in the air quality in Saudi Arabia.

2. Study Area and Methodology
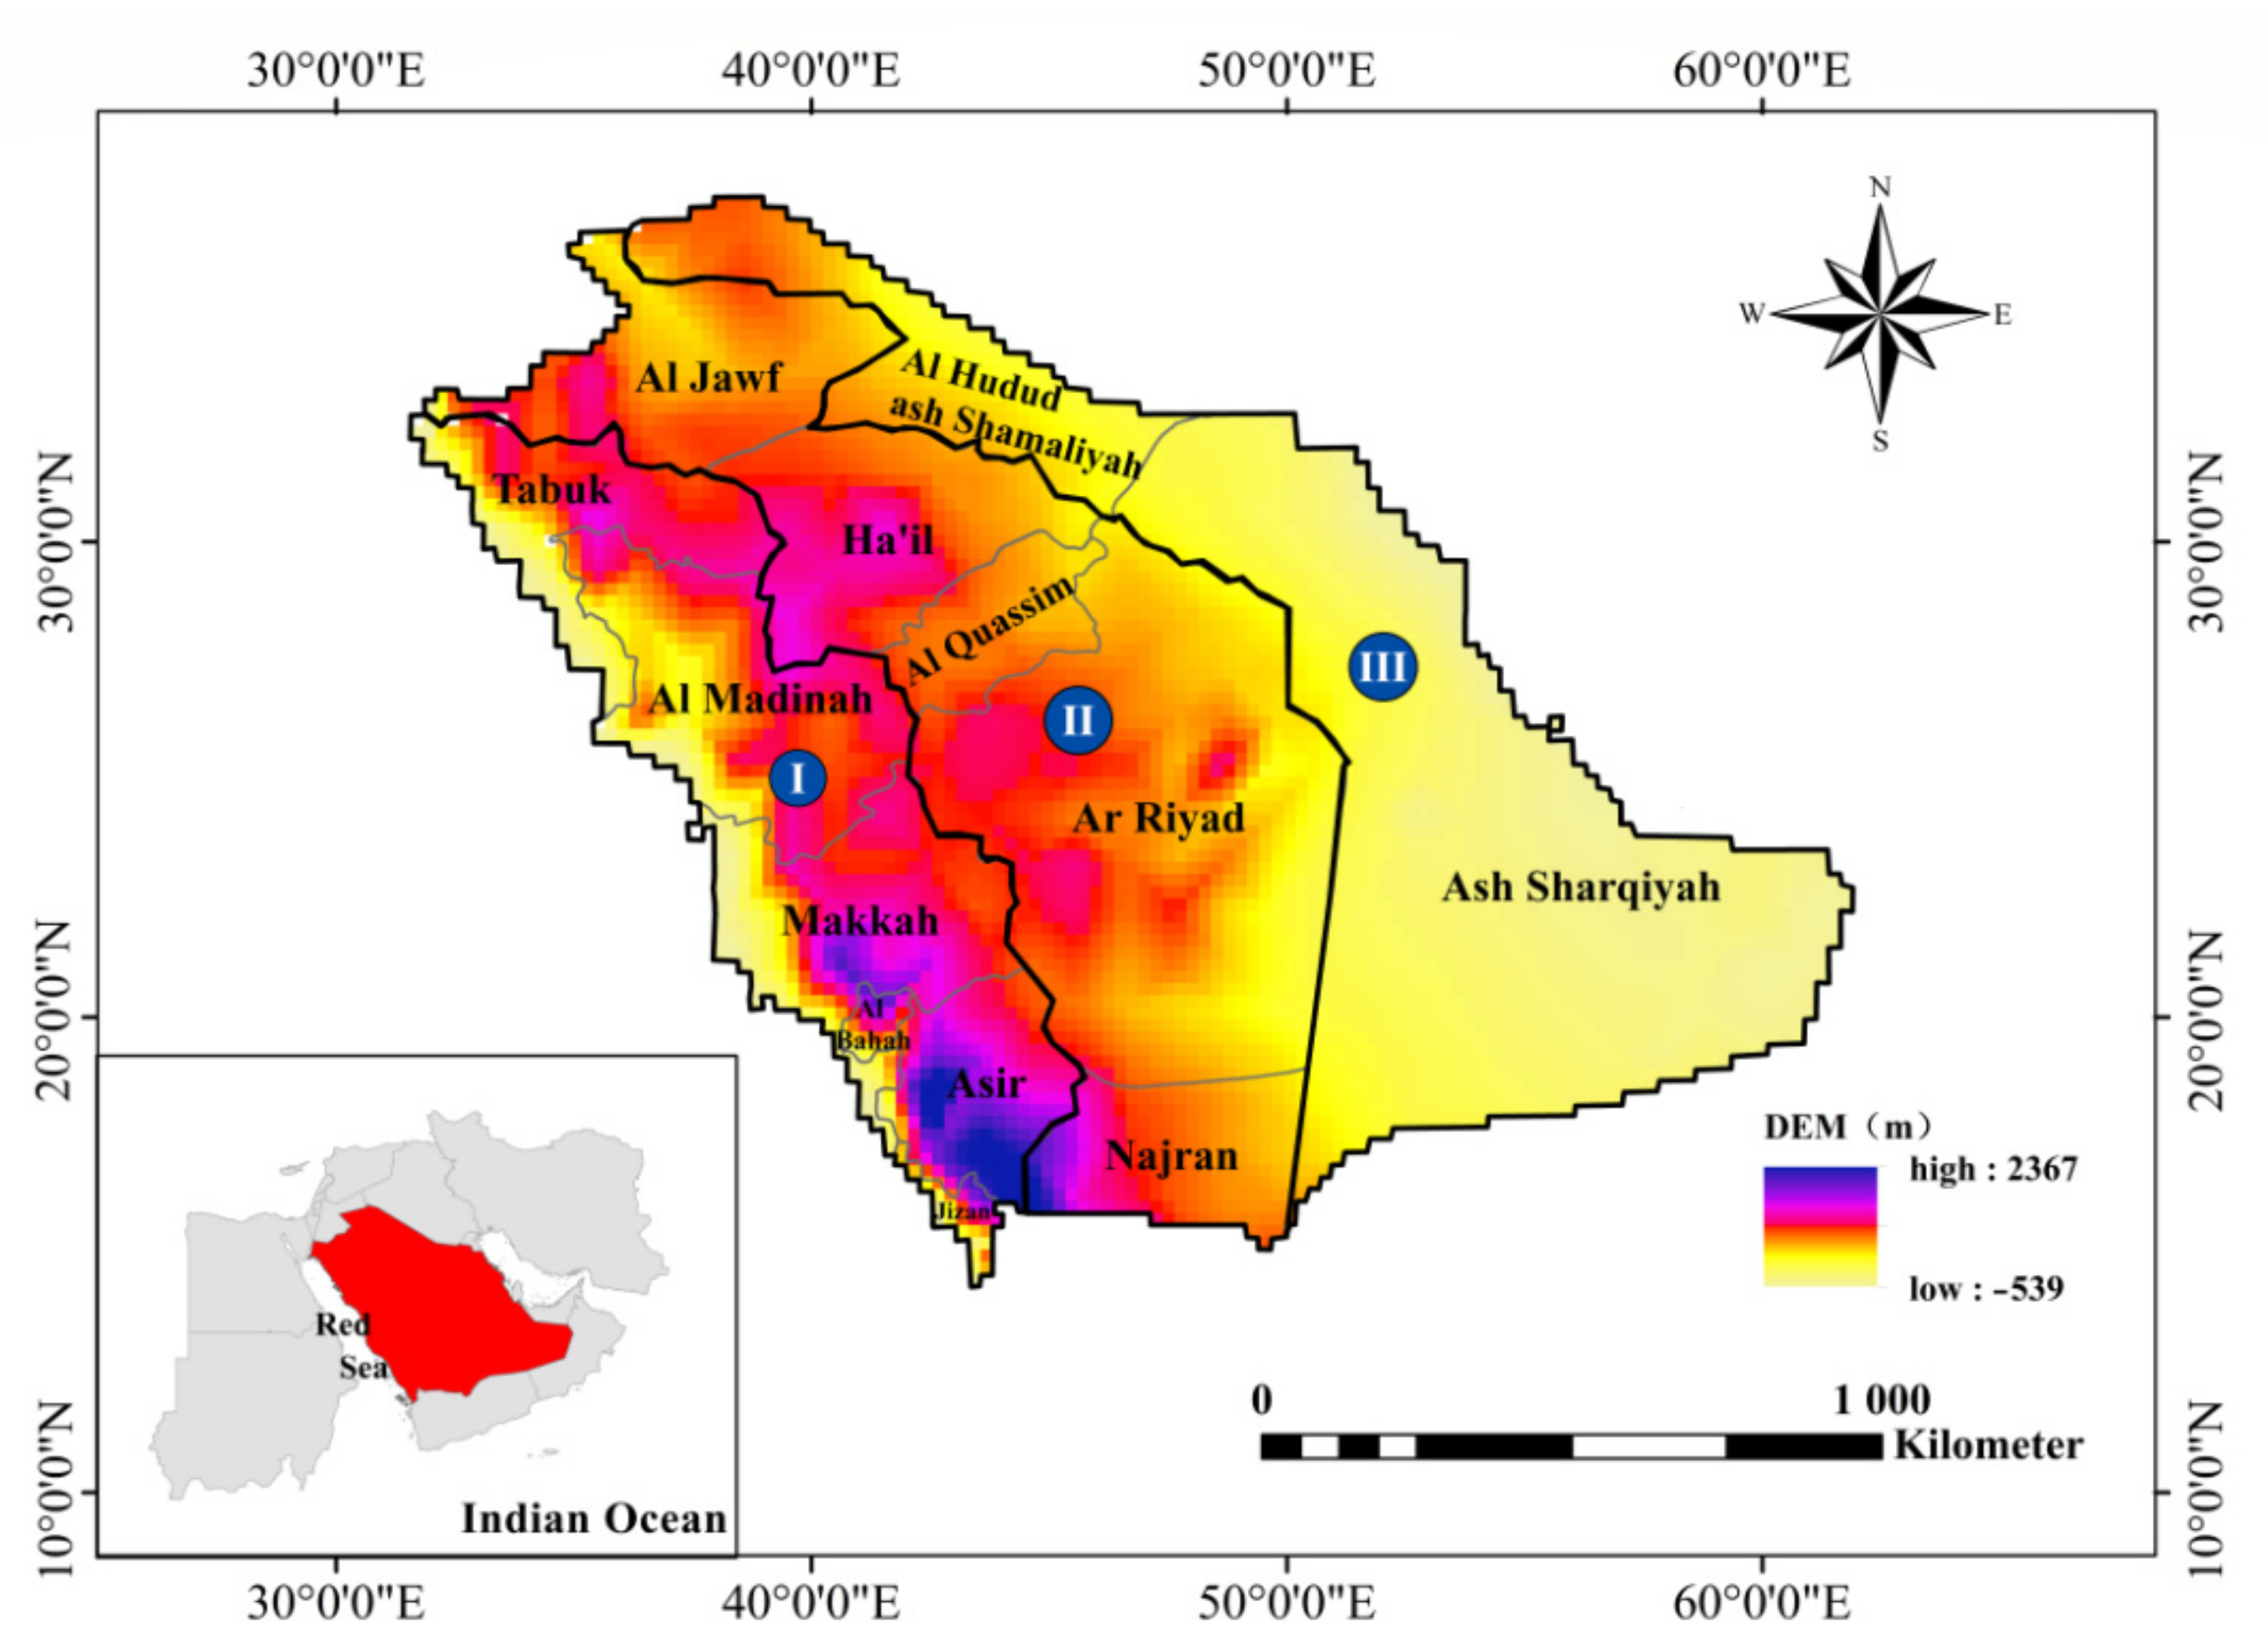
2.1. Study Area

Saudi Arabia is the largest country in the Arabian Peninsula (Figure 1), covering an area of 2.25 million km2. The topography of Saudi Arabia is high in the west and low in the east, and a considerable portion of the territory is a plateau. The coast of the Red Sea in the west is a long and narrow plain, and to the east is Mount Serat. To the east of the mountain, the topography is gradually lowered until the eastern plain. There are multiple deserts in Saudi Arabia, including the Great Nefd Desert in the north and the Rub al-Khali Desert in the south. The western plateau of Saudi Arabia features a Mediterranean climate, while the other areas have a tropical desert climate. The summer is hot and dry, and the highest temperature can exceed 50 °C. The winter climate is mild, and the annual average rainfall does not exceed 200 mm [47]. The country consists of 13 districts, including Tabuk, Makkah, Al Madinah, among others, with a total of 104 cities, of which the largest 20 cities present with a population of over 100,000 inhabitants [32].

2.2. Materials and Methods

Presently, CALIPSO is used to obtain high-resolution and vertically-resolved global aerosol vertical distribution data [48] that counter the lack of or low frequency of aviation flight measurements or airborne radar detection. Furthermore, CALIPSO helps establish the basis for analyzing the spatiotemporal variations of aerosols and the physical mechanisms involved in the occurrence of pollution events.
CALIPSO is an Earth-observing satellite project initiated and executed by NASA’s Langley Research Center (LARC) and the National Space Research Center of France in 2006. It orbits the Earth at 705 km altitude, 1.55°, and 96 min orbital parameters, respectively, for 16 days to retrieve data on a three-dimensional distribution of the cloud and aerosol layers around the globe [49].
The CALIOP lidar is a key instrument of the CALIPSO satellite as it provides polarization backscattering vertical profile data for clouds and aerosols between south and north latitude 82° on a 532 nm channel and attenuation scattering vertical profile data on a 1064 nm channel [30,31]. CALIOP can be used to accurately reconstruct the vertical distribution of clouds and aerosols as well as to quantify their size, irregularity, and type of aerosol particles, by considering vertically resolved backscattering coefficients with high resolution. Notably, CALIOP is free from surface interference and it is used to measure both during daytime and nighttime [20,50,51]. CALIOP’s data quality is limited by its signal-to-noise ratio (SNR). At night, the SNR is high and the data quality is good, while during the day, the interference from solar radiation reduces the SNR and causes the data quality to be slightly poor [52,53]. Overall, CALIPSO measurements are advantageous for studying the vertical profiling and transport mechanisms of aerosols.
CALIOP data is made available on multiple levels (Level 4, Level 3, Level 2, Level 1B, Level 1A, and Level 0). We used Level 2 data products in this study. Level 2 data products provide stratigraphic, profiling, vertical characteristic, and layer distribution characteristic information on aerosols and clouds. For analysis of the vertical optical and physical properties of the aerosol layer, the variability of a few aerosol characteristics was analyzed. The sum of the AOD derived from all aerosol layers (AODS, Equation (1)), AOD of the lowest aerosol layer (AOD1, N = 1 in Equation (2), δ is the value of AOD of different heights), the top height of the lowest aerosol layer (HT1), the base height of the lowest aerosol layer (HB1), top altitude of the highest aerosol layer (TAH), number of aerosol feature layers (N), AOD proportion of the lowest aerosol layer (PAOD1), volume depolarization ratio of the lowest aerosol layer (VDR1), and the color ratio of the lowest aerosol layer (CR1) were analyzed.
AOD S = 1 N AOD N ;     N = 1 , 2 , · · · , 7 , 8
AOD N = H B N H T N δ z d z ;     N = 1 , 2 , · · · , 7 , 8
The HTH1 indicates the thickness of the lowest aerosol layer, which is determined by the top height of the lowest aerosol layer (HT1) and the base height of the lowest aerosol layer (HB1). The abbreviations of aerosol optical physical parameters in this paper are shown in Table 1.
According to the location of the various regions of Saudi Arabia, the 13 provinces were divided from west to east into three regions in this study. Figure 1 illustrates the distribution of the study area. Region I comprises six provinces such as Tabuk, Makkah, Al Madinah, Asir, Al Bahah, Jizan, Riyadh, Mecca, Medina, the eastern region, Kassim, Hale, Asir, Baha, Tabuk, the northern border region, Jizan, Najilan, and Jufu. Region II includes five areas: Ar, Al, Ha, Al, and Najran. Region III includes two areas, namely Al Hudud ash Shamaliyah and Ash Sharqiyah. This partitioning method also divides Saudi Arabia into three regions: eastern (Region III), central (Region II), and western (Region I), which is convenient for studying the regional characteristics of aerosols over Saudi Arabia. In this study, we used the dataset on cloud-free conditions (30%) for day and night, and only the highest quality (uncertainty ≤ 3) was considered, null values and the values less than or equal to zero were eliminated, while the remaining data were resampled to a 1° × 1° grid, and the vector mask file of the study area was used to crop out the data of the study area. The dataset includes the Saudi regions I, II, and III under cloud-free daytime and nighttime conditions. To study seasonal changes, the data were divided into four seasons (spring: March, April, and May (MAM); summer: June, July, and August (JJA); autumn: September, October, and November (SON), and winter: December, January, and February (DJF)). A 12-month estimate was utilized to study the annual changes. From 2007 to 2019, several parameters of Saudi Arabia’s aerosol layer during the daytime and nighttime were calculated based on the annual and seasonal averages. The interannual and seasonal variation characteristics of the physical and optical properties of the aerosol layer in the three regions of Saudi Arabia were compared and statistically analyzed. At the same time, the correlation between aerosol parameters is analyzed, to better understand the temporal and spatial distribution characteristics of aerosols in Saudi Arabia.

3. Results and Discussion

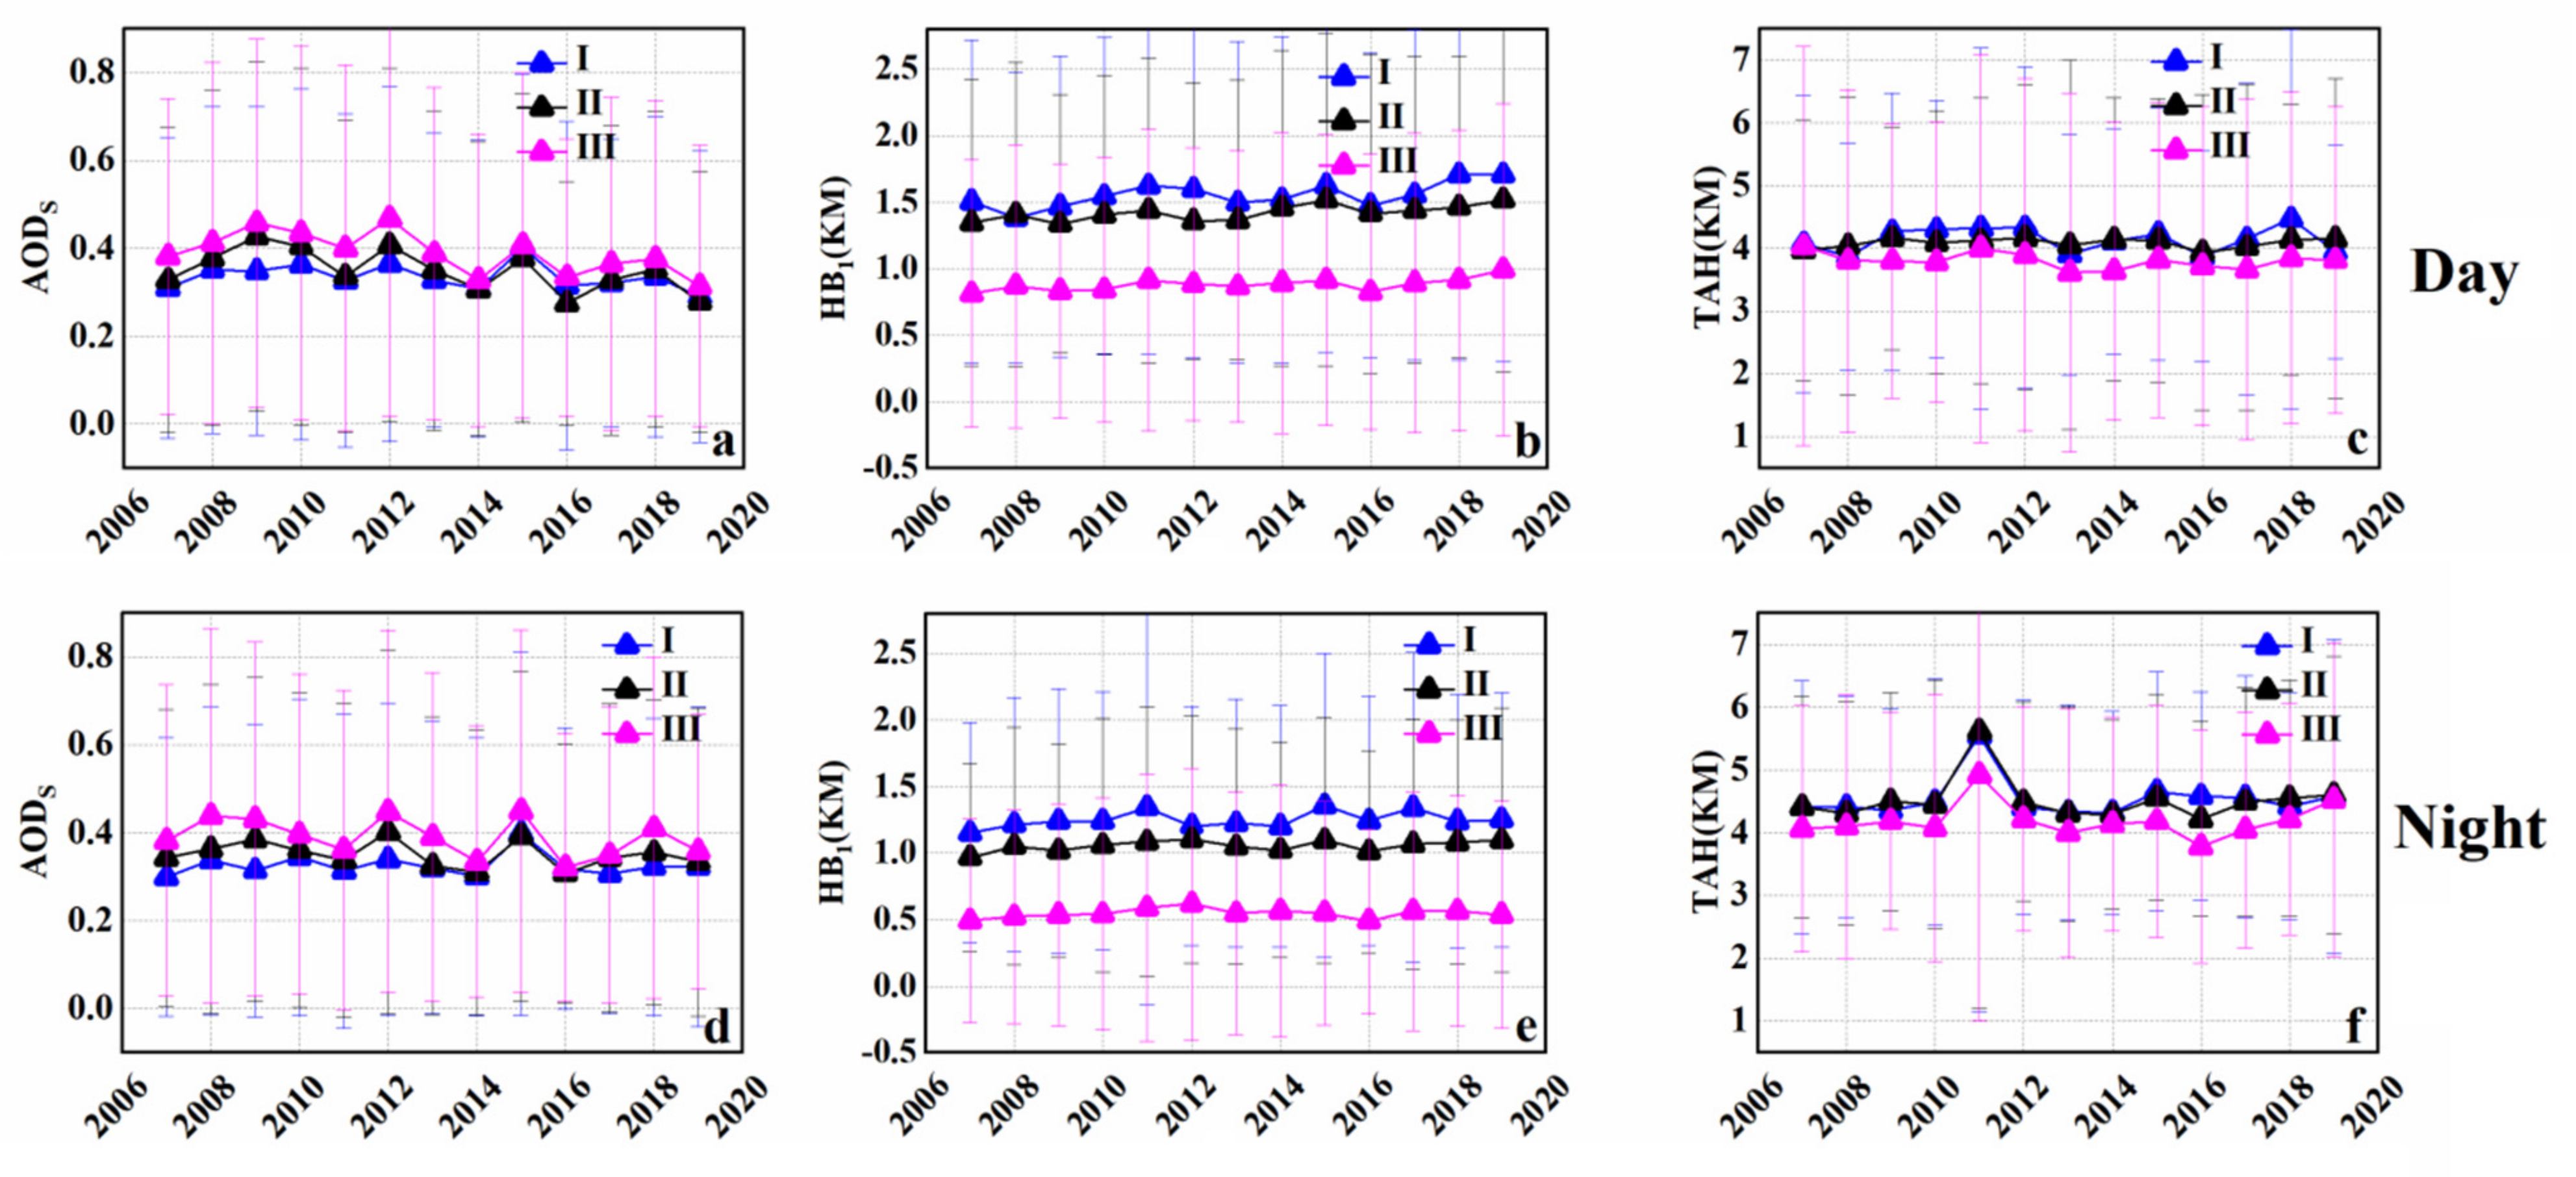
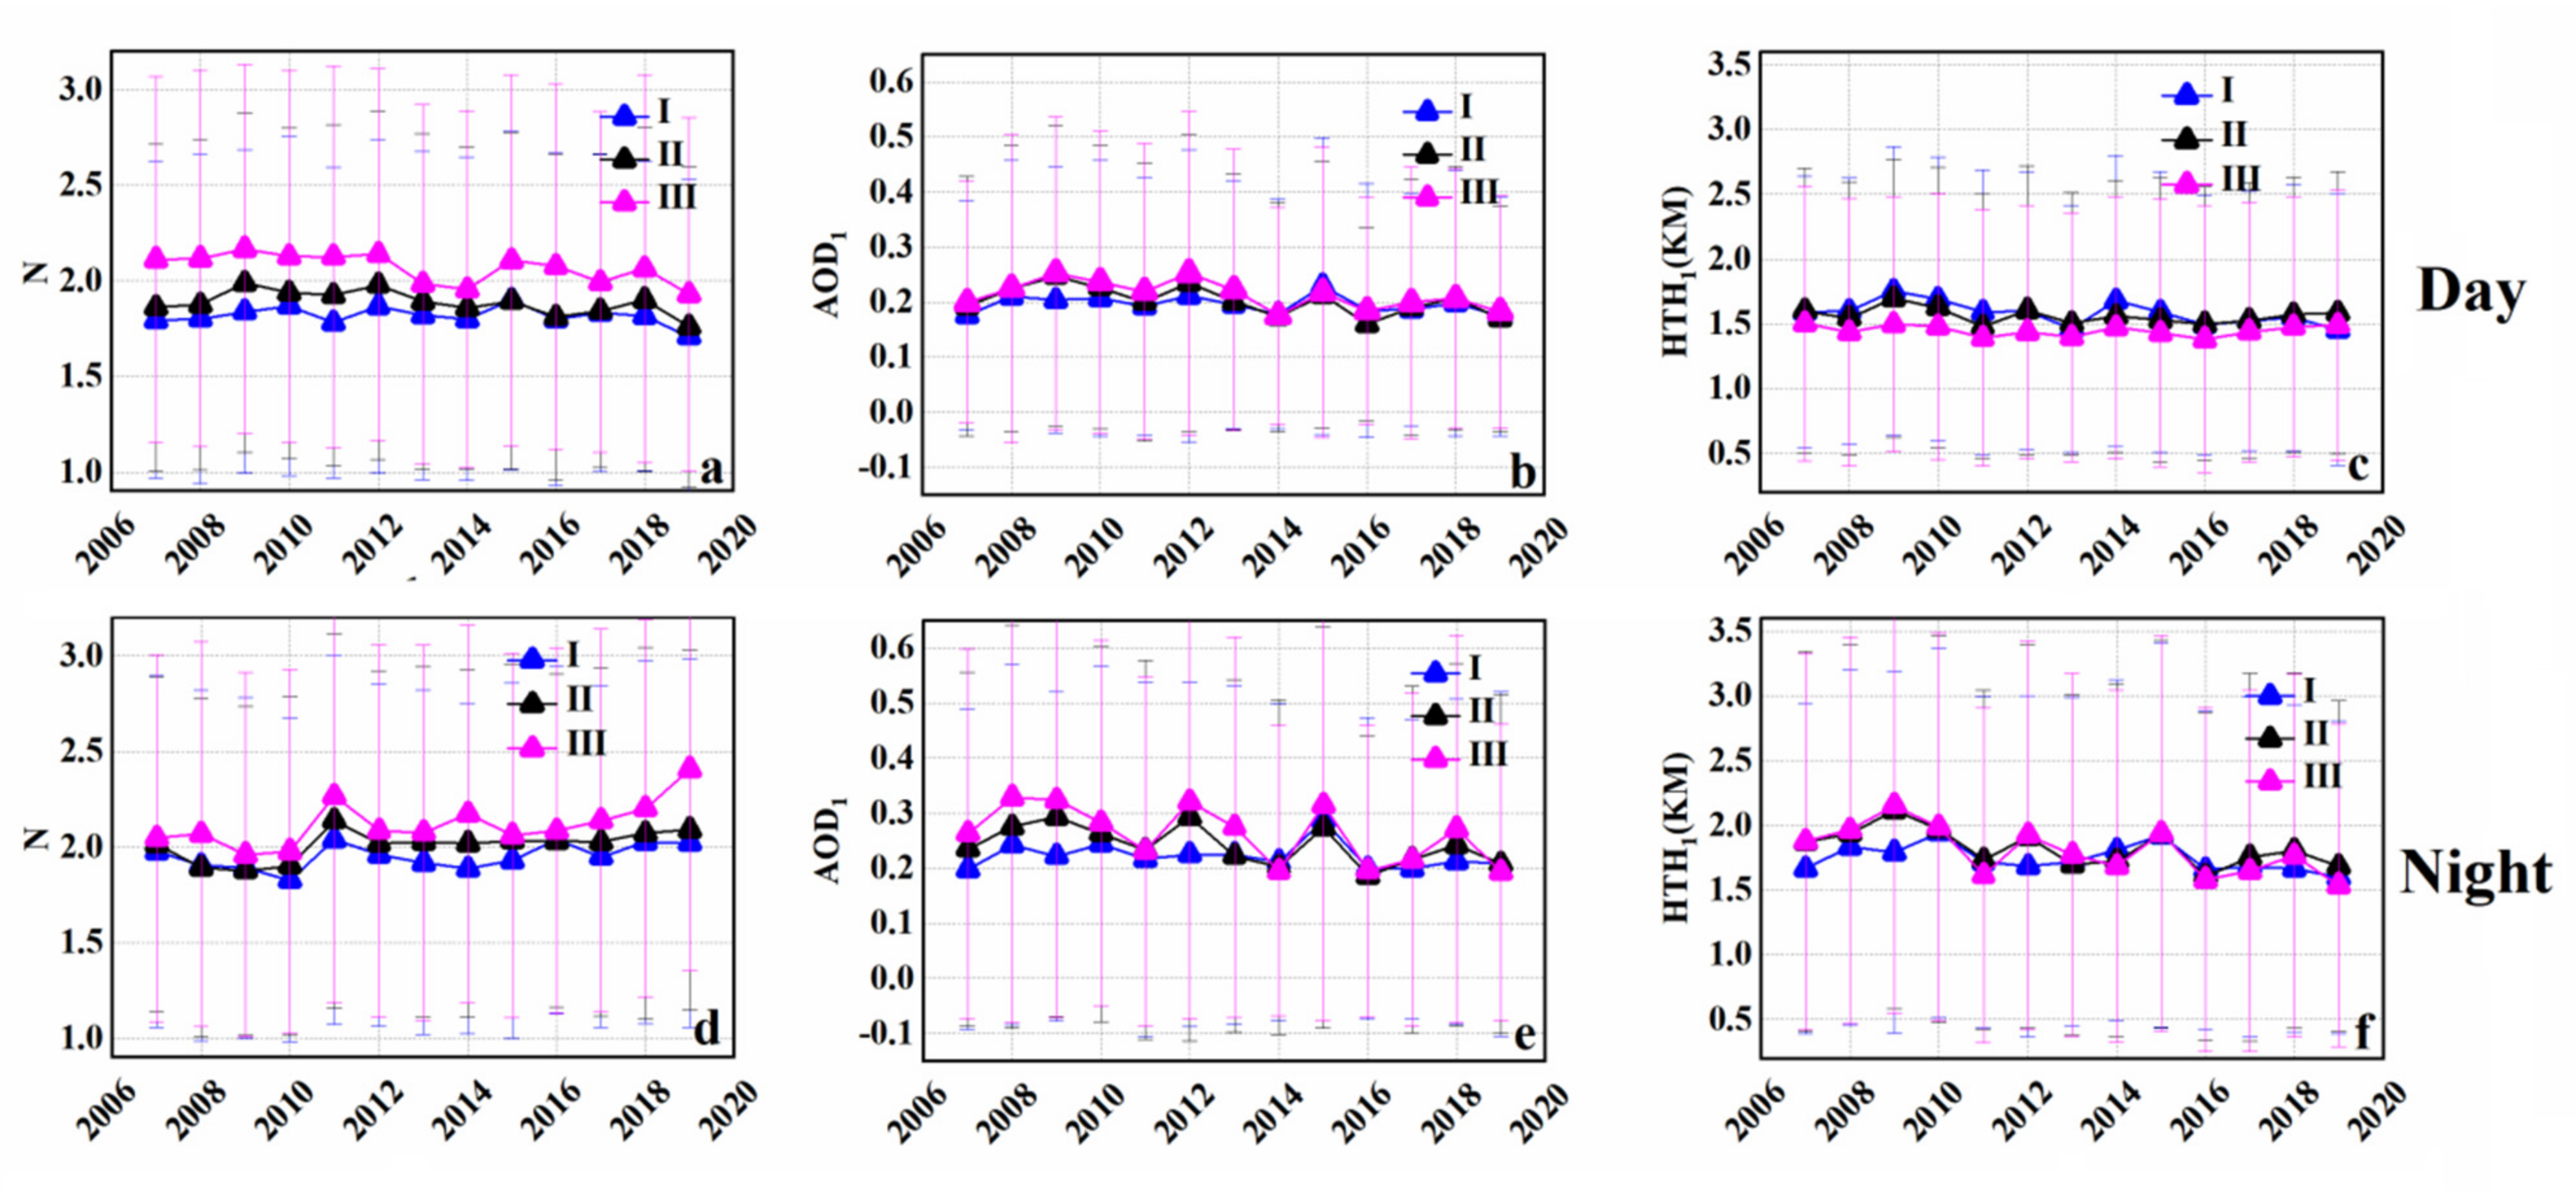
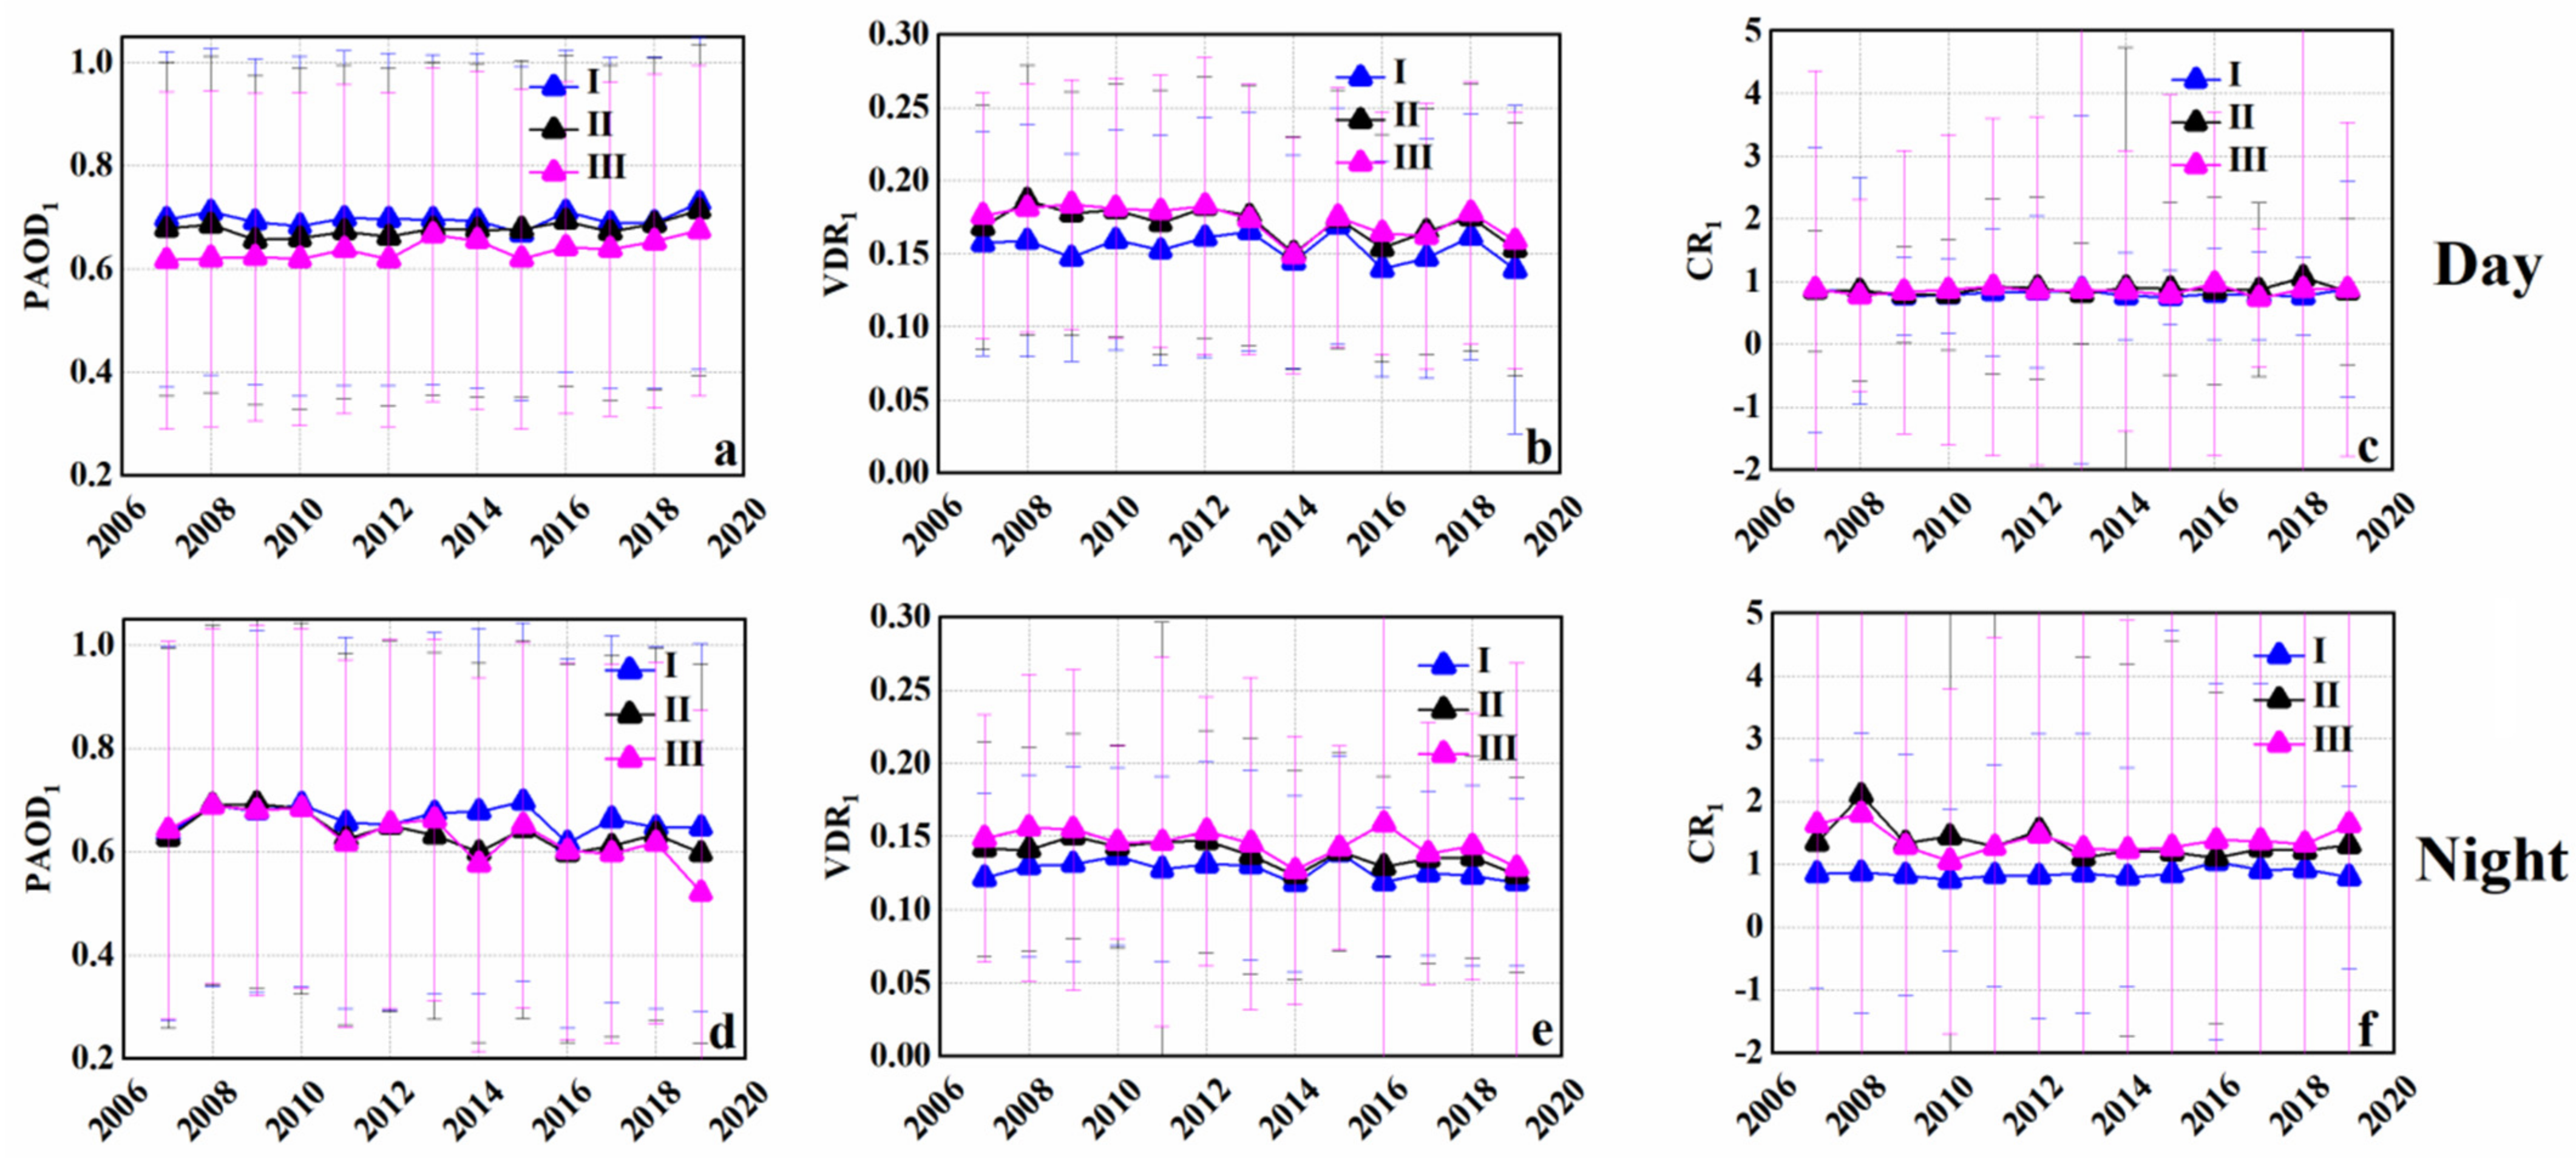
3.1. Interannual Variation Characteristics of Aerosol Properties

As shown in Figure 2 (Figure 2a: daytime; Figure 2d: nighttime), the annual average AODS of the three regions from 2007 to 2019 were analyzed. The results show that the annual average AODS exhibited an increasing trend from 2007 to 2009, which might be related to the economic development of Saudi Arabia and may also be influenced by the frequency of sandstorms [35,44,54]. The slight decrease reported in 2009–2019 corresponds to the relative slowdown in the economic development of Saudi Arabia, and few emission reduction measures have been undertaken to control events pertaining to aerosol accumulation comprising sand and dust in recent years. The annual average AOD in Saudi Arabia has seemingly varied over the years due to the sandstorm activities. This finding agrees with that stated by Ali et al. [32], who reported the long-term MODIS estimate of the annual average variation trend of AOD for Saudi Arabia in 2002–2013.
The annual mean value of AODS was the highest in region III (daytime: 0.39 ± 0.38, nighttime: 0.39 ± 0.37), followed by region II (daytime: 0.35 ± 0.36, nighttime: 0.35 ± 0.35), and the value was the lowest in region I (daytime: 0.34 ± 0.37, nighttime: 0.33 ± 0.34). This finding can be explained by the fact that region III is an expansive desert located in the border area, with a limited population, exhibiting less accessibility to technology for the prevention and control of aerosol accumulation comprising sand and dust. Though a considerable portion of the area of region II is a desert with a relatively larger population and higher elevation than that of region III, it also includes Riyadh (the capital of Saudi Arabia). Considerable efforts have been aimed at the prevention and control of the dissemination of sand and dust in the region. On one hand, this seemingly explains the lower values of AODS than that of region III. On the other hand, the average elevation of region I is higher, and the coast of the Red Sea is plain, which is less affected by the desert and the Mediterranean climate; hence, the AOD of region I is the lowest [17,55].
In general, except that the average AOD value of region I was found to be slightly higher during the daytime than that observed during the nighttime (~0.1), and the difference between regions II and III was small. This may be attributed to the fact that region I is less affected by dust aerosols, and the anthropogenic activities in the region are more intense during the daytime than at nighttime, yielding enhanced anthropogenic aerosol emissions. In addition, lidar observations are affected by solar radiation, and daytime observations may be biased.
The CALIOP aerosol layer data provided the top and bottom heights for each aerosol layer. This study was performed to examine the bottom height of the lowest aerosol layer (HB1) and the top height of the highest aerosol layer (TAH). Figure 2b,e show that the interannual variation of HB1 in all three regions is similar, exhibiting an insignificant increase. However, the annual mean is considerably different (1.55 ± 1.23 km, 1.42 ± 1.13 km, 0.88 ± 1.07 km during the daytime, 1.25 ± 1.01 km, 1.05 ± 0.89 km, 0.55 ± 0.87 km at nighttime for regions I, II, and III, respectively). These results indicate that HB1 has a relatively higher correlation with the topography, suggesting that the HB1 values increase with increasing altitude [51]. Moreover, higher values of HB1 were observed in the three regions during the daytime compared with nighttime, which may be influenced by the temperature difference between daytime and nighttime. Of course, it cannot be ruled out deviations caused by solar radiation. Likewise, the TAH estimate also exhibits a stronger correlation with the topography. Figure 2c,f display that region I (daytime: 4.14 ± 2.19 km, nighttime: 4.54 ± 2.05 km), region II (daytime: 4.08 ± 2.33 km, nighttime: 4.52 ± 1.97 km), region III (daytime: 3.80 ± 2.64 km, nighttime: 4.19 ± 2.10 km) TAHs, and TAHs of all three regions exhibited lower daytime values compared with the nighttime values. These results are also similar to the previously reported results obtained for certain regions of China [11,31]. It is important to point out that CALIOP 532 nm observations often miss the lower aerosol layer and may overestimate the bottom height, causing an error of the HB1 and HTH1 values [56,57].
Figure 3a,d indicate that region III had higher annual average N values (daytime: 2.07 ± 0.96, nighttime: 2.12 ± 0.99), region I had the lowest (daytime: 1.82 ± 0.85, nighttime: 1.95 ± 0.91), along with region II (daytime: 1.89 ± 0.87, nighttime: 2.01 ± 0.91). It could be reasoned that the terrain characteristics of region I highlighted as mountainous and coastal plains with high average altitude, featured with low temperature, relatively weak vertical convection, and low aerosol loading [26]. In turn, this results in a relatively weak vertical stratification of atmospheric aerosols. In contrast, the average altitudes of regions II and III were lower, and these two regions mainly encompassed the desert areas marked by high temperatures, strong vertical atmospheric motion, and large atmospheric aerosol load. Therefore, the atmospheric vertical stratification was salient, yielding a high N value. These results show that the number of aerosol layers demonstrates a certain relationship with geomorphic characteristics and climate, which corroborates with the results obtained from Pakistan [12].
AOD1 represents the AOD estimate of the bottom aerosol layer, which is significantly affected by natural factors and human activities [31]. The AOD1 annual average change (Figure 3b,e) showed similar results to the AODS. Namely, the values observed over region III were the highest (daytime: 0.21 ± 0.21, nighttime: 0.26 ± 0.34), followed by those observed over region II (daytime: 0.20 ± 0.24, nighttime: 0.24 ± 0.33), and region I presented the lowest value (daytime: 0.20 ± 0.23, nighttime: 0.22 ± 0.31). Interestingly, the difference in AOD1 in the three regions was small, which might be related to the comprehensive influence of the topography, natural environment, and human activities. In contrast to AODS, the value of AOD1 at nighttime was higher than that during the daytime, which might be related to the characteristics of dust aerosols. Moreover, the temperature at nighttime is lower, the boundary layer is shallower than that in the daytime, and the ventilation coefficient is poor. Thus, the aerosols are more actively deposited during the night near the land surface [12] PAOD1 represents the percentage of AOD1 in AODS (Figure 4a,c). The results show that region I (daytime: 0.70 ± 0.32, nighttime: 0.66 ± 0.35) > region II (daytime: 0.68 ± 0.32, nighttime: 0.64 ± 0.36) > region III (daytime: 0.64 ± 0.32, nighttime: 0.63 ± 0.36), with no significant difference (daytime: 0.06, nighttime: 0.03), and the value during the daytime is higher than that at nighttime. This indicates that the aerosols are mainly concentrated in the lower atmosphere, and the PAOD1 value is associated with the average altitude of the region. The higher the altitude, the greater the PAOD1 value. Simultaneously, it also shows that the layer of the bottom aerosol is mainly formed by vertical convection and the weak effect of the atmosphere. It should be noted that humans are more susceptible to the influence of aerosols during the daytime compared with nighttime [12].
HTH1 represents the difference between the top height of the lowest aerosol layer (HT1) and the base height of the lowest aerosol layer (HB1). The average annual HTH1 values are shown in Figure 3c,f of region I (daytime: 1.58 ± 1.05 km, nighttime: 1.75 ± 1.32 km), region II (daytime: 1.56 ± 1.07 km, nighttime: 1.83 ± 1.40 km), region III (daytime: 1.45 ± 1.01 km, nighttime: 1.80 ± 1.42 km), exhibiting only small changes during the daytime and nighttime. The value at nighttime is greater compared with the daytime, which is consistent with the TAH variations.
VDR1 is the ratio of the vertical polarization scattering coefficient at 532 nm to the whole aerosol scattering coefficient at 532 nm, which reflects the spherical and non-spherical degree of aerosol particles in the lowest aerosol layers. The lower the VDR1 values, the more spherical the bottom aerosol particles, and vice versa [12]. The VDR could reflect the spherical characteristic of aerosols. Therefore, the VDR are mean values. In this study, the VDR1 we used was the mean value of the lowest layers since almost 90% of aerosols exist in the lowest layers. Therefore, VDR1 is almost the same as the VDR of the entire aerosol layer. Meanwhile, the VDR of the entire aerosol layer is not the product of CALIPSO directly. Therefore, VDR1 could reflect the spherical characteristic of aerosols. The results are shown in Figure 4b,e for region I (daytime: 0.14–0.17, nighttime: 0.12–0.14), region II (daytime: 0.15–0.19, nighttime: 0.12–0.15), and region III (daytime: 0.16–0.18, nighttime: 0.13–0.16). These findings indicate the presence of more non-spherical particles in regions II and III, seemingly highlighting the large desert areas in these two regions affected by dust aerosols. These results also show that more non-spherical particles appear at nighttime than during the daytime, seemingly related to dry deposition at night [12].
The color ratio (CR) is defined as the ratio of the total attenuation backscattering coefficient (1064 nm) to the total attenuation backscattering coefficient (532 nm). CR reflects the size of the aerosol particles, implying that the larger the CR, the larger the aerosol particle size [58]. Figure 4c,f depicts the annual average change in CR1 in the lowest aerosol layer during daytime and nighttime, respectively. The results indicated that the CR1 values of the three regions showed only slight variations during the daytime (0.81 ± 1.17, 0.87 ± 2.44, 0.86 ± 2.76), but revealed substantial differences at nighttime (0.86 ± 2.52, 1.34 ± 9.92, 1.38 ± 6.42). The CR1 values in regions II and III were higher. Thus, more coarse-mode (large-sized particles) were observed in regions II and III, which might be elemental to reduced human activities at nighttime. The main type of aerosol at the bottom observed during the night is dust. These results are similar to the aerosol characteristics reported from Punjab, Baluchistan, and Sindh in southern Pakistan [12].

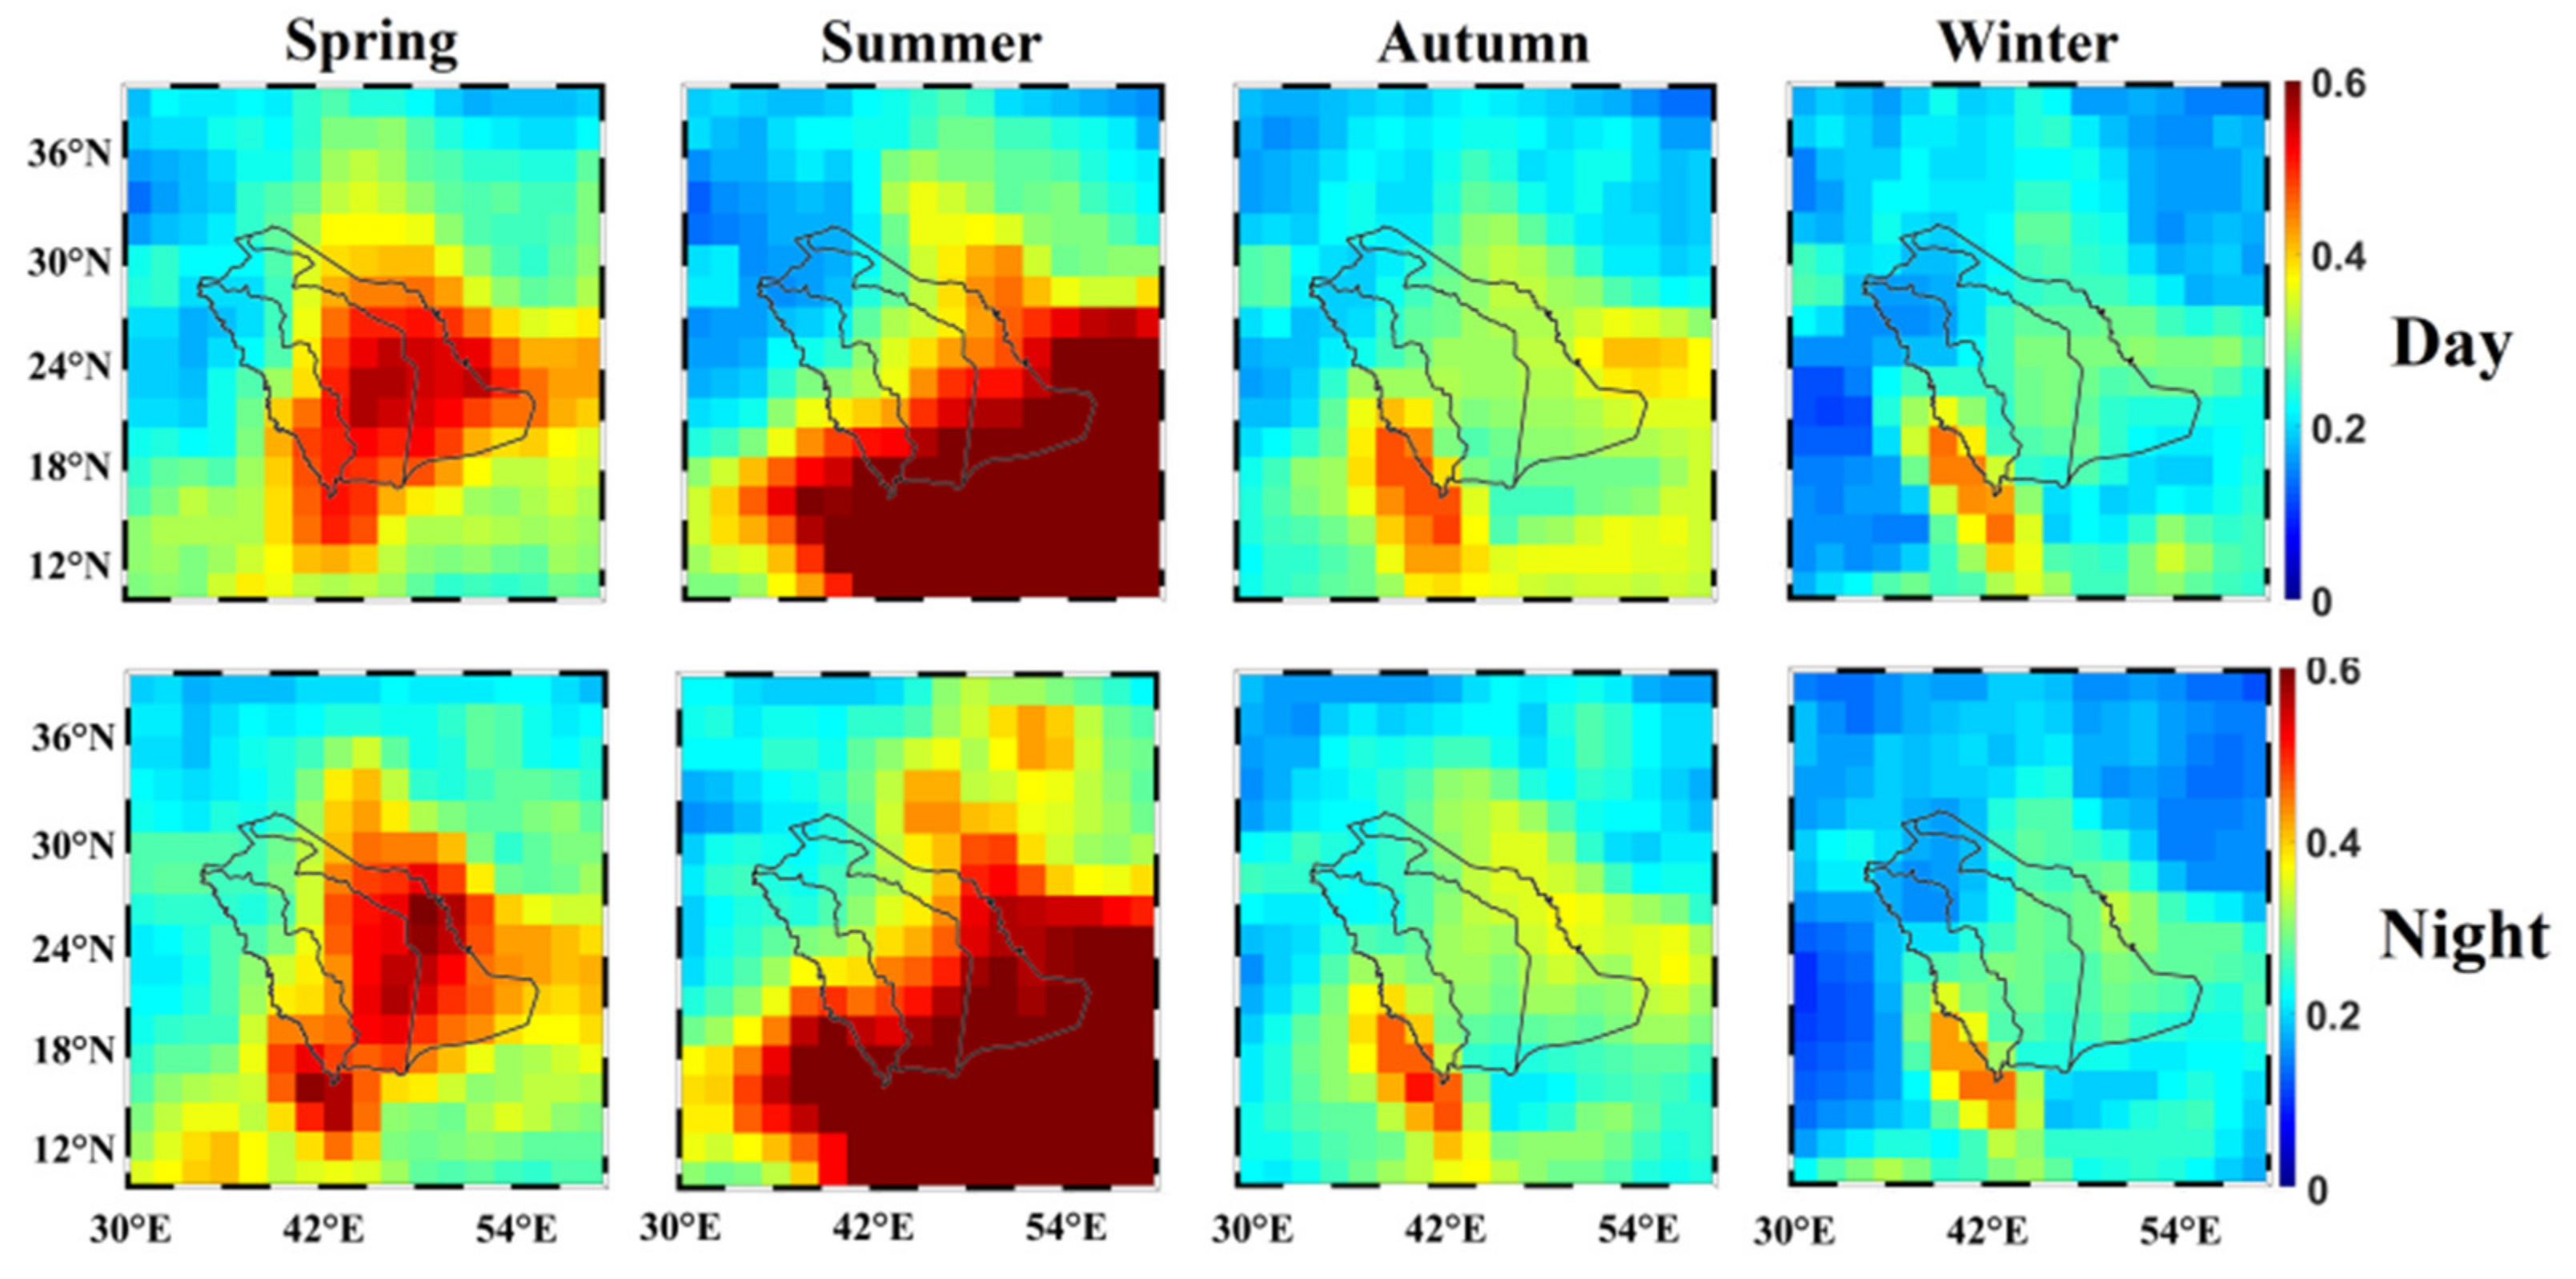
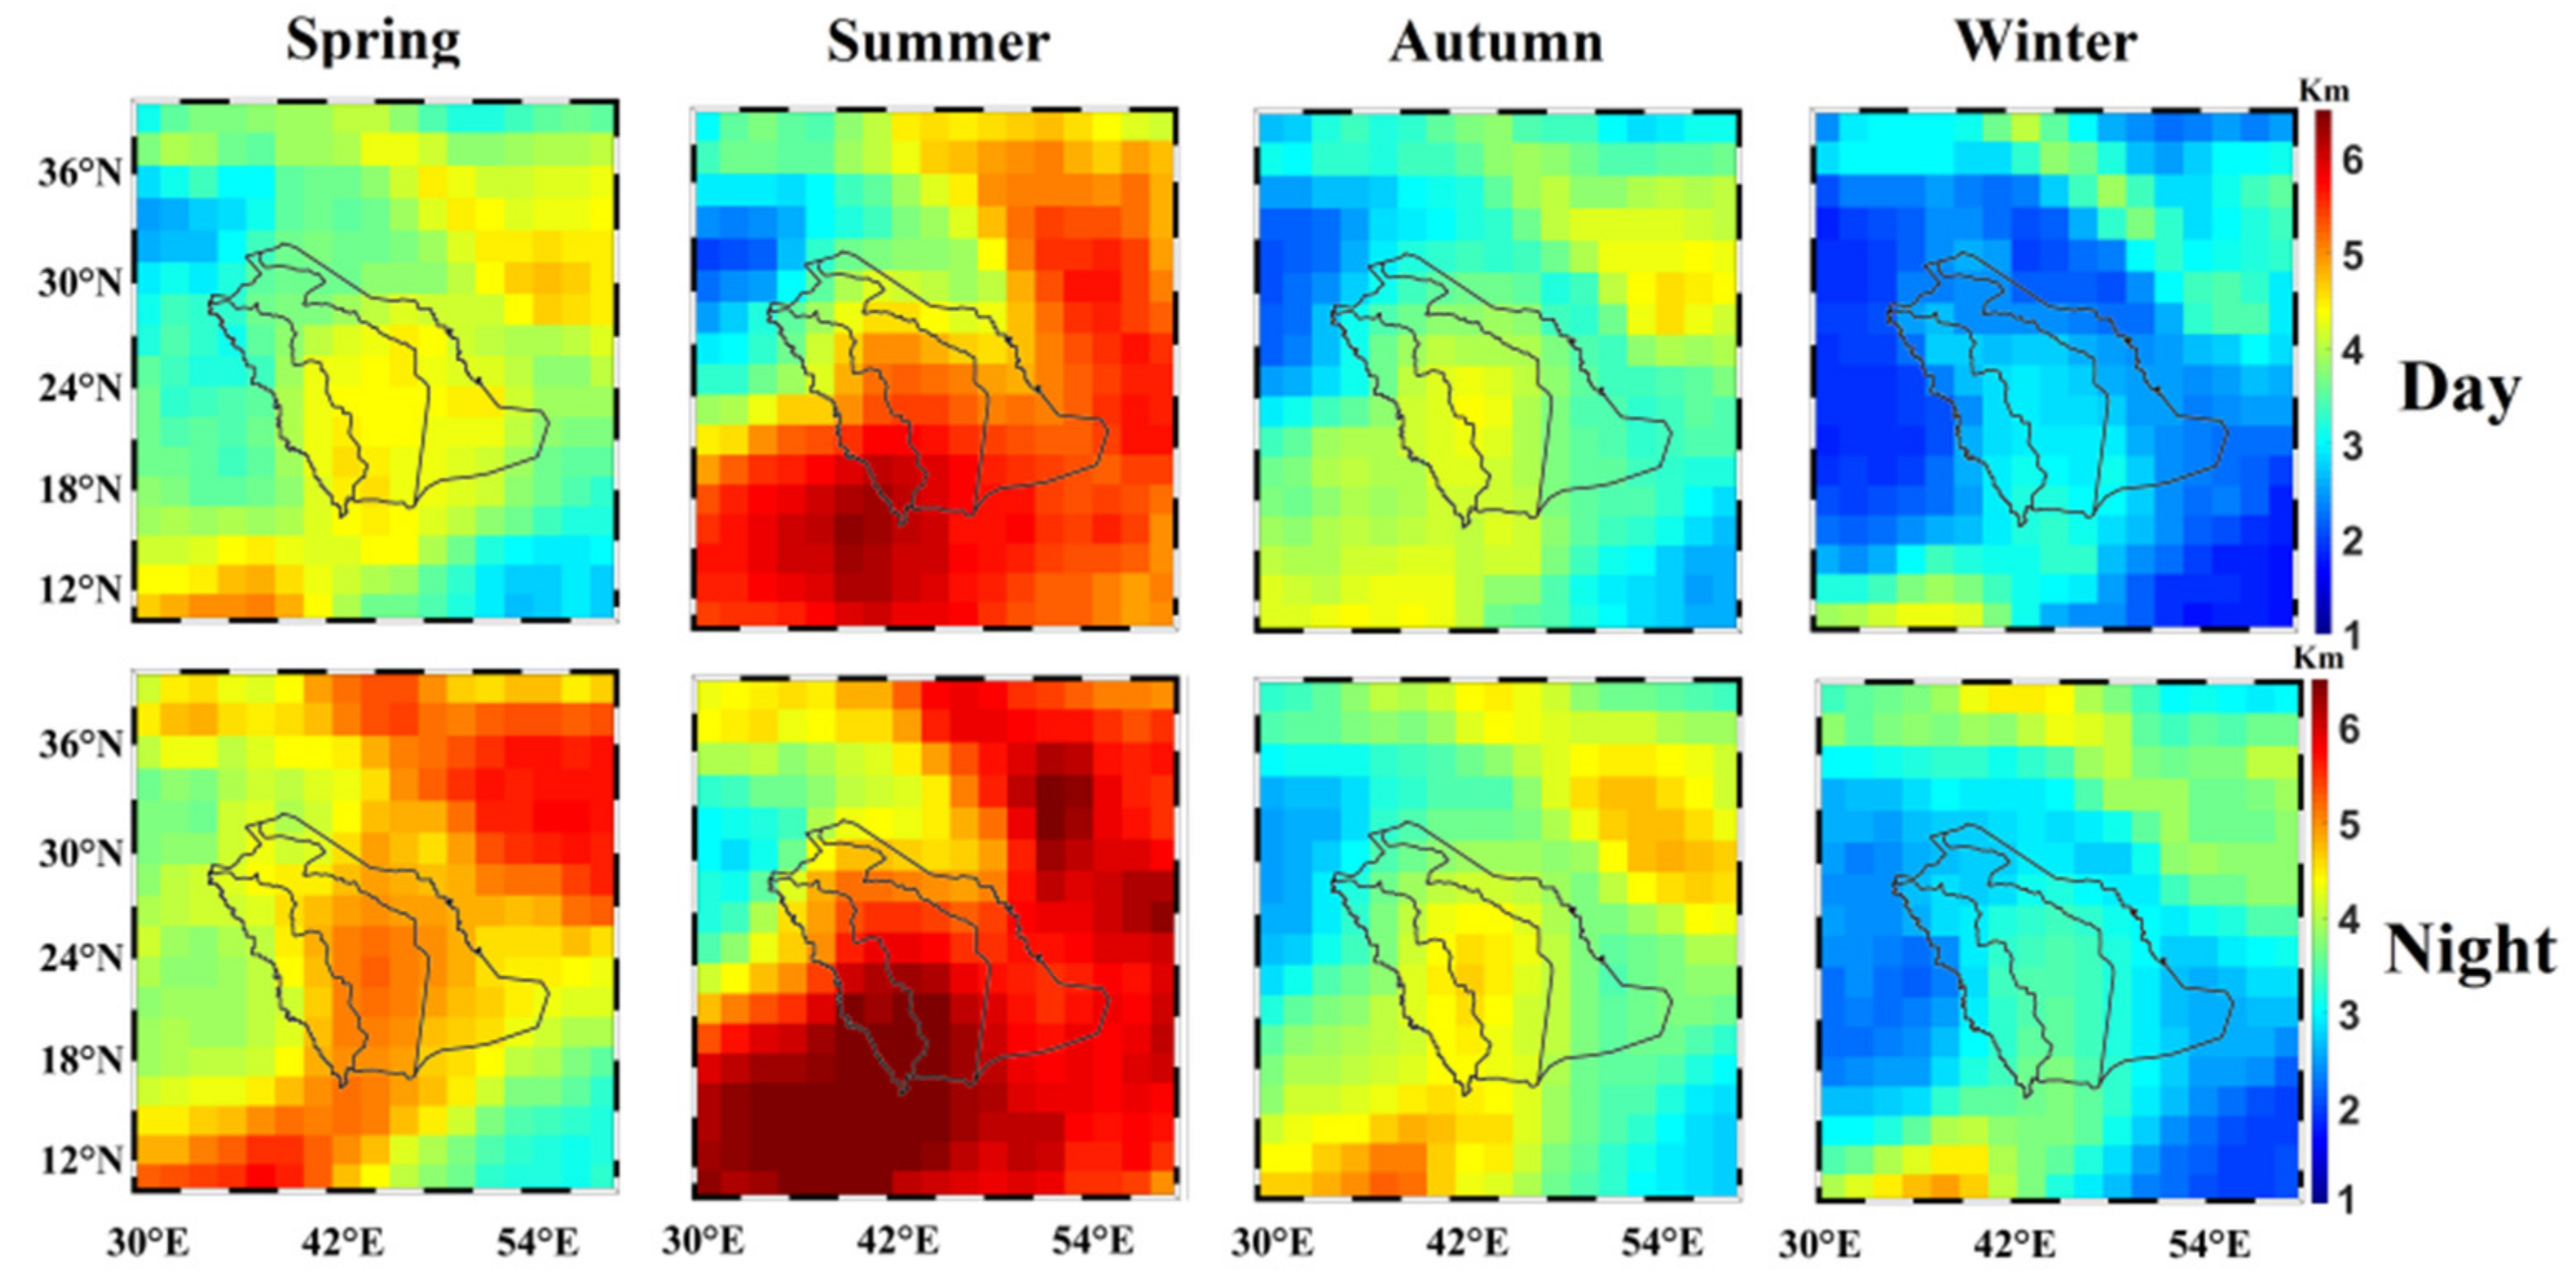
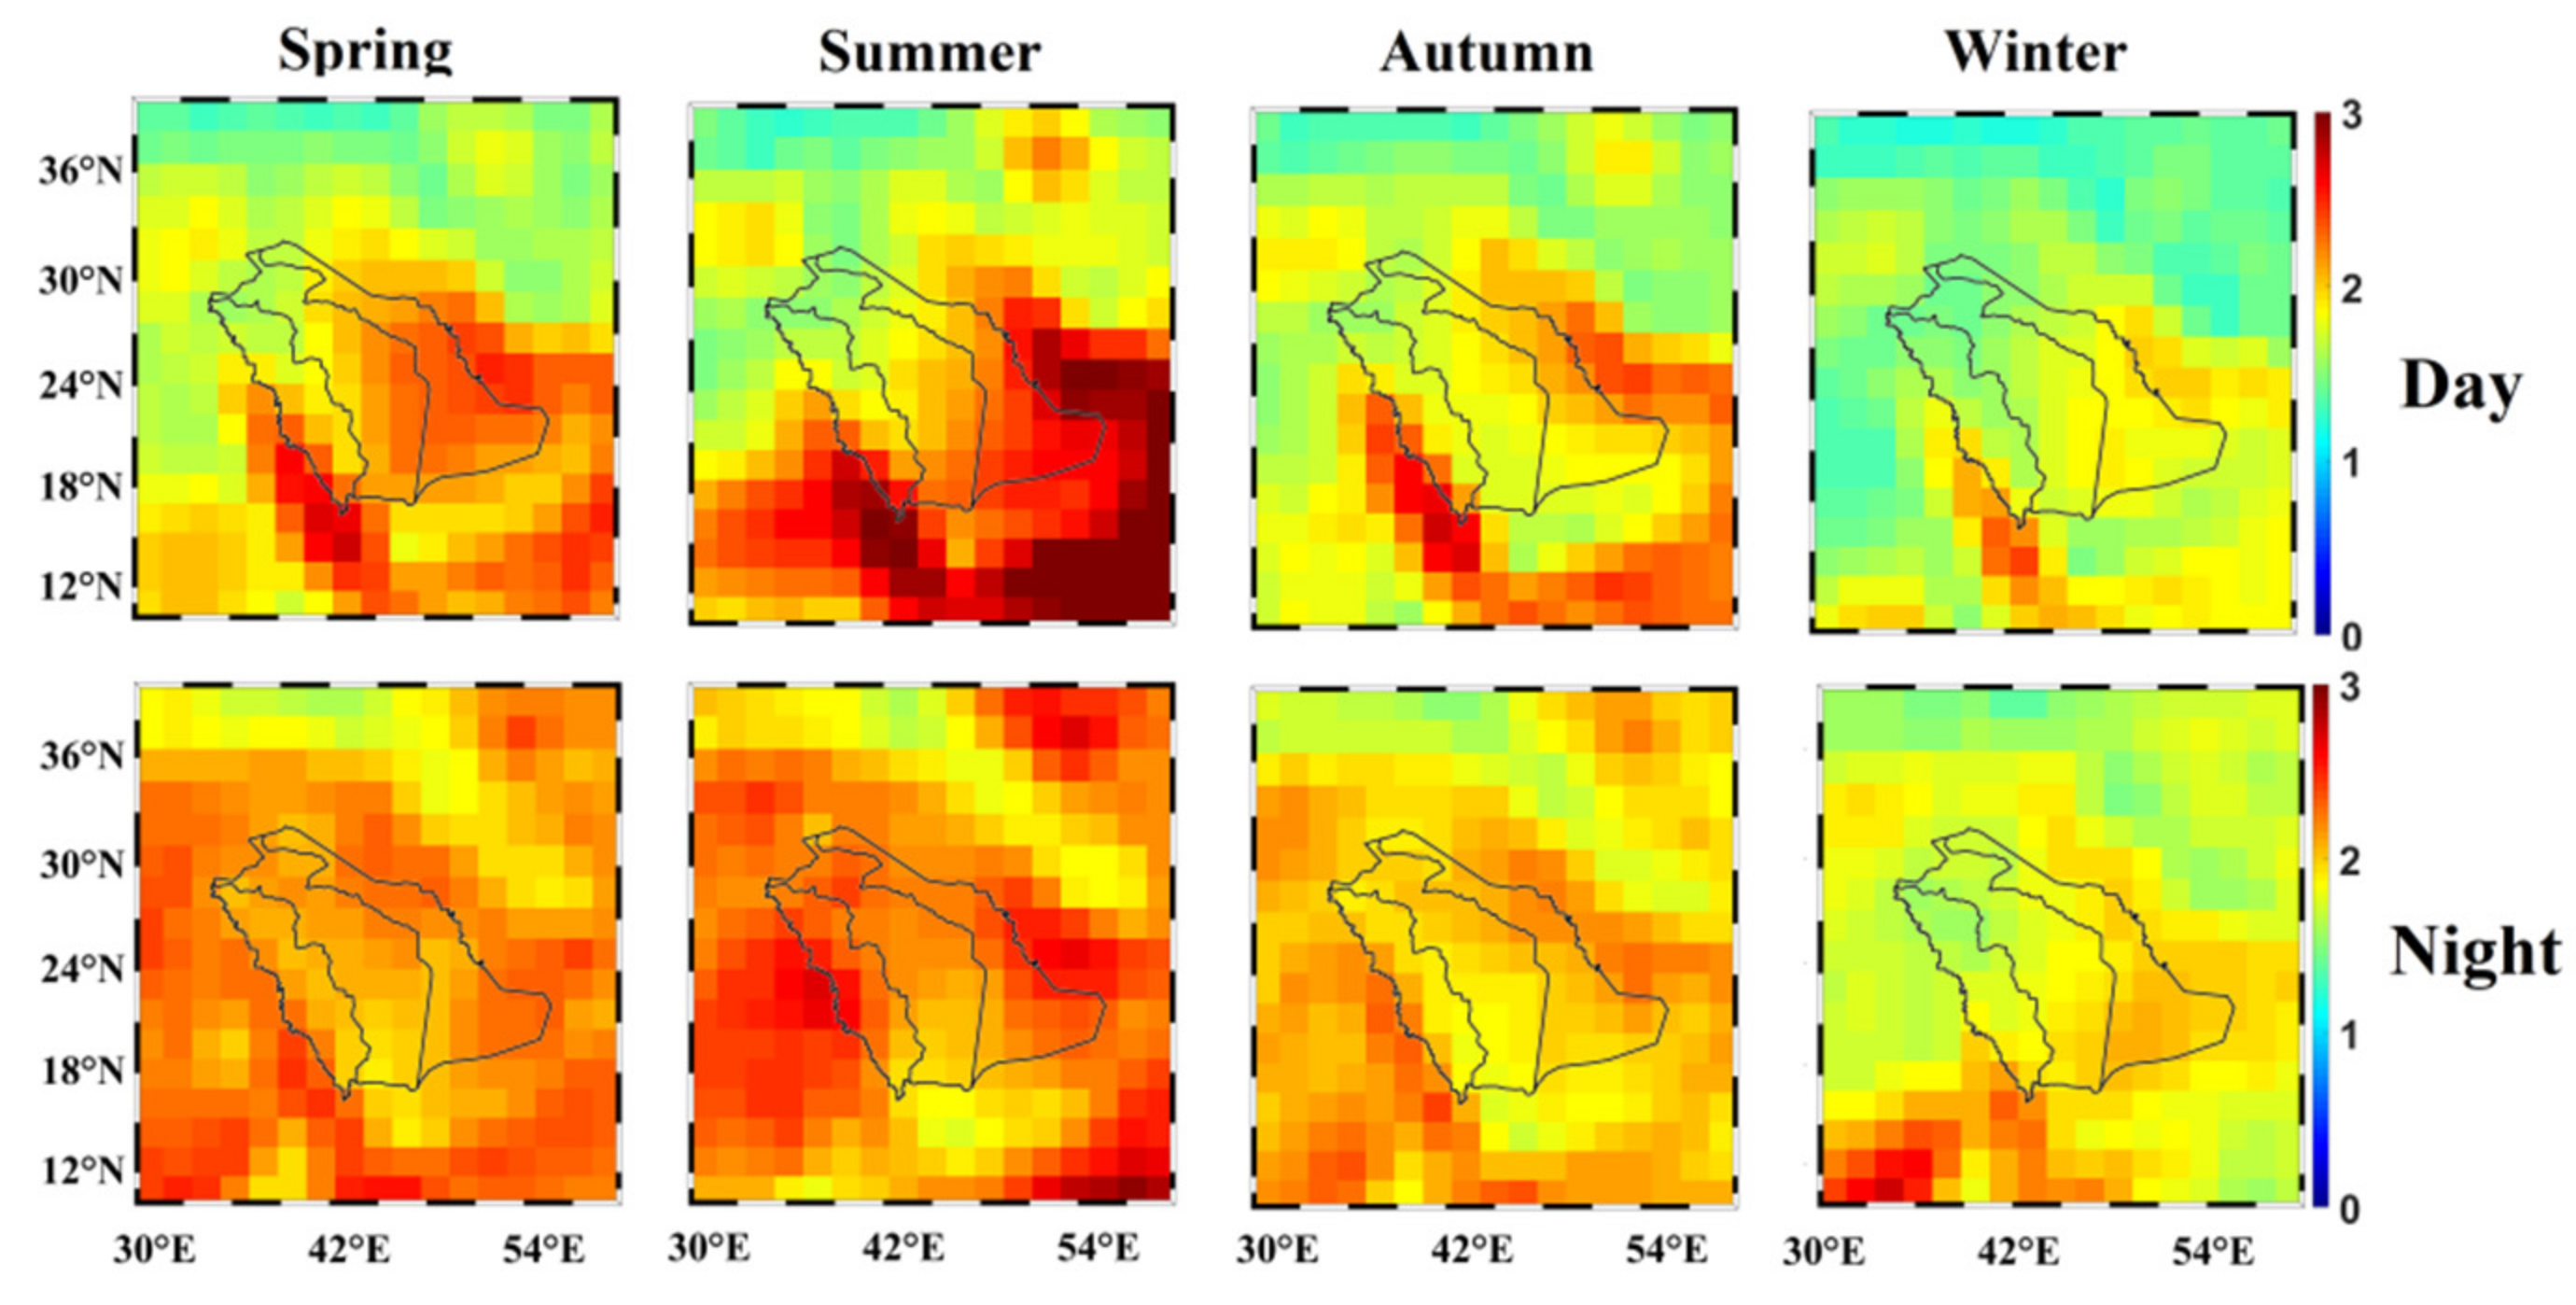
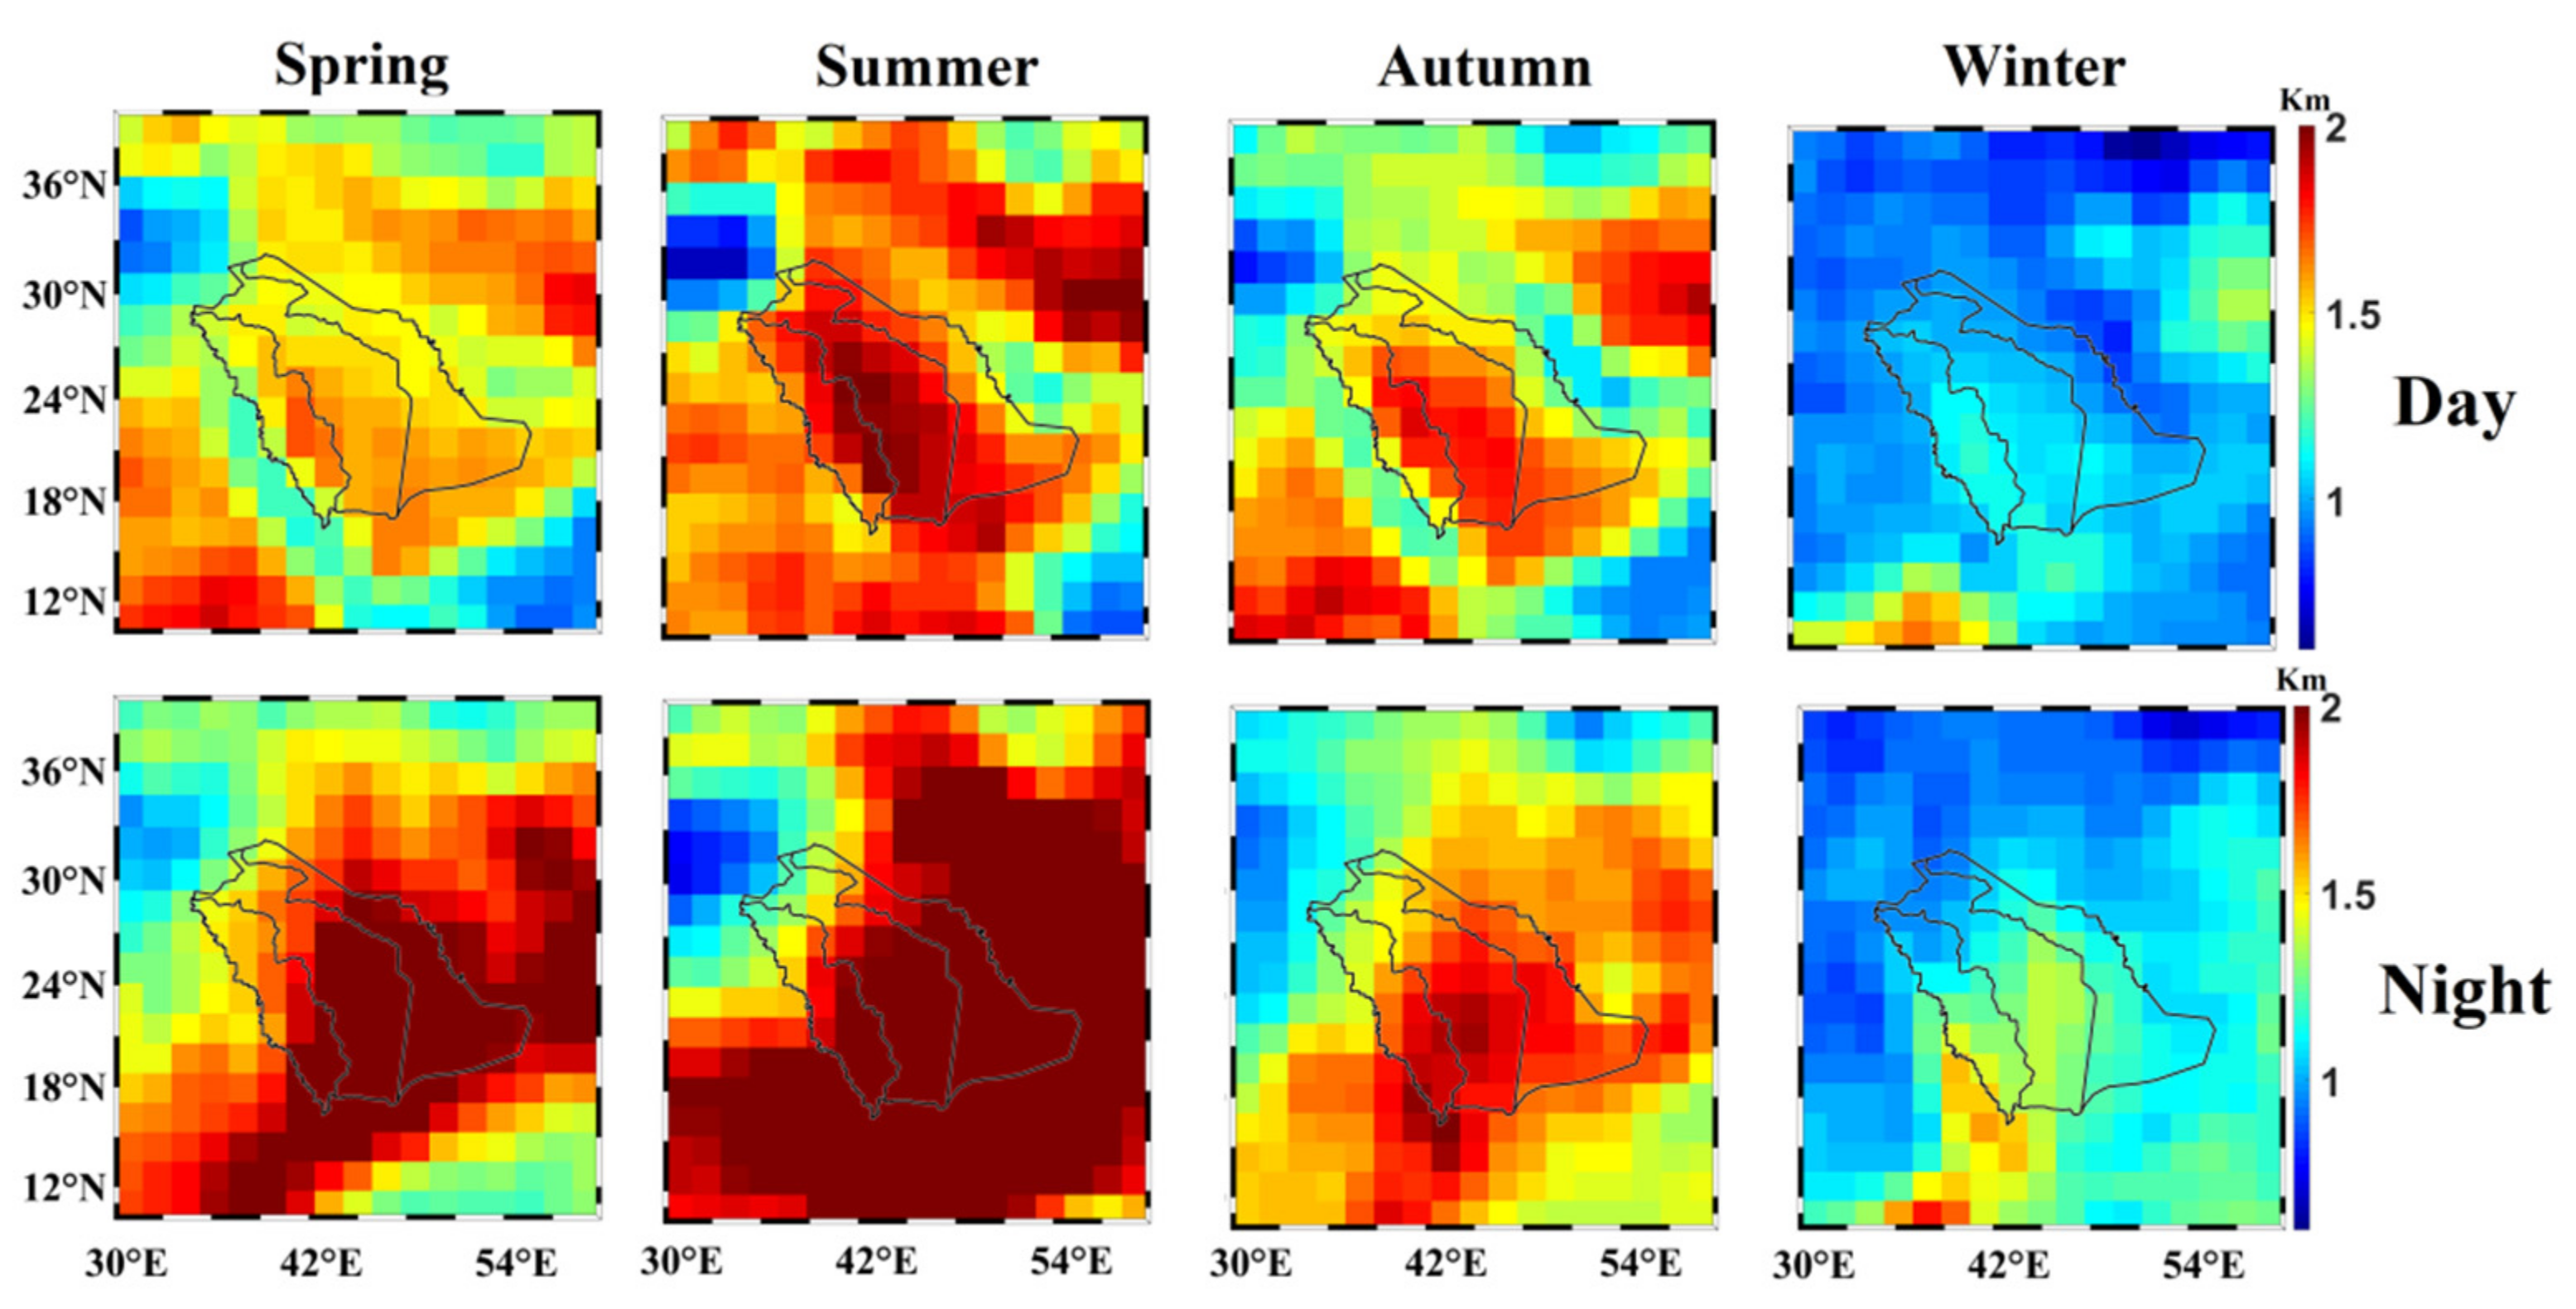
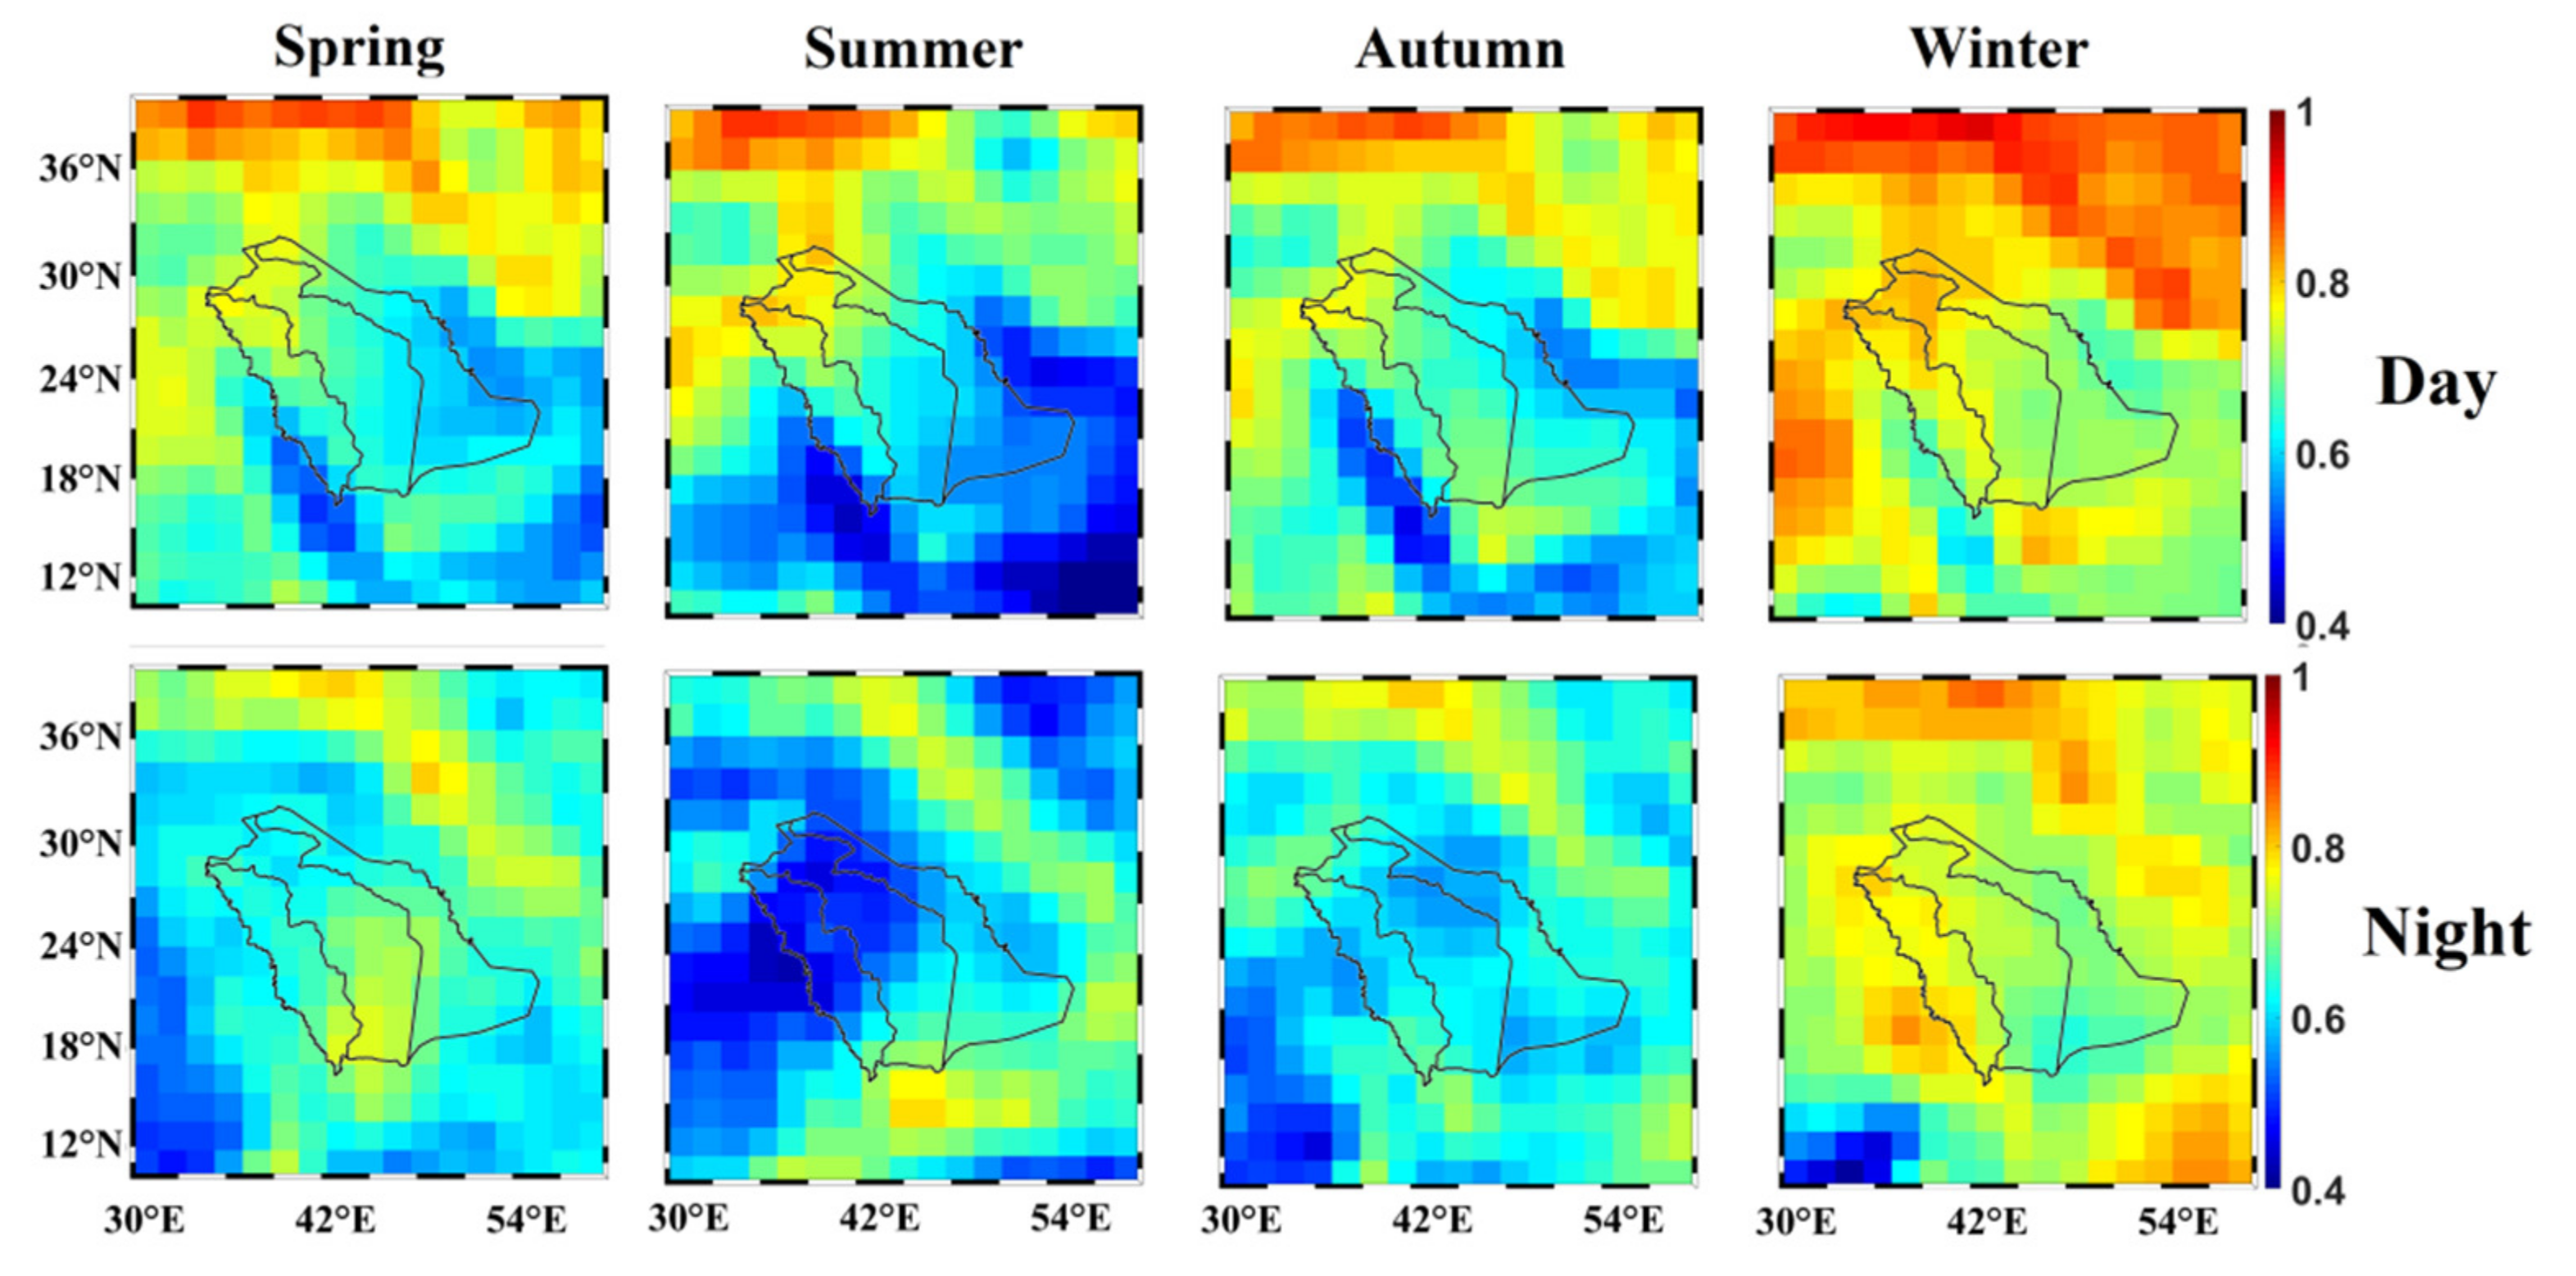
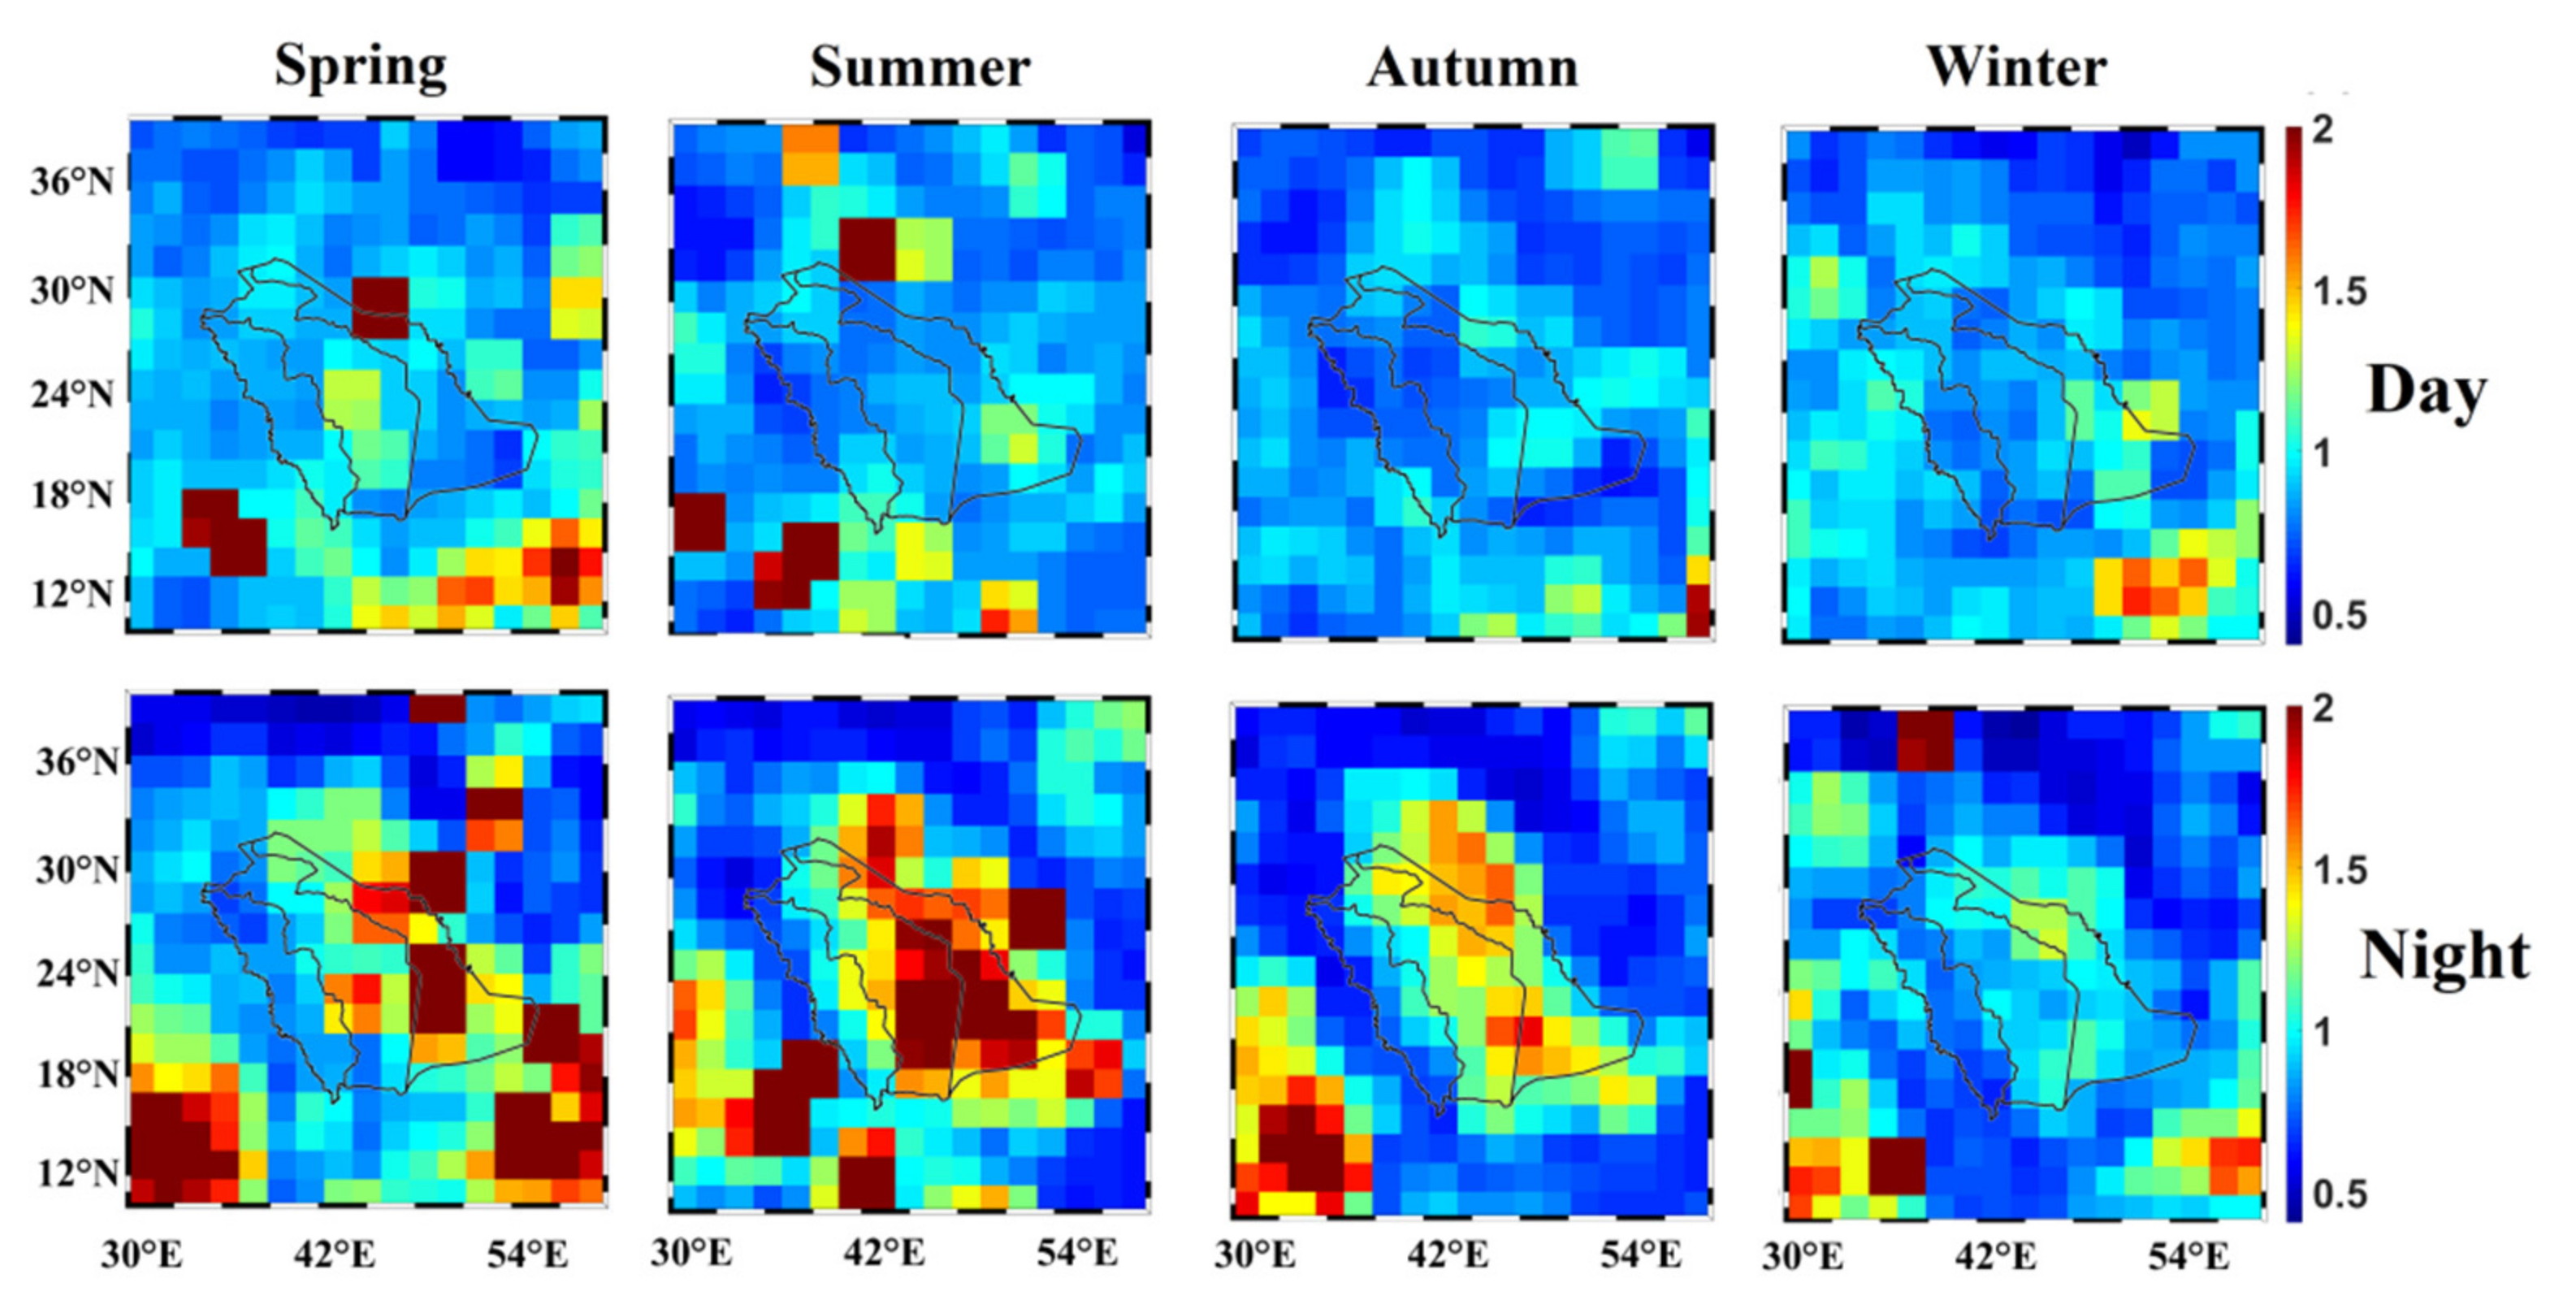
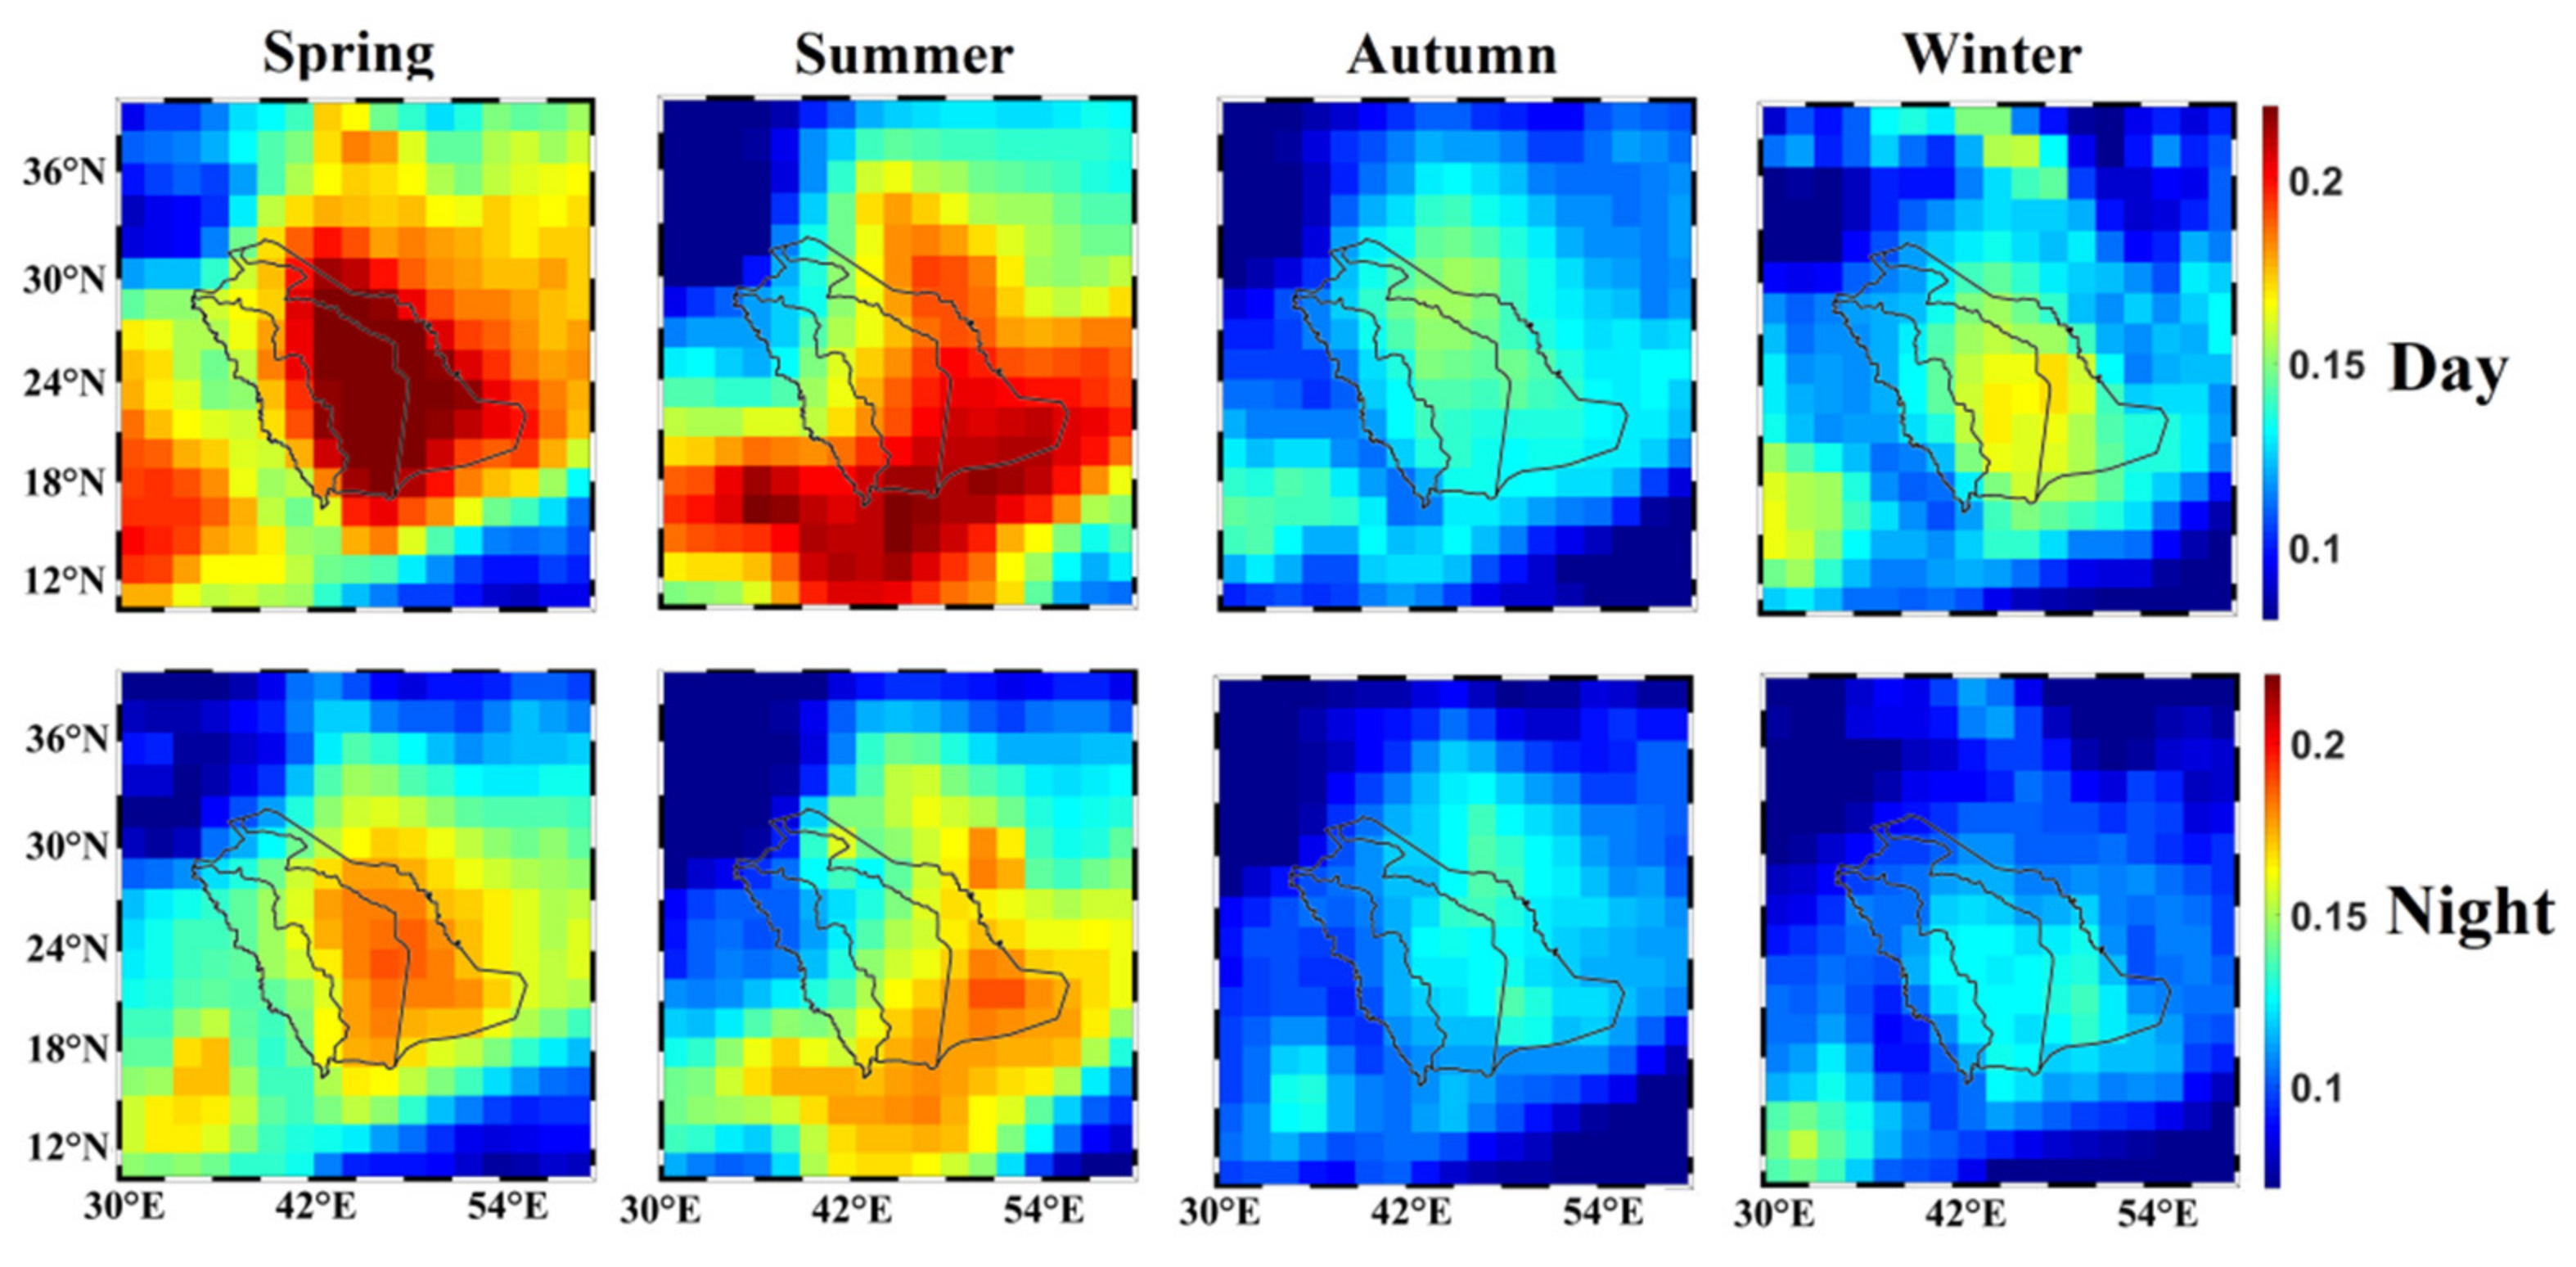
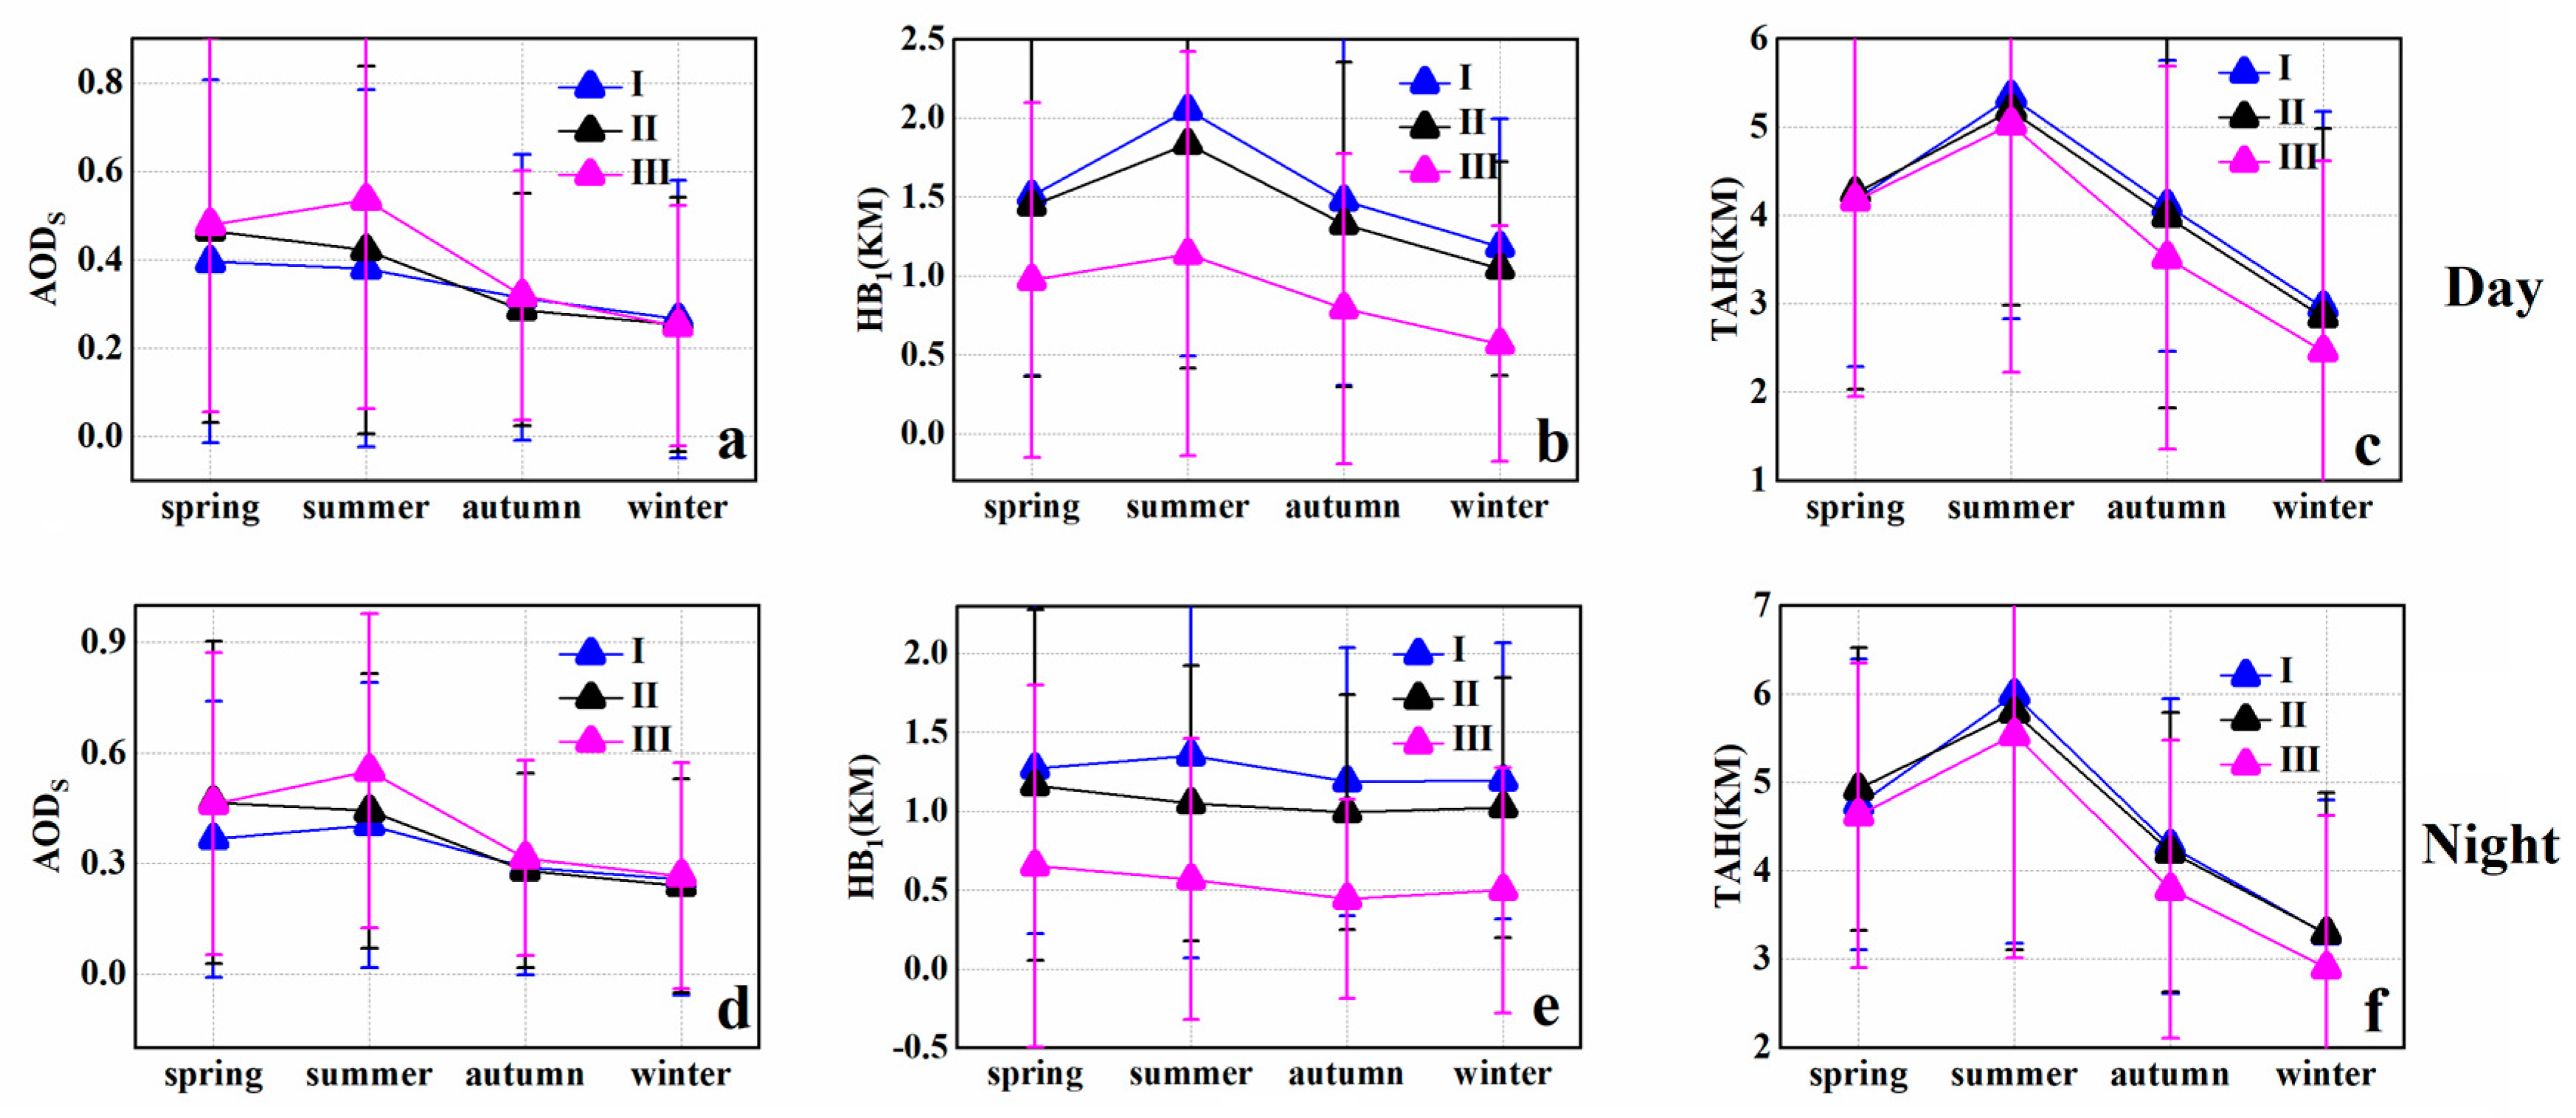
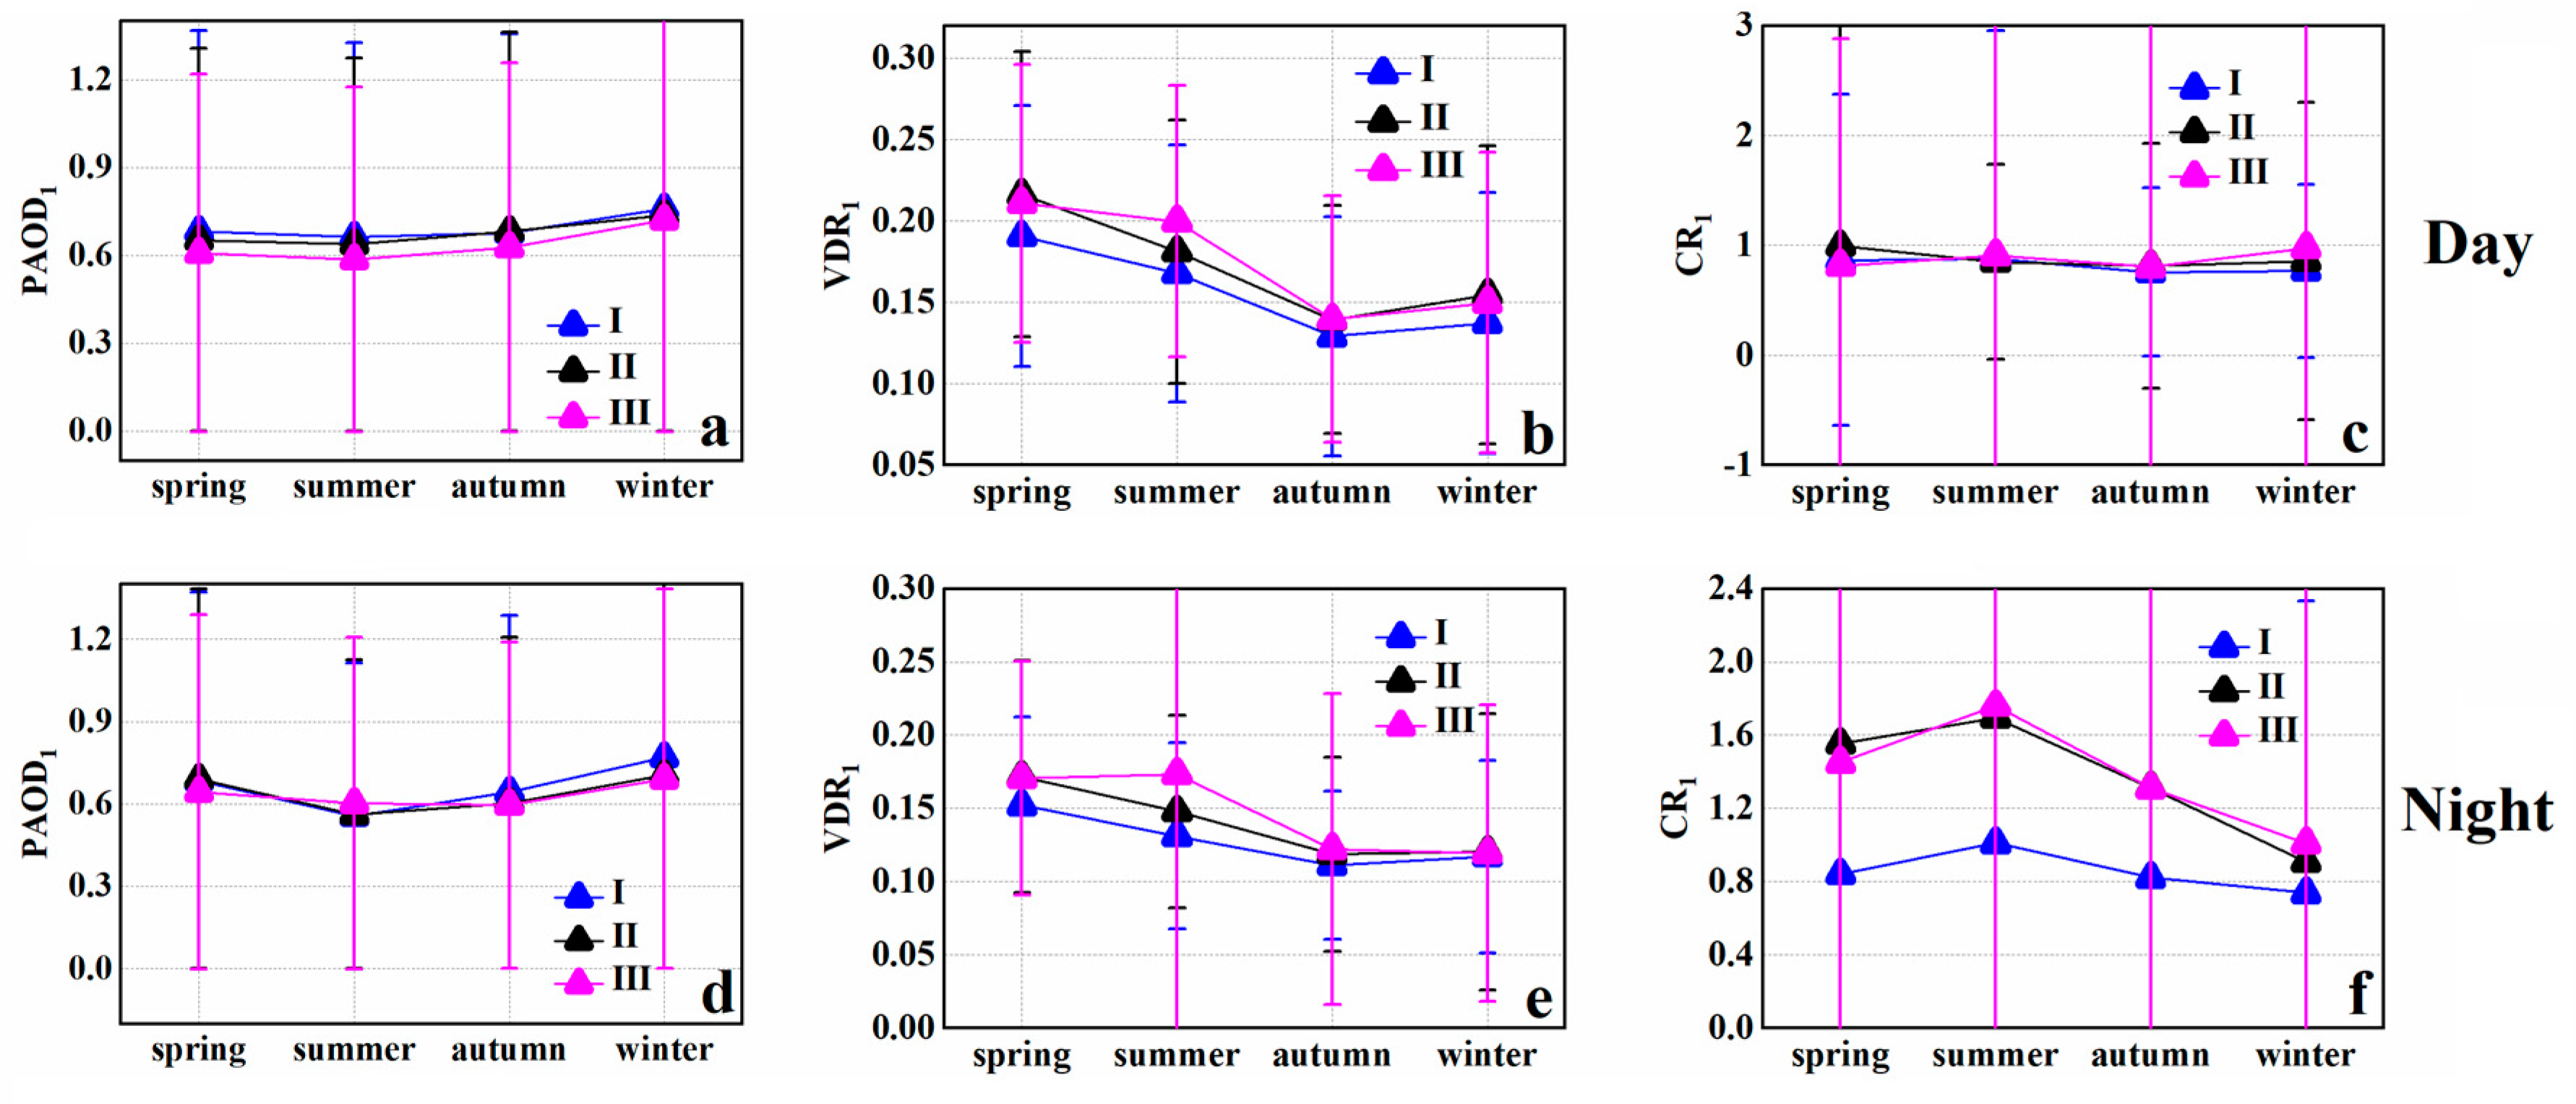
3.2. Seasonal Variation of the Aerosol Layer over Saudi Arabia

In this study, the optical and physical characteristics of the vertical distribution of aerosols during the daytime and nighttime in different seasons were studied (Figure 5, Figure 6, Figure 7, Figure 8, Figure 9, Figure 10, Figure 11, Figure 12, Figure 13, Figure 14, Figure 15 and Figure 16). AODS exhibited the highest values (see Figure 14a,d) in spring and summer, among which region I (daytime: 0.40 ± 0.41, nighttime: 0.40 ± 0.39), and region II (daytime: 0.47 ± 0.43, nighttime: 0.47 ± 0.44) presented with the maximum value during the spring and daytime. The three regions presented with their lowest values in winter (I/II/III, daytime: 0.27 ± 0.31/0.25 ± 0.29/0.25 ± 0.27, nighttime: 0.26 ± 0.32/0.24 ± 0.29/0.27 ± 0.31), which was consistent with the data reported in multiple previous studies. Yan et al. [35,44,59] found that the dust peak in northwestern Saudi Arabia emerged in April and May, and the dust peak in the central and southern deserts emerged during May and June, respectively. The wind direction of dust and non-dust days in these areas has not significantly changed. This finding indicated that the dust aerosol was mainly generated over the local desert, and the resulting dust aerosol mainly formed in spring and summer. Notaro et al. [35] also found that dust aerosols over western Saudi Arabia were mainly associated with easterly winds from the Rual Khali Desert in spring and westerly winds from the Sahara Desert in summer.
The high values of AOD in summer may be related to the rising temperatures, as high temperature and dryness play an important role in the rise in sand and dust [32,38,59]. Additionally, the water vapor content is directly related to the AOD atmospheric load. The higher the water vapor concentration in summer, the higher the atmospheric relative humidity and, hence, the higher the AOD values [18,34]. The lower AOD values in winter may be attributed to precipitation in cold months which can help remove aerosols, or because the active intensity of wind-sand is lower than that during spring and summer [45].
It can be observed from the spatial distribution map (Figure 5 and Figure 9) that in spring, the AOD in central and southern Saudi Arabia is high, while the latter region shows higher AOD during summer. These results show that in Saudi Arabia, AOD is mainly related to the level of dust storms and is related to the level of economic and industrial development, the level of urbanization, and the level of automobile emissions, which is consistent with the research results reported by Sabetghadam et al. [45]. Notably, the seasonal variation of AOD1 values for all three regions is similar to that of AODS (Figure 5 and Figure 15c,f).
The N values of the three regions (Figure 15a,d) are the highest during spring or summer, followed by autumn and winter, which may be due to higher temperature and enhanced vertical convection in spring and summer, resulting in aerosol stratification [60]. In each season, N values for region III (daytime: 1.78~2.23, nighttime: 1.97~2.20) than in area I (daytime: 1.62~1.91, nighttime: 1.73~2.02), and region II (daytime: 1.71~2.07, nighttime: 1.86~2.08) were recorded. Additionally, according to the spatial distribution map (Figure 8), the distribution of N values was relatively uniform, and the areas with relatively high values were primarily distributed in the plain terrain along the Red Sea coast and the eastern region, which might be related to particulate matter generated by seawater desalination and an increasingly intense dust activity in the eastern region [17,18,45].
From the spatial distribution map (Figure 6), it can be observed that the higher the geographical elevation, the greater the seasonal mean value of HB1, and that the high value is mainly observed in the mountainous areas lying between regions I and II. The seasonal variations of HB1 values (Figure 14b,e) during daytime and nighttime were markedly different. Compared with daytime (region I: 1.18~2.05 km; region II: 1.05~1.84 km), the seasonal variations of HB1 values during nighttime (region I: 1.19~1.35 km; region II: 1.00~1.17 km) are not evident, which may be caused by low temperature and weak dust activity during the nighttime.
During the daytime, the seasonal mean spatial distribution of HTH1 was similar to that of HB1. At nighttime, the values of HTH1 (spring: 1.95~2.17 km; summer: 2.12~2.37 km) are higher over the entire southern part of Saudi Arabia (Figure 15c,f). This variation can be explained by the substantial diurnal temperature differences during spring and summer and the enhancement of vertical convection caused by the Indian Ocean monsoon, resulting in the enhancement of vertical motion of the aerosol layer [34]. Compared with spring and summer, autumn (1.71~1.76 km) was slightly weakened, and winter (1.15~1.25 km) was the weakest. Interestingly, HTH1 in region III was the highest in the three regions during the summer daytime and was the lowest at nighttime, reflecting considerable diurnal temperature differences in the desert region and the greater impact on HTH1.
Moreover, the seasonal average values of TAH during daytime and nighttime were the same (Figure 14c,f) and presented with the following trend: summer (during the daytime, 5.03 km to 5.34 km, nighttime: 5.54 km to 6.00 km) > spring (during the daytime, 4.17 km to 4.25 km, nighttime: 4.63 km to 4.92 km) > autumn (during the daytime, 3.52 km to 4.11 km, nighttime: 3.79 km to 4.28 km) > winter (during the daytime, 2.46 km to 2.96 km, nighttime: 2.90 km to 3.28 km); the value was slightly higher than the daytime value observed in the evening.
The seasonal mean value of PAOD1 (Figure 16a,d) in the three regions generally indicated the minimum value in summer (daytime: 0.59~0.66, nighttime: 0.56~0.60), followed by spring and autumn (daytime: 0.61~0.68, nighttime: 0.60~0.69), and the maximum value in winter (daytime: 0.72~0.76, nighttime: 0.69~0.77). This pattern can be seemingly explained by the characteristics of AOD1 and N as discussed above, but by considering a roughly inverse proportional relationship [40,46,61]. The spatial distribution diagram also shows that PAOD1 exhibits a certain correlation with N; the larger the value of N, the smaller the value of PAOD1.
As shown in Figure 16b,e, the seasonal average values of VDR1 in spring (daytime: 0.21 ± 0.08, nighttime: 0.16 ± 0.07) and summer (daytime: 0.18 ± 0.08, nighttime: 0.15 ± 0.15) were higher than those in autumn (daytime: 0.14 ± 0.07, nighttime: 0.12 ± 0.07) and winter (daytime: 0.15 ± 0.09, nighttime: 0.12 ± 0.08), seemingly due to the severe sand-dust activity which led to the remarkable aspheric characteristics of aerosols [17,38,46,62]. The seasonal mean value of VDR1 in regions II and III was relatively close and higher than that in region I.
The seasonal average value of CR1 (Figure 16c,f) in the daytime did not exhibit significant seasonal variability (0.79 to 0.89), while the changes in the three regions were relatively small for each season. The seasonal variation of CR1 at nighttime is significant (0.88 to 1.49), which shows the following pattern: “summer > spring > autumn > winter”. Moreover, the seasonal variations in regions II and III were significantly higher than those of region I (Figure 13), seemingly because dust intensity in the aforementioned regions remained unchanged at nighttime during spring and summer, while the human activities significantly decreased. This resulted in the observation of the accumulation of more large particles of sand and dust in the bottom aerosol, which might also be related to the passage time of the satellite [42].

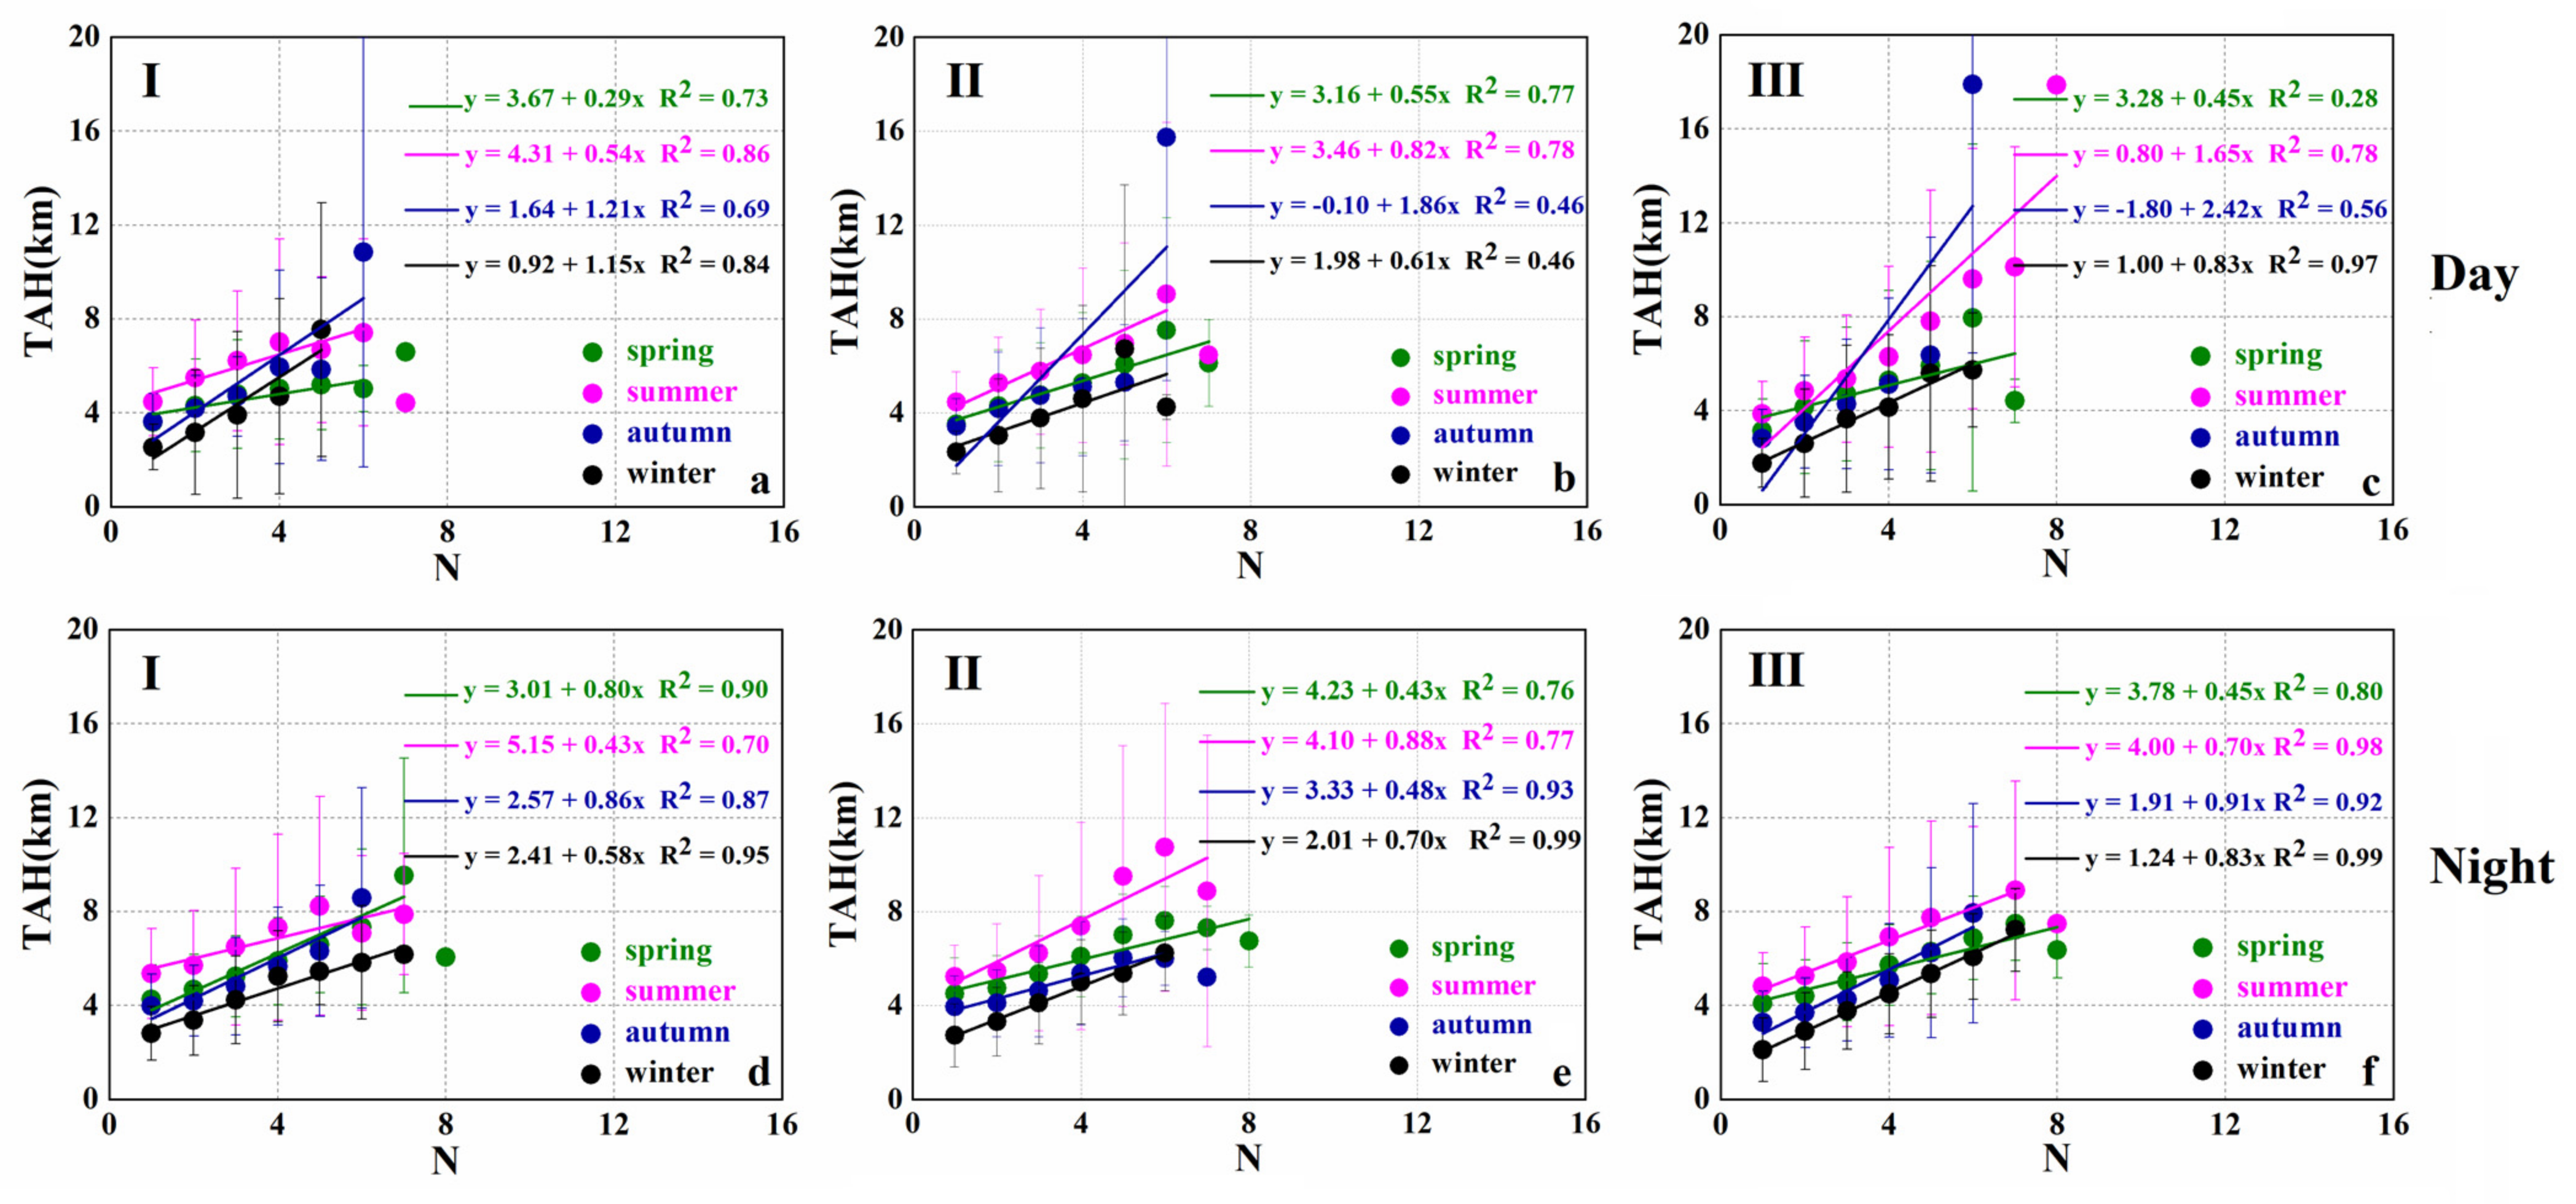
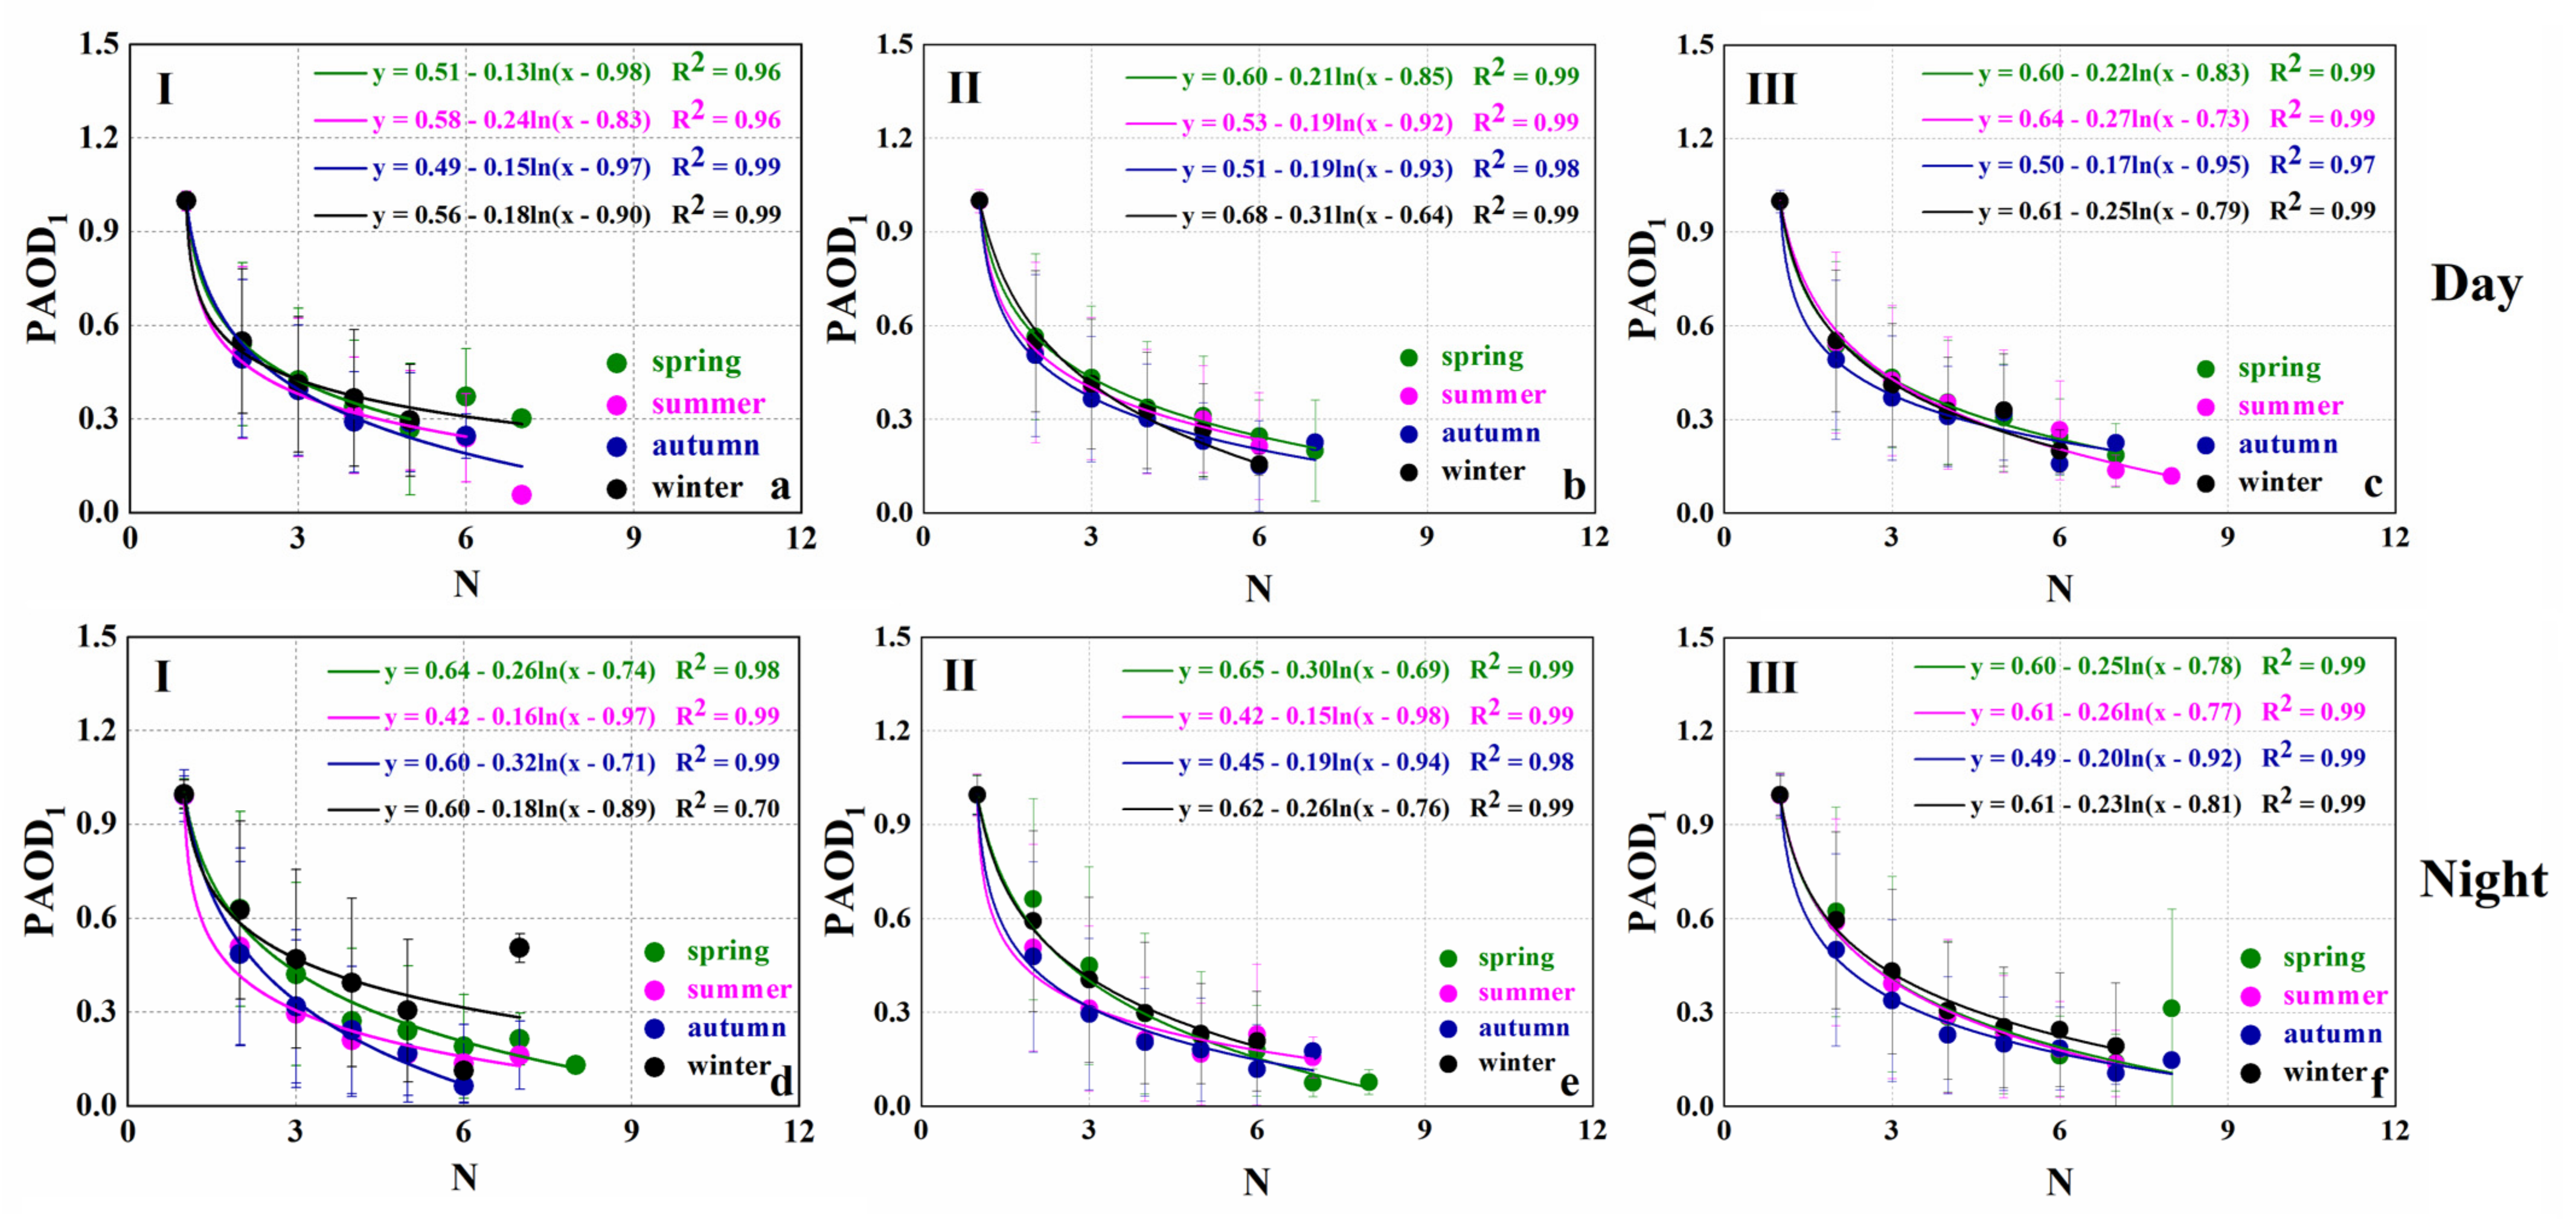
3.3. Correlation of Aerosol Properties over Saudi Arabia

To better understand the temporal and spatial distribution characteristics of aerosols over Saudi Arabia, the correlation among aerosol parameters was studied during spring, summer, autumn, and winter for different regions. The correlation between AOD1 and HTH1 in regions I, II, and III is shown in Figure 17. As shown in Figure 17, there exists a weak positive correlation between HTH1 and AOD1 in the three regions in the daytime, but the correlation is not significant (R2 < 0.5), indicating that the aerosol concentration is not high. Furthermore, Figure 17 shows that except autumn, there was a significant correlation between HTH1 and AOD1 in the three regions at nighttime (R2 > 0.6), indicating that the aerosol concentration in the three regions was higher at nighttime. This pattern can be associated with the downward movement of the upper aerosol layer due to the lower temperature at nighttime than that observed during the daytime. Moreover, most aerosols are concentrated in the bottom layer, being affected by dust storms, which further increases the aerosol concentration in the bottom layer. This observation is consistent with that reported in the previous studies [18,24,34,45].
Figure 18 displays the correlation between TAH and N in the daytime and nighttime, respectively. They all exhibit a positive correlation; that is, the greater the value of N, the greater the value of TAH. This is consistent with the logical hypothesis that the greater the number of aerosol layers (N), the thicker the atmosphere, leading to the obtainment of a higher TAH. These results are similar to those of studies conducted in Northeast China [51] and Pakistan [12]. It should be noted that the correlation between TAH and N at nighttime was greater than that during the daytime, indicating that the accumulation in the upper layer at nighttime was weaker than that in the daytime, and the TAH value was relatively stable.
As shown in Figure 19, there is a significant negative correlation between PAOD1 and N in the three regions of Saudi Arabia. Except for region I, the correlation was low at nighttime in winter (R2 = 0.7), and the correlation of the other two regions in each season was greater than 0.96. Since PAOD1 is the proportion of AOD of the lowest aerosol layer, more aerosol layer (N) leads to a smaller value of PAOD1, which is supported by data obtained from previous studies [58].

4. Conclusions

In this paper, Saudi Arabia is divided into three regions according to topography, and a long-term study of CALIPSO satellite aerosol data is carried out. The temporal and spatial distribution characteristics of the optical properties of vertical aerosol layers in Saudi Arabia from 2007 to 2019 were studied. The annual and seasonal changes in the nine parameters during the daytime and nighttime were analyzed and discussed in this study.
The annual average value of AODS in region III is the highest. The highest value is likely related to the climate characteristics of the region that includes an expansive desert and is located in the border area with a scarce population and lack of dust control measures. From a seasonal perspective, spring and summer exhibited higher AOD estimates than autumn and winter in the three regions, which was related to the frequent occurrence of dust weather in spring and summer.
The HB1 and TAH of the three regions exhibited an evident correlation with the topography of the region. Thus, it was inferred that the higher the altitude, the higher the annual mean values of HB1 and TAH. The value of HB1 was higher in the daytime than in the nighttime, while the value of TAH was higher in the nighttime than in the daytime. The annual mean for the spring and summer was slightly higher.
The N values over region III were the highest and the lowest over region I, respectively. This pattern can be explained by the higher average altitude, lower temperature, relatively weak vertical convection, and lower aerosol load in region I, resulting in the formation of relatively weak vertical aerosol layers. The N values of the other three regions are generally higher in spring and summer, seemingly due to the higher air temperature and considering the enhanced vertical convection, causing aerosol stratification. The value of AOD1 at nighttime was higher than that during the daytime, which might be related to the characteristics of dust aerosols.
The VDR1 values of regions II and III were relatively high, which may be attributable to the influence of large desert and dust aerosols in these two regions. The value at nighttime was higher than that in the daytime, which might be related to the dry deposition at nighttime. The high values in spring and summer can be attributed to the intensified dust activity. The CR1 values over regions II and III are higher at nighttime and are likely driven by the prevalence of the dust aerosol type in the bottom layer. There was a weak positive correlation between HTH1 and AOD1 in the three regions, but the correlation was not significant (R2 < 0.5), indicating that the aerosol concentration was insignificant. There was a strong positive correlation between TAH and N in the three regions. It was suggested that the greater the value of N, the greater the value of TAH. PAOD1 was negatively correlated with N.
The results from this study can be used for improving the regional statistics regarding aerosol distribution over Saudi Arabia that lacks a nationwide aerosol monitoring network. In this way, our results can facilitate the prevention and control of air pollution in Saudi Arabia, thus improving the well-being of the Saudi Arabian population and promoting the economic development of the country.

Author Contributions

Conceptualization, Z.Z.; software: B.S., M.P., S.I. and K.M.K.; validation, Z.Z., M.B., J.L. and Y.C.; investigation, Z.Z.; writing—original draft, Z.Z.; curation: B.S. and Z.Z. All authors read the manuscript, contributed to the discussion, and agreed to the published version of the manuscript. All authors have read and agreed to the published version of the manuscript.

Funding

This work was supported by the Programs for Science and Technology Development of Henan Province (grant number 202102310294), the Key Scientific Research Project of Henan institutions of higher learning (grant number 19B420002), the Nanyang Normal University Scientific Research Project (grant number ZX2018020), the National College Students Innovation and Entrepreneurship Training Program (no. 202010481053, 202010481049), the Deanship of Scientific Research at King Khalid University under Grant GRP.1/372/42, and the German Academic Exchange Service (DAAD) from funds of Federal Ministry for Economic Cooperation (BMZ), SDG nexus Network (grant number 57526248).

Institutional Review Board Statement

Not applicable.

Informed Consent Statement

Not applicable.

Data Availability Statement

Publicly available datasets were analyzed in this study.

Acknowledgments

We thank NASA for providing the CALIPSO datasets. We would also like to thank the editors for assisting in the linguistic refinement of this manuscript. The authors (Muhammad Bilal and Khaled Mohamed Khedher) extend their thanks to the Deanship of Scientific Research at King Khalid University for providing the funding.

Conflicts of Interest

The authors declare no conflict of interest.

References

  1. Kaufman, Y.J.; Tanre, D.; Boucher, O. A satellite view of aerosols in the climate system. Nature 2002, 419, 215–223. [Google Scholar] [CrossRef]
  2. Kulmala, M.; Kontkanen, J.; Junninen, H.; Lehtipalo, K.; Manninen, H.E.; Nieminen, T.; Petaja, T.; Sipila, M.; Schobesberger, S.; Rantala, P.; et al. Direct observations of atmospheric aerosol nucleation. Science 2013, 339, 943–946. [Google Scholar] [CrossRef] [PubMed]
  3. Lelieveld, J.; Evans, J.S.; Fnais, M.; Giannadaki, D.; Pozzer, A. The contribution of outdoor air pollution sources to premature mortality on a global scale. Nature 2015, 525, 367–371. [Google Scholar] [CrossRef] [PubMed]
  4. Han, G.; Xu, H.; Wei, G.; Liu, J.; Du, J.; Ma, X.; Liang, A. Feasibility study on measuring atmospheric CO2 in urban areas using spaceborne CO2-IPDA lidar. Remote Sens. 2018, 10, 985. [Google Scholar] [CrossRef] [Green Version]
  5. He, L.; Wang, L.; Lin, A.; Zhang, M.; Bilal, M.; Wei, J. Performance of the NPP-VIIRS and aqua-MODIS aerosol optical depth products over the Yangtze River basin. Remote Sens. 2018, 10, 117. [Google Scholar] [CrossRef] [Green Version]
  6. Remer, L.A.; Mattoo, S.; Levy, R.C.; Munchak, L.A. MODIS 3 km aerosol product: Algorithm and global perspective. Atmos. Meas. Tech. 2013, 6, 1829–1844. [Google Scholar] [CrossRef] [Green Version]
  7. Shen, X.; Sun, J.; Zhang, Y.; Weijun, L.I.; Chi, J.; Zhang, L.; Fan, R. The characteristics of atmospheric aerosol particle number size distribution in arctic Yellow River station influenced by long-range transport of autumn air mass. J. Glaciol. Geocryol. 2016, 38, 604–610. [Google Scholar]
  8. Shi, H.; Xiao, Z.; Zhan, X.; Ma, H.; Tian, X. Evaluation of MODIS and two reanalysis aerosol optical depth products over AERONET sites. Atmos. Res. 2019, 220, 75–80. [Google Scholar] [CrossRef]
  9. Bilal, M.; Nichol, J.E.; Chan, P.W. Validation and accuracy assessment of a simplified aerosol retrieval algorithm (SARA) over Beijing under low and high aerosol loadings and dust storms. Remote Sens. Environ. 2014, 153, 50–60. [Google Scholar] [CrossRef]
  10. Tian, X.; Liu, Q.; Li, X.; Wei, J. Validation and comparison of MODIS C6.1 and C6 aerosol products over Beijing, China. Remote Sens. 2018, 10, 2021. [Google Scholar] [CrossRef] [Green Version]
  11. Wang, Y.; Yuan, Q.; Li, T.; Shen, H.; Zheng, L.; Zhang, L. Evaluation and comparison of MODIS collection 6.1 aerosol optical depth against AERONET over regions in China with multifarious underlying surfaces. Atmos. Environ. 2019, 200, 280–301. [Google Scholar] [CrossRef] [Green Version]
  12. Zhang, M.; Su, B.; Bilal, M.; Atique, L.; Usman, M.; Qiu, Z.; Arfan Ali, M.; Han, G. An investigation of vertically distributed aerosol optical properties over Pakistan using CALIPSO satellite data. Remote Sens. 2020, 12, 2183. [Google Scholar] [CrossRef]
  13. Kang, N.; Kumar, K.R.; Hu, K.; Yu, X.; Yin, Y. Long-term (2002–2014) evolution and trend in collection 5.1 level-2 aerosol products derived from the MODIS and MISR sensors over the Chinese Yangtze River delta. Atmos. Res. 2016, 181, 29–43. [Google Scholar] [CrossRef]
  14. Muhammad, B.; Zhongfeng, Q.; James, C.; Scott, S.; Xiaojing, S.; Majid, N. A new MODIS C6 dark target and deep blue merged aerosol product on a 3 km spatial grid. Remote Sens. 2018, 10, 463. [Google Scholar]
  15. Klingmüller, K.; Pozzer, A.; Metzger, S.; Stenchikov, G.L.; Lelieveld, J. Aerosol optical depth trend over the middle east. Atmos. Chem. Phys. 2016, 16, 5063–5073. [Google Scholar] [CrossRef] [Green Version]
  16. Kumar, A.; Singh, N.; Anshumali; Solanki, R. Evaluation and utilization of MODIS and CALIPSO aerosol retrievals over a complex terrain in Himalaya. Remote Sens. Environ. 2018, 206, 139–155. [Google Scholar] [CrossRef]
  17. Ali, M.A.; Nichol, J.E.; Bilal, M.; Qiu, Z.; Mazhar, U.; Wahiduzzaman, M.; Almazroui, M.; Islam, M.N. Classification of aerosols over Saudi Arabia from 2004–2016. Atmos. Environ. 2020, 241, 117785. [Google Scholar] [CrossRef]
  18. Maghrabi, A.; Kudela, K. Relationship between time series cosmic ray data and aerosol optical properties: 1999–2015. J. Atmos. Sol.-Terr. Phys. 2019, 190, 36–44. [Google Scholar] [CrossRef]
  19. Qin, W.; Liu, Y.; Wang, L.; Lin, A.; Xia, X.; Che, H.; Muhammad, B.; Zhang, M. Characteristic and driving factors of aerosol optical depth over mainland China during 1980–2017. Remote Sens. 2018, 10, 1064. [Google Scholar] [CrossRef] [Green Version]
  20. Winker, D.M.; Pelon, J.; McCormick, M.P. The CALIPSO mission: Spaceborne lidar for observation of aerosols and clouds. Proc. SPIE 2003, 4893, 1211–1229. [Google Scholar]
  21. Chen, W.; Fan, A.; Yan, L. Performance of MODIS C6 aerosol product during frequent haze-fog events: A case study of Beijing. Remote Sens. 2017, 9, 496. [Google Scholar] [CrossRef] [Green Version]
  22. Jie, Z.; Xin, J.; Zhang, W.; Wang, S.; Wang, L.; Wei, X.; Xiao, G.; Pan, H.; Kong, L. Validation of MODIS C6 AOD products retrieved by the Dark Target method in the Beijing–Tianjin–Hebei urban agglomeration, China. Adv. Atmos. Sci. 2017, 34, 993–1002. [Google Scholar]
  23. Regmi, J.; Poudyal, K.N.; Pokhrel, A.; Gyawali, M.; Barinelli, A.; Aryal, R. Analysis of aerosol optical depth and angstrom exponents over an AERONET site at Pokhara, Nepal. BIBECHANA 2021, 18, 118–127. [Google Scholar] [CrossRef]
  24. Smirnov, A.; Holben, B.N.; Eck, T.F.; Slutsker, I.; Chatenet, B.; Pinker, R.T. Diurnal variability of aerosol optical depth observed at AERONET (aerosol robotic network) sites. Geophys. Res. Lett. 2002, 29, 2115. [Google Scholar] [CrossRef]
  25. Yong, X.; Zhang, Y.; Xiong, X.; Qu, J.J.; Che, H. Validation of MODIS aerosol optical depth product over China using CARSNET measurements. Atmos. Environ. 2011, 45, 5970–5978. [Google Scholar]
  26. Zhang, M.; Liu, J.; Li, W.; Bilal, M.; Zhao, F.; Zhang, C.; Yuan, B.; Khedher, K.M. Evaluation of the aqua-MODIS C6 and C6.1 aerosol optical depth products in the Yellow River Basin, China. Atmosphere 2019, 10, 426. [Google Scholar] [CrossRef] [Green Version]
  27. Georgoulias, A.K.; Alexandri, G.; Kourtidis, K.A.; Lelieveld, J.; Zanis, P.; Amiridis, V. Differences between the MODIS collection 6 and 5.1 aerosol datasets over the greater Mediterranean region. Atmos. Environ. 2016, 147, 310–319. [Google Scholar] [CrossRef]
  28. Schuster, G.L.; Vaughan, M.; MacDonnell, D.; Su, W.; Winker, D.; Dubovik, O.; Lapyonok, T.; Trepte, C. Comparison of CALIPSO aerosol optical depth retrievals to AERONET measurements, and a climatology for the lidar ratio of dust. Atmos. Chem. Phys. 2012, 12, 7431–7452. [Google Scholar] [CrossRef] [Green Version]
  29. Winker, D.M.; Hunt, W.H.; McGill, M. Initial performance assessment of CALIOP. Geophys. Res. Lett. 2007, 34, 228–262. [Google Scholar] [CrossRef] [Green Version]
  30. Winker, D.M.; Vaughan, M.A.; Omar, A.; Hu, Y.; Powell, K.A.; Liu, Z.; Hunt, W.H.; Young, S.A. Overview of the CALIPSO mission and CALIOP data processing algorithms. J. Atmos. Ocean. Technol. 2009, 26, 2310–2323. [Google Scholar] [CrossRef]
  31. Zhang, Z.; Zhang, M.; Bilal, M.; Su, B.; Zhang, C.; Guo, L. Comparison of MODIS- and CALIPSO-derived temporal aerosol optical depth over Yellow River Basin (China) from 2007 to 2015. Earth Syst. Environ. 2020, 4, 535–550. [Google Scholar] [CrossRef]
  32. Ali, M.A.; Assiri, M.; Dambul, R. Seasonal aerosol optical depth (AOD) variability using satellite data and its comparison over Saudi Arabia for the period 2002–2013. Aerosol Air Qual. Res. 2017, 17, 1267–1280. [Google Scholar] [CrossRef]
  33. Karimi, N.; Namdari, S.; Sorooshian, A.; Bilal, M.; Heidary, P. Evaluation and modification of SARA high-resolution AOD retrieval algorithm during high dust loading conditions over bright desert surfaces. Atmos. Pollut. Res. 2019, 10, 1005–1014. [Google Scholar] [CrossRef]
  34. Maghrabi, A.H.; Alotaibi, R.N. Long-term variations of AOD from an AERONET station in the central Arabian peninsula. Theor. Appl. Climatol. 2017, 134, 1015–1026. [Google Scholar] [CrossRef]
  35. Notaro, M.; Alkolibi, F.; Fadda, E.; Bakhrjy, F. Trajectory analysis of Saudi Arabian dust storms. J. Geophys. Res. Atmos. 2013, 118, 6028–6043. [Google Scholar] [CrossRef]
  36. Elhacham, E.; Alpert, P. Potential new aerosol source(s) in the Middle East. Sci. Total Environ. 2020, 726, 137925. [Google Scholar] [CrossRef]
  37. Ali, M.A.; Assiri, M. Analysis of AOD from MODIS-merged DT–DB products over the Arabian peninsula. Earth Syst. Environ. 2019, 3, 625–636. [Google Scholar] [CrossRef]
  38. Ali, M.A.; Assiri, M.E. Spatio-temporal analysis of aerosol concentration over Saudi Arabia using satellite remote sensing techniques. J. Soc. Space 2016, 12, 1–11. [Google Scholar]
  39. Butt, M.J.; Assiri, M.E.; Ali, M.A. Assessment of AOD variability over Saudi Arabia using MODIS deep blue products. Environ. Pollut. 2017, 231, 143–153. [Google Scholar] [CrossRef] [PubMed]
  40. Farahat, A.; El-Askary, H.; Al-Shaibani, A. Study of aerosols’ characteristics and dynamics over the kingdom of Saudi Arabia using a multisensor approach combined with ground observations. Adv. Meteorol. 2015, 2015, 247531. [Google Scholar] [CrossRef] [Green Version]
  41. Gharibzadeh, M.; Alam, K.; Abedini, Y.; Bidokhti, A.A.; Masoumi, A.; Bibi, H.; Zeb, B. Climatological analysis of the optical properties of aerosols and their direct radiative forcing in the Middle East. J. Atmos. Sol.-Terr. Phys. 2019, 183, 86–98. [Google Scholar] [CrossRef]
  42. Gonzalez, L.; Briottet, X. North Africa and Saudi Arabia day/night sandstorm survey (NASCube). Remote Sens. 2017, 9, 896. [Google Scholar] [CrossRef] [Green Version]
  43. Jassim, M.S.; Coskuner, G.; Zaid, M.; Malik, U. Analysis of aerosol optical depth over Bahrain and eastern province of Saudi Arabia based on MERRA-2 model. Int. J. Environ. Sci. Technol. 2020. [Google Scholar] [CrossRef]
  44. Yu, Y.; Notaro, M.; Liu, Z.; Wang, F.; Alkolibi, F.; Fadda, E.; Bakhrjy, F. Climatic controls on the interannual to decadal variability in Saudi Arabian dust activity: Toward the development of a seasonal dust prediction model. J. Geophys. Res. Atmos. 2015, 120, 1739–1758. [Google Scholar] [CrossRef]
  45. Sabetghadam, S.; Alizadeh, O.; Khoshsima, M.; Pierleoni, A. Aerosol properties, trends and classification of key types over the Middle East from satellite-derived atmospheric optical data. Atmos. Environ. 2021, 246, 118100. [Google Scholar] [CrossRef]
  46. Alam, K.; Iqbal, M.J.; Blaschke, T.; Qureshi, S.; Khan, G. Monitoring spatio-temporal variations in aerosols and aerosol–cloud interactions over Pakistan using MODIS data. Adv. Space Res. 2010, 46, 1162–1176. [Google Scholar] [CrossRef]
  47. Cullen, H.M. Asia, climate of southwest. In Encyclopedia of World Climatology; Springer: Dordrecht, The Netherlands, 2005. [Google Scholar]
  48. Omar, A.H.; Winker, D.M.; Vaughan, M.A.; Hu, Y.; Trepte, C.R.; Ferrare, R.A.; Lee, K.P.; Hostetler, C.A.; Kittaka, C.; Rogers, R.R.; et al. The CALIPSO automated aerosol classification and lidar ratio selection algorithm. J. Atmos. Ocean. Technol. 2009, 26, 1994–2014. [Google Scholar] [CrossRef]
  49. Liu, D.; Wang, Z.; Liu, Z.; Winker, D.; Trepte, C. A height resolved global view of dust aerosols from the first year CALIPSO lidar measurements. J. Geophys. Res. Atmos. 2008, 113, D16214. [Google Scholar] [CrossRef]
  50. Rogers, R.R.; Vaughan, M.A.; Hostetler, C.; Burton, S.P.; Ferrare, R.A.; Young, S.A.; Hair, J.W.; Obland, M.D.; Harper, D.B.; Cook, A.L.; et al. Looking through the haze: Evaluating the CALIPSO level 2 aerosol optical depth using airborne high spectral resolution lidar data. Atmos. Meas. Tech. 2014, 7, 4317–4340. [Google Scholar] [CrossRef] [Green Version]
  51. Su, B.; Li, H.; Zhang, M.; Bilal, M.; Wang, M.; Atique, L.; Zhang, Z.; Zhang, C.; Han, G.; Qiu, Z.; et al. Optical and physical characteristics of aerosol vertical layers over northeastern China. Atmosphere 2020, 11, 501. [Google Scholar] [CrossRef]
  52. Kim, S.W.; Berthier, S.; Raut, J.C.; Chazette, P.; Dulac, F.; Yoon, S.C. Validation of aerosol and cloud layer structures from the space-borne lidar CALIOP using a ground-based lidar in Seoul, Korea. Atmos. Chem. Phys. 2008, 8, 3705–3720. [Google Scholar] [CrossRef] [Green Version]
  53. Mamouri, R.E.; Amiridis, V.; Papayannis, A.; Giannakaki, E.; Tsaknakis, G.; Balis, D.S.J. Validation of CALIPSO space-borne-derived attenuated backscatter coefficient profiles using a ground-based lidar in Athens, Greece. Atmos. Meas. Tech. 2009, 2, 513–522. [Google Scholar] [CrossRef] [Green Version]
  54. Wang, K. Measurement biases explain discrepancies between the observed and simulated decadal variability of surface incident solar radiation. Sci. Rep. 2014, 4, 6144. [Google Scholar] [CrossRef] [PubMed] [Green Version]
  55. Badarinath, K.; Kharol, S.K.; Kaskaoutis, D.G.; Sharma, A.R.; Ramaswamy, V.; Kambezidis, H.D. Long-range transport of dust aerosols over the Arabian sea and Indian region—A case study using satellite data and ground-based measurements. Glob. Planet. Change 2010, 72, 164–181. [Google Scholar] [CrossRef]
  56. Bourgeois, Q.; Bey, I.; Stier, P. A permanent aerosol layer at the tropical tropopause layer driven by the intertropical convergence zone. Atmos. Chem. Phys. 2012, 12, 2863–2889. [Google Scholar]
  57. Mckendry, I.G.; Kamp, D.; Strawbridge, K.B.; Christen, A.; Crawford, B. Simultaneous observations of boundary-layer aerosol layers with CL31 ceilometer and 1064/532 nm lidar. Atmos. Environ. 2009, 43, 5847–5852. [Google Scholar] [CrossRef]
  58. Zhang, M.; Liu, J.; Bilal, M.; Zhang, C.; Zhao, F.; Xie, X.; Khedher, K.M. Optical and physical characteristics of the lowest aerosol layers over the Yellow River Basin. Atmosphere 2019, 10, 638. [Google Scholar] [CrossRef] [Green Version]
  59. Yu, Y.; Notaro, M.; Liu, Z.; Kalashnikova, O.; Alkolibi, F.; Fadda, E.; Bakhrjy, F. Assessing temporal and spatial variations in atmospheric dust over Saudi Arabia through satellite, radiometric, and station data. J. Geophys. Res. Atmos. 2013, 118, 13253–13264. [Google Scholar] [CrossRef]
  60. Zhang, M.; Wang, L.; Muhammad, B.; Gong, W.; Zhang, Z.; Guo, G. The characteristics of the aerosol optical depth within the lowest aerosol layer over the Tibetan plateau from 2007 to 2014. Remote Sens. 2018, 10, 696. [Google Scholar] [CrossRef] [Green Version]
  61. Reid, J.S.; Lagrosas, N.D.; Jonsson, H.H.; Reid, E.A.; Atwood, S.A.; Boyd, T.J.; Ghate, V.P.; Xian, P.; Posselt, D.J.; Simpas, J.B.; et al. Aerosol meteorology of maritime continent for the 2012 7SEAS southwest monsoon intensive study—Part 2: Philippine receptor observations of fine-scale aerosol behavior. Atmos. Chem. Phys. 2016, 16, 14057–14078. [Google Scholar] [CrossRef] [Green Version]
  62. Ali, M.; Tariq, S.; Mahmood, K.; Daud, A.; Batool, A. A study of aerosol properties over Lahore (Pakistan) by using AERONET data. Asia-Pac. J. Atmos. Sci. 2014, 50, 153–162. [Google Scholar] [CrossRef]
Figure 1. The geographic location of Saudi Arabia. The color variations represent the topography.
Applsci 12 00603 g001
Figure 2. Interannual variations of aerosol layers over Saudi Arabia (region I, region II, and region III) from 2007 to 2019. (a,d) The sum of the AOD from all the aerosol layers (AODS), (b,e) the base height of the lowest aerosol layer (HB1), and (c,f) the top altitude of the highest Aerosol Layer (TAH).
Applsci 12 00603 g002
Figure 3. Interannual variations of aerosol layers over Saudi Arabia (region I, region II, and region III) from 2007 to 2019. (a,d) The number of aerosol feature layers (N), (b,e) the AOD of the lowest aerosol layer (AOD1), and (c,f) the first layer is the thickness of the lowest aerosol layer (HTH1).
Applsci 12 00603 g003
Figure 4. Interannual variations of aerosol layers over Saudi Arabia (region I, region II, and region III) from 2007 to 2019. (a,d) the AOD proportion of the lowest aerosol layer (PAOD1), (b,e) the volume depolarization ratio of the lowest aerosol layer (VDR1), and (c,f) the color ratio of the lowest aerosol layer (CR1).
Applsci 12 00603 g004
Figure 5. Seasonal spatial distributions of AODS over Saudi Arabia from 2007 to 2019.
Applsci 12 00603 g005
Figure 6. Seasonal spatial distributions of HB1 over Saudi Arabia from 2007 to 2019.
Applsci 12 00603 g006
Figure 7. Seasonal spatial distributions of TAH over Saudi Arabia from 2007 to 2019.
Applsci 12 00603 g007
Figure 8. Seasonal spatial distributions of N over Saudi Arabia from 2007 to 2019.
Applsci 12 00603 g008
Figure 9. Seasonal spatial distributions of AOD1 over Saudi Arabia from 2007 to 2019.
Applsci 12 00603 g009
Figure 10. Seasonal spatial distributions of HTH1 over Saudi Arabia from 2007 to 2019.
Applsci 12 00603 g010
Figure 11. Seasonal spatial distributions of PAOD1 over Saudi Arabia from 2007 to 2019.
Applsci 12 00603 g011
Figure 12. Seasonal spatial distributions of VDR1 over Saudi Arabia from 2007 to 2019.
Applsci 12 00603 g012
Figure 13. Seasonal spatial distributions of CR1 over Saudi Arabia from 2007 to 2019.
Applsci 12 00603 g013
Figure 14. Seasonal variation in the optical and physical properties of aerosol layer over Saudi Arabia (regions I, II, and III) from 2007 to 2019. Where (a,d) represent AODS, (b,e) represent HB1, and (c,f) represent TAH.
Applsci 12 00603 g014
Figure 15. Seasonal variation in the optical and physical properties of aerosol layer over Saudi (regions I, II, and III) from 2007 to 2019. (a,d) represent N, (b,e) represent AOD1, and (c,f) represent HTH1.
Applsci 12 00603 g015
Figure 16. Seasonal variation in the optical and physical properties of aerosol layer over Saudi Arabia (regions I, II, and III) from 2007 to 2019. (a,d) represent PAOD1, (b,e) represent VDR1, and (c,f) represent CR1.
Applsci 12 00603 g016
Figure 17. The correlation between HTH1 and AOD1 over Saudi Arabia from 2007 to 2019. (a,d) represent region I, (b,e) represent region II, and (c,f) represent region III.
Applsci 12 00603 g017
Figure 18. The correlation between TAH and N over Saudi Arabiafrom 2007 to 2019. (a,d) represent regions I, (b,e) represent regions II, and (c,f) represent regions III.
Applsci 12 00603 g018
Figure 19. The correlation between PAOD1 and N over Saudi Arabia from 2007 to 2019. (a,d) represent regions I, (b,e) represent regions II, and(c,f) represent regions III.
Applsci 12 00603 g019
Table 1. The list of abbreviations of aerosol optical physical parameters in this paper.
ParameterAbbreviationParameterAbbreviation
AOD of the lowest aerosol layerAOD1The base height of the lowest aerosol layerHB1
The top height of the lowest aerosol layerHT1The color ratio of the lowest aerosol layerCR1
AOD proportion of the lowest aerosol layerPAOD1Volume depolarization ratio of the lowest aerosol layer VDR1
Number of aerosol feature layersNThe top altitude of the highest aerosol layerTAH
The sum of the AOD derived from all aerosol layersAODSThe thickness of the lowest aerosol layerHTH1
Publisher’s Note: MDPI stays neutral with regard to jurisdictional claims in published maps and institutional affiliations.

