
Early Risk Prediction of Diabetes Based on GA-Stacking


Abstract
:
1. Introduction
2. Materials and Methods
2.1. Stacking
2.2. CNN
2.3. SVM
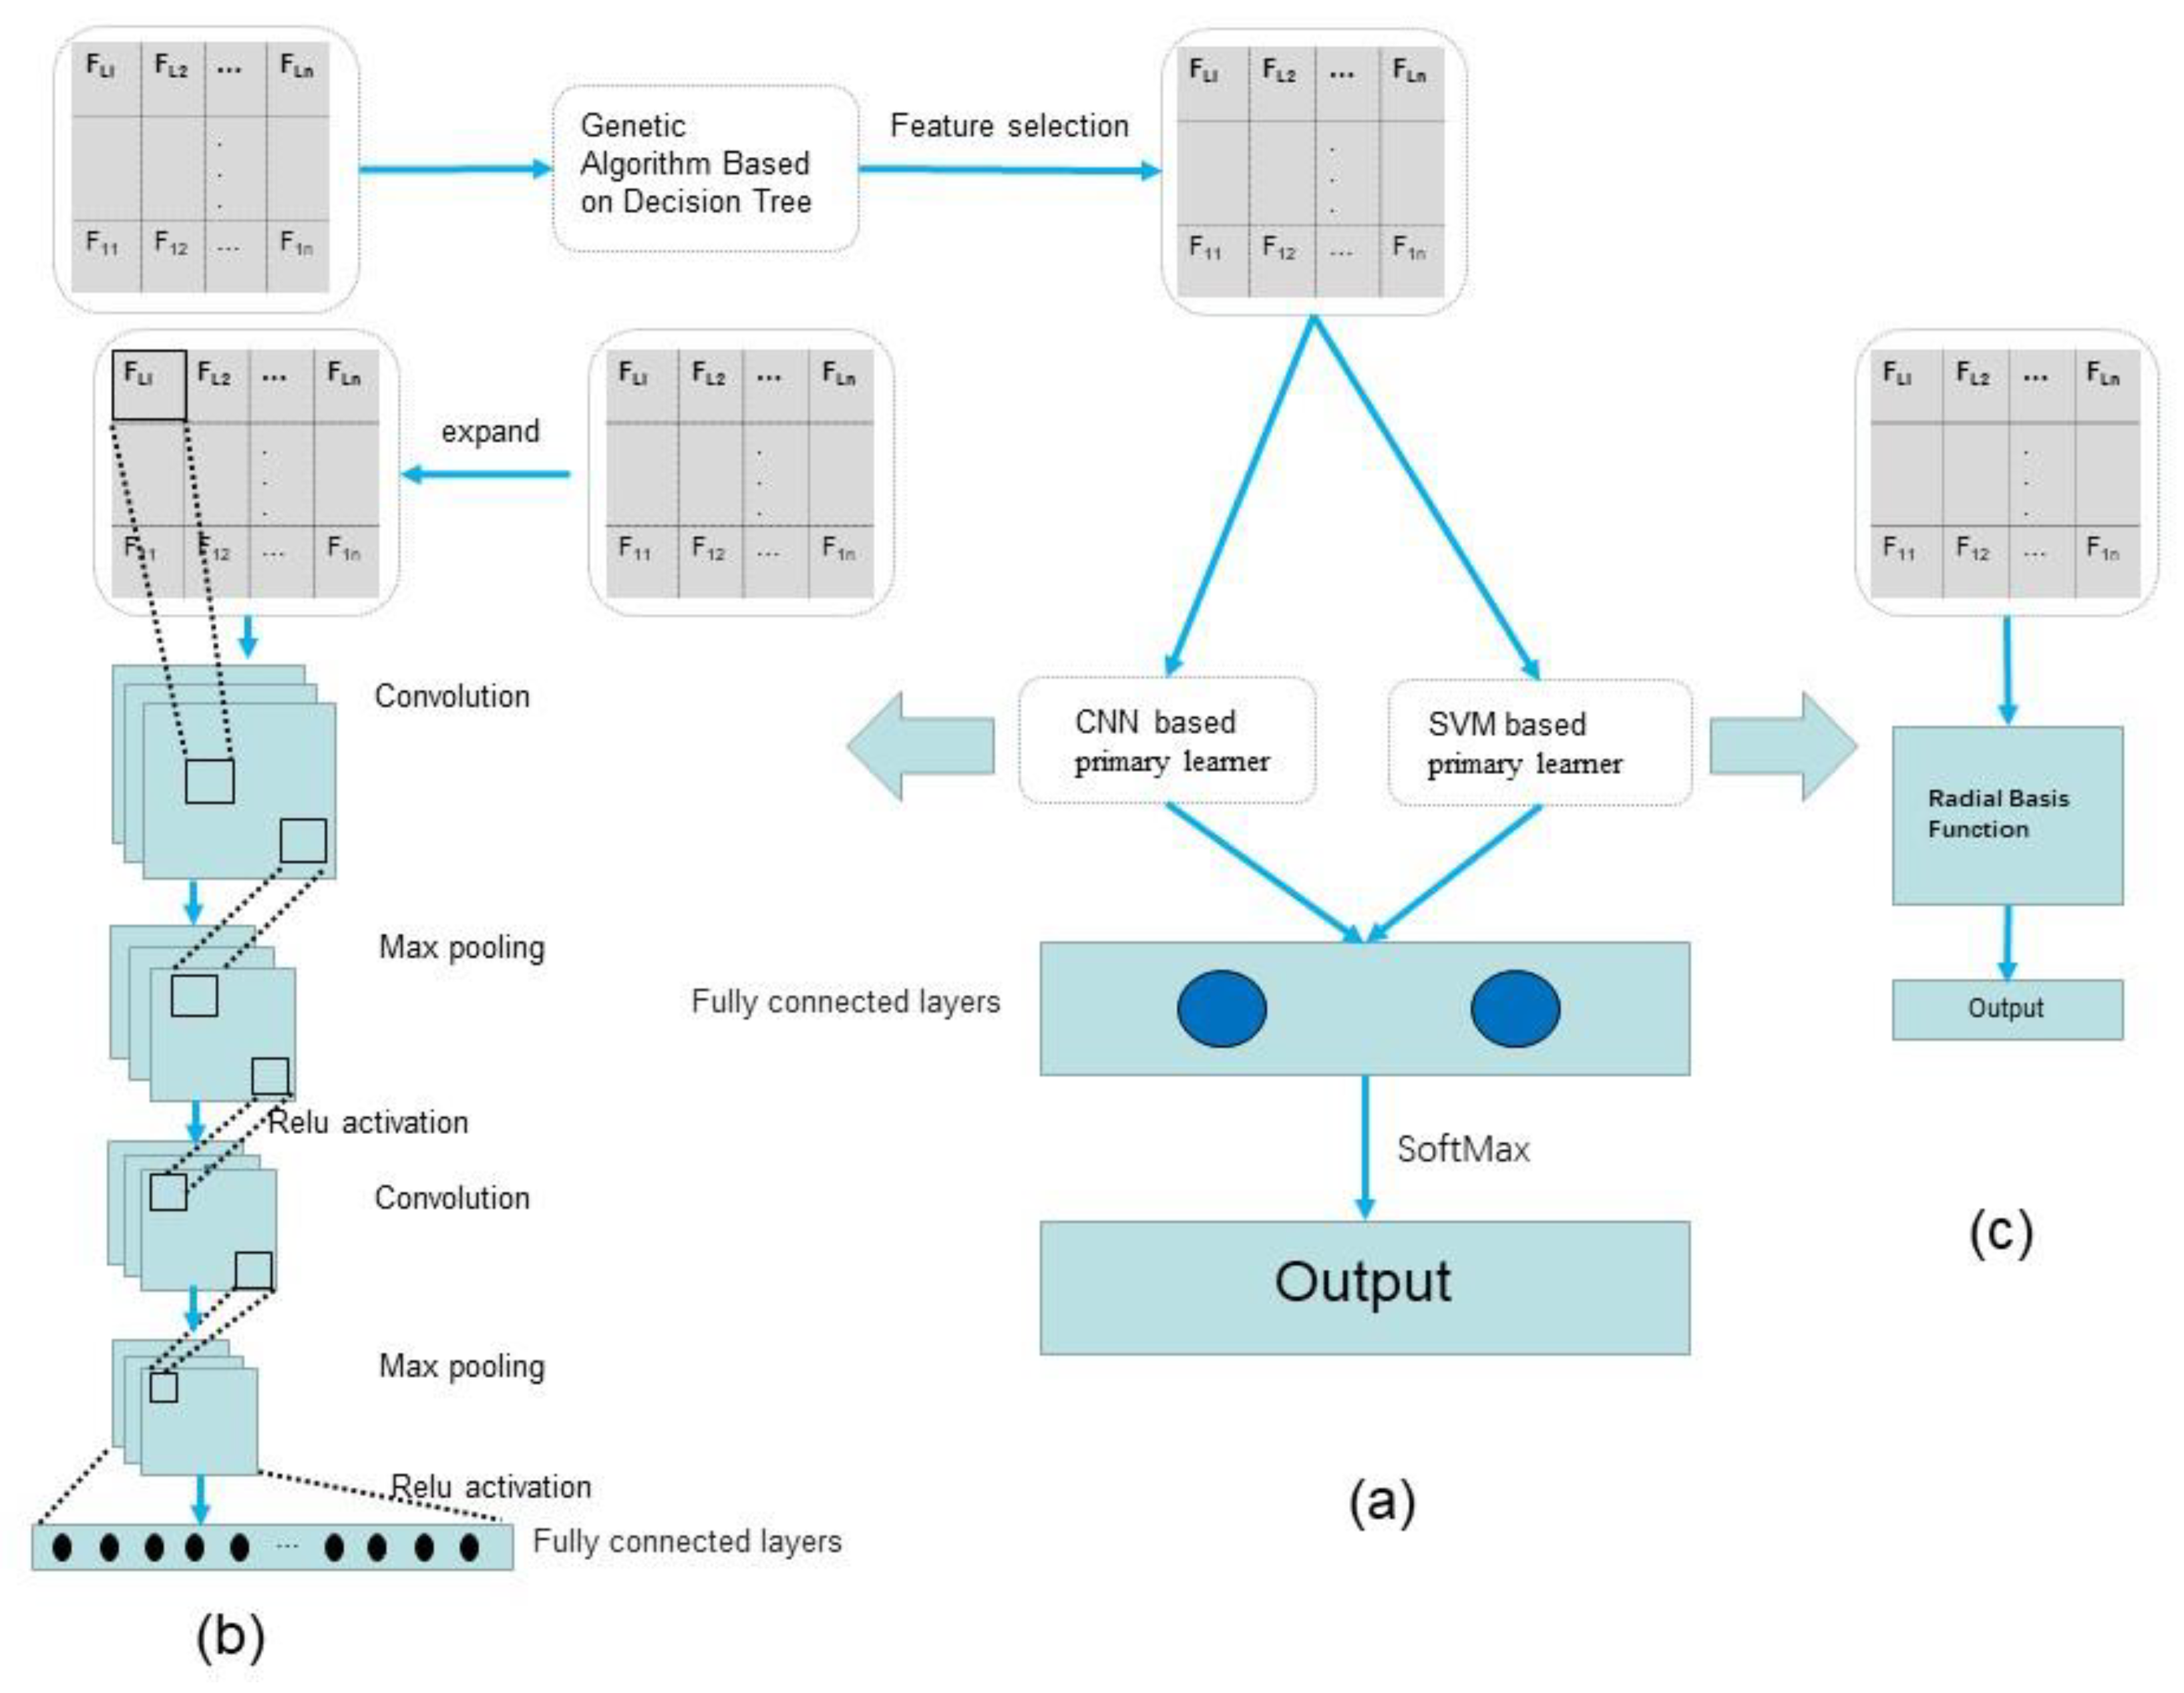
3. GA-Stacking
3.1. GA for the Feature Selection in Classifiers Based on DT
- Initialization: We set the number of evolutions to 100, the crossover probability to 0.6, the mutate probability to 0.01, and the number of chromosomes to 32, that is, the number of attributes in the physical examination dataset. We initialize the evolution counter . For the training data of the physical examination dataset, whether to be selected or not is encoded in binary. When , it indicates that this attribute is selected, and indicates that it is not selected. Each generation produces a population composed of 20 individuals, and the first generation is the initial population .
- Calculate individual fitness: Calculate the fitness of each individual in the population of the current evolutionary generation. The attributes coded as 1 in the individual are classified by DT, and its F1-Score is used as the fitness of this individual.
- Select, crossover, and mutate: The roulette wheel selection is applied to the population based on fitness. The higher the fitness, the higher the probability of being selected. The selected individual will be the parent of . Firstly, according to the crossover probability , select two consecutive individuals in the population, and then exchange their gene selected by a random function to form a new individual. Secondly, according to the mutate probability , select some individuals in the population and select the position of the mutated gene through a random function. If the original gene is 0, it will be mutated to 1, and vice versa. After the above operations, is generated.
| Algorithm 1 Genetic Algorithm for the feature selection in classifiers based on Decision Tree |
| Input: Attributes: X = , Class: Y ∈ {0, 1} |
| Output: Binary coded attributes which are selected |
| 1: Initial the number of evolutions: T = 100, the number of attributes: n = 32, Crossover probability: Pc = 0.6, Mutate probability: Pm = 0.01, Evolution counter: t = 0, Initial population with 20 randomly generated individuals: P (0). |
| 2: function FITNESS (P (t)): |
| 3: for i = 0; i < sizeof (P (t)); i + + do |
| 4: // Determine the selected attributes according to P(t). |
| 5: for j = 0; j < sizeof (P (t)[i]); j + + do |
| 6: if P (t)[i][j] == 1 then |
| 7: Attributespostion.push(j); |
| 8: end if |
| 9: end for |
| 10: X = {xi}Attributespostion; |
| 11: Score(p(t)). push (F 1score (X, Y)); |
| 12: end for |
| 13: return Score(p(t)); |
| 14: end function |
| 15: while t < T + 1 do |
| 16: // Individuals with higher fitness are more likely to be selected. |
| 17: Parent1=Select (P (t), FITNESS (P (t))), Parent2=Select (P (t), FITNESS (P (t))); |
| 18: // Randomly select the position of the gene value and exchange the selected gene value of Parent1 and Parent2. |
| 19: Child=Crossover (Parent1, Parent2, Pc); |
| 20: // Randomly select the position of the mutated gene value. If the original gene value is 0, it will be mutated to 1, and vice versa. |
| 21: Child=Mutate (Child, Pm); |
| 22: P(t+1). push (Child); |
| 23: end while |
| 24: return Max (FITNESS (P (T))) |
3.2. Stacking Based on CNN and SVM
4. Results
4.1. Data Set and Data Preprocessing
- Data cleaning: Before data modeling, data cleaning can make the model more effectively extract the actual group characteristics. For the physical examination dataset, mode imputation was used to fill the samples with a few missing attribute columns. Samples with more than 10 attribute columns missing were deleted.
- Data encoding: One-hot encoding was performed on the sex attribute to make the calculation of the loss function more reasonable and improve the accuracy of the model.
- Data discretization: In the physical examination data, some samples were at the same age. After discretization, the model will be more stable. Moreover, the risk of fitting will be reduced.
- Data normalization: After the dataset was normalized using the Equation (8), the convergence speed and accuracy of the model could be effectively improved.
4.2. Evaluation Criteria
4.3. Experiments and Results
4.3.1. Evaluation between Different Models on Qingdao Physical Examination Dataset
4.3.2. Evaluation between Different Models on the Early-Stage Diabetes Risk Prediction Dataset Published by UCI
5. Discussion
- Using GA based on DT for feature selection effectively improves the speed of prediction and accuracy of the model.
- Based on stacking, using a fully connected layer combined with two primary learners, CNN and SVM, can process the input more accurately and make the model have great generalization capabilities.
Author Contributions
Funding
Acknowledgments
Conflicts of Interest
Appendix A

| Attributes | Attributes Description |
|---|---|
| Sex | 1. Male 2. Female |
| Date of birth | 1916/1–1969/1 |
| Date of physical examination | 2016–2019 |
| Body temperature | 35.8–37.3 |
| Breathing rate | |
| Pulse rate | |
| Right side high blood pressure | |
| Right side low blood pressure | |
| Left side high blood pressure | |
| Left side blood pressure | |
| Height | |
| Waistline | |
| Weight | |
| BMI | Body Mass Index |
| WBC | White Blood Cell Count |
| HGB | Hemoglobin |
| PLT | Platelet count |
| PRO | Proteinuria < 0.1g/24 h: −; 0.1 g/24 h < Proteinuria < 0.2 g/24 h: ±; 0.2 g/24 h < Proteinuria < 1.0 g/24 h: +; 1.0 g/24 h < Proteinuria < 2.0 g/24 h: ++; 2.0 g/24 h < Proteinuria < 4.0 g/24 h: +++; Proteinuria > 4.0 g/24 h: ++++. |
| GLU | Glucose in urine < 2.8 mmol/L: −; Glucose in urine < 5.5 smmol/L: ±; Glucose in urine < 27.8 mmol/L: +; 27.8mmol/L < Glucose in urine < 55 mmol/L: ++; 55mmol/L < Glucose in urine < 111.1 mmol/L: +++; Glucose in urine > 111.1 mmol/L: ++++. |
| KET | Ketone < 0.5 mmol/L: −; 0.5 mmol/L < Ketone < 1.5 mmol/L: +; 1.5 mmol/L < Ketone < 3.9 mmol/L: ++; 3.9 mmol/L < Ketone < 7.8 mmol/L: +++; 7.8 mmol/L < Ketone < 15.6 mmol/L: ++++; |
| ERY | At high magnification, less than 10 RBC cells were found.: −; At high magnification, 10 erythrocytes were found.: +; At high magnification, 20 erythrocytes were found.: ++; At high magnification, 30 erythrocytes were found.: +++; |
| Uric acid | |
| SCR | Serum creatinine |
| BUN | |
| ALT | |
| AST | |
| ALB | |
| TBIL | |
| SCR | |
| BUN | |
| CHO | |
| TG | |
| LDLC | |
| HDLC | |
| Class | Fasting plasma glucose (FPG) < 7.5: 0; Fasting plasma glucose (FPG) ≥ 7.5: 1; |
| Attributes | Values |
|---|---|
| Age | 16–90 |
| Sex | 1. Male 2. Female |
| Polyuria | 1. Yes 2. No |
| Polydipsia | 1. Yes 2. No |
| Sudden weight loss | 1. Yes 2. No |
| Weakness | 1. Yes 2. No |
| Polyphagia | 1. Yes 2. No |
| Genital thrush | 1. Yes 2. No |
| Visual blurring | 1. Yes 2. No |
| Itching | 1. Yes 2. No |
| Irritability | 1. Yes 2. No |
| Delayed healing | 1. Yes 2. No |
| Partial paresis | 1. Yes 2. No |
| Muscle stiffness | 1. Yes 2. No |
| Alopecia | 1. Yes 2. No |
| Obesity | 1. Yes 2. No |
| Class | 1. Positive 2. Negative |
References
- Richard, H. The neglected epidemic of chronic disease. Lancet 2005, 366, 1514. [Google Scholar]
- Kumari, V.A.; Chitra, R. Classification of diabetes disease using support vector machine. Int. J. Eng. Res. Appl. 2013, 3, 1797–1801. [Google Scholar]
- Islam, M.M.F.; Ferdousi, R.; Rahman, S.; Bushra, H.Y. Likelihood Prediction of Diabetes at Early Stage Using Data Mining Techniques. In Computer Vision and Machine Intelligence in Medical Image Analysis; Springer: Singapore, 2020; pp. 113–125. [Google Scholar]
- Alpan, K.; Ilgi, G.S. Classification of Diabetes Dataset with Data Mining Techniques by Using WEKA Approach. In Proceedings of the 2020 4th International Symposium on Multidisciplinary Studies and Innovative Technologies (ISMSIT), Istanbul, Turkey, 22–24 October 2020; pp. 1–7. [Google Scholar]
- Chaves, L.; Marques, G. Data Mining Techniques for Early Diagnosis of Diabetes: A Comparative Study. Appl. Sci. 2021, 11, 2218. [Google Scholar] [CrossRef]
- Rahman, M.; Islam, D.; Mukti, R.J. A deep learning approach based on convolutional LSTM for detecting diabetes. Comput. Biol. Chem. 2020, 88, 107329. [Google Scholar] [CrossRef] [PubMed]
- Kearns, M.; Valiant, L.G. Learning Boolean Formulae or Finite Automata Is as Hard as Factoring; Technical report TR-14-88; Harvard University Aiken Computation Lab: Cambridge, CM, USA, 1988. [Google Scholar]
- Wolpert, D.H. Stacked generalization. Neural Netw. 1992, 5, 241–259. [Google Scholar] [CrossRef]
- Schapire, R. The strength of weak learnability. Mach. Learn. 1990, 5, 197–227. [Google Scholar] [CrossRef] [Green Version]
- Ali, S.; Majid, A. Can-evo-ens: Classifier stacking based evolutionary ensemble system for prediction of human breast cancer using amino acid sequences. J. Biomed. Inform. 2015, 54, 256–269. [Google Scholar] [CrossRef] [PubMed] [Green Version]
- Cilia, N.D.; Stefano, C.D.; Fontanella, F. Variablelength representation for EC-based feature selection in high-dimensional data. In Proceedings of the International Conference on the Applications of Evolutionary Computation, Leipzig, Germany, 24–26 April 2019; pp. 325–340. [Google Scholar]
- Xue, B.; Zhang, M.; Browne, W.N.; Yao, X. A survey on evolutionary computation approaches to feature selection. IEEE Trans. Evol. Comput. 2015, 20, 606–626. [Google Scholar] [CrossRef] [Green Version]
- Ismail, L.; Materwala, H.; Tayefi, M. Type 2 Diabetes with Artificial Intelligence Machine Learning: Methods and Evaluation. Arch. Comput. Methods Eng. 2021, 29, 1–21. [Google Scholar] [CrossRef]
- Cerrada, M.; Zurita, G.; Cabrera, D.; Sánchez, R.V.; Artés, M.; Li, C. Fault diagnosis in spur gears based on genetic algorithm and random forest. Mech. Syst. Signal Processing 2016, 70, 87–103. [Google Scholar] [CrossRef]
- Li, X.; Zhang, J.; Safara, F. Improving the Accuracy of Diabetes Diagnosis Applications through a Hybrid Feature Selection Algorithm. Neural Processing Lett. 2021, 1–17. Available online: https://link.springer.com/article/10.1007/s11063-021-10491-0#citeas (accessed on 1 December 2021). [CrossRef] [PubMed]
- Wei, J.; Shaofu, L. The Risk Prediction of Type 2 Diabetes based on XGBoost. In Proceedings of the 2019 2nd International Conference on Mechanical, Electronic and Engineering Technology (MEET 2019), Xi’an, China, 19–20 January 2019; pp. 156–161. [Google Scholar]
- Sarkar, T. XBNet: An Extremely Boosted Neural Network. arXiv 2021, arXiv:2106.05239. Available online: https://arxiv.53yu.com/abs/2106.05239 (accessed on 1 December 2021).
- Gu, J.; Wang, Z.; Kuen, J. Recent Advances in Convolutional Neural Networks. Comput. Sci. 2015, 77, 354–377. [Google Scholar] [CrossRef] [Green Version]
- Goodfellow, I.; Bengio, Y.; Courville, A. Deep Learning; MIT Press: Cambridge, CM, USA, 2016; pp. 326–366. [Google Scholar]
- Lecun, Y.; Kavukcuoglu, K.; Cle’ment, F. Convolutional networks and applications in vision. In Proceedings of the 2010 IEEE International Symposium on Circuits and Systems, Paris, France, 30 May–2 June 2010; pp. 253–256. [Google Scholar]
- Waibel, A.; Hanazawa, T.; Hinton, G. Phoneme recognition using time-delay neural networks. IEEE Trans. Acoust. 2002, 37, 328–339. [Google Scholar] [CrossRef]
- Mohandes, M.A.; Halawani, T.O.; Rehman, S.; Hussain, A.A. Support vector machines for wind speed prediction. Renew Energy 2004, 29, 939–947. [Google Scholar] [CrossRef]
- Pedregosa, F.; Varoquaux, G.; Gramfort, A. Scikit-learn: Machine Learning in Python. J. Mach. Learn. Res. 2011, 12, 2825–2830. [Google Scholar]

| Model | Time | Acc (%) | Pre (%) | Sen (%) | Spe (%) | F1-Score (%) |
|---|---|---|---|---|---|---|
| KNN | 0.637 | 79.15 | 50.74 | 27.41 | 92.91 | 35.60 |
| GA-KNN | 0.614 | 81.07 | 58.22 | 35.21 | 93.27 | 43.89 |
| SVM | 1.671 | 84.36 | 100 | 30.37 | 100 | 46.59 |
| GA-SVM | 1.572 | 84.48 | 100 | 30.91 | 100 | 47.22 |
| LR | 0.085 | 84.07 | 95.76 | 29.57 | 99.64 | 45.18 |
| GA-LR | 0.067 | 84.10 | 98.21 | 30.37 | 99.85 | 46.39 |
| NB | 0.175 | 84.25 | 89.92 | 32.53 | 98.99 | 48.92 |
| GA-NB | 0.137 | 84.45 | 97.58 | 33.60 | 99.78 | 48.92 |
| CNN | 24.360 | 84.97 | 100 | 29.30 | 100 | 45.32 |
| GA-CNN | 21.857 | 85.08 | 100 | 30.10 | 100 | 46.27 |
| Stacking | 52.500 | 85.14 | 94.30 | 36.29 | 98.74 | 52.41 |
| GA-stacking | 48.652 | 85.88 | 96.12 | 39.24 | 99.92 | 55.73 |
| Model | Acc (%) | Pre (%) | Sen (%) | Spe (%) | F1-Score (%) |
|---|---|---|---|---|---|
| KNN | 96.79 | 93.84 | 98.38 | 95.74 | 96.06 |
| SVM | 96.79 | 96.72 | 95.16 | 97.87 | 95.93 |
| LR | 93.54 | 93.33 | 90.32 | 95.74 | 91.80 |
| NB | 89.10 | 90.90 | 80.64 | 94.68 | 85.47 |
| CNN | 96.79 | 98.86 | 93.30 | 98.93 | 95.86 |
| GA-stacking | 98.71 | 100 | 96.77 | 100 | 98.36 |
Publisher’s Note: MDPI stays neutral with regard to jurisdictional claims in published maps and institutional affiliations. |
© 2022 by the authors. Licensee MDPI, Basel, Switzerland. This article is an open access article distributed under the terms and conditions of the Creative Commons Attribution (CC BY) license (https://creativecommons.org/licenses/by/4.0/).
Share and Cite
Tan, Y.; Chen, H.; Zhang, J.; Tang, R.; Liu, P. Early Risk Prediction of Diabetes Based on GA-Stacking. Appl. Sci. 2022, 12, 632. https://doi.org/10.3390/app12020632
Tan Y, Chen H, Zhang J, Tang R, Liu P. Early Risk Prediction of Diabetes Based on GA-Stacking. Applied Sciences. 2022; 12(2):632. https://doi.org/10.3390/app12020632
Chicago/Turabian StyleTan, Yaqi, He Chen, Jianjun Zhang, Ruichun Tang, and Peishun Liu. 2022. "Early Risk Prediction of Diabetes Based on GA-Stacking" Applied Sciences 12, no. 2: 632. https://doi.org/10.3390/app12020632
APA StyleTan, Y., Chen, H., Zhang, J., Tang, R., & Liu, P. (2022). Early Risk Prediction of Diabetes Based on GA-Stacking. Applied Sciences, 12(2), 632. https://doi.org/10.3390/app12020632