Article

Investigating Planting Concrete Suitability by Evaluating the Physiological Indexes of Three Ground Cover Plants

1
College of Landscape Architecture, Sichuan Agricultural University, Chengdu 611130, China
2
College of Civil Engineering, Sichuan Agricultural University, Dujiangyan 611830, China
3
Department of Landscape Architecture, Zhejiang A&F University, Hangzhou 311300, China
*
Author to whom correspondence should be addressed.
Appl. Sci. 2022, 12(2), 645; https://doi.org/10.3390/app12020645
Submission received: 7 December 2021 / Revised: 4 January 2022 / Accepted: 5 January 2022 / Published: 10 January 2022

Abstract

:
Concrete is one of the most widely used construction materials for basic infrastructure worldwide, especially in developing areas undergoing rapid urbanization. However, concrete inhibits energy exchange between soil and other ecosystem components. To enhance the fluxion of information between ecosystems, surface vegetation, and basement soil, this paper aims to explore the tolerance of plants growing on PC. Therefore, we investigated two different PC sample groups with aggregate particle diameters of 5–10 and 15–20 mm. After curing, the samples were used to plant three ground cover plants (Cynodon dactylon (L.) Pers, Agrostis stolonifera, and Sasa argenteostriatus, e.g., Camus), and the results were compared with those from normal soil without PC underneath as a reference. During an observational period of 12 weeks, the growth and height of the plants were documented and analysed. The physiological indexes of free proline (Pro), malondialdehyde (MDA), chlorophyll (Chl), relative electrical conductivity (REC), and soluble protein (SP) were investigated. The correlations and significant differences between these indexes based on the treatments were analysed. Then, principal component analysis (PCA) was used to determine the main variables affecting plant growth. The results showed that there were significant differences between the PC groups and the natural growth group. The growth and height of the three plant species under near-natural (nonconcrete) conditions were better than those of the plants in the PC treatments. The plants in the large-particle concrete (LC) treatment group showed better adaptability than those in the small-particle concrete (SC) treatment group in terms of growth, although both PC treatments resulted in various degrees of damage. PCA showed that SP, REC, and MDA were the most influential factors on plant growth in this study.

1. Introduction

Building materials such as cement mortar and concrete are the most commonly used materials worldwide. A compact structure, rough surface, and low tactility are characteristics of these materials. However, the low air and water permeability of these materials, including concrete, leads to impervious surfaces that poorly regulate the air temperature and humidity; therefore, the soil beneath hard pavement exhibits low bacterial diversity [1]. The negative effect of concrete corrosion has been evaluated on highway roadsides and in terms of slope soil chemical properties, existing vegetation, and rainfall runoff [2]. With the rapid development of civil engineering and public concern about ecological restoration, alternative materials with special functions and less risk to the environment have been developed [3,4,5].
Planting concrete (PC), also called vegetation concrete or ecological concrete, is an eco-friendly material that allows plants to grow directly on it, and the roots of certain plants can survive in their limited voids. In general, PC is composed of coarse aggregates, Portland cement, water, and admixtures. PC has some ecological advantages over traditional concrete that can be expressed, and PC has good engineering and ecological performance as follows: PC can affect the growth of plants; has good drainage properties and high noise absorption properties, attributed to its high porosity; and its permeable surfaces allow water to pass through and reduce the temperature in built-up areas. However, its disadvantages are equally evident. It performed poorly in compressive strength, abrasion and freeze-thaw resistance because its paste hardness, aggregate hardness, and aggregate/paste bond were reduced [6]. The plants attached to PC have an interdependent relationship with it. A large amount of nutrients and water in the connected pores between aggregates would provide a basic guarantee for plant growth. The literature provides evidence that the partial replacement of Portland cement with recycled ash and the strength indicators of the thus-developed concrete were improved compared to those of a reference and concretes containing conventional admixtures in their composition [7]. The CO2 emissions of concrete developed using water-retaining products such as rice husk ash were considered by Mohammed [8]. PC has received much attention from many experts, and in certain investigations, PC was developed using recycled aggregates of demolished concrete as raw material to improve its fertilizer retention properties and reduce its cost [9]. Urban bamboo bioretention attained with fly ash-amended concrete and Dracaena sanderiana was used for urban stormwater volume control and rainwater purification [10]. Reformative concretes were used to investigate the decontamination effect of rainfall surface runoff and its impacts on changes in dissolved organic matter [11]. According to its eco-friendly features, PC can be widely used as a multifunctional material in urban recreational spaces, parking lots, and roof gardens, thereby greatly increasing urban green coverage and improving the ecological environment. PC is one of the most commonly used materials for slope protection and river revetment, and it can prevent soil erosion and improve the local ecological environment [12]. Therefore, PC has broad application prospects in soil and urban rainfall runoff conservation, slope greening, ornamental decoration, disaster prevention and reduction, human health care, and other aspects of environmental protection. Many studies on these topics have been previously performed by scholars. The mix proportions that could minimize CO2 emissions while satisfying the performance target of porous PC were determined by Hwang-Hee Kim and Chan-Gi Park in 2017 [13]. Laibo Li used modified soil with a natural superabsorbent polymer (SAP) to prepare a kind of material that can enhance the anti-erosion and water retention properties of plant growth in ecological concrete. At an SAP content of 1.5 wt%, soil water absorption was increased by 69.4% [14]. PC used in a grid beam structure system for roadside soil protection, concrete stability, and adaptation tolerance of plants was investigated by Bao Xiaohua et al. in 2017 [15], and Zheng (2019) evaluated the feasibility and permeability resistance of PC used as a basic material for sea water curing [16]. The removal of nutrients from coastal sediments by ecological concrete and its effect on the sediment microbial community were studied by Lemian Lu et al. The results showed that the average removal efficiencies of total nitrogen and total phosphorus were 11.50% and 30.31%, respectively [17].
Researchers have studied eco-friendly materials in many ways, and numerous achievements in this field have been accomplished. However, most of these studies have mainly been conducted from an engineering perspective. Ecological restoration is a multidisciplinary issue consisting of civil engineering, ecology, botany, landscape architecture, etc. Few studies have been conducted from the perspective of plant adaptation [18]. This paper provides evidence relying on plant physiology to systematically analyse and investigate the effect of the aggregate diameter on the physical performance to determine whether the influence of different concrete specimens on three plant species is notable. These plants are most commonly used in Southeast China as ground cover.

2. Materials and Methods
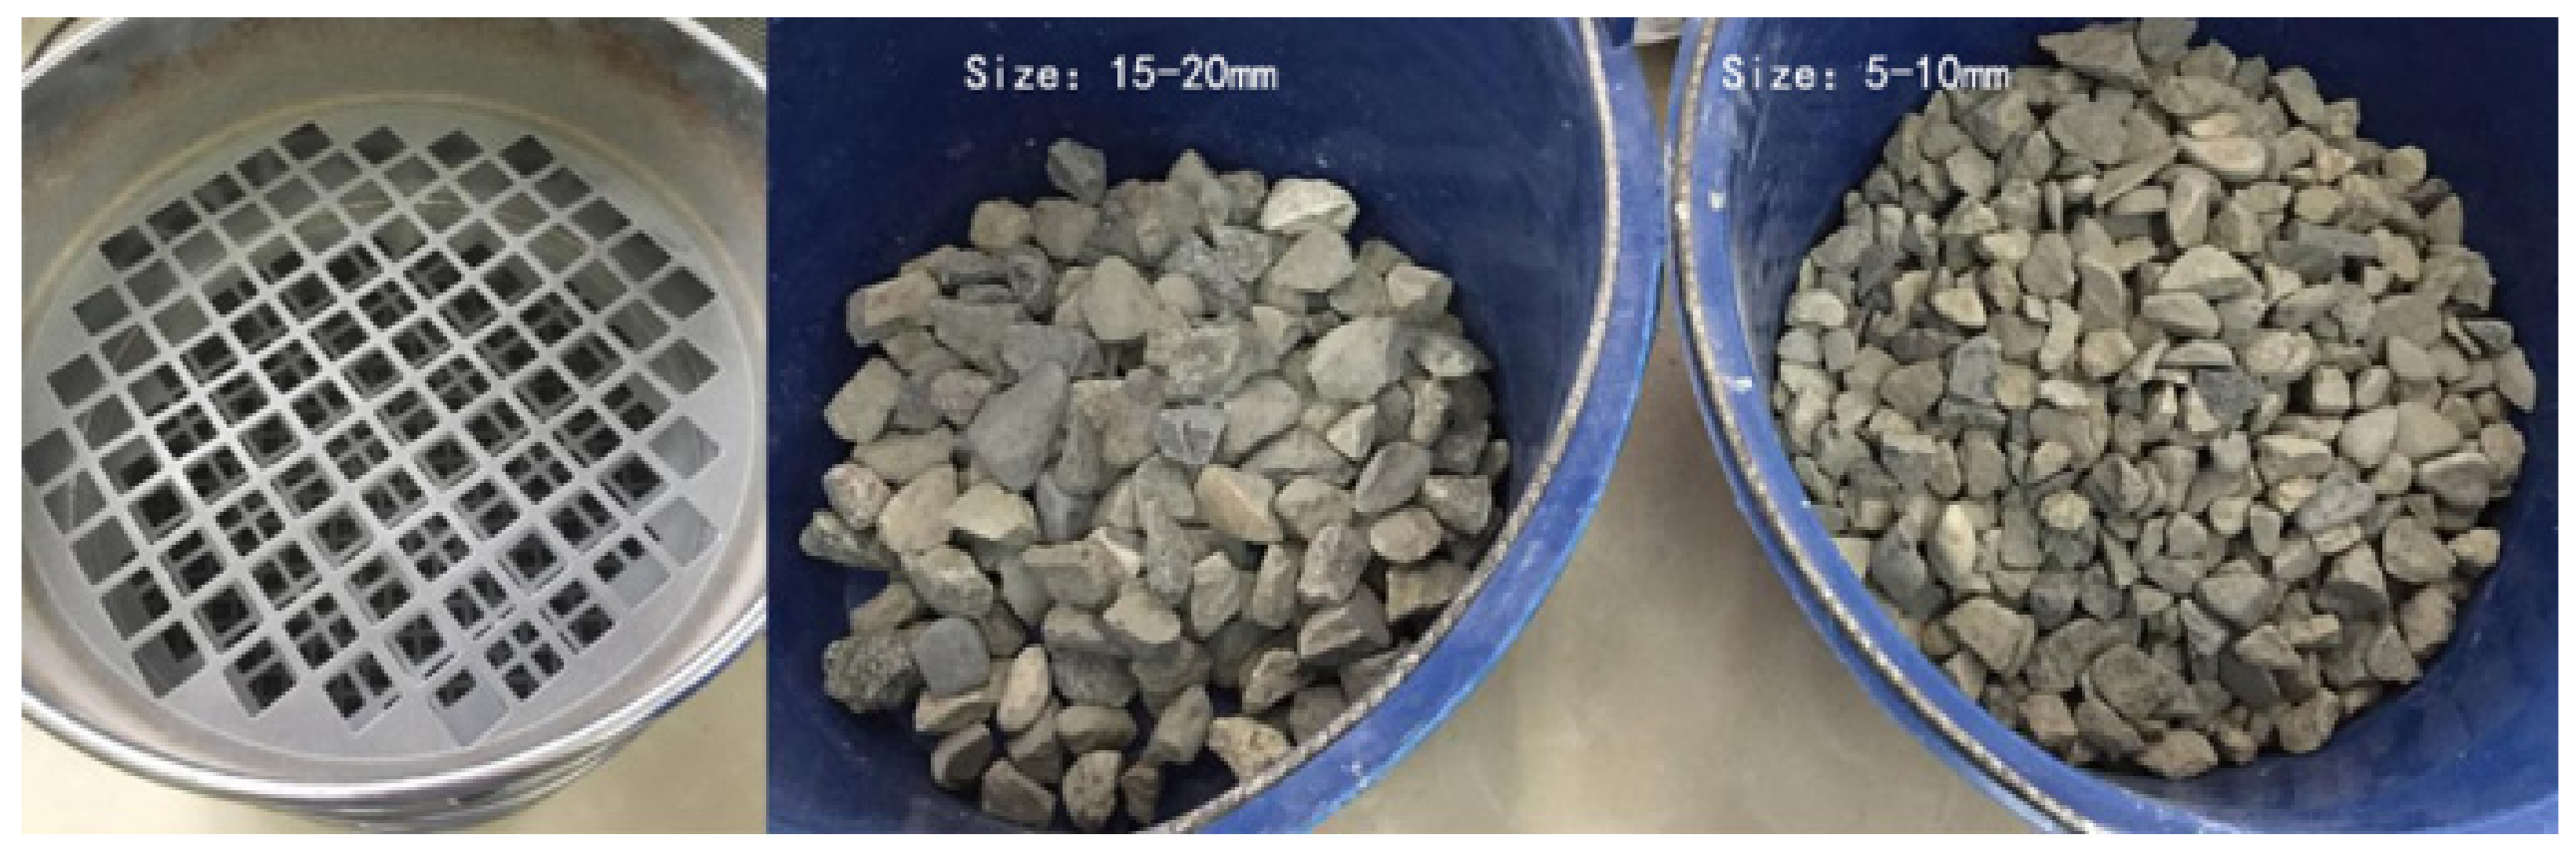
2.1. Raw Materials

Municipal water of Dujiangyan city and a PC additive at 3–7% of the cement weight, designed by the College of Civil Engineering, Sichuan Agricultural University, were used. Portland cement, manufactured by the Lafarge Cement Co., Ltd., Dujiangyan, China, was used. The physical properties of the Portland cement (Grade PO 42.5R, according to Chinese national standard GB175-2007 [19], manufactured by the Lafarge Cement Co., Ltd., Dujiangyan, China) are listed in Table 1.
In this study, the method of adding a commonly used admixture as a PC additive, designed by the College of Civil Engineering, Sichuan Agriculture University, was employed to reduce the concrete alkalinity and increase the plant growth hormones. Table 2 summarizes the chemical components of the admixture. Nano-CaCO3 was used to increase the density of the cement paste. The addition of nanocalcium carbonate can have the joint effect of gathering, pinning, and crystal nucleus effects to improve the cascade of particles. Studies have shown that nano-CaCO3 filled with aggregates can help to increase bulk density, folding resistance and compressive strength [20,21]. Nitrogen and methylenediurea are commonly used in fertilizers such as urea and are critical for plant growth. Biuret is an industrial binder and is a higher-quality feed additive than urea. However, for plant growth safety reasons, we recommend not more than 1%.
Natural aggregates were used in this study. According to the sieve diameter and particle size distribution, the aggregates were divided into two groups, 5–10 and 15–20 mm, and the bulk densities were 1575 and 1555 kg/m3, respectively. Sieves were used to obtain particles based on their diameter (Figure 1). All aggregates were thoroughly washed to avoid any negative impacts on concrete stability properties and other mechanical behaviours.

2.2. Mix Proportions

Table 3 shows the mix proportions of PC samples. To maximize the cost reduction and physical strength of the concrete specimens, comprehensive tests were performed on the concrete samples at water–cement ratios (w/c ratios) of 0.35 and 0.40 to obtain satisfactory application performance in the following experiments [22].

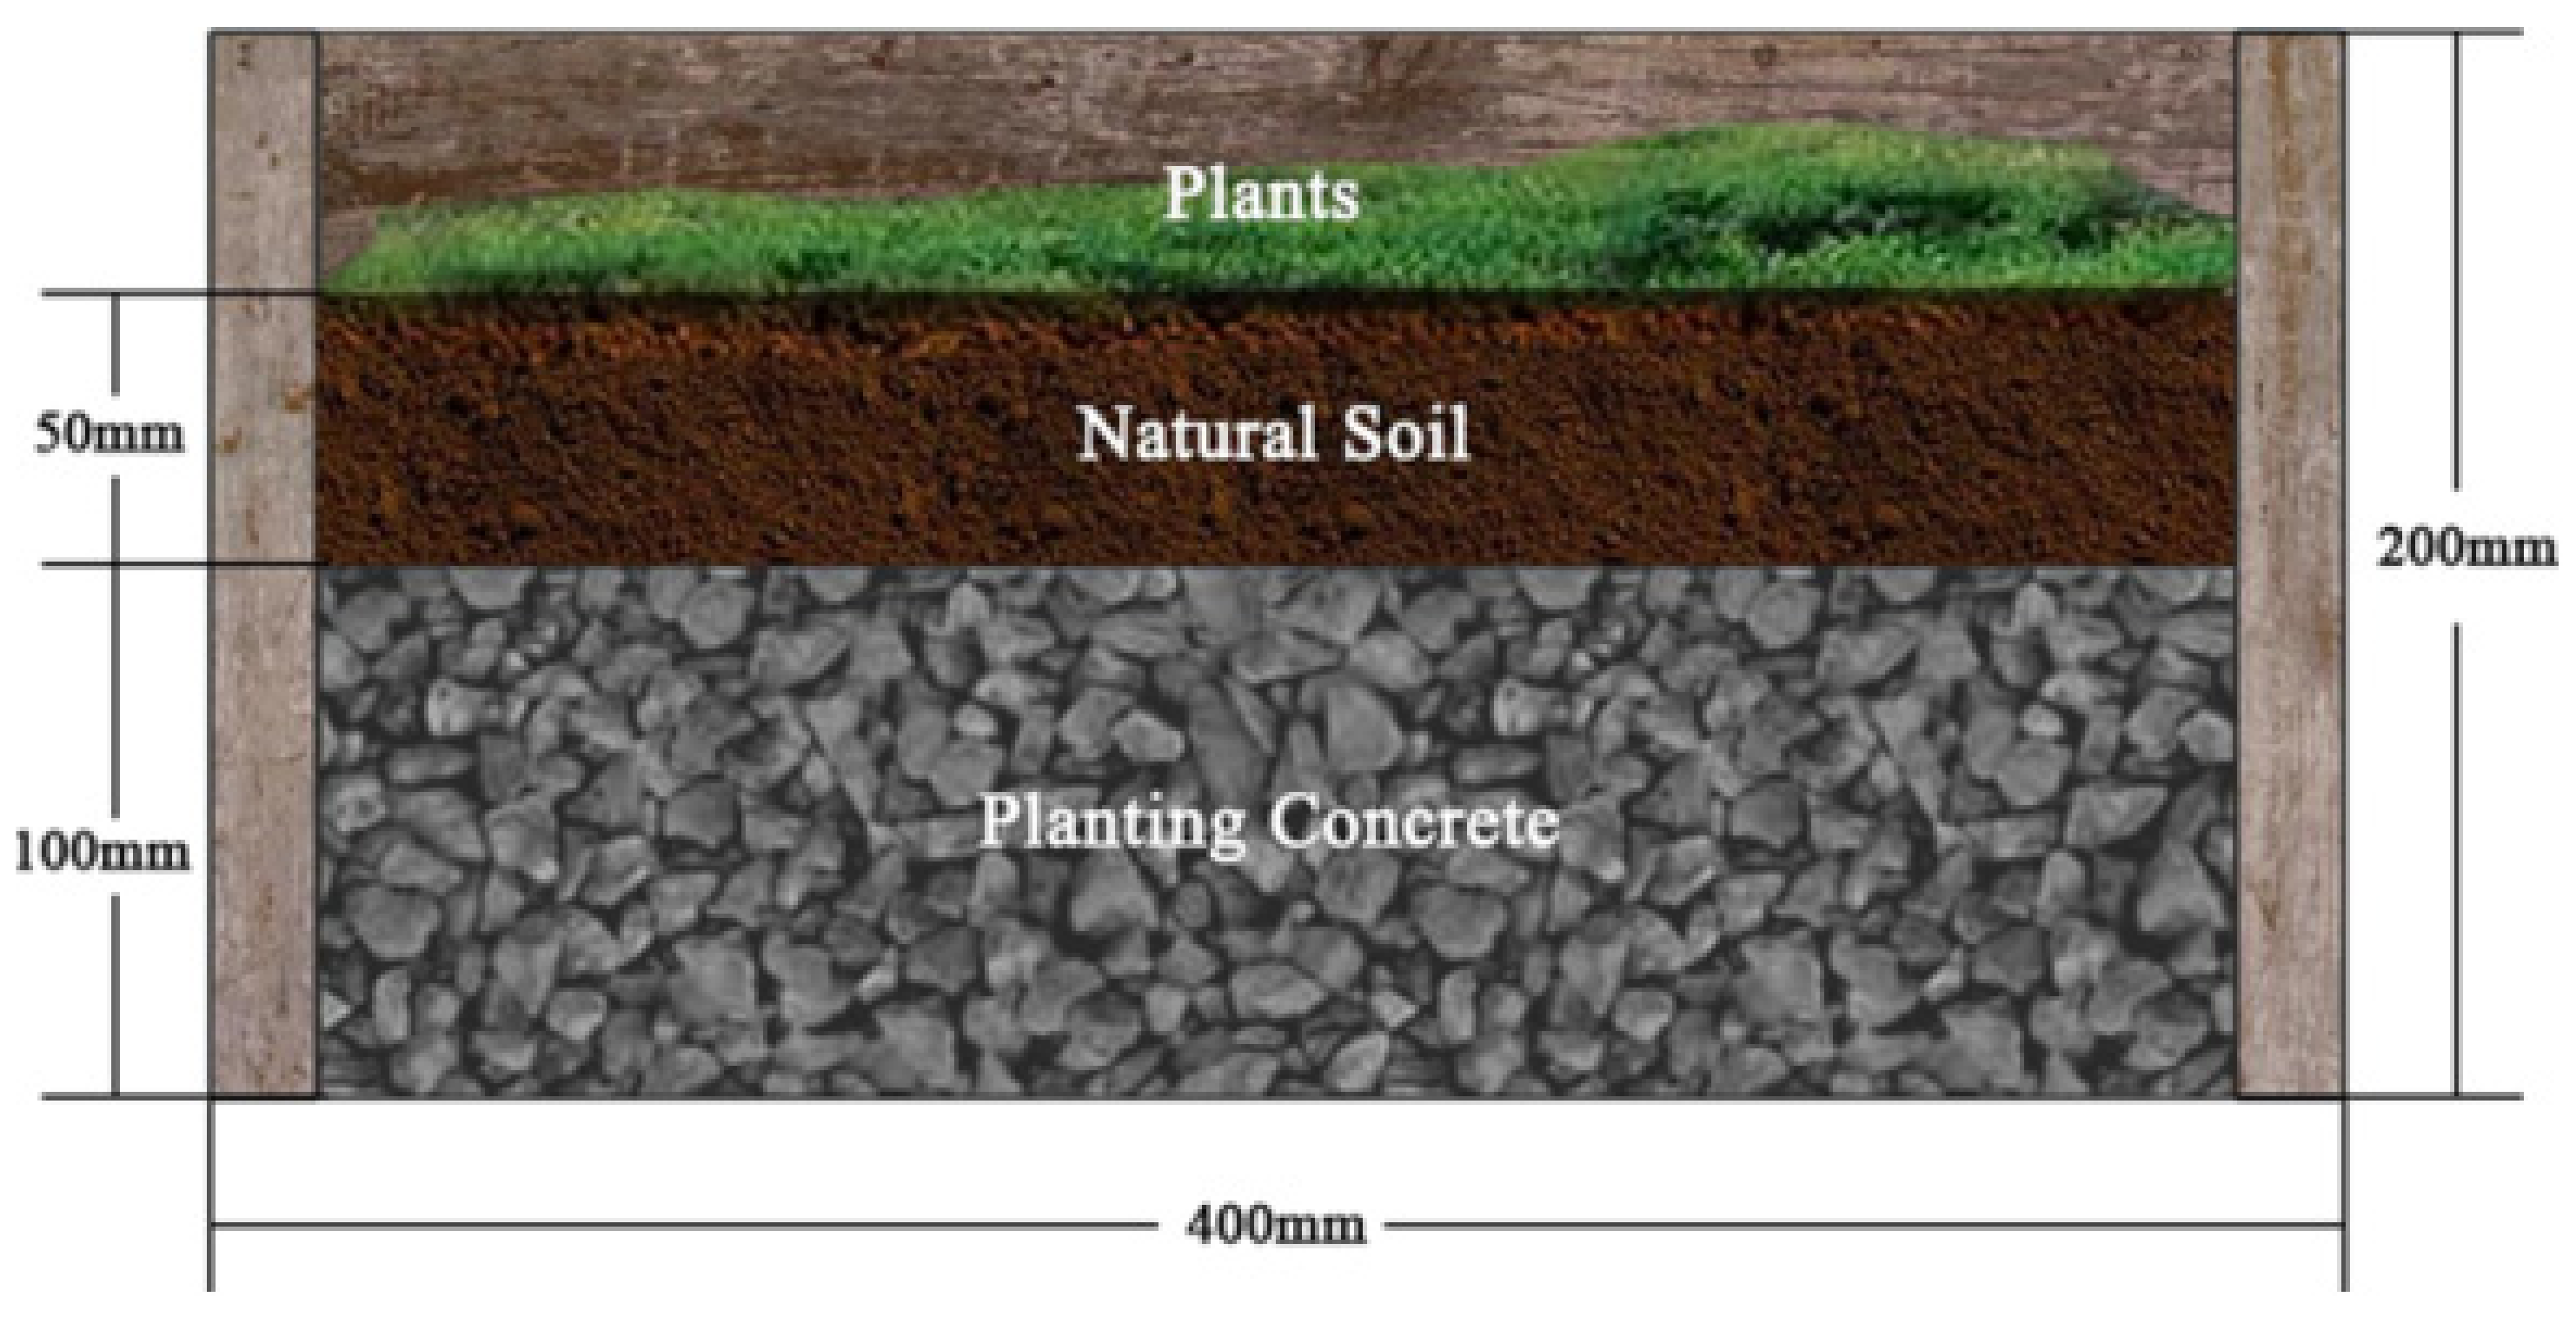
2.3. Sample Preparation

In this study, the PC sample preparation procedures were as follows: first, the aggregates and a portion of the water were mixed to keep the aggregate surface wet during stirring. Second, cement, remaining water and PC additive were added to the mixer at a specific mix proportion and stirred continuously, and the mixing time was longer than 1 min. The vibration plate was vibrated and displaced by two people without free placement or prolonged sustained vibration. Finally, the concrete mixture was poured into a cast-iron mould with dimensions of 150 × 150 × 150 mm to measure the compressive strength and conduct the other tests. The concrete specimens were carefully removed from the moulds and cured at a relative temperature of 20 ± 2 °C for approximately 72 h. The compressive strength and void ratio of all control PC samples were tested after 28 days of curing by following Chinese specifications [23], which is similar to the curing period of conventional concrete.

2.4. Test Method

In this study, different PC properties were examined. The experiments began in March 2019. PC specimens were fabricated as the first step, and after 28 days of curing, compressive strength and void ratio tests were conducted. Second, vegetation tests were performed after the physical strength tests for a total of 12 weeks to monitor and document plant growth as comprehensively as possible. The last step was the determination of the physiological indexes of plants. The soil composition was analysed before and after the vegetation test.

2.4.1. Compressive Strength Test

The compressive strength of PC was measured according to Chinese national standard GB/T 50081-2002 [23]. The concrete specimens were cured at a relative temperature of 20 ± 2 °C for approximately 72 h. The specimens were carefully unmoulded and cured in water for 28 days. Compressive strength testing was conducted on all specimens with different mix proportions.

2.4.2. Void Ratio Test

Porous materials such as porous PC provide interior voids for plant roots to grow. Therefore, the void ratio is one of the most important factors for PC and its mechanical properties. Scholars have investigated the impact of various void ratios on concrete [24]. With increasing void ratio, the compressive strength of concrete decreased, and vice versa. In this study, the void ratio test examined the influence of the porosity of PC samples with different mix proportions.

2.4.3. Alkalinity of the Concrete

After the compressive strength test, the slag of the concrete sample was collected according to its original group number to measure the alkalinity by using the liquid–solid extraction method with a pen-type metre. The test specification range of the pen-type metre was a pH of 0.0–14.0, a resolution of 0.1 pH units, an accuracy of ±0.1 pH units, and a temperature compensation range of 0–50 °C. The PC blocks were crushed, ground, and passed through a square-hole sieve with a diameter of 0.08 mm, and 10 g was weighed and added to ten times the weight of distilled water. The filtrate was shaken every 5 min and filtered after 2 h, and then the pH of the filtrate was measured [25].

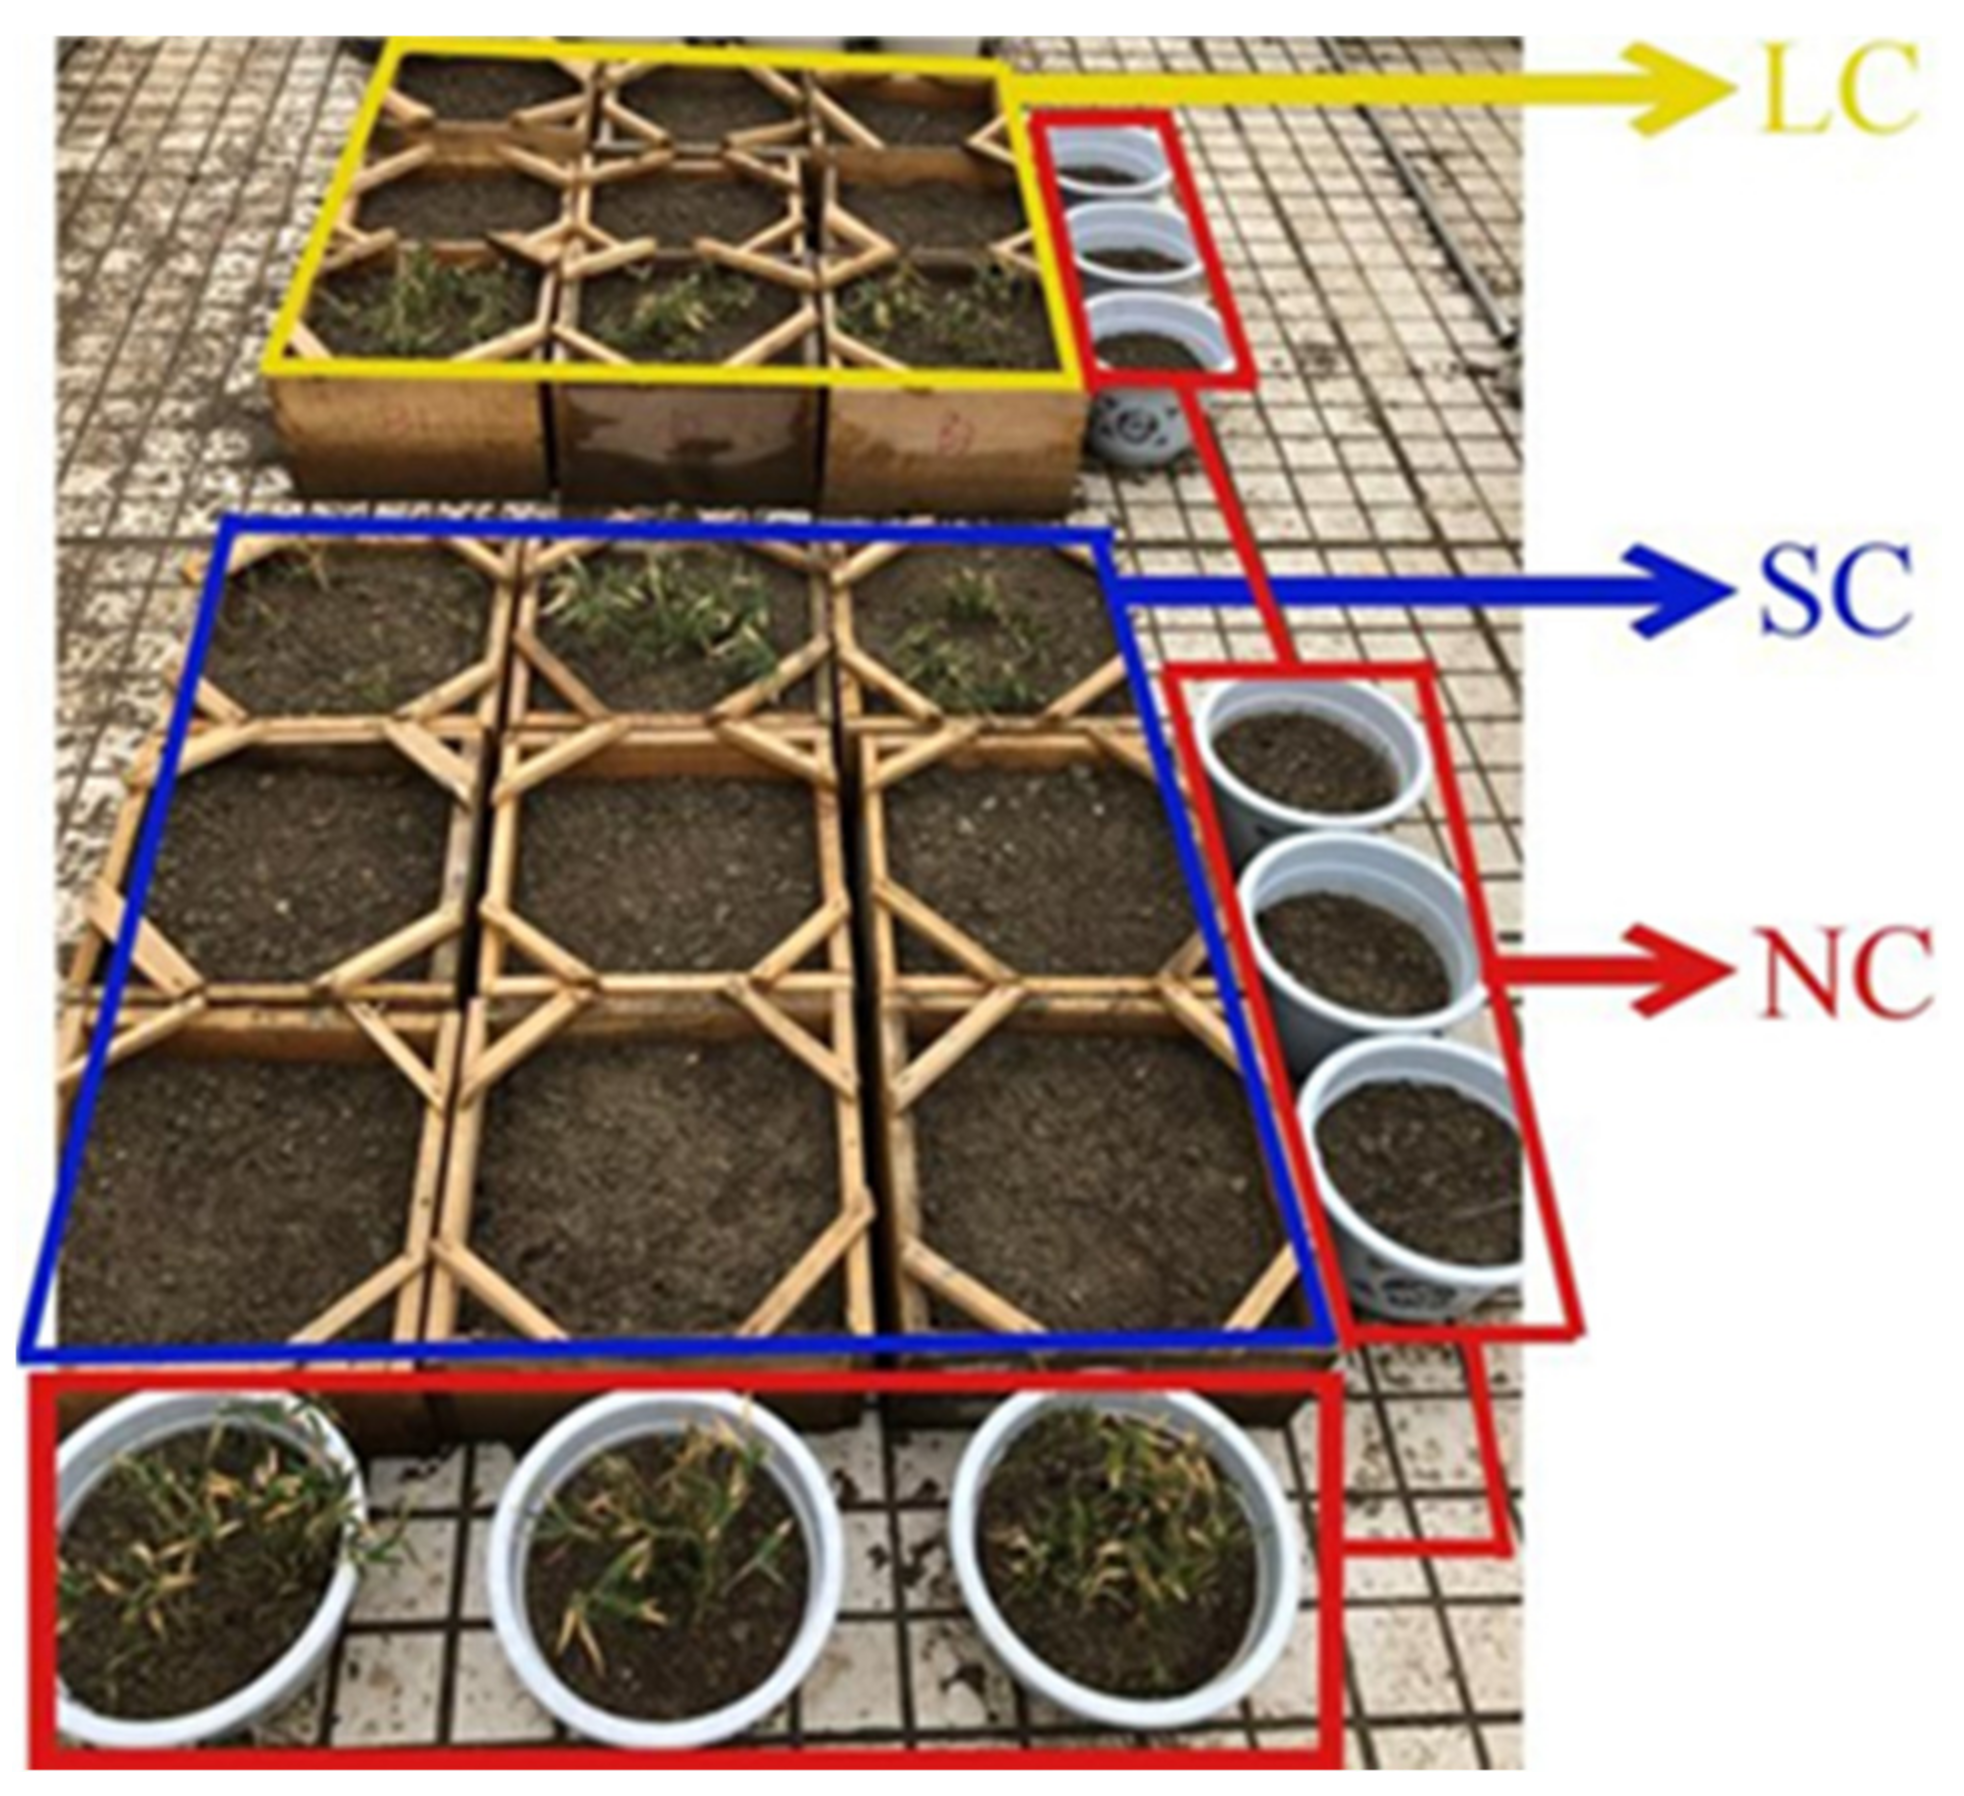
2.4.4. Vegetation Test

Vegetation experiments were conducted after the compressive strength tests. PC was poured into 18 wooden moulds with dimensions of 400 × 400 × 200 mm, and a 50 mm natural soil layer was precisely placed on the concrete, which was able to retain water and fertilizer (Figure 2). Plant seeds were evenly sown in the soil at 10–12 g/m2 according to the literature and then covered with a thin layer of natural soil (5 mm).
Mature seeds of Cynodon dactylon (L.) Pers and Agrostis stolonifera (known as Bermuda grass) were purchased from commercial seed suppliers. Mature bamboo shoots of Sasa argenteostriatus, e.g., Camus, were transplanted from the nursery garden of Sichuan Agricultural University. The effects of the concrete content on seed germination and plant growth of each species were examined with a comparative experiment that included two concrete treatments based on the particle size of the aggregates, with three replicates, and three replicate tests were also conducted for each plant under normal cultivation conditions without PC underneath as control samples. The other environmental factors were controlled in the tests. The experiments were conducted in the nursery garden of Sichuan Agricultural University, exposed to a natural environment. The seeds and bamboo shoots were watered every two days during the experiments. The PC containers were randomly moved every week to prevent any positional influence according to previous studies [18].

Malondialdehyde (MDA)

When damage from drought and other types of stress occurs, lipid membrane peroxidation leads to the accumulation of malondialdehyde (MDA), the denaturation of proteins and nucleic acids, a decrease in membrane fluidity, and an increase in membrane permeability. Therefore, the MDA content is a commonly used index to measure the effects of adverse conditions on plants [26]. MDA is produced by the peroxidation of lipids in plant tissues or organs when plants experience ageing or drought.
The main equipment used was a spectrophotometer and a centrifuge [27]. The MDA content in the plant tissues was calculated with Equation (1):
C = 6.45 O D 532 O D 600 0.56 O D 450 M D A = C × V × 10 3 W
In this equation, C is the MDA content in the plant tissues, μmol/L; OD532, OD600, and OD450 are the absorbance values at wavelengths of 532, 600, and 450 nm, respectively; C is the MDA concentration in the extract, μmol/L; V is the total extract volume, mL; and W is the weight of the material, g.

Free Proline (Pro)

Plants tend to accumulate compatible solutes such as proline to counteract saline–alkaline conditions or low-temperature stress. To a considerable extent, proline can decrease the cytoplasmic osmotic potential and enable water absorption [28]. Free proline (Pro) forms a stable red condensate with ninhydrin under acidic conditions. Pro has a maximum absorption peak at a wavelength of 515 nm, and the red product amount is proportional to its content; thus, the Pro content in plant tissues can be determined by the colorimetric method [29]. The main equipment is a spectrophotometer, centrifuge, and oscillatory mixer.
The Pro content in the plant tissues was calculated with Equation (2):
C Pr o = C X V g F W
In this equation, CPro is the Pro content in the plant tissues, μg/gfw; CX is the Pro concentration in the sample solution, μg/mL; V is the total extract volume, mL; and g FW indicates the fresh weight of the sample, g.

Soluble Protein (SP)

Soluble protein (SP) is an important osmotic regulator and nutrient, and the overall increase and accumulation of SP can improve the water retention ability of plant cells to resist water stress. SP is often used as one of the indicators for screening resistance since it plays a protective role for cellular substances and biofilms [30]. The main equipment used was a spectrophotometer.
The SP in the plant tissues was calculated with Equation (3):
C S P = A V 10 3 W
In this equation, CSP is the SP content in the plant tissues, g/mg; A is the SP content obtained from a standard curve, μg/mL; V is the ratio of the sample extract to the sample reaction solution; W is the weight of the sample, g; and 10−3 is the conversion factor from μg to mg.

Chlorophyll (Chl)

Photosynthesis is the material basis of all material metabolism and energy metabolism in biology. The Chl content is an indicator that is commonly used to investigate photosynthesis in plants under salt stress. The activity of Chl in plant tissues with strong salt tolerance is low, with less Chl degradation. Therefore, the decrease in Chl content can be used as an important index of plant salt tolerance [31].
The CHL content in the plant tissues was calculated with Equation (4):
C h l a = 12.7 O D 663 2.69 O D 645 V W 1000 C h l b = 22.9 O D 645 4.68 O D 663 V W 1000 C h l T = 20.2 O D 645 + 8.02 O D 663 V W 1000
In this equation, ChlT is the total CHL concentration in the plant tissues, mg/g; OD is the measured optical density at the given wavelength; V is the total volume of the Chl extract, mL; and W is the weight of the plant tissues, g.

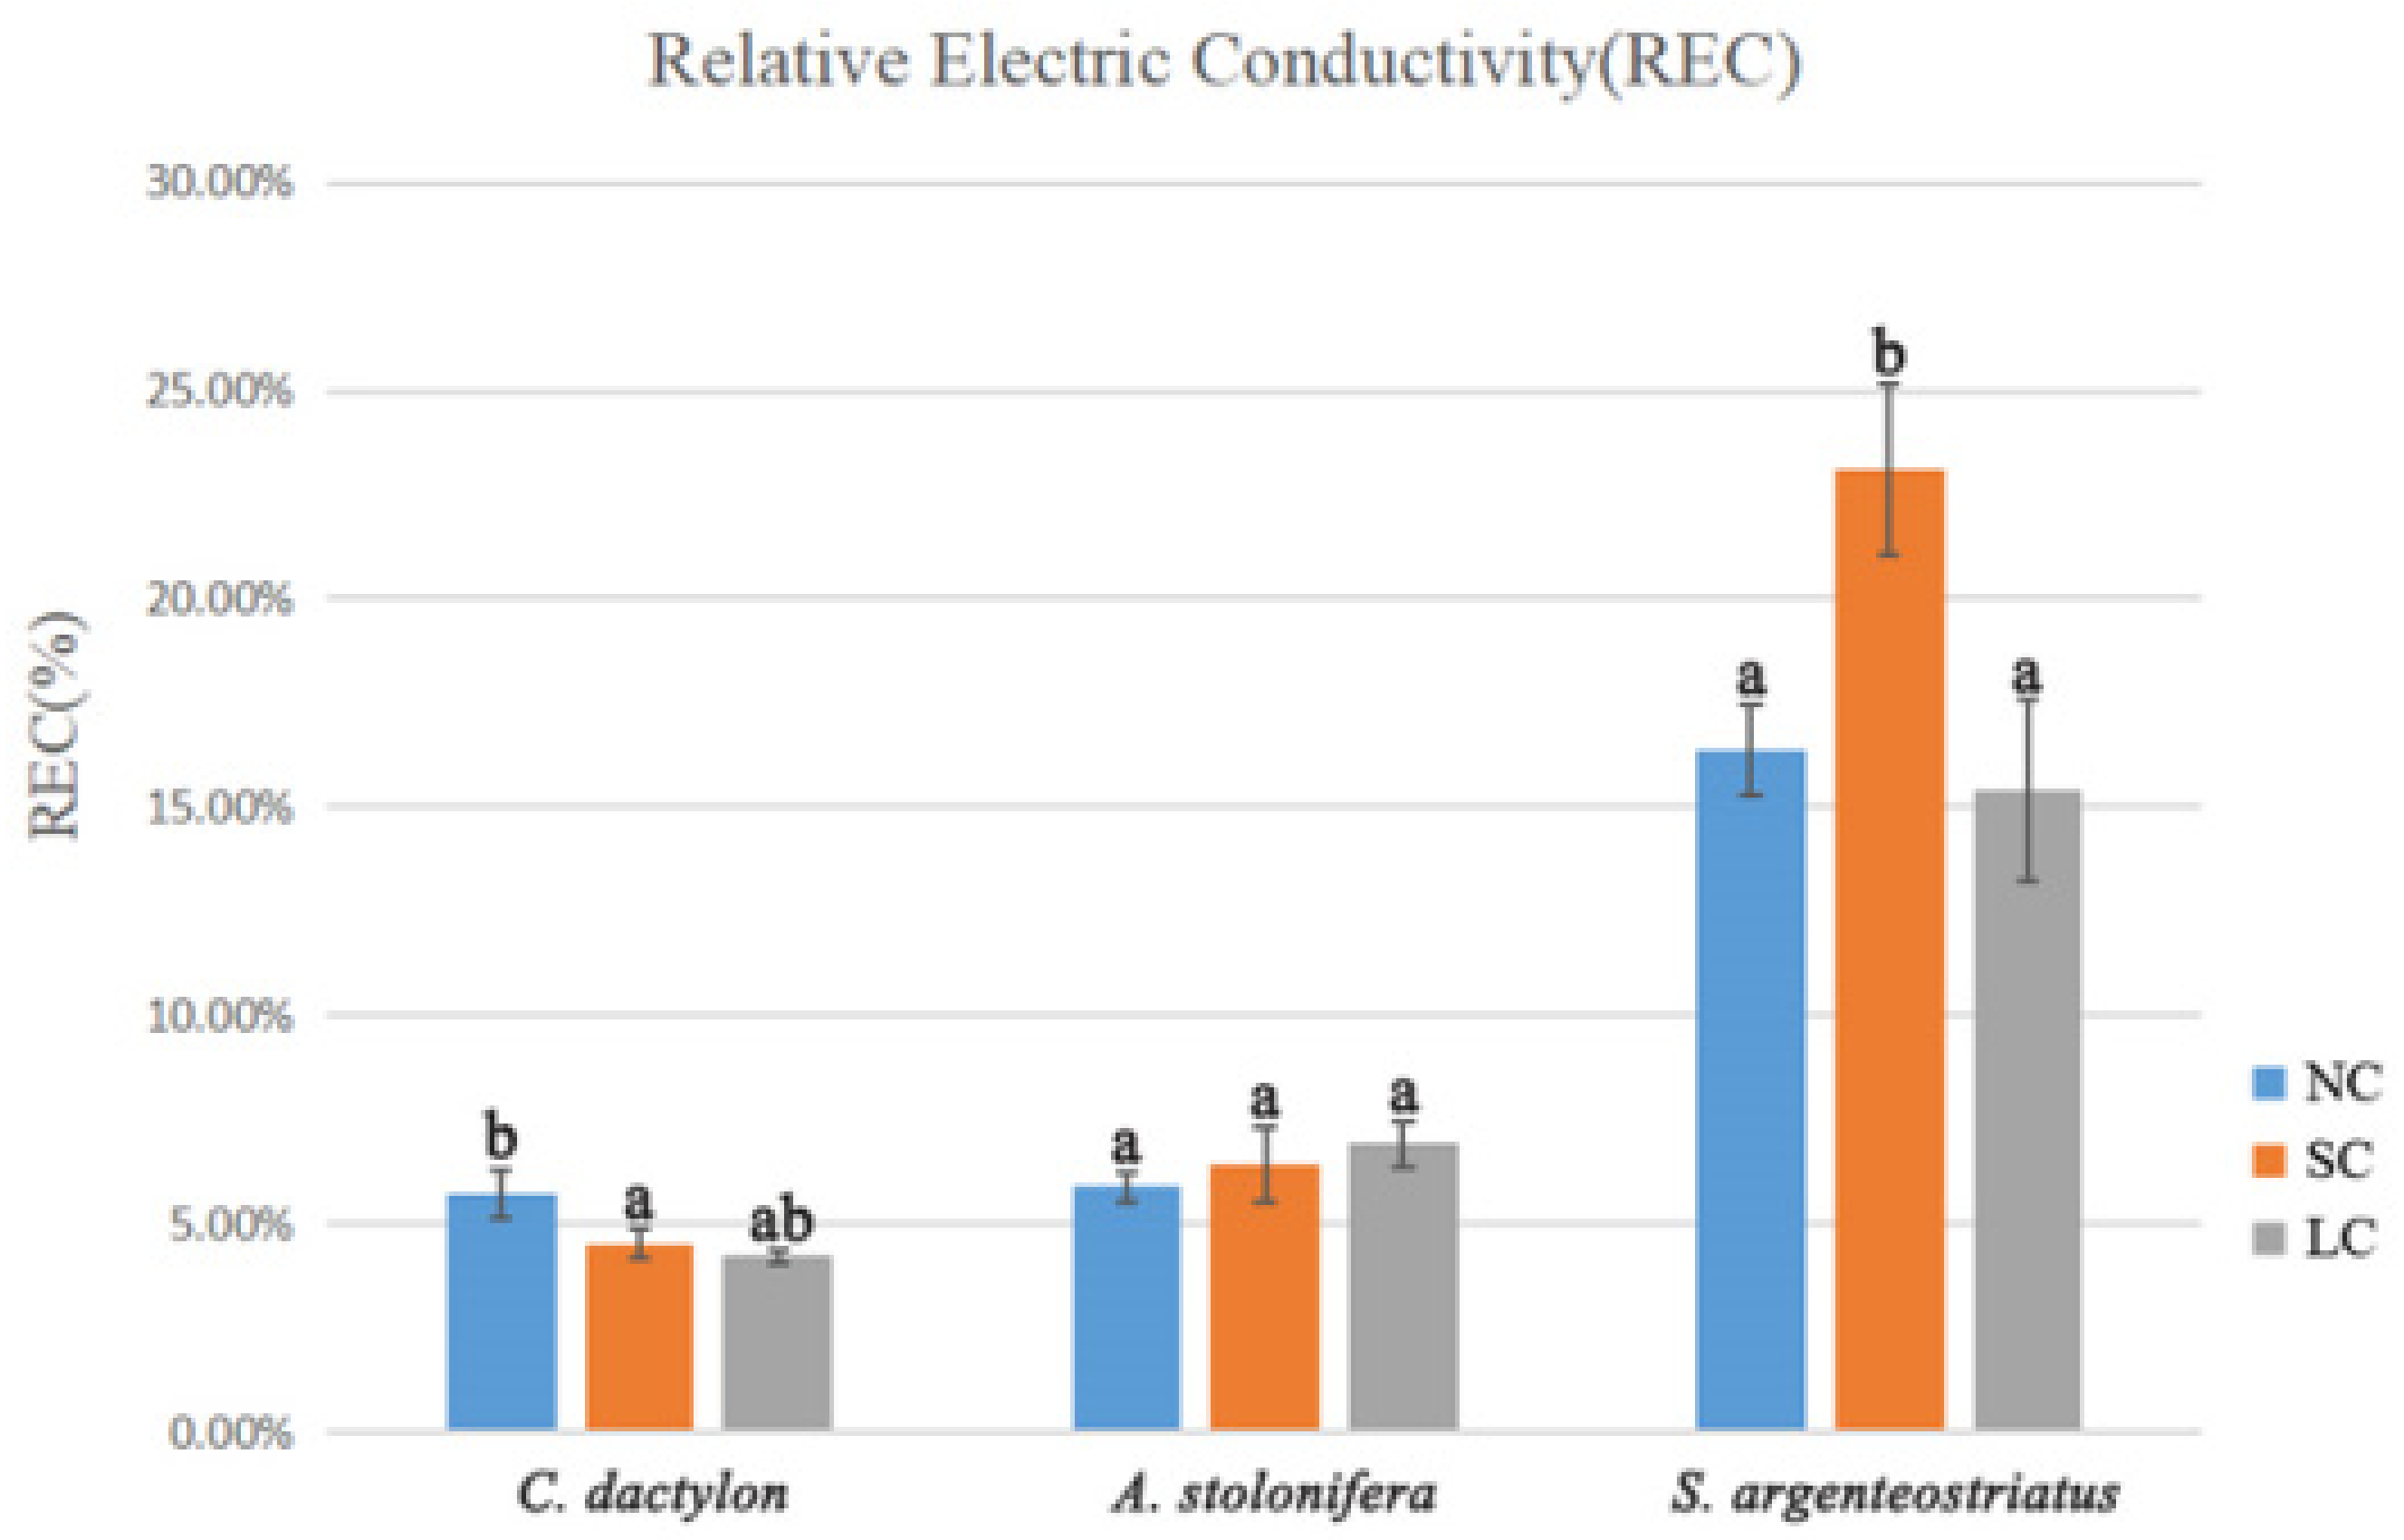
Relative Electrical Conductivity (REC)

The relative electrical conductivity (REC) is an important physiological and biochemical indicator of the status of the plant membrane system. Plant tissues are prone to cell membrane rupture in the event of stress or other damage, and membrane protein damage causes extracellular fluid leakage out of the cell cytoplasm, which increases the relative conductivity [32]. Plants under stress suffer electrolyte infiltration in cells, and the electrical conductivity of the leaching solution from the plant tissues increases. Therefore, by measuring the change in the electrical conductivity of plant tissue extracts, the degree of cell membrane damage and the resistance of plants to stress can be obtained.
The REC was calculated with Equation (5):
R E C = C 1 C 2 × 100 %
In this equation, C1 is the electrical conductivity of the extract, and C2 is the electrical conductivity of the extract after heating for 30 min and cooling.

2.5. Soil Composition Test

To rationally analyse the different plant growth conditions in all treatments, the soil composition was tested before and after the vegetation experiments. The total phosphorus (TP), total potassium (TK), soil organic matter (SOM), total nitrogen (TN), alkali-hydrolysable nitrogen (AN), and pH were measured.

2.6. Statistical Analysis

Correlation and significance analyses were performed using SPSS 19.00 statistical software (SPSS International, Chicago, IL, USA). These analyses examined the relationships among variables. Significance levels are reported as nonsignificant (NS) (p > 0.05), significant (0.05 < p < 0.01), or highly significant (p < 0.01).
The data for each of the three variables were analysed using ANOVA, with the plant physiological indicators in the different treatments as fixed effects. To assess plant growth more accurately, the performances of the final models for each of the mean physiological indexes of the three ground cover plants were evaluated statistically through PCA. In the evaluation of multiple indicators, it is necessary to measure the results objectively and comprehensively from many aspects. However, this results in overlapping information and creates difficulty in determining weights among indicators [33]. Therefore, we used PCA to concentrate the information and determine the weights of the indicators. The performances of the final models were calculated using Equations (6) and (7):
Z i = λ i i = 1 p x i
Z k = i = 1 k λ i i = 1 p λ i
where Zi is the variance contribution of the principal component; λi is the proportion of principal components in the total variance (the larger the value, the more representative the principal component’s ability to synthesize the original variable information); and Zk is the cumulative contribution, representing the amount of information that the first k principal components cumulatively extract from the original variable.

3. Results and Discussion

3.1. Void Ratio, Alkalinity, and Mechanical Properties
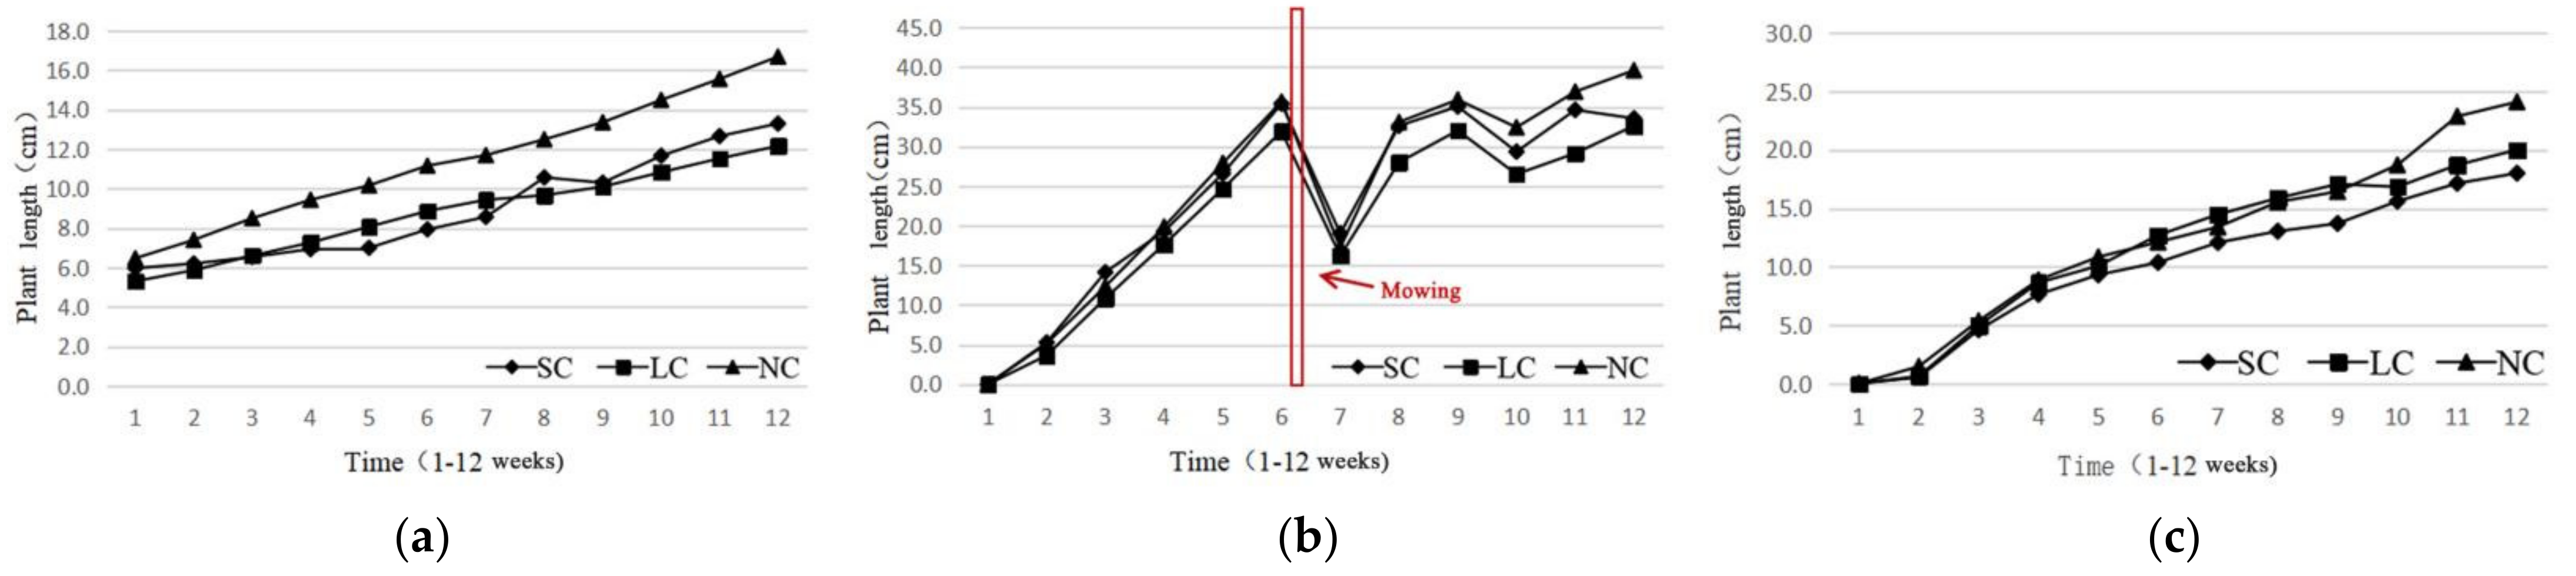
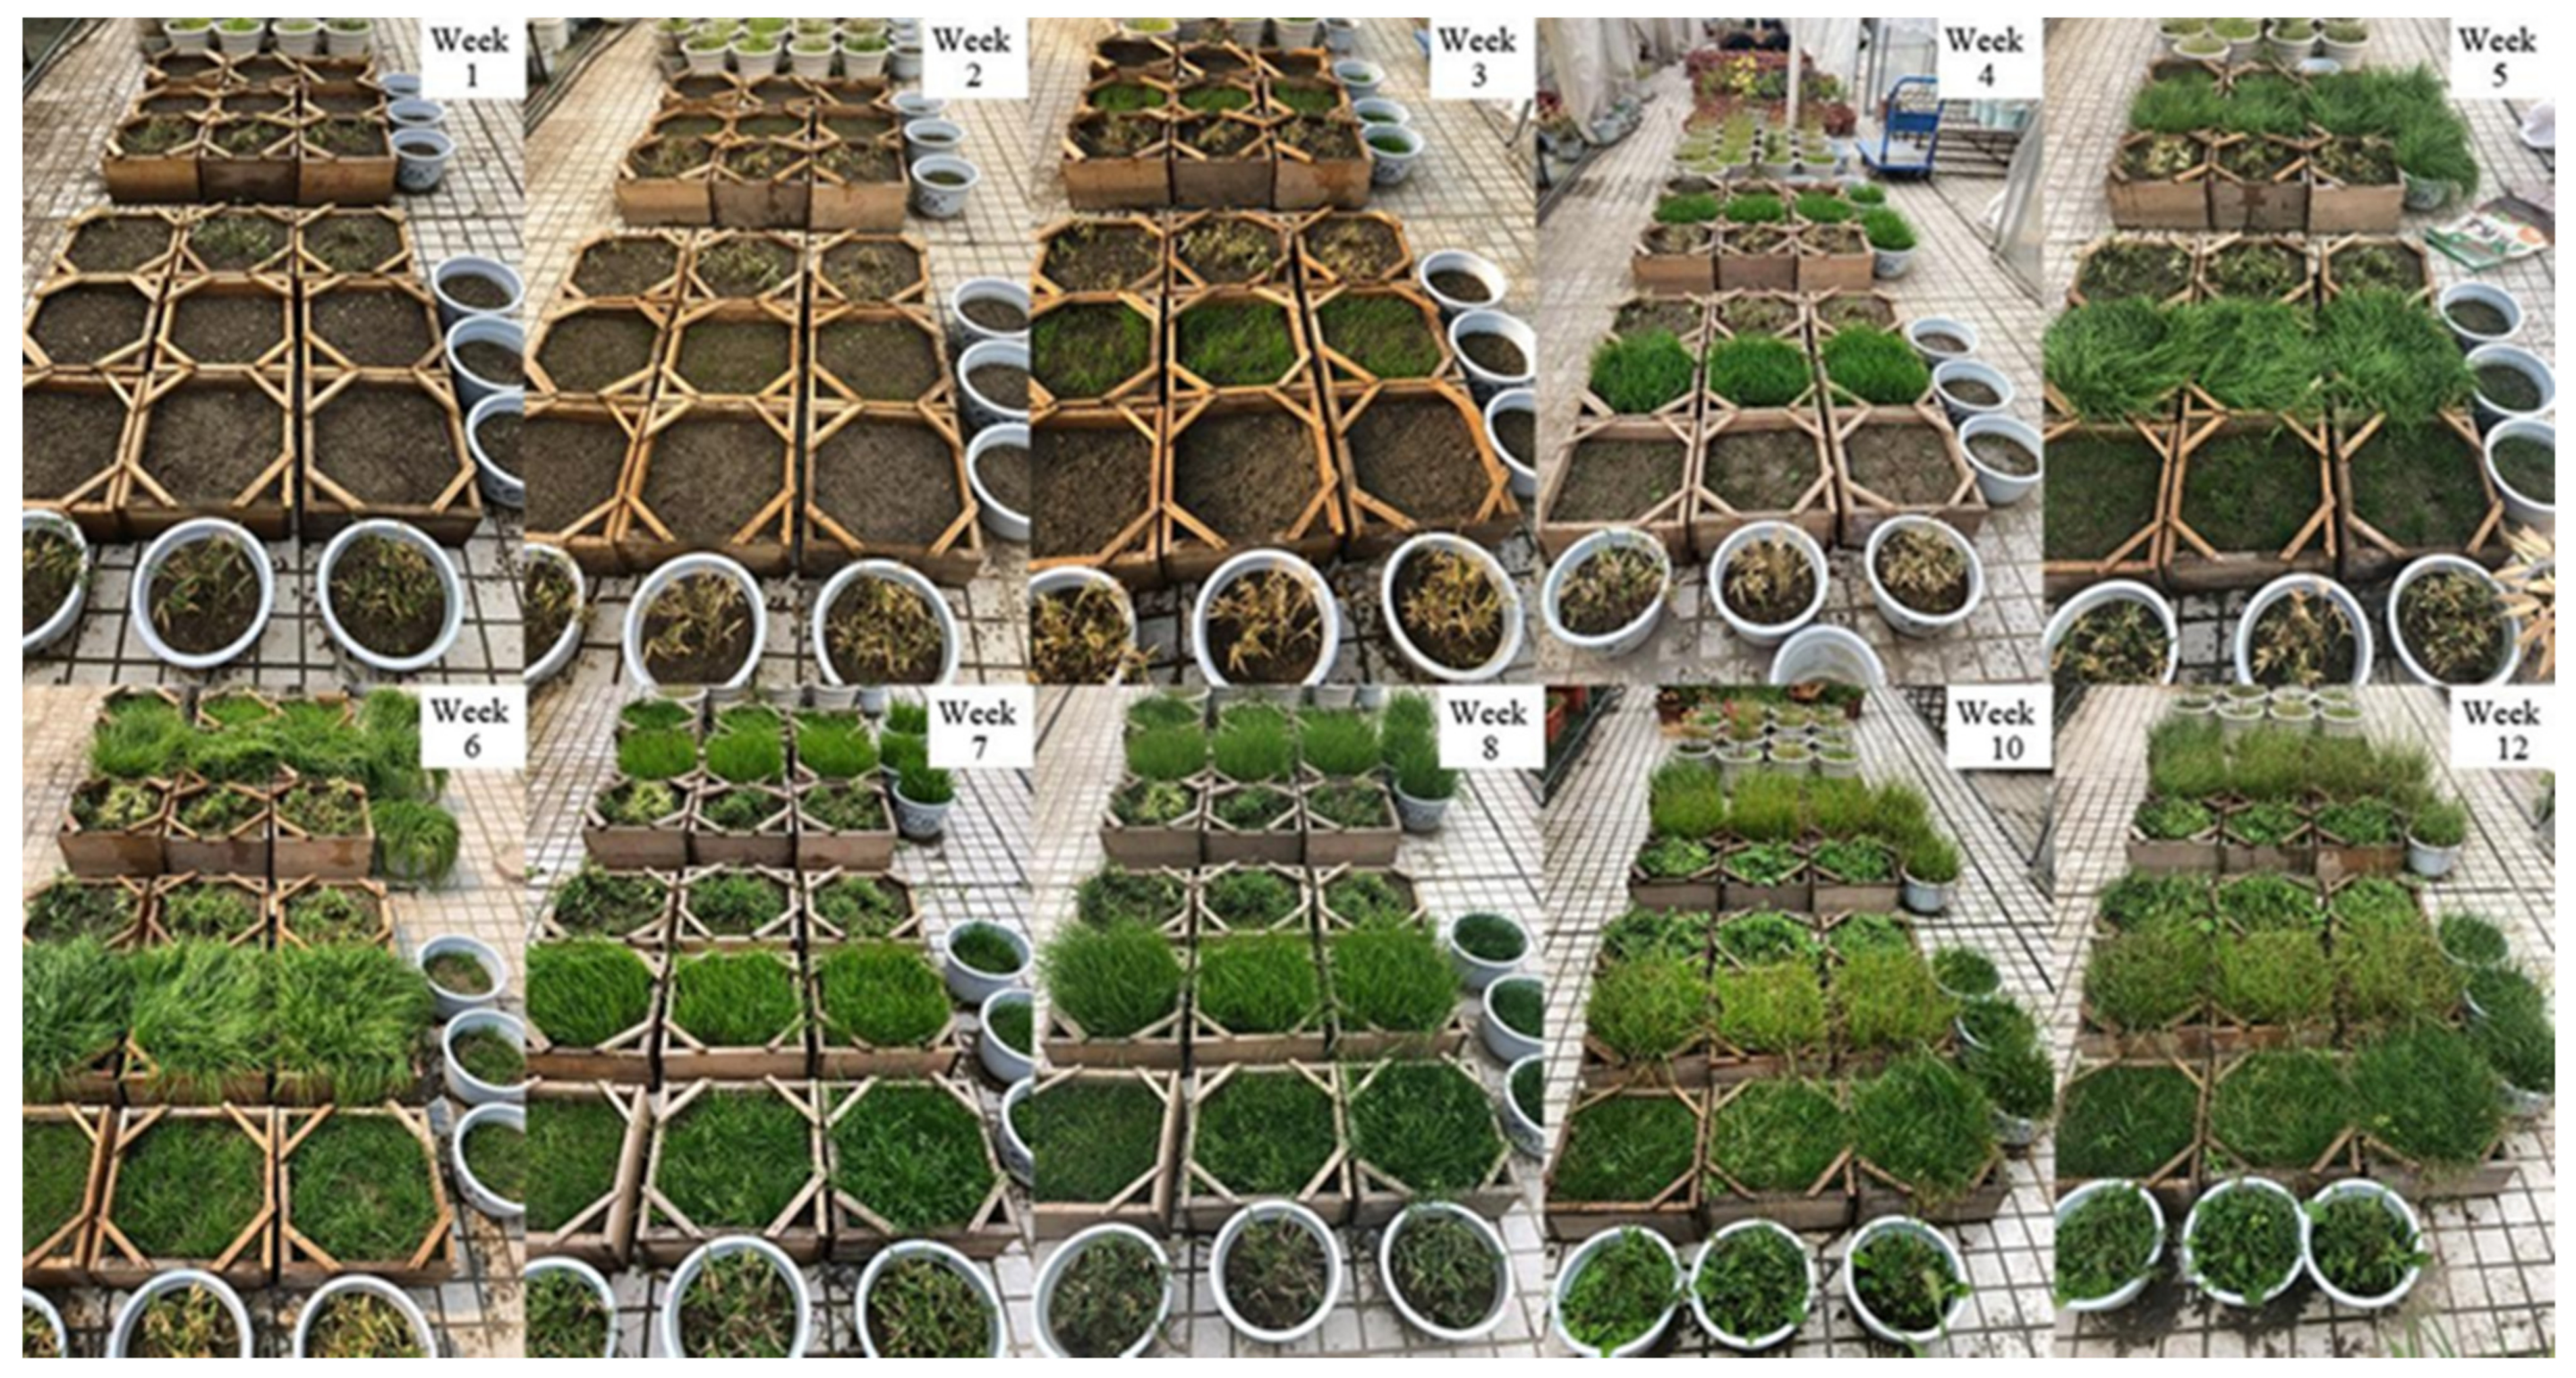
Table 4 provides a summary of the void ratio, alkalinity, and mechanical properties of the PC samples. The compressive strength continued to increase over the 28 days. The porosity of the larger aggregate concrete (PC-S2, 15–20 mm) was marginally higher than that of the smaller aggregate concrete (PC-S1, 5–10 mm), and the mean void ratios for each treatment were 30.5% and 31.9%. In the aggregate group, the size ranged from 5–10 mm, and the compressive strength of concrete specimens with smaller particle sizes was 17.5% higher than that of concrete specimens with larger particle sizes. The compressive strength increased as the aggregate particle size decreased, and this phenomenon is consistent with Tun’s conclusion [34]. In the other group, with a particle size ranging from 15–20 mm, the compressive strength was 11.3 MPa on average. The correlation between the compressive strength, alkalinity, and void ratio was obtained and is listed in Table 5. The chart reveals that the correlation between the compressive strength, alkalinity, and void ratio was nonsignificant. The relationship between the alkalinity and void ratio was highly significant (p < 0.01). Therefore, the compressive strength of PC was not correlated with the porosity and alkalinity, but the relationship between the porosity and alkalinity was highly significant.

3.2. Plant Growth

Three kinds of plants were cultivated in planting containers after the void ratio, alkalinity, and mechanical property tests were performed. Twenty-seven planting containers were divided into three groups with three replicates per sample: small-particle concrete (SC), large-particle concrete (LC), and nonconcrete (NC). Figure 3 shows the average temperature as an environmental factor over the test duration. The weekly average maximum temperature was 25.2 °C, and the weekly average minimum temperature was 16.9 °C. The vegetation test began on 1st April and ended in late June, accounting for a total of 12 weeks.
C. dactylon began to sprout in the first week and grew to form a patch of grass with sparse shoots, most of which reached 4.0 cm, while few roots reached approximately 5.0 cm. A. stolonifera spouted in the second week, and the growth rate of the aboveground tissue was significantly lower than that of C. dactylon, approximately 0.5–2 cm. S. argenteostriatus in all containers changed little in the first two weeks except for several underground bamboo root shoots that germinated. Figure 4 shows the phenomenon whereby the aboveground length and growth rate of the three kinds of plants in SC, LC, or NC were similar in the initial two weeks. The growth of the three plants varied notably starting from the third week. One convincing explanation is the natural growth pattern of the plants themselves and the warmer climate.
C. dactylon was the fastest growing plant among the tested species. It began to grow faster in the third week, and the aboveground height was approximately 30–35 cm in the sixth week. The average heights in NC and SC were larger than those in LC, and at the end of the sixth week, C. dactylon reached the biomass limit that the containers could bear. The plants were mowed once to encourage growth during the rest of the experiment. The growth rate decreased in the last three weeks, as shown in Figure 4a. One of the reasons was the rising temperature, which opposed their preference for a cooler climate.
The biomass and plant length of the different treatments of A. stolonifera increased steadily over the study period. The growth of samples in all treatment groups was similar from weeks 1 to 5. After week 5, differences began to occur, and the SC-treated samples lagged behind the NC- and LC-treated samples. In the last three weeks, the growth heights of the NC plants were larger than those of the LC and SC plants, which were approximately 3–5 cm higher on average than the LC and SC plants. A reasonable explanation was that increasing the temperature promoted growth.
S. argenteostriatus in all treatments started at the same height. However, the NC plants were approximately 1.7–3.7 cm taller on average than the SC and LC plants during the whole test period. The SC plants were the shortest at the beginning but steadily grew and exceeded the LC plants by 1–2 cm in the eighth week. The growth rate in the last two weeks was lower than before.
All three plants in NC were taller and grew more steadily than those in the other two treatment groups. The plants in SC were initially slightly shorter than those in NC and LC. They exceeded the plants in LC after adapting to the environment. This phenomenon can be considered a manifestation of the SC plants having a higher resistance than the LC plants. Overall plant growth is clearly shown in Figure 5 and Figure 6.

3.3. Plant Physiological Experiments

We conducted an analysis to determine the correlation between the physical indexes of the concrete specimens and the physiological indexes of plants in Table 5 and Table 6. Table 5 clearly shows that in group SC, the alkalinity (pH value) was highly correlated (p < 0.01) with MDA, REC, SP, and Chl. Alkalinity also showed a negative correlation with the void ratio (p < 0.05). The void ratio was significantly negatively correlated with MDA and REC (p < 0.01). The void ratio was negatively correlated with compressive strength, but it was not significant (p > 0.05). This phenomenon is inconsistent with the conclusions of other literature, which need further research. The physiological indexes MDA, REC, SP, and Chl showed significant positive correlations with each other. However, the concrete physical indicators and plant physiological indexes were found to be less relevant in the LC group, as shown in Table 6. MDA, REC, Chl, and SP were positively correlated with each other, which was a similar result to that in SC.
One of the possible explanations for these results is that these plant species were less restricted when growing in LC than when growing in SC. The void ratio and pH value are critical to plant growth. Through this analysis, we can conclude that low porosity will result in a very limited growth space for the roots. Under these conditions, the roots cannot properly absorb nutrients, which leads to plant growth that is far behind that in the natural growth environment. Interpretations of the specific physiological indicators are provided below.

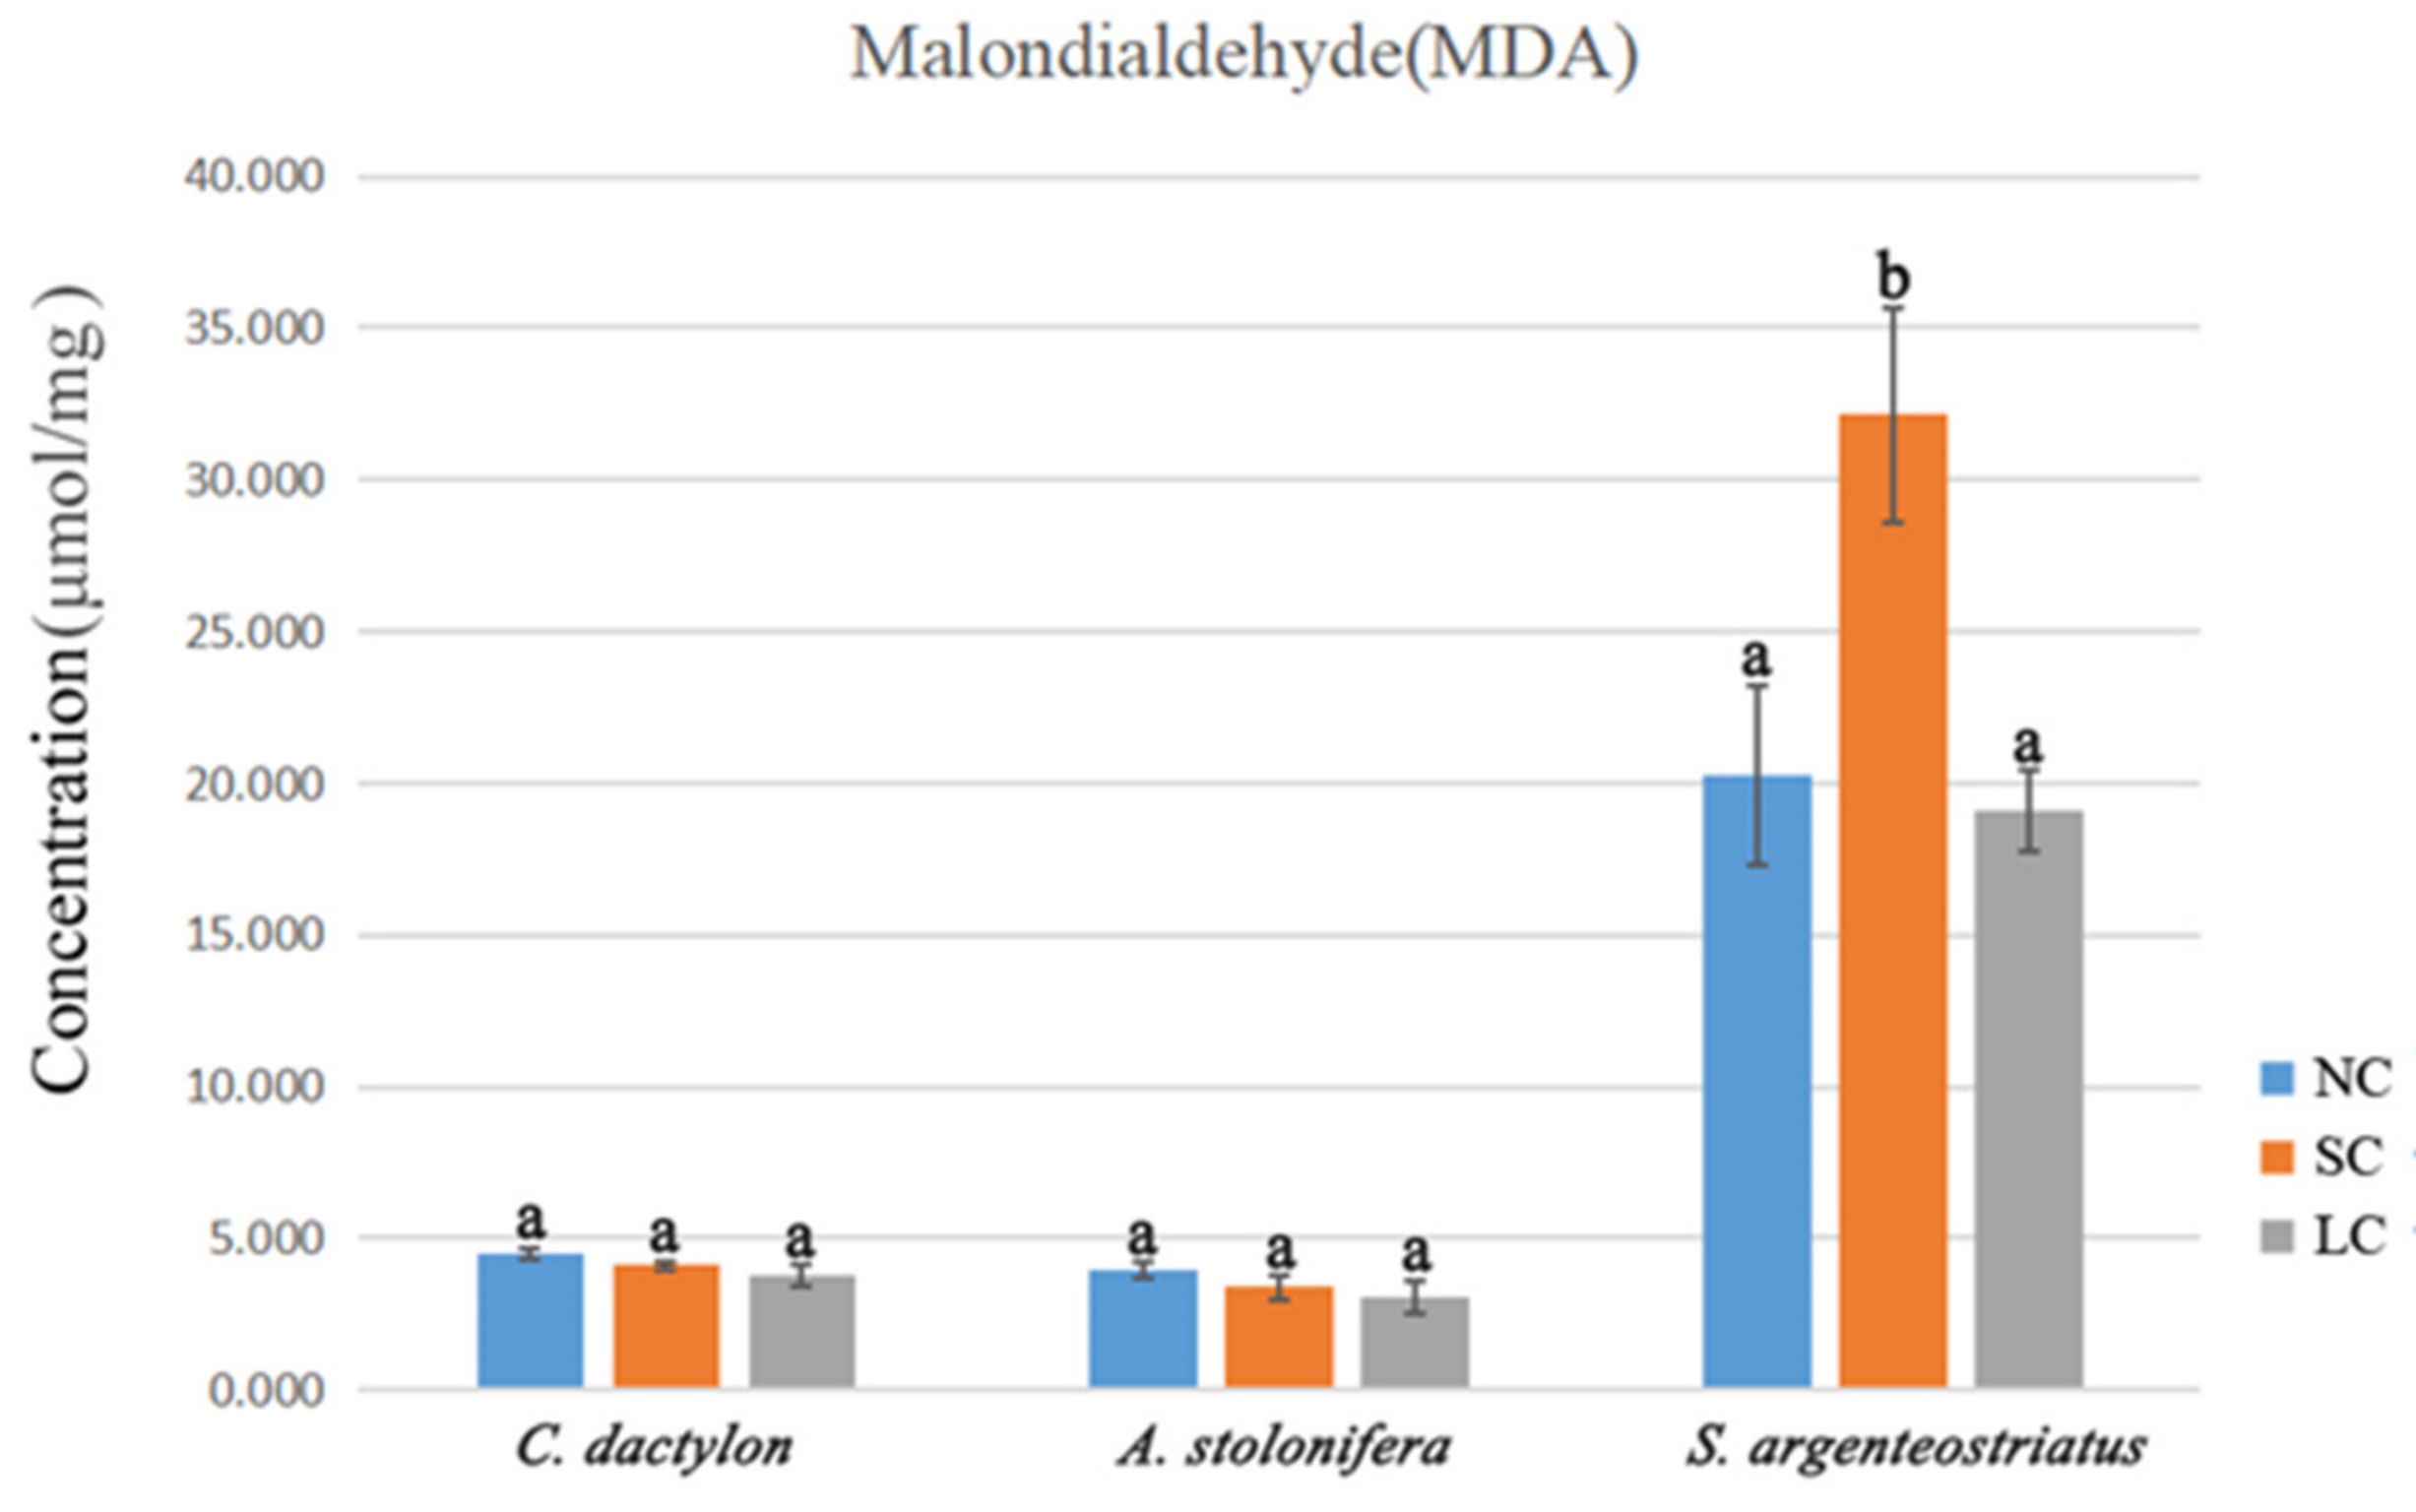
3.3.1. Malondialdehyde

The MDA index fluctuated sharply in the different plant species and treatments, as shown in Figure 7. S. argenteostriatus cultivated in SC containers exhibited a high MDA content (approximately 32.15 μmol/mg on average) because its cytoplasmic membranes had been damaged more than those of the LC and NC plants; the SC value was significantly (p < 0.05) higher than the SC values of the LC and NC plants. This phenomenon means that plants suffered more severe stress damage than other samples. The mean values of the LC and NC plants were 16.99 and 19.42 μmol/mg, respectively, and their outcomes were more stable than those in SC, showing that the cytoplasmic membranes of C. dactylon and A. stolonifera suffered less damage and had better drought resistance.

3.3.2. Free Proline

The concentration of Pro, as an osmotic adjustment substance, is particularly vital for plants that are under stress. In this experiment, the Pro concentrations in S. argenteostriatus and A. stolonifera in the NC treatment group were the highest among all treatments, followed by the SC and LC treatment groups. Additionally, the Pro concentration in S. argenteostriatus in the NC treatment group was significantly (p < 0.05) higher than those in the SC and LC treatment groups. This phenomenon illustrated that the two plants that grew naturally were more capable of resisting stress than those planted in the PC treatment groups. A. stolonifera and C. dactylon in all treatment groups showed more stable adaptability than S. argenteostriatus (Figure 8).

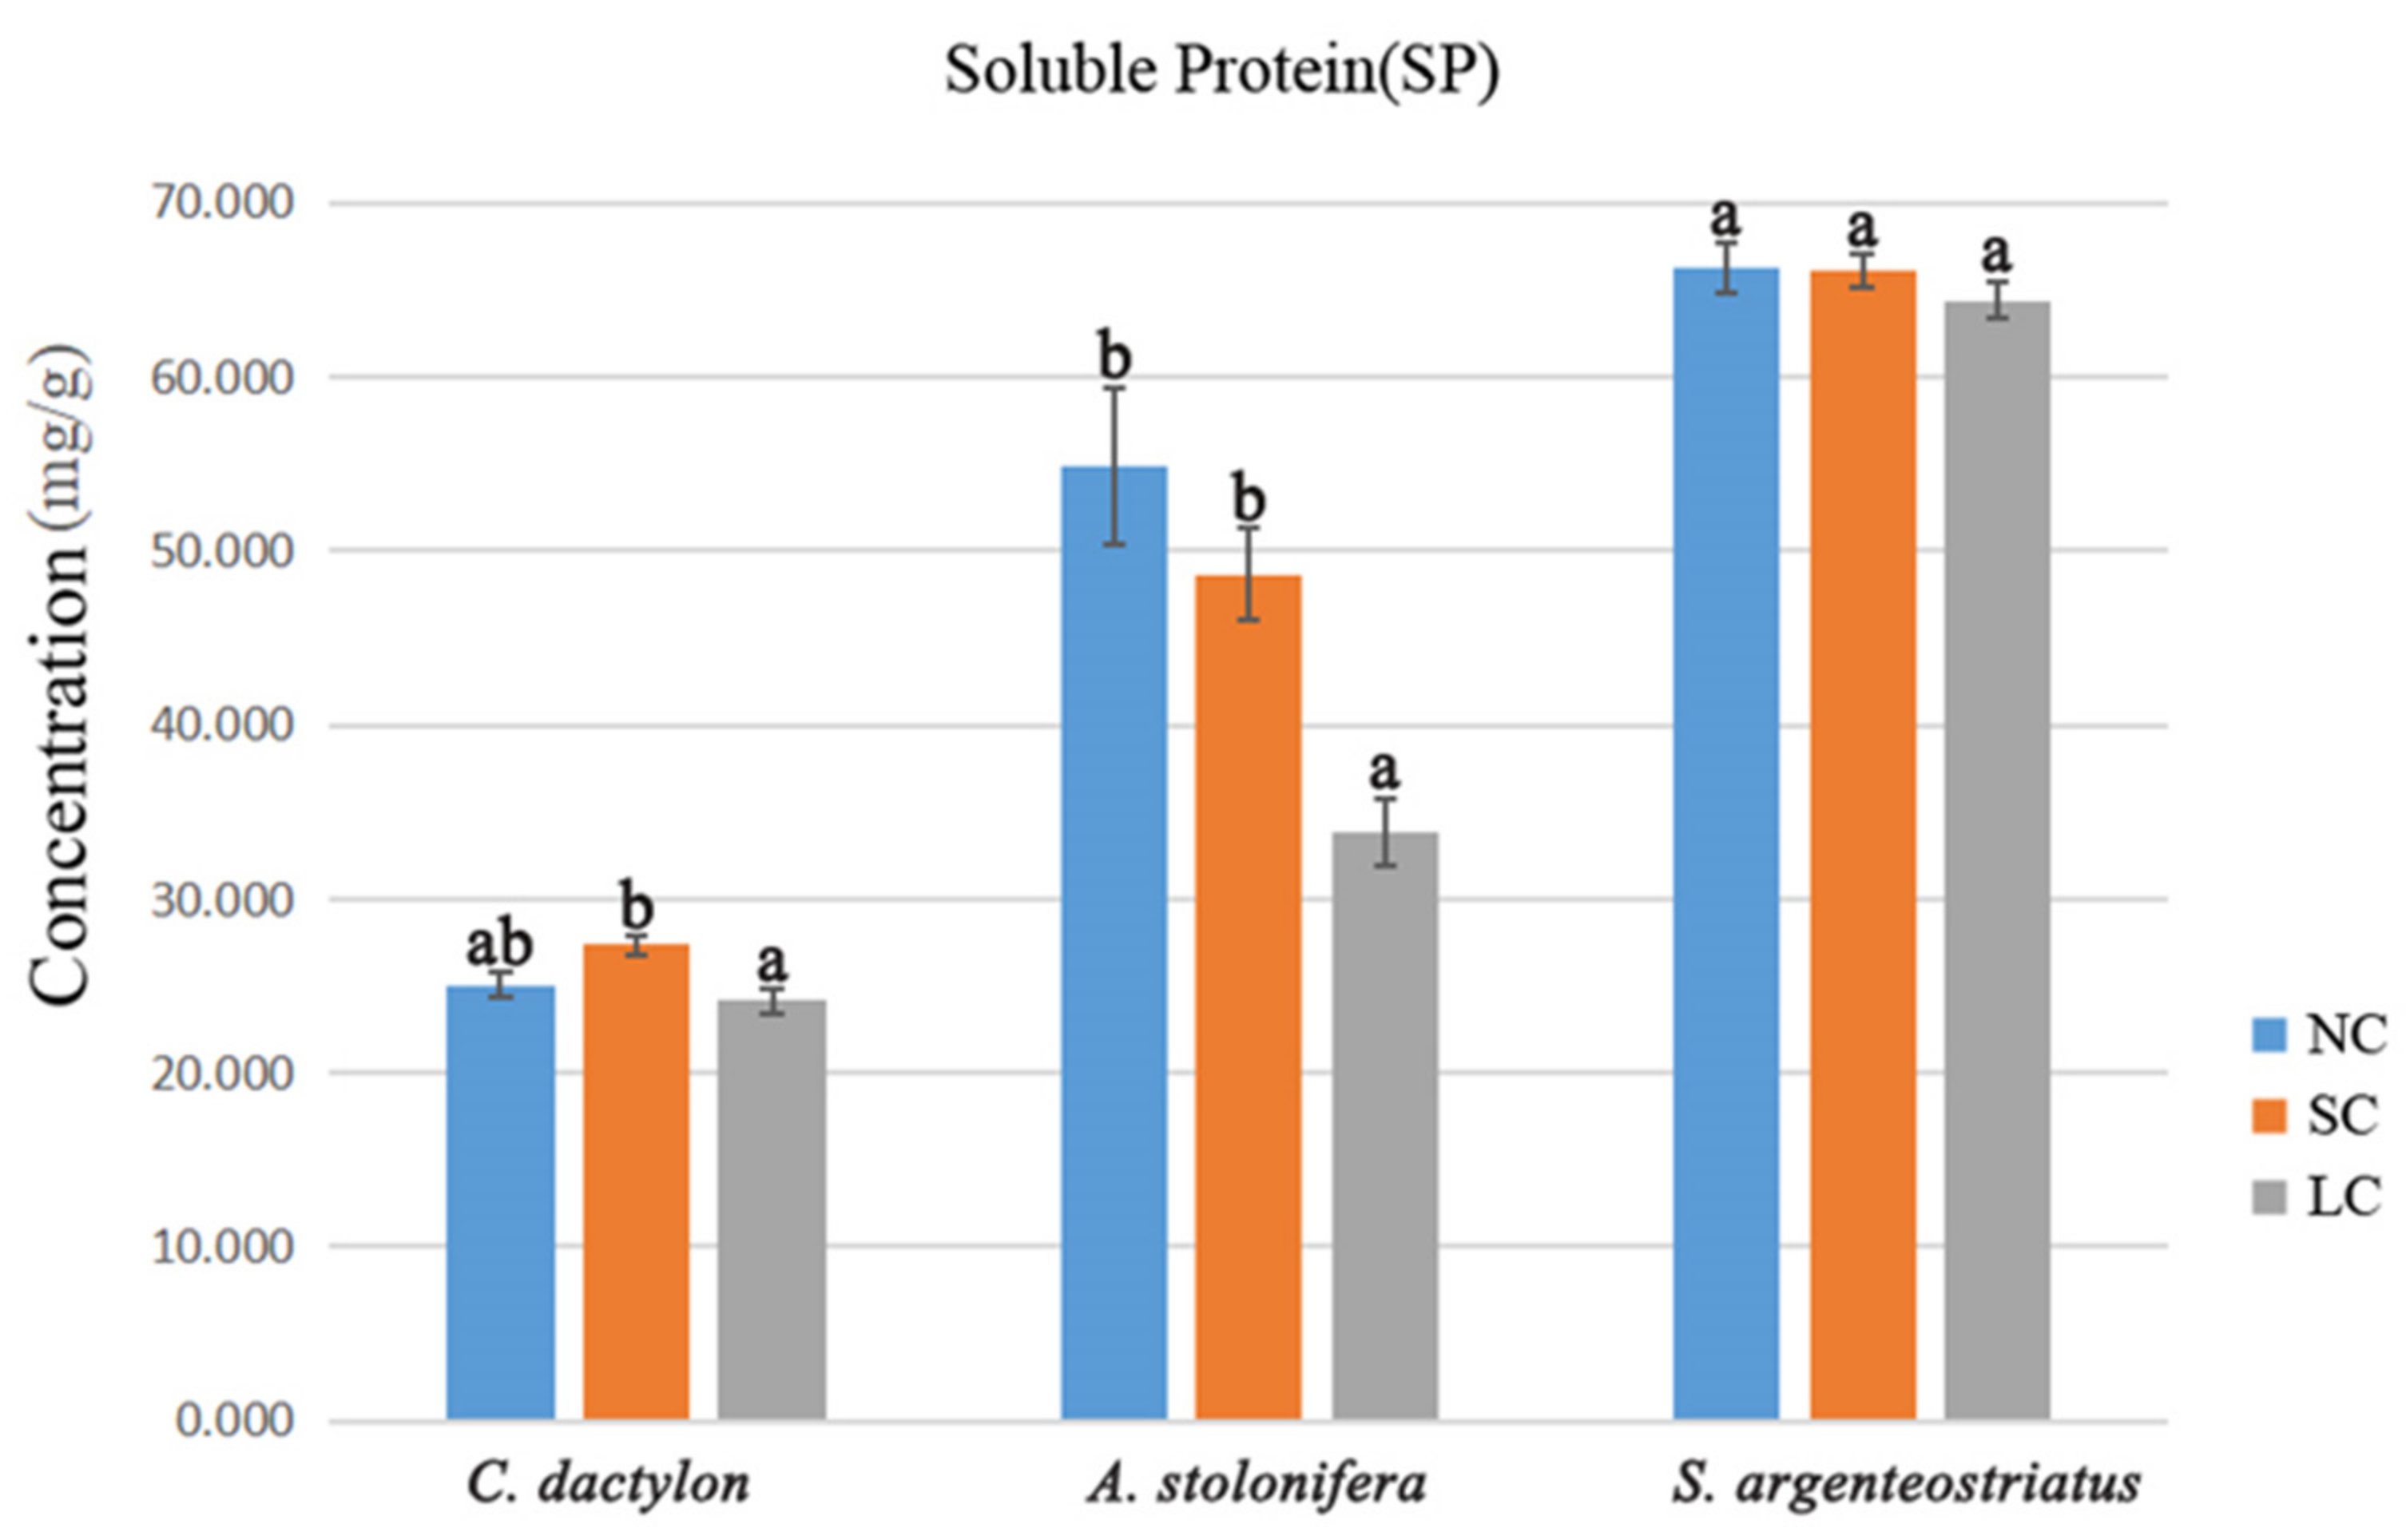
3.3.3. Soluble Protein
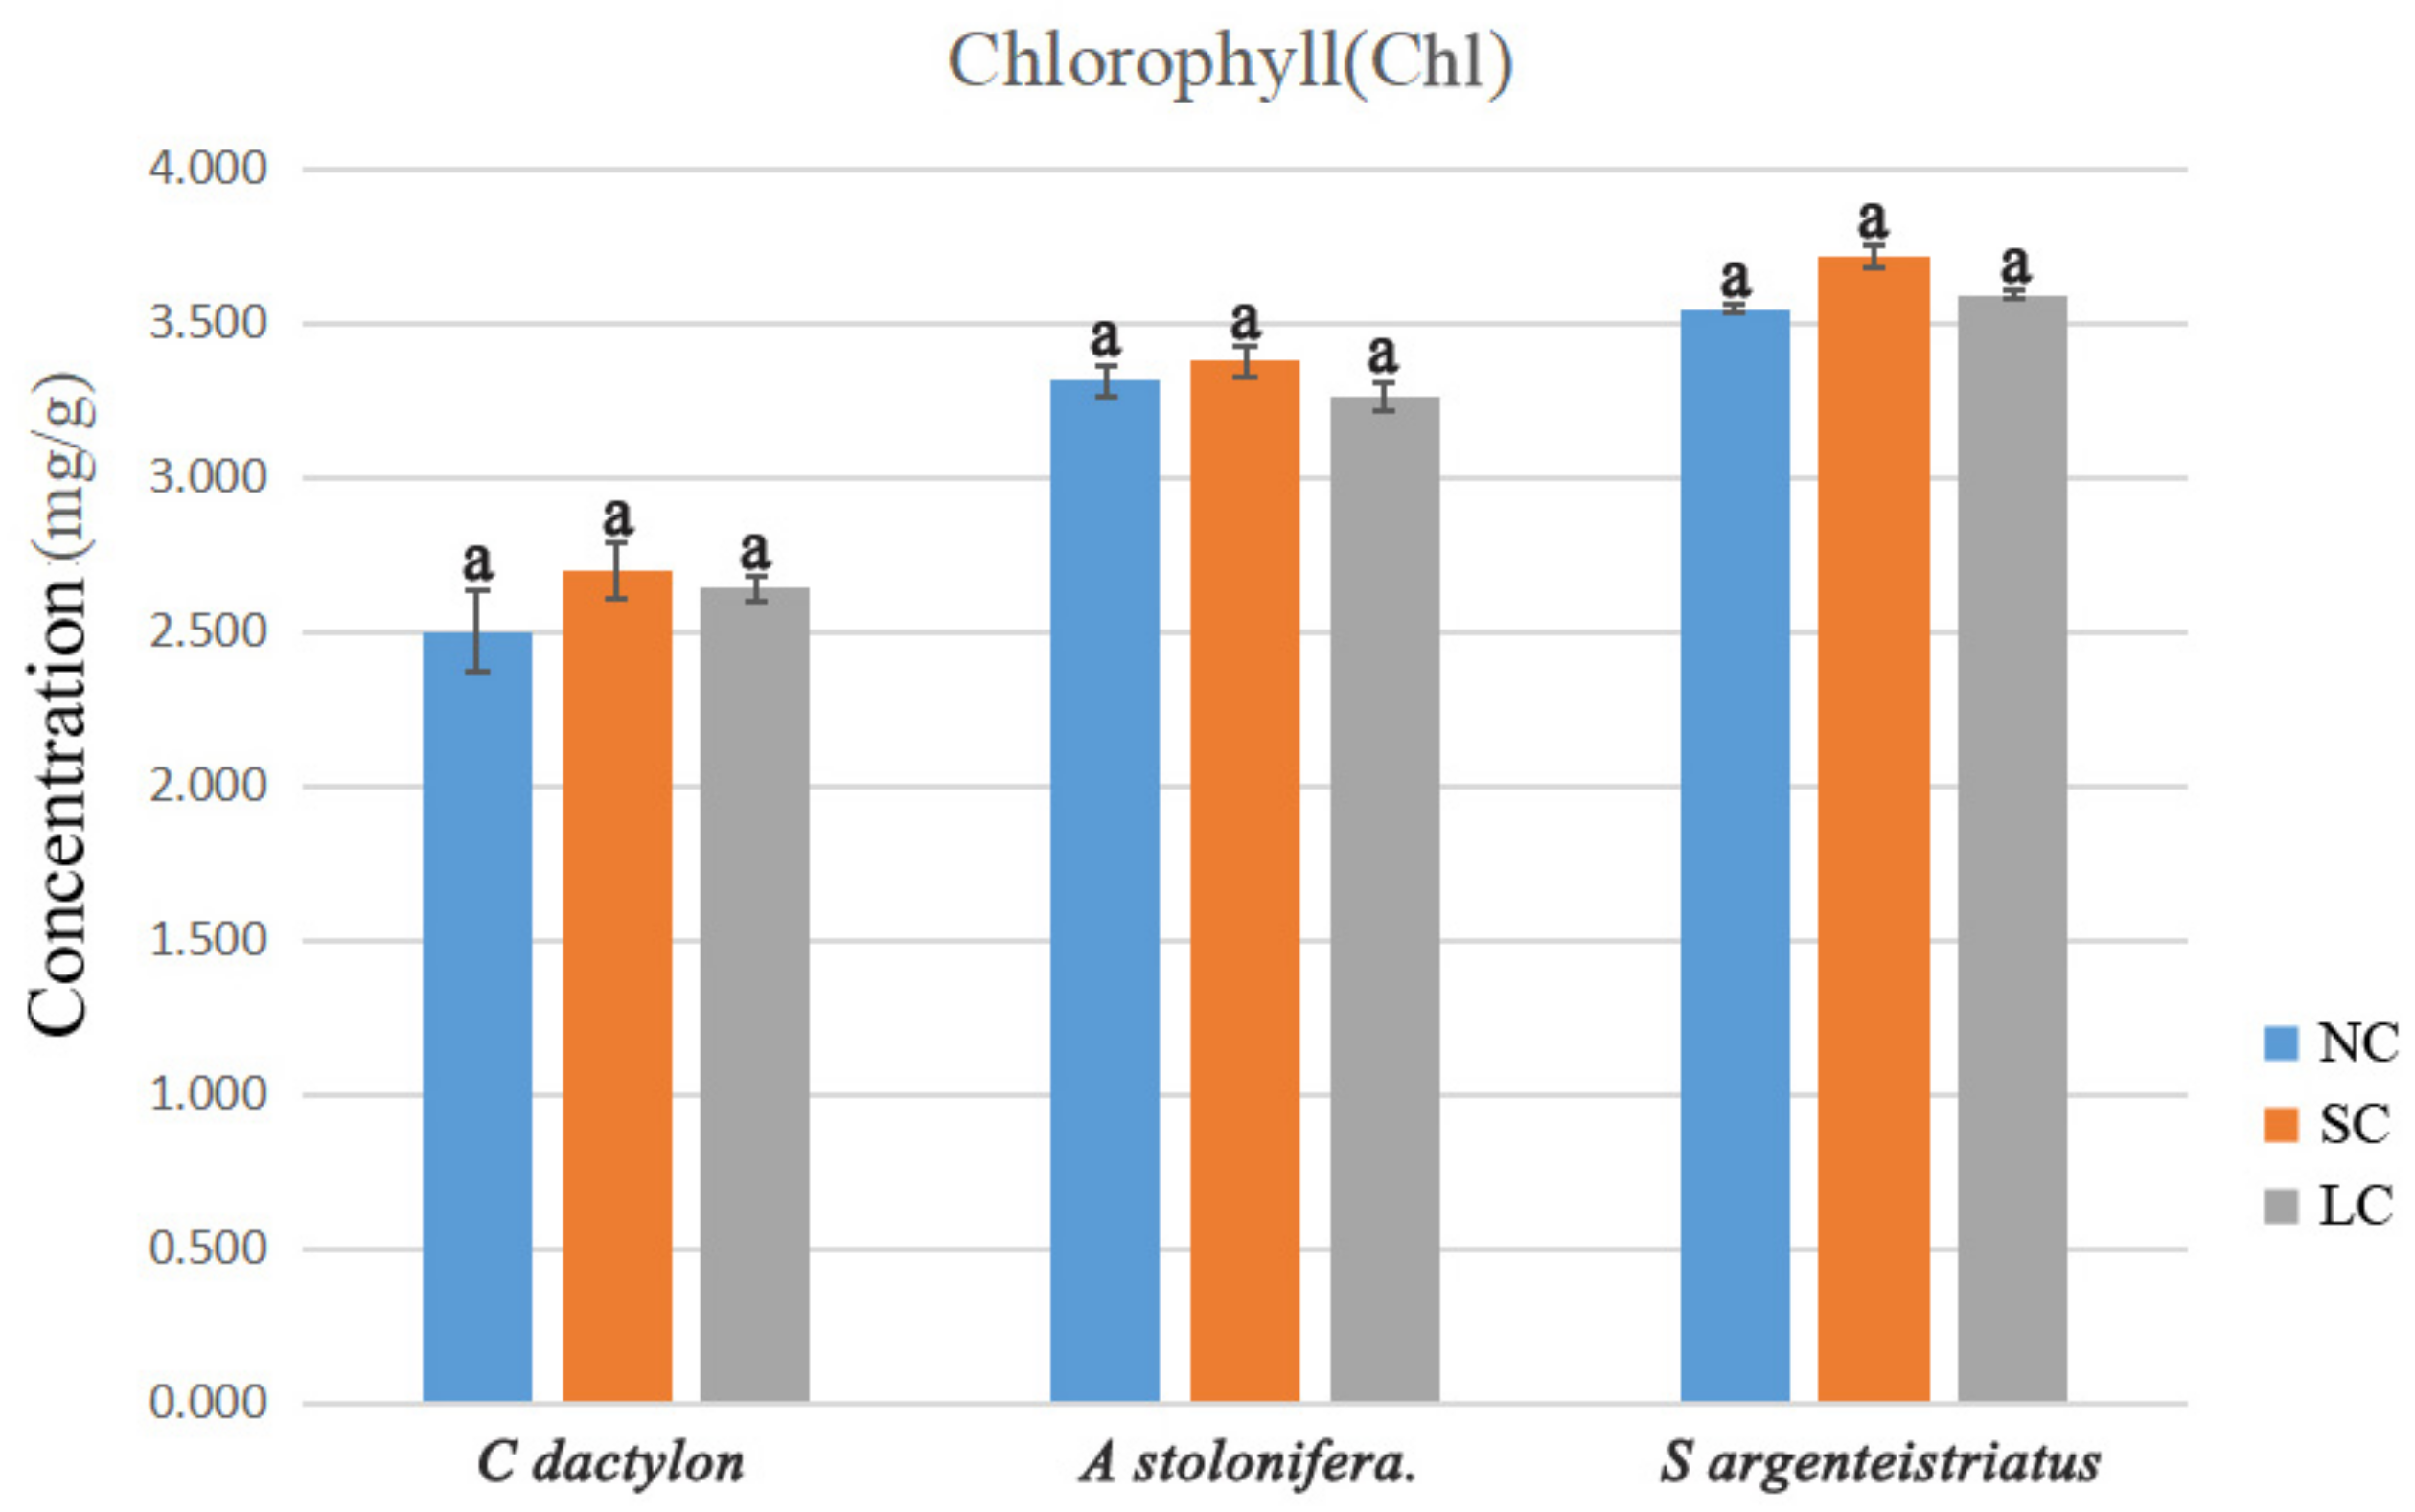
The SP concentration in C. dactylon in SC was 27.361 mg/g, which was significantly (p < 0.05) higher than the concentration of 25.045 mg/g in NC and that of 24.141 mg/g in LC. A. stolonifera in LC, 33.759 mg/g on average, had a highly significant (p < 0.01) lower SP concentration than the SP concentration of 48.620 mg/g in NC and 54.885 mg/g in NC. Figure 9 also reveals that the detected SP accumulations in the treatment groups of S. argenteostriatus are similar, exhibiting a nonsignificant difference, with concentrations ranging from 64.403 mg/g in the LC treatment group to 66.213 mg/g in the NC treatment group. The LC containers resulted in the lowest values for all three plants among all treatments, which illustrated that the plant tissue in LC was not as active as that in SC and NC.

3.3.4. Chlorophyll

Figure 10 clearly shows that the Chl concentration in the different plants in the treatment groups fluctuated. C. dactylon grew slightly better in the treatment groups than in the NC group. The SC treatment resulted in the highest Chl concentration of 2.698 mg/g on average. The concentration in A. stolonifera cultivated in SC containers was slightly higher than those in the plants cultivated in NC and LC containers, with a nonsignificant difference among the treatments.

3.3.5. Relative Electrical Conductivity

Figure 11 shows the REC among all the different treatments of the plants. The REC differences can be clearly observed. The REC was significantly correlated with MDA. C. dactylon in the NC treatment group had a significantly (p < 0.05) higher REC of 5.71% compared to that in the plants in the SC and LC treatment groups at 4.52% and 4.20%, respectively. The REC in A. stolonifera was opposite to that in C. dactylon, with an LC level of 6.91%. The SC and NC levels were 6.42% and 5.89%, respectively. Compared with the REC indexes of the other two plants, the REC index of S. argenteostriatus in the SC treatment group was significantly higher (p < 0.05), by 23% on average. One of the REC functions is to reflect the extent to which plants have been damaged. Figure 11 clearly reveals that S. argenteostriatus in the SC treatment group suffered more damage than that in the other treatment groups.
In this study, five plant physiological indicators were measured to test the plants in the different treatment groups. The index correlations and the significance of different plants in each treatment group are presented. The indexes for each plant were different because of the differences among the individual plant species. Each plant showed various growth conditions among the different treatments. However, across the different treatments, the plant physiological indicators showed roughly the same trend: plant tissue developed remarkably better under near-natural conditions than under the other two treatment conditions.

3.4. Soil Composition

Table 7 clearly reveals that all indicators of the after-use soil decreased to various degrees, except the pH value. TP decreased from 68.5% to 72.6% in all treatments. The reduction amplitude (RA) of TK was similar to that of TP, decreasing from 54.8% to 67.2%, and TK decreased more in the soil in which A. stolonifera was present. This phenomenon illustrated that A. stolonifera needs more TK to grow than the other species. SOM, as one of the most important nutrients needed for plant growth [35], was reduced from 32.9% to 47.6% in all treatments. The RA values of TN and AN in A. stolonifera in the NC treatment group were highly significant and larger than those in the plants in the LC and SC treatment groups, at 74.0% and 79.2%, respectively. The total RA of TN and AN in the LC treatment group was lower than that in the SC treatment group. The pH value showed that all specimens increased after the planting tests; the soil pH values in the concrete treatments were 0.1–0.5 higher than those in NC.

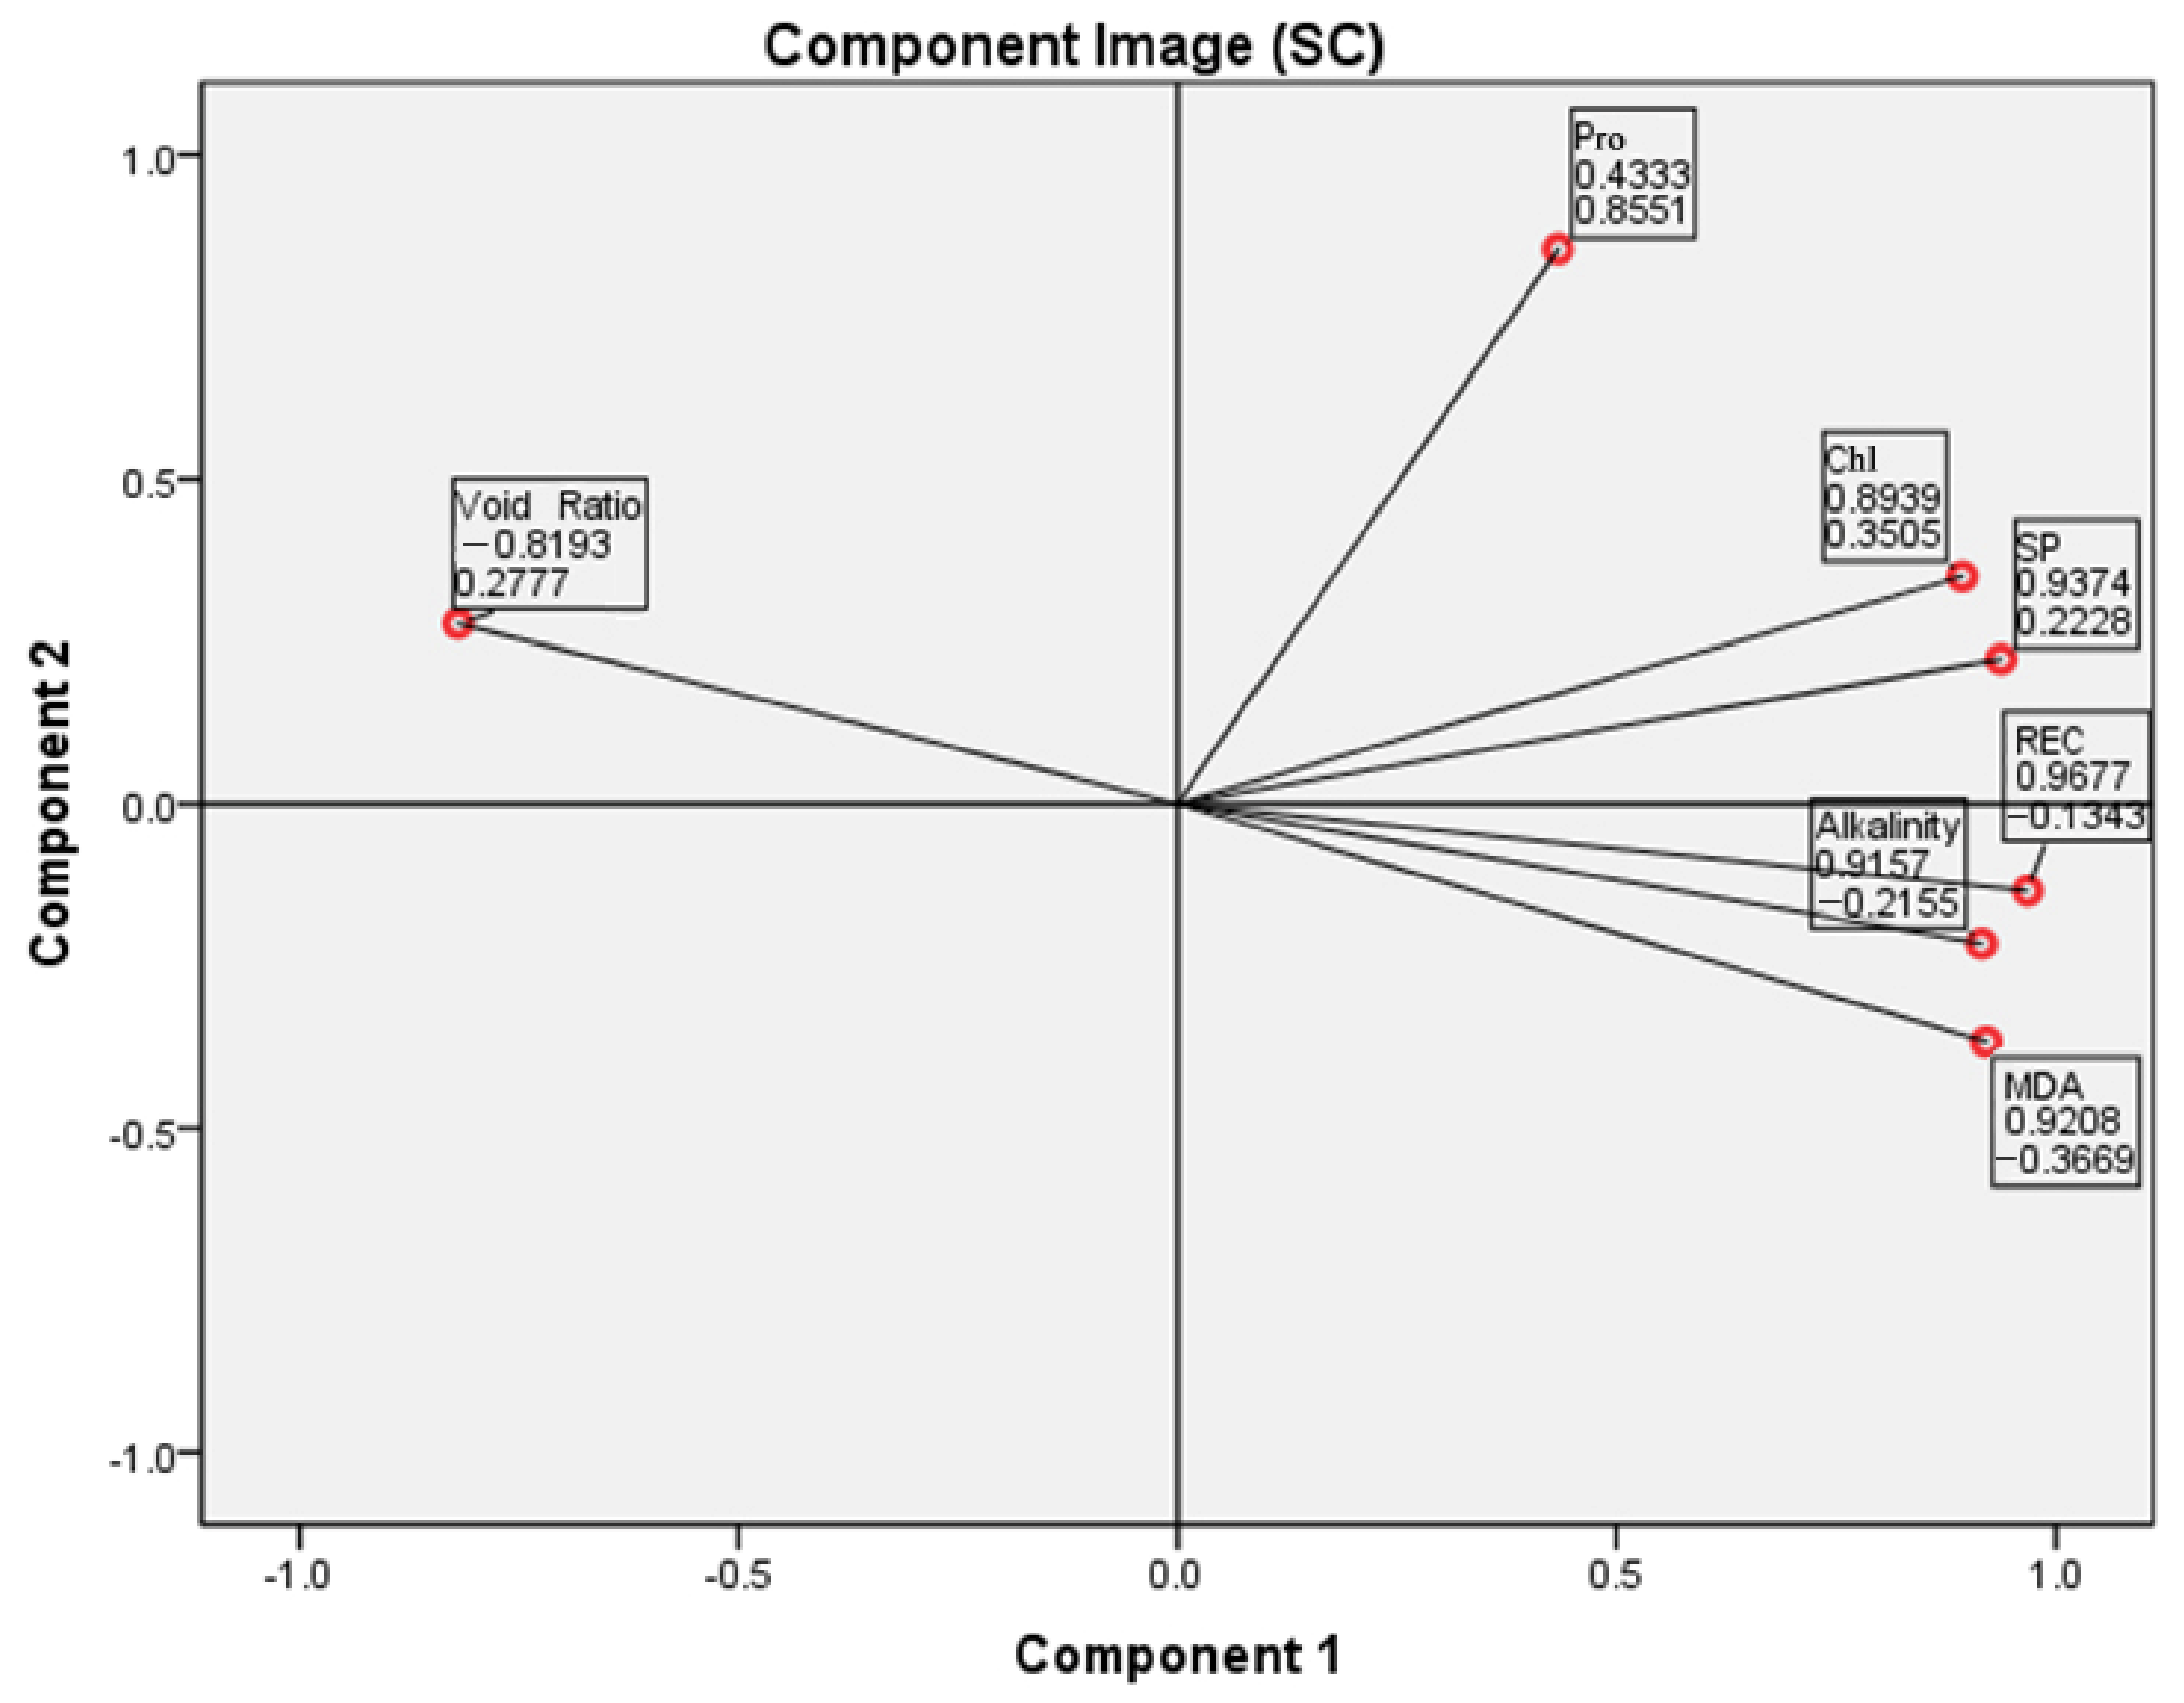
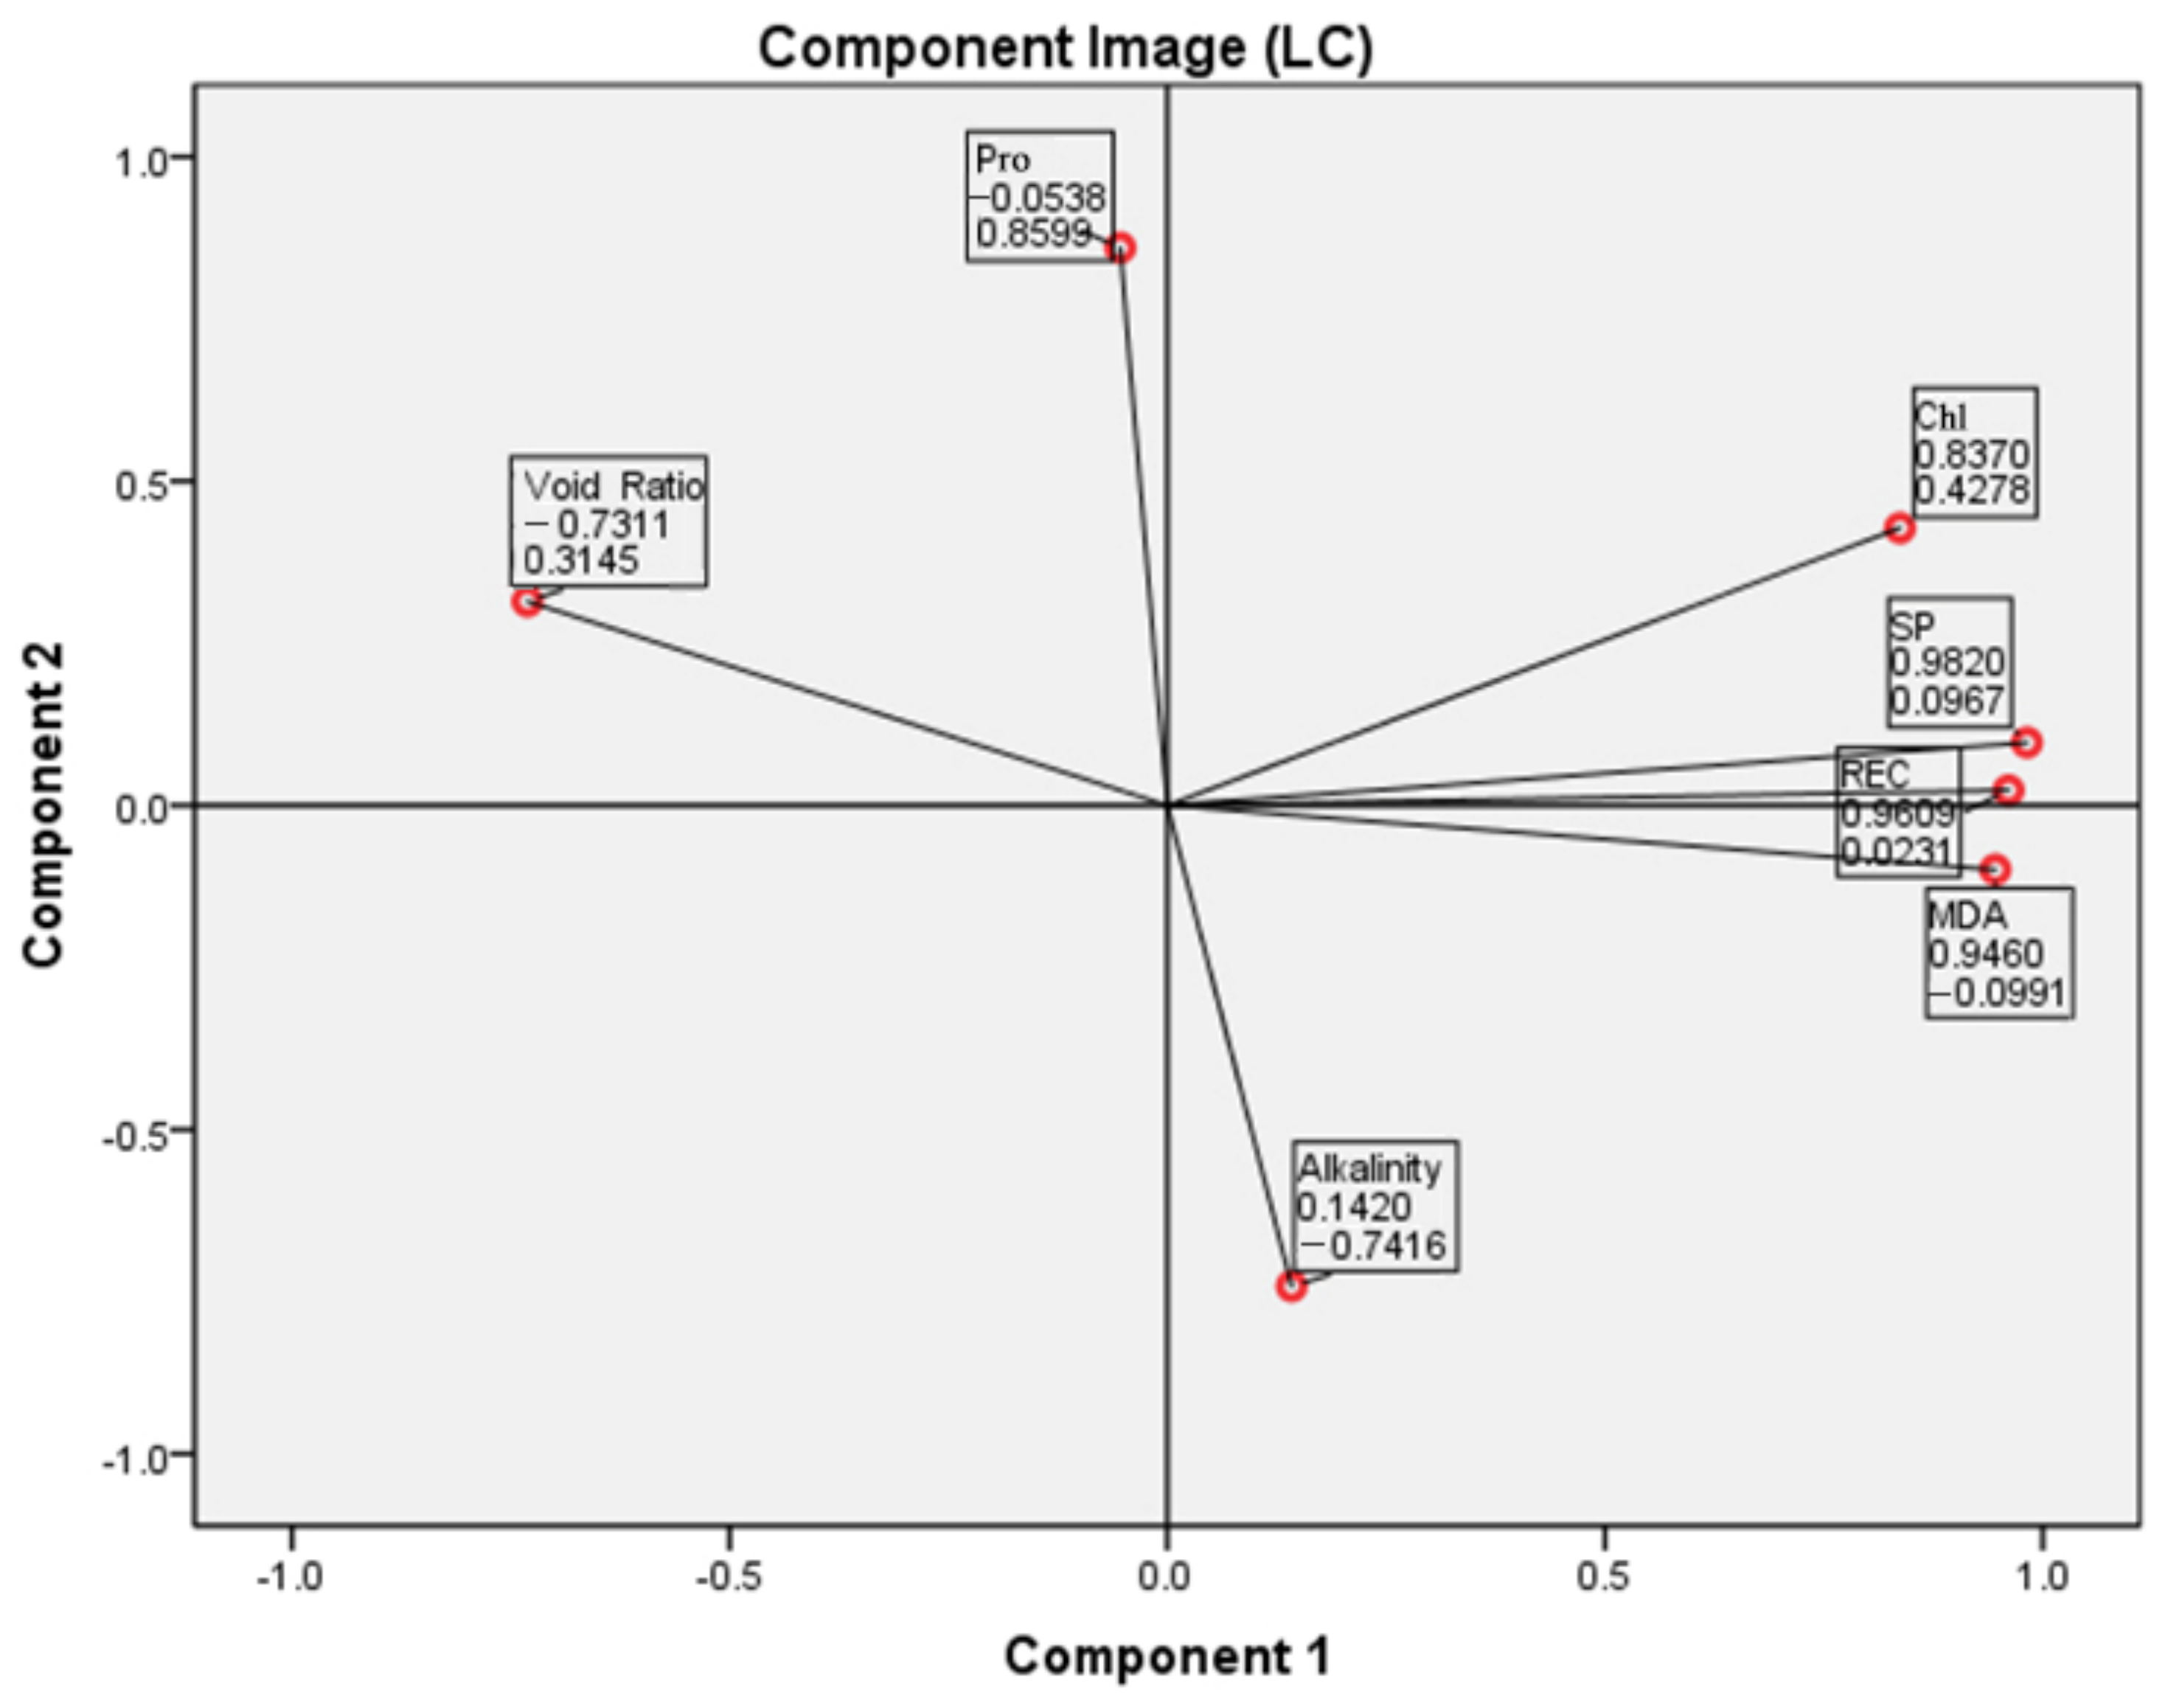
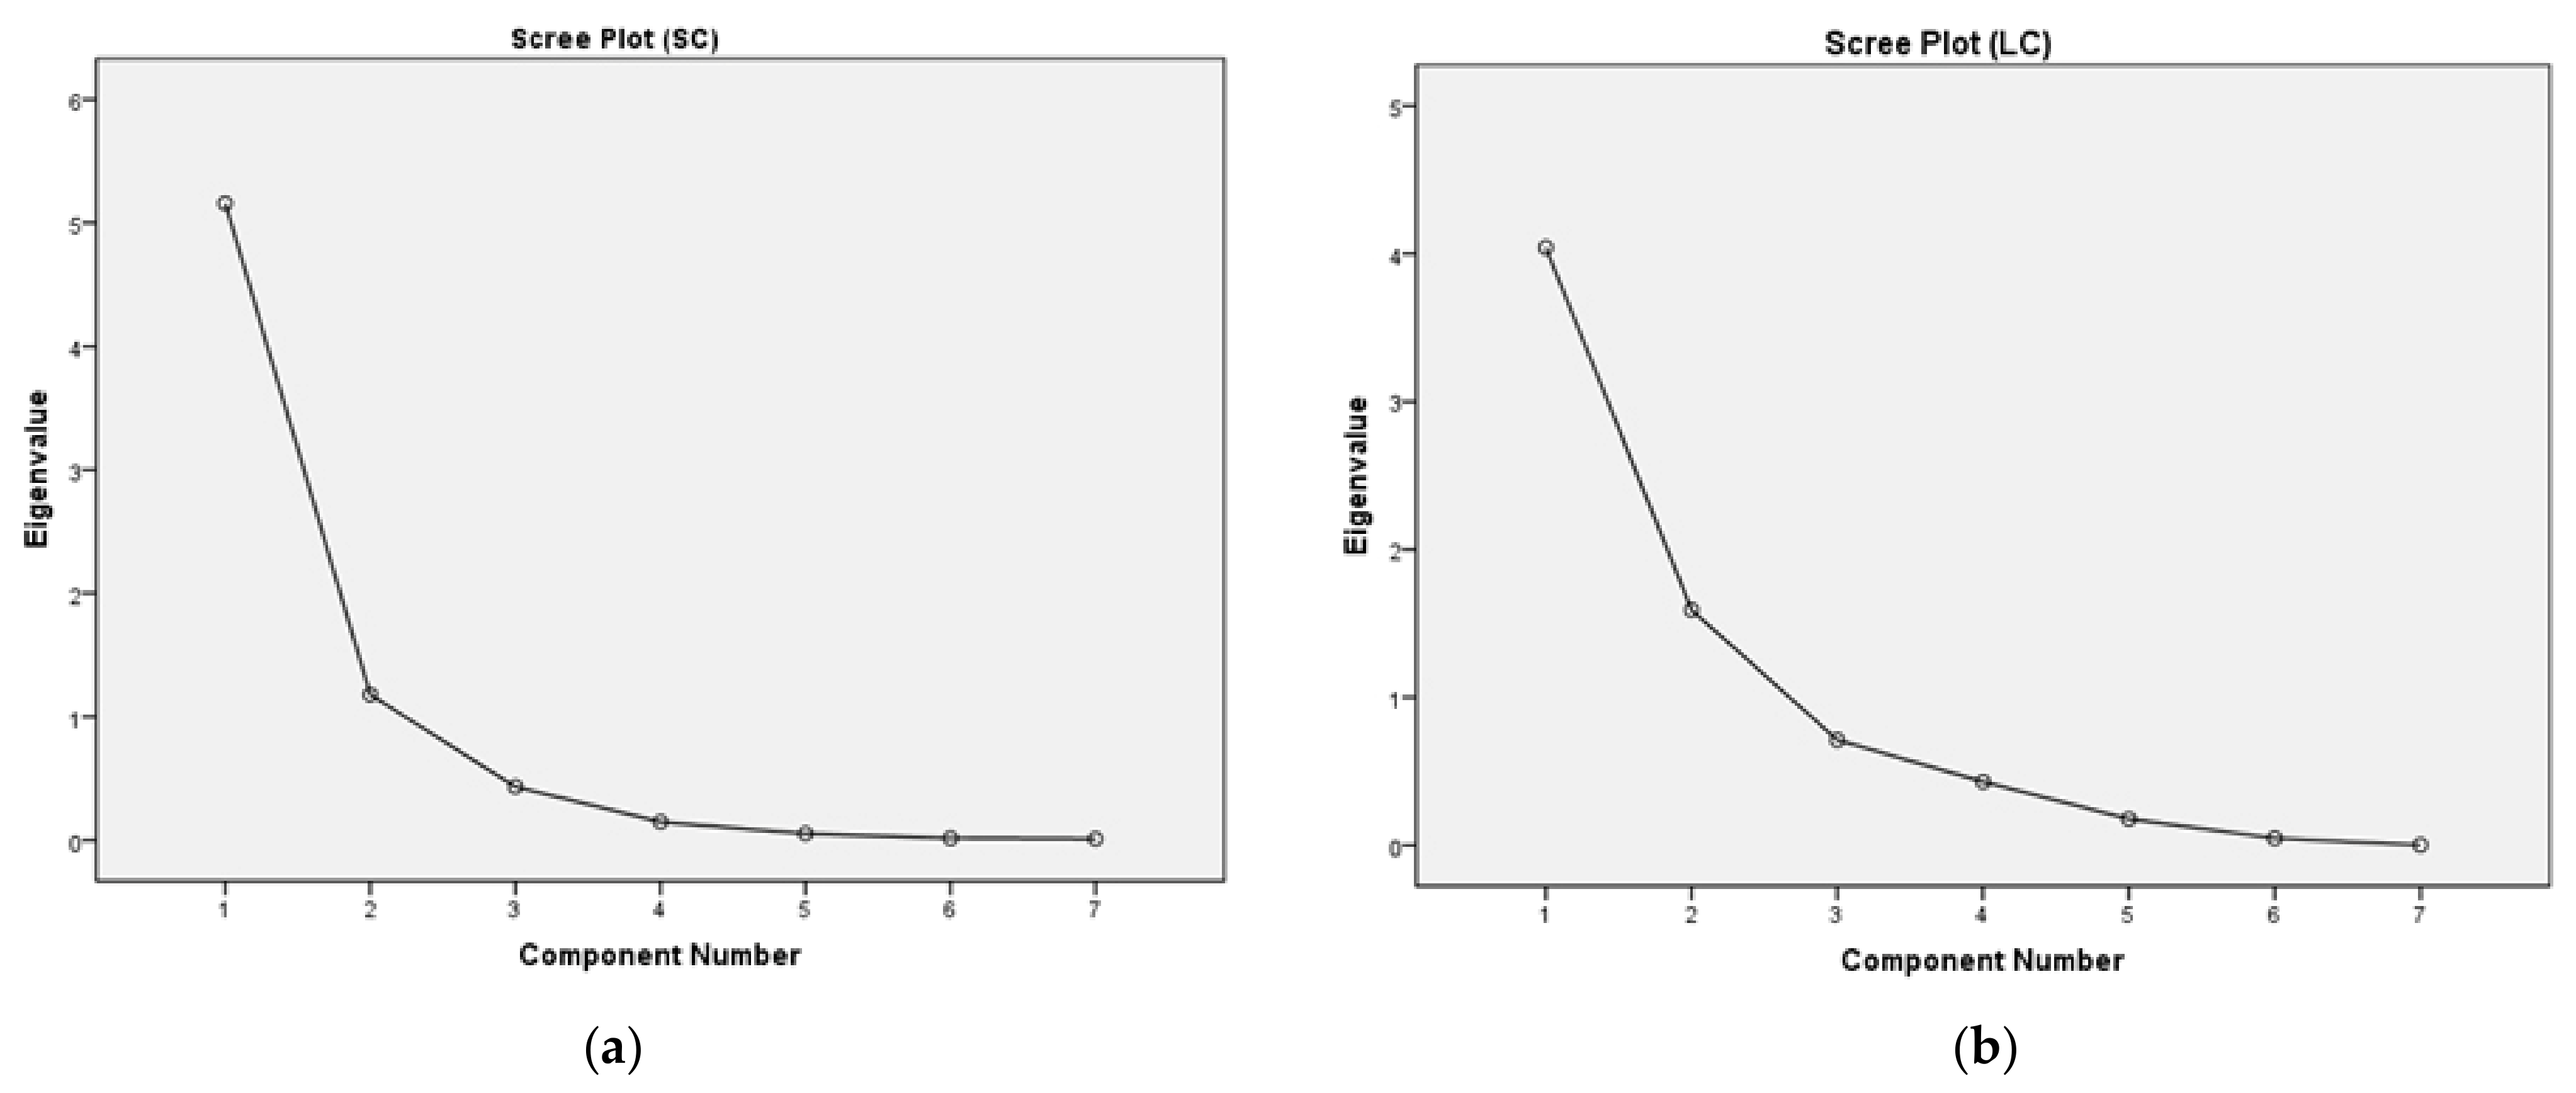
3.5. Statistical Results

We divided the physiological indexes by aggregate size in the PC, SC, and LC treatment groups for PCA. To identify the main factor influencing the growth of the SC and LC groups, we evaluated the applicability of PCA, and the Kaiser–Meyer–Olkin (KMO) and Bartlett sphericity tests were administered. KMO is a measure of sampling adequacy that indicates the proportion of variance due to the underlying factors. Desired KMO values are typically greater than 0.5 [36]. In this study, the KMO test values were 0.608 (SC) and 0.512 (LC), showing that the data could be used for PCA and that PCA could result in a significant dimensionality reduction. Bartlett’s test compares the correlation matrix with an identity matrix, evaluating the redundancy among the variables. In this study, the significance levels were reported to be 0.000 (SC) and 0.000 (LC), and all variables were significantly correlated. According to the correlation analysis, the unrelated variable in both groups of specimens, the compressive strength, was deleted.
Figure 12 shows the average distribution of different weights allocated to the first and second components for all indicators with different sizes of PCs. The figure in the box shows the contribution of each index to the first and second principal components. According to Figure 12, the parameters REC, SP, MDA, and alkalinity had the largest weights and longest distances from the determination line and were therefore the most influential parameters for measuring plant growth stress; their contribution values to the first component were 0.9677, 0.9374, 0.9208, and 0.9157, followed by 0.8906 for Chl in the SC group. The void ratio shows the opposite tendency in the figure; this outcome and the results of the correlation analysis are similar. The parameters REC, SP, MDA, and Chl had the largest weights and longest distances from the determination line in Figure 13 and Figure 14, illustrating that the cumulative contribution rate of the two principal components in each group was more than 80%, at 95.810% in the SC group and 93.678% in the LC group, indicating that choosing two components was feasible. In addition, the other three parameters with lower weights can be used to assist in plant growth prediction.
According to the plant physiological experiments and the PCA outcome, SP, REC, MDA, alkalinity, and Chl were the main factors responsible for the growth of the SC group being lower than that of the control group. Previous studies have found that plant metabolism takes place in a liquid environment, and the formation of SP in plants means that the plant tissues are going to carry out activities that require greater energy. SP is a component of many important enzymes in plants and is directly related to plant respiration, the decomposition of carbohydrates for energy, the formation of cells, and the catalysis of various chemical reactions [37]. REC is an index that indicates resistance in plants under stress, plant cell membrane permeability changes, and cell penetration in the electrolyte solution and can be used to determine the degree of membrane damage [38]. MDA, as a biomarker of oxidative stress, appears on the first principal component along with alkalinity, indicating that the plants were subjected to saline–alkali stress [39]. SP, REC, and MDA were the main influencing factors in both the LC and SC groups. However, alkalinity plays a different role in the LC group, indicating that it is not as closely related to plant growth in a concrete matrix with a larger particle size. This phenomenon requires more detailed study in the future.
As the common components that mainly regulate plant growth, SP, REC, and MDA obviously indicated that the plants growing on large- and small-particle-diameter concrete did not grow as well as those growing in near-natural containers. Plant cultivation observation and physiological indexes revealed that the plants growing on PC were subjected to abiotic stress and were irreversibly damaged, with not only a difference in plant appearance and height but also internal molecular structure. Some scholars have developed this phenomenon through various types of stress trials. M. Andrews investigated the relationship between the shoot to root ratio (S:R), growth and leaf SP concentration of Pisum sativum, Phaseolus vulgaris and Triticum aestivum under different nutrient deficiencies. His results indicated a significant positive correlation between S:R and leaf SP concentration (p < 0.001) [40]. K. Krishna took different qualities of bananas as samples and found that insufficient water supply negatively affected plant relative water content, SP, Chl content, and production [41]. The effect of the concrete matrix on plant productivity and persistence is consistent with the experimental results of Tang [42]. There are two possible explanations for this phenomenon: (1) Certain components, such as alkaline substances in concrete, contaminate the soil and inhibit plant growth. (2) The insufficient soil layer and the low permeability of the matrix cause the plant root system to absorb insufficient nutrition compared to that under natural growing conditions. For instance, the roots of S. argenteostriatus are more developed than those of the other two species because of its plant properties; it is therefore considered to be more sensitive to soil nutrient requirements and soil properties.
In this study, when the plants were subjected to alkaline stress, the cell membrane was damaged first, resulting in membrane lipid peroxidation, intracellular soluble extravasation, and the accumulation of membrane lipid peroxidation products such as MDA. The accumulation of MDA causes repeated damage to cells, leading to a series of biological and chemical reactions. Plants will increase the content of SP to improve the water retention ability of their cells under stress and thereby enhance their stress resistance. The MDA content of S. argenteostriatus in the SC group was significantly different from that in the other two treatment groups, showing that S. argenteostriatus did not experience significant salinization damage in SC. Saline–alkali stress has a serious negative effect on plant metabolism and appearance. When this situation occurs in slope protection projects, it will greatly affect the landscape effect and increase the risk of soil erosion. Many scholars and engineers have studied the internal mechanisms of plant damage caused by salinized substrates and proposed certain countermeasures. Biological control is an economical and effective way to improve alkalized substrates; microorganisms such as certain bacteria and fungi can effectively improve the physical and chemical properties of salinized substrates [43]. Zhang inoculated Arbuscular mycorrhizal fungi into a saline substrate and found that it increased the absorption of N, P, K, and Ca by plants while reducing the absorption of Na, Mg, and Cl ions. This resulted in a significant increase in plant biomass and seedling survival [44]. Kaushik found that cyanobacteria enhance the physical, chemical, and nutritional properties of saline substrates [45].
On the other hand, in both sets of analyses, the Pro parameter was the closest in distance to the determination line. This indicator showed nonsignificant differences in previous interplant comparisons. This also illustrates that this index was not applicable in the current experiment and that the accumulation of Pro by plants under environmental stress is not a suitable indicator of stress in plants. This conclusion is similar to the conclusions of some previous studies [46].

4. Conclusions

This study conducted an assessment of the suitability of using PC for vegetation growth from the perspective of plant physiology. The growth and physical indexes of the three plant species were analysed and monitored. Mechanical property tests, vegetation tests, and PCAs were conducted on samples in the different concretes to determine the differences in plant growth among PC (5–10 and 15–20 mm) and near-natural growing conditions. Based on the tests above, the following conclusions were obtained:
Based on the results of plant growth, correlation analysis, physiological indexes, PCA, and soil composition tests, the PC concrete matrix was not as effective as the natural growing environment, regardless of the diameter of the aggregate particles. The materials introduced by concrete may adversely affect plant growth.
Plants generally suffered more abiotic stress in the SC treatments. In the interspecific comparison tests, C. dactylon and A. stolonifera suffered various degrees of damage in PC treatments, as indicated by their lower detected MDA and SP concentrations. However, the cell membranes of roots were not significantly damaged, and the plants were able to grow normally. Because of the low permeability of the SC containers, the root systems suffered from hypoxia, which had a certain degree of influence on the growth of roots. Therefore, in the performance evaluation of the plant morphology of A. stolonifera, the LC treatment was more suitable than the SC treatment. The MDA and REC levels in S. argenteostriatus in the SC treatment group were significantly higher than those in the plants in the NC and LC treatment groups, indicating that S. argenteostriatus was under greater stress. This occurred because for S. argenteostriatus, in moist and acidic soils, its well-developed underground stem and root systems develop a network structure and have a high water and soil conservation capacity [47].
For the matrix with a small pore size, such as that of the SC treatment group, its drainage capacity is not as high as that of the matrix with a large pore size (LC and NC treatment groups), which causes the root system to be in a constant state of water flooding and simultaneously leaches alkaline ions from the concrete, resulting in greater stress. For the LC treatment group, the drainage capacity was higher than that in the SC treatment group, and the water flooding effect on S. argenteostriatus was reduced. Most plants are more likely to grow well in concrete types with higher porosity and larger pore size than in SC. This phenomenon is consistent with the results of previous studies [48].
PCA allowed us to determine that the main factors influencing the growth of the other SC groups in addition to the control group were SP, REC, MDA and alkalinity; SP, REC, and MDA were the main influencing factors in the LC group. These results indicated that the plants were under stress during their growth in the PC groups. Plants planted on PC or in pores require more careful care, such as the usage of fertilizer.
PCA and correlation analysis showed that Pro could not objectively or accurately characterize the vegetative growth process of plants in this experiment.
Regarding the limitations of this research, future studies should be conducted in terms of long-term practical applications to ensure the ecological functions, landscape effects and sustainable development of slope protection. In addition, more PC specimens of different particle sizes need to be tested. According to the characteristics of PC, the most suitable slope protection plants can be selected, and added plant species should be studied, in addition to herbs, such as shrubs and even small trees. Physiological indicators under different conditions could be used to reach more accurate conclusions.
Overall, planting concrete has good engineering performance, and it can provide help for infrastructure construction to promote connectivity between ecosystems. The obtained results provide a preliminary platform for future research into PC application, particularly in environmental protection and ecological restoration.

Author Contributions

Q.C. provided the original ideas. D.L. performed the experiments and data analysis and wrote the original draft of this paper. Y.T. performed the experiments and data analysis. S.M., X.Z., B.L. and W.L. performed the experiment. C.Z., L.G. and N.L. wrote part of this paper. All authors have read and agreed to the published version of the manuscript.

Funding

This research was funded by the Sichuan Provincial Science and Technology Department Science and Technology Project “Breakthrough bamboo and flower breeding materials and method innovation and new variety breeding (breeding research project)” 2021yfyz0006.

Institutional Review Board Statement

The study was conducted according to the guidelines of the Declaration of Helsinki, and approved by the Institutional Review Board of Sichuan Agricultural University (No. 20210153).

Informed Consent Statement

Not applicable. This study did not involve humans.

Data Availability Statement

The data presented in this study are available on request from the corresponding author. The data are not publicly available due to privacy.

Acknowledgments

This research was supported by the Sichuan Provincial Science and Technology Department Science and Technology Project “Breakthrough bamboo and flower breeding materials and method innovation and new variety breeding (breeding research project)” 2021yfyz0006.

Conflicts of Interest

The authors declare no conflict of interest.

References

  1. Hu, Y.; Dou, X.; Li, J.; Li, F. Impervious Surfaces Alter Soil Bacterial Communities in Urban Areas: A Case Study in Beijing, China. Front. Microbiol. 2018, 9, 226. [Google Scholar] [CrossRef]
  2. Wingeyer, A.; Mamo, M.; Schacht, W.; McCallister, D.; Sutton, P. Vegetation and Soil Responses to Concrete Grinding Residue Application on Highway Roadsides of Eastern Nebraska. J. Environ. Qual. 2018, 47, 554–561. [Google Scholar] [CrossRef] [Green Version]
  3. Bennai, F.; El Hachem, C.; Abahri, K.; Belarbi, R. Microscopic hydric characterization of hemp concrete by X-ray microtomography and digital volume correlation. Constr. Build. Mater. 2018, 188, 983–994. [Google Scholar] [CrossRef]
  4. Ouldkhaoua, Y.; Benabed, B.; Abousnina, R.; Kadri, E.-H. Experimental study on the reuse of cathode ray tubes funnel glass as fine aggregate for developing an ecological self-compacting mortar incorporating metakaolin. J. Build. Eng. 2020, 27, 100951. [Google Scholar] [CrossRef]
  5. Kubissa, W.; Jaskulski, R.; Reiterman, P. Ecological Concrete Based on Blast-Furnace Cement with Incorporated Coarse Recycled Concrete Aggregate and Fly Ash Addition. J. Renew. Mater. 2017, 5, 53–61. [Google Scholar] [CrossRef]
  6. Ivanka, N.G.; Ivana, B.; Vilma, B.; Lidija, K. Draining capability of single-sized pervious concrete. Constr. Build. Mater. 2018, 169, 252–260. [Google Scholar] [CrossRef]
  7. Rutkowska, G.; Wichowski, P.; Fronczyk, J.; Franus, M.; Chalecki, M. Use of fly ashes from municipal sewage sludge combustion in production of ash concretes. Constr. Build. Mater. 2018, 188, 874–883. [Google Scholar] [CrossRef]
  8. Alnahhal, M.F.; Alengaram, U.J.; Jumaat, M.Z.; Abutaha, F.; Alqedra, M.A.; Nayaka, R.R. Assessment on engineering properties and CO2 emissions of recycled aggregate concrete incorporating waste products as supplements to Portland cement. J. Clean. Prod. 2018, 203, 822–835. [Google Scholar] [CrossRef]
  9. Li, L.; Chen, M.; Zhou, X.; Lu, L.; Wang, Y.; Cheng, X. Evaluation of the preparation and fertilizer release performance of planting concrete made with recycled-concrete aggregates from demolition. J. Clean. Prod. 2018, 200, 54–64. [Google Scholar] [CrossRef]
  10. Hwang, V.; Masters, A.; Arocho, M.; Hwang, S. Fly ash-amended pervious concrete pavement followed by bamboo bioretention basin with Dracaena sanderiana for urban stormwater runoff control. Constr. Build. Mater. 2017, 132, 161–169. [Google Scholar] [CrossRef]
  11. Yuan, D.; Cui, L.; An, Y.; Chen, B.; Guo, X.; Li, Y.; Zhao, R.; Cui, S.; Wang, S.; Kou, Y. Investigating the pollutant-removal performance and DOM characteristics of rainfall surface runoff during different ecological concrete revetments treatment. Ecol. Indic. 2019, 105, 655–662. [Google Scholar] [CrossRef]
  12. Tang, V.T.; Fu, D.; Singh, R.P.; Rene, E.R.; Binh, T.N.; Sharma, A.K. Evaluating the effectiveness of ecological restoration of hard bank rivers: A case study from Shedu river port, China. J. Water Supply Res. Technol. 2019, 68, 368. [Google Scholar] [CrossRef]
  13. Kim, H.-H.; Lee, S.-K.; Park, C.-G. Carbon Dioxide Emission Evaluation of Porous Vegetation Concrete Blocks for Ecological Restoration Projects. Sustainability 2017, 9, 318. [Google Scholar] [CrossRef]
  14. Li, L.B.; Zhang, H.M.; Zhou, X.M.; Chen, M.X.; Lu, L.C.; Cheng, X. Effects of super absorbent polymer on scouring resistance and water retention performance of soil for growing plants in ecological concrete. Ecol. Eng. 2019, 138, 237–247. [Google Scholar] [CrossRef]
  15. Bao, X.; Liao, W.; Dong, Z.; Wang, S.; Tang, W. Development of Vegetation-Pervious Concrete in Grid Beam System for Soil Slope Protection. Materials 2017, 10, 96. [Google Scholar] [CrossRef] [PubMed]
  16. Zheng, X.; Ji, T.; Easa, S.M.; Ye, Y. Evaluating feasibility of using sea water curing for green artificial reef concrete. Constr. Build. Mater. 2018, 187, 545–552. [Google Scholar] [CrossRef]
  17. Liu, L.M.; Ji, J.N.; Guo, Y.S.; Chen, J.F. Use of ecological concrete for nutrient removal in coastal sediment and its effects on sediment microbial communities. Mar. Pollut. Bull. 2021, 162, 111911. [Google Scholar] [CrossRef] [PubMed]
  18. Chen, F.; Xu, Y.; Wang, C.; Mao, J. Effects of concrete content on seed germination and seedling establishment in vegetation concrete matrix in slope restoration. Ecol. Eng. 2013, 58, 99–104. [Google Scholar] [CrossRef]
  19. China Standards Publication. Utility Standard for Portland Cement GB175-2007; National Technical Committee for Cement Standardization (SAC/TC184); China Standards Press: Beijing, China, 2007. [Google Scholar]
  20. Yu, A.M.; Xu, Y.J. Progress in the application of nanocalcium carbonate in concrete. China Concr. 2016, 10, 53–56. Available online: https://kns.cnki.net/kcms/detail/detail.aspx?FileName=JZSJ201610008&DbName=CJFQ2016 (accessed on 6 December 2021).
  21. Li, G.S.; Gao, G.; Zhu, J.P.; Feng, C.L. Research progress of nano materials in cement-based materials. New Chem. Mater. 2018, 46, 15–19. [Google Scholar]
  22. Xing, X.X.; Xing, Y. Experimental Study on Application Properties of Macroporous Ecological Concrete without Sand. Adv. Mater. Res. 2011, 250–253, 901–905. [Google Scholar] [CrossRef]
  23. China Standards Publication. Standard for Test Method of Mechanical Properties on Ordinary Concrete GB/T 50081-2002; China Standards Press: Beijing, China, 2002. [Google Scholar]
  24. Kim, H.-H.; Park, C.-G. Plant Growth and Water Purification of Porous Vegetation Concrete Formed of Blast Furnace Slag, Natural Jute Fiber and Styrene Butadiene Latex. Sustainability 2016, 8, 386. [Google Scholar] [CrossRef]
  25. Xu, R.J.; Liu, R.G.; Yan, T.C. Experimental study on preparation and Properties of Plant porous concrete. Concr. Theor. Res. 2006, 12, 18–21. Available online: https://kns.cnki.net/kcms/detail/detail.aspx?FileName=HLTF200612005&DbName=CJFQ2006 (accessed on 6 December 2021).
  26. Roschlau, P.; Bernt, E.; Gruber, W. Enzymatic determination of total serum cholesterol. Z. Klin. Chem. Klin. Biochem. 1974, 20, 403–407. [Google Scholar]
  27. Chen, S. Injury of Membrane Lipid Peroxidation to Plant Cell. Plant Physiol. Commun. China 1991, 27, 84–90. [Google Scholar]
  28. Zhao, S.; Xu, C.; Zou, Q.; Meng, Q. Improvements of method for measurement for Malondialdehyde in plant tissues. Plant Physiol. Commun. China 1991, 30, 207–210. [Google Scholar]
  29. Qureshi, M.I.; Abdin, M.Z.; Ahmad, J.; Iqbal, M. Effect of long-term salinity on cellular antioxidants, compatible solute and fatty acid profile of Sweet Annie (Artemisia annua L.). Phytochemistry 2013, 95, 215–223. [Google Scholar] [CrossRef]
  30. Bates, L.S.; Waldren, R.P.; Teare, I.D. Rapid determination of free proline for water-stress studies. Plant Soil 1973, 39, 205–207. [Google Scholar] [CrossRef]
  31. Li, X.; Feng, W.; Zeng, X. Advances in Chlorophyll Fluorescence Analysis and Its Uses. Acta Bot. Boreali-Occident. Sin. China 2006, 26, 2186–2196. [Google Scholar]
  32. Wang, T.Q.; Chen XYu Jaime, A.T.; David, H.B. Physiological and biochemical responses of six herbaceous peony cultivars to cold stress. S. Afr. J. Bot. 2014, 94, 140–148. [Google Scholar] [CrossRef]
  33. Bro, R.; Smilde, A.K. Principal component analysis. Anal. Methods 2014, 6, 2812–2831. [Google Scholar] [CrossRef] [Green Version]
  34. Fu, T.C.; Yeih, W.; Chang, J.J.; Huang, R. The Influence of Aggregate Size and Binder Material on the Properties of Pervious Concrete. Adv. Mater. Sci. Eng. 2014, 2014, 1–17. [Google Scholar] [CrossRef] [Green Version]
  35. Huang, S.W.; Ji, J.Y.; Wang, Z.L.; Cheng, M.F. Study on the Potash Morphology and Plant Effectiveness of Main Soil in North China. Plant Nutr. Fertil. Sci. 1998, 4, 156–164. [Google Scholar]
  36. Andrews, M.; Sprent, J.I.; Raven, J.A.; Eady, P.E. Relationships between shoot to root ratio, growth and leaf soluble protein concentration of Pisum sativum, Phaseolus vulgaris and Triticum aestivum under different nutrient deficiencies. Plant Cell Environ. 1999, 22, 949–958. [Google Scholar] [CrossRef]
  37. Krishna Surendar, K.; Durga Devi, D.; Ravi, I.; Jeyakumar, P.; Velayudham, K. Water Stress Affects Plant Relative Water Content, Soluble Protein, Total Chlorophyll Content and Yield of Ratoon Banana. Int. J. Hortic. 2013, 3, 17. [Google Scholar] [CrossRef] [Green Version]
  38. Tang, W.; Mohseni, E.; Wang, Z. Development of vegetation concrete technology for slope protection and greening. Constr. Build. Mater. 2018, 179, 605–613. [Google Scholar] [CrossRef]
  39. Kaiser, H.F. An index of factorial simplicity. Psychometrika 1974, 39, 31–36. [Google Scholar] [CrossRef]
  40. Deans, C.A.; Behmer, S.T.; Fiene, J.; Sword, G.A. Spatio-Temporal, Genotypic, and Environmental Effects on Plant Soluble Protein and Digestible Carbohydrate Content: Implications for Insect Herbivores with Cotton as an Exemplar. J. Chem. Ecol. 2016, 42, 1151–1163. [Google Scholar] [CrossRef]
  41. Ma, W.-G.; Zhang, Z.-H.; Zheng, Y.-Y.; Pan, W.; Qiu, T.; Guan, Y.-J.; Hu, J. Determination of tobacco (Nicotiana tabacum) seed vigour using controlled deterioration followed by a conductivity test. Seed Sci. Technol. 2020, 48, 1–10. [Google Scholar] [CrossRef]
  42. Denise, G.; Lucas, S.M.; Juliana, V.; Clóvis, P.; Gabriela, S.; Solange, C.G.; Pomblum, V.J.; Rocha, J.B.T.; Farina, M. Importance of the lipid peroxidation biomarkers and methodological aspects FOR malondialdehyde quantification. Quim. Nova 2009, 32, 169–174. [Google Scholar]
  43. García, I.V.; Mendoza, R.E. Arbuscular mycorrhizal fungi and plant symbiosis in a saline-sodic soil. Mycorrhiza 2007, 17, 167–174. [Google Scholar] [CrossRef] [PubMed]
  44. Zhang, Y.F.; Wang, P.; Yang, Y.F. Arbuscularmycorrhizal fungi improve establishment of leymuschinensis in baresaline- alkaline soil: Implication onvegetation restoration of extremely degraded Land. J. Arid. Environ. 2011, 75, 773–778. [Google Scholar] [CrossRef]
  45. Kaushik, B.D.; Subhashini, D. Amelioration of salt-affected soils with blue–green algae: Improvement in soil properties. Proc. Indian Natl. Sci. Acad. 1985, 51, 386–389. [Google Scholar]
  46. Schobert, B. Is there an osmotic regulatory mechanism in algae and higher plants? J. Theor. Biol. 1977, 68, 17–26. [Google Scholar] [CrossRef]
  47. Lei, G.; Hu, X.; Guo, W.; Zhang, J.; Shu, Q.; Qi, L.H. Study on Application and Cultivation of Dwarf Bamboos Resources in China. World For. Res. 2019, 33, 60–66. [Google Scholar] [CrossRef]
  48. Yong, Y.Y.; Hu, C.M.; Xie, L.; Xiao, Q.W.; Wang, X.; Zhang, T.P.; Zheng, B.H. Effects of Pore Status of Plant Ecological Concrete on Plant Growth. J. South China Univ. Technol. 2006, 34, 12. [Google Scholar]
Figure 1. Photographs of sieves and appearance of aggregates.
Applsci 12 00645 g001
Figure 2. Sketch of the planting concrete sample used for the vegetation test.
Applsci 12 00645 g002
Figure 3. Chart of the average temperature during the vegetation test.
Applsci 12 00645 g003
Figure 4. (a) Graph of C. dactylon height growth over 12 weeks. (b) Graph of A. stolonifera height growth over 12 weeks. (c) Graph of S. argenteostriatus height growth over 12 weeks.
Applsci 12 00645 g004
Figure 5. Locations of treatments.
Applsci 12 00645 g005
Figure 6. Photographs of plant growth from week 1 to week 12.
Applsci 12 00645 g006
Figure 7. Graph of malondialdehyde concentrations. Note: Different normal letters indicate significant differences among treatments (p < 0.05).
Applsci 12 00645 g007
Figure 8. Graph of free proline concentrations. Note: Different normal letters indicate significant differences among treatments (p < 0.05).
Applsci 12 00645 g008
Figure 9. Graph of soluble protein concentrations. Note: Different normal letters indicate significant differences among treatments (p < 0.05).
Applsci 12 00645 g009
Figure 10. Graph of Chlorophyll concentrations. Note: Different normal letters indicate significant differences among treatments (p < 0.05).
Applsci 12 00645 g010
Figure 11. Graph of relative electrical conductivity. Note: Different normal letters indicate significant differences among treatments (p < 0.05).
Applsci 12 00645 g011
Figure 12. Distribution of the weights of different indexes in the first and second principal components in the SC group.
Applsci 12 00645 g012
Figure 13. Distribution of the weights of different indexes in the first and second principal components in the LC group.
Applsci 12 00645 g013
Figure 14. (a) Scree plot for the SC group (b) scree plot for the LC group.
Applsci 12 00645 g014
Table 1. Physical properties of Portland cement.
PropertiesValue
Sulfur trioxide content (%)1.07
Magnesium oxide content (%)2.36
Fineness (m2/kg)≥300
Loss on ignition (%)2.04
Setting timeInitial setting time200 min
Final setting time260 min
Compressive strength (MPa)3 days27
28 days51
Table 2. Chemical composition of the planting concrete additive (wt.%).
Composition.Nano-Calcium Carbonate
(Nano-CaCO3)
BiuretMethylenediureaTotal NitrogenWater
Ratio7.50.96.641.543.5
Table 3. Mix proportions of planting concrete (1 m3).
Mix Proportions
Group NumberAggregate Size (mm)Bulk Density of Aggregate (kg/m3)Amount of Cement (kg/m3)Water to Cement RatioAmount of Water (kg/m3)PC Additive Dose (kg/m3)PC Additive Dose (wt.% of Cement)
PC-S15–1015752150.3575.004.52%
PC-S215–2015552500.40100.005.0
Table 4. Void ratio, alkalinity, and mechanical properties.
Group NumberParticle Size (mm)28-d Average Strength (MPa)SDVoid Ratio (%)SDpH ValueSD
PC-S15–1013.71.0130.51.338.80.18
PC-S215–2011.30.9731.92.128.50.30
SD: standard deviation.
Table 5. Correlation coefficients between physical indexes and plant physiological indexes, n = 9 (Group SC).
Compressive StrengthAlkalinityVoid RatioMDAProRECSPChl
Compressive StrengthPearson Test1
Sig.
AlkalinityPearson Test0.0901
Sig.0.804
Void RatioPearson Test−0.010−0.757 *1
Sig.0.9790.011
MDAPearson Test0.2800.918 **−0.811 **1
Sig.0.4660.0000.008
ProPearson Test−0.2440.217−0.2340.0651
Sig.0.5270.5750.5450.869
RECPearson Test0.0840.869 **−0.857 **0.941 **0.3201
Sig.0.8300.0020.0030.0000.400
SPPearson Test0.1270.815 **−0.5940.802 **0.5270.861 **1
Sig.0.7450.0070.0920.0090.1450.003
ChlPearson Test0.1550.729 *−0.5470.711 *0.6130.800 **0.9690 **1
Sig.0.6910.0260.1280.0320.0790.0100.000
* Indicates a significant correlation at the 0.05 level (bilateral). ** Indicates a significant correlation at the 0.01 level (bilateral).
Table 6. Correlation coefficients between physical indexes and plant physiological indexes, n = 9 (Group LC).
Compressive StrengthAlkalinityVoid RatioMDAProRECSPChl
Compressive StrengthPearson Test1
Sig.
AlkalinityPearson Test−0.0611
Sig.0.868
Void RatioPearson Test−0.093−0.4041
Sig.0.7980.247
MDAPearson Test−0.1320.317−0.6661
Sig.0.7340.4060.050
ProPearson Test−0.028−0.0060.285−0.1291
Sig.0.9430.9870.4570.741
RECPearson Test−0.2010.290−0.6140.838 **−0.0161
Sig.0.6040.4490.0780.0050.966
SPPearson Test−0.1940.262−0.5860.952 **−0.0040.927 **1
Sig.0.6170.4950.0970.0000.9920.000
ChlPearson Test−0.1020.238−0.2830.720 *0.2790.824 **0.880 **1
Sig.0.7930.5380.4600.0290.4680.0060.002
* Indicates a significant correlation at the 0.05 level (bilateral), ** Indicates a significant correlation at the 0.01 level (bilateral).
Table 7. Composition of original and after-use soil.
TreatmentTP (g/kg)RA (%)TK (g/kg)RA (%)SOM (g/kg)RA (%)TN (g/kg)RA (%)AN (mg/kg)RA (%)pH Value
Original0.677 40.66 62.78 1.00 98.69 6.2
C. dactylonNC0.19671.018.1755.341.9133.20.8416.064.7834.37.6
SC0.20370.018.1355.432.9047.60.6733.061.5337.68.1
LC0.20869.217.3057.437.3040.10.6634.056.0443.27.8
A. stoloniferaNC0.19671.014.3764.632.9047.60.2674.020.4979.27.6
SC0.19371.414.4064.638.7738.20.8119.072.0127.07.9
LC0.19770.913.3067.241.7033.60.6535.061.1838.08.1
S. argenteostriatusNC0.18572.615.5756.838.3538.90.7426.064.7934.37.7
SC0.21368.516.3059.942.1232.90.8119.073.8425.17.8
LC0.19371.418.3754.841.2834.20.7327.076.9722.08.2
RA: Reduction amplitude (%), TP: Total phosphorus, TK: Total potassium, SOM: Soil organic matter, TN: Total nitrogen, AN: Alkali-hydrolysable nitrogen.
Publisher’s Note: MDPI stays neutral with regard to jurisdictional claims in published maps and institutional affiliations.

