
Determination of Business Intelligence and Analytics-Based Healthcare Facility Management Key Performance Indicators


Abstract
:1. Introduction
2. Background for Healthcare Facility Management KPIs
3. Business Intelligence and Analytics in Facility Management
- Data Mining: Data mining activities are performed to produce useful information from obtained data sources such as databases [46]. Data mining (DM) in the FM industry is essential to generate actionable information in the facility environment [47]. Ahmet et al. [3] and Fan et al. [15] stated that data mining activities can be classified under supervised learning and unsupervised learning. While supervised learning aims to produce predictions by using data, unsupervised learning is used in group identification and to discover new knowledge from historical data. Ioannidis et al. [46] and Yafooz et al. [43] mentioned five commonly used DM categories; “anomaly detection/outlier detection, association rule learning, clustering analysis, classification analysis, and regression analysis”. In anomaly detection, the outliers are identified by comparing expected patterns. In association rule learning, the relationship between variables is discovered within the large database. In clustering analysis, similar objects are grouped under the same group. In the classification group, observations are categorized by considering trained models. In regression analysis, the relationship between variables is discovered. However, the size of variables and data volume is, respectively, very small against association rule learning. In the DM activities, the DM models are used to reveal the mathematical relationship between observed factors. These DM models are trained with historical data and predictions for similar problems are revealed [47]. Historical data also help to improve and optimize operations in the facility.
- Visual Analytics: Visual analytics such as histograms can be used in data exploration [48]. Visual analytics combine analysis techniques with visualization tools. Therefore, the understanding and reasoning processes of decision-makers are easy and effective with the utilization of visual analytics [49]. Visual analytics contain informative answers for “what is happening”, “what happened” and “what will happen” [45]. Ioannidis et al. [46] identified nine visualization techniques from literature; “1D to 3D graphics, geometric techniques, pixel oriented techniques, iconographic techniques, topic-based methods, feature-based methods, graph layout techniques, clutter reduction methods, and combinations”. The authors expressed that the visualization techniques allow users to explore data more effectively and efficiently than DM results, which are very complex to infer information from for facility managers.
- Text Mining: Text mining activities are frequently used on maintenance records because maintenance-related tasks are heavily based on text-based inspection reports, maintenance reports, and historical data [49]. The most significant difference of text mining activities from data mining activities is that unstructured data (text, speeches, etc.) are handled in text mining activities. Afterward, the text is converted into numeric attributes that enable the processing of text in data mining activities [13]. In the second step, the clustering activity is performed. Therefore, FM components, which are investigated in data mining, are identified. In the last step, associated words are selected [10]. After that, a more detailed analysis can be performed on retrieved data [50]. Naïve Bayes, decision tree, logistic regression, and support vector machine can be used in text mining [50].
- Big Data Analytics: Big data analytics (BDA) is another BI&A term that enables one to analyze variability and its root causes from datasets [11]. With the application of IoT and smart meter devices in building environments, data obtained from these real-time data sources increase the necessity for the BDA applications [51]. BDA is used if the data have features like enormous volume, variety, and velocity. In other words, when datasets are difficult to manage with existing technologies, the creation, organization, analysis, and visualization of a dataset is called big data [52]. The success of BDA comes from the capability of processing structured, unstructured, and semi-structured data [53]. FM is one of the BDA areas in which BDA helps to analyze data obtained from FM systems to render possible effective management [11]. BDA is a more comprehensive approach. It involves “Databases, Knowledge Discovery in Databases, Data Mining” and “text mining”. It also has an intersection with “Statistics, Pattern Recognition, Machine Learning, Artificial Intelligence, and Computational Neuroscience” [54,55]. The use of BDA in the smart energy meter enables identification of energy-saving and potential savings, estimation of costs, and pattern recognition [56].
Identification of Information Requirements of FM Key Performance Indicators (KPIs)
4. Research Methodology
- Time: Depending on aging population and population growth, demands for healthcare services have increased [63]. Therefore, the length of patient care has decreased. Moreover, uninterrupted service in healthcare facilities is important, since services such as surgery activities can be interrupted or postponed [64,65].
- Cost: Operational expenditure is five times more costly than capital expenditure [66,67]. Lavy and Shohet [68] stated that hospitals are under financial pressures and one-third of hospitals have negative margins. Accordingly, FM budgets have been cut in hospitals. Therefore, cost criteria are important to decide activities that are performed in healthcare FM.
- Quality: Patients are susceptible to indoor conditions in healthcare facilities. Therefore, patient curing quality needs to be handled with FM services quality [69]; patient preference for healthcare facilities is affected by FM quality.
4.1. Identification of FM Key Performance Indicators (KPIs)
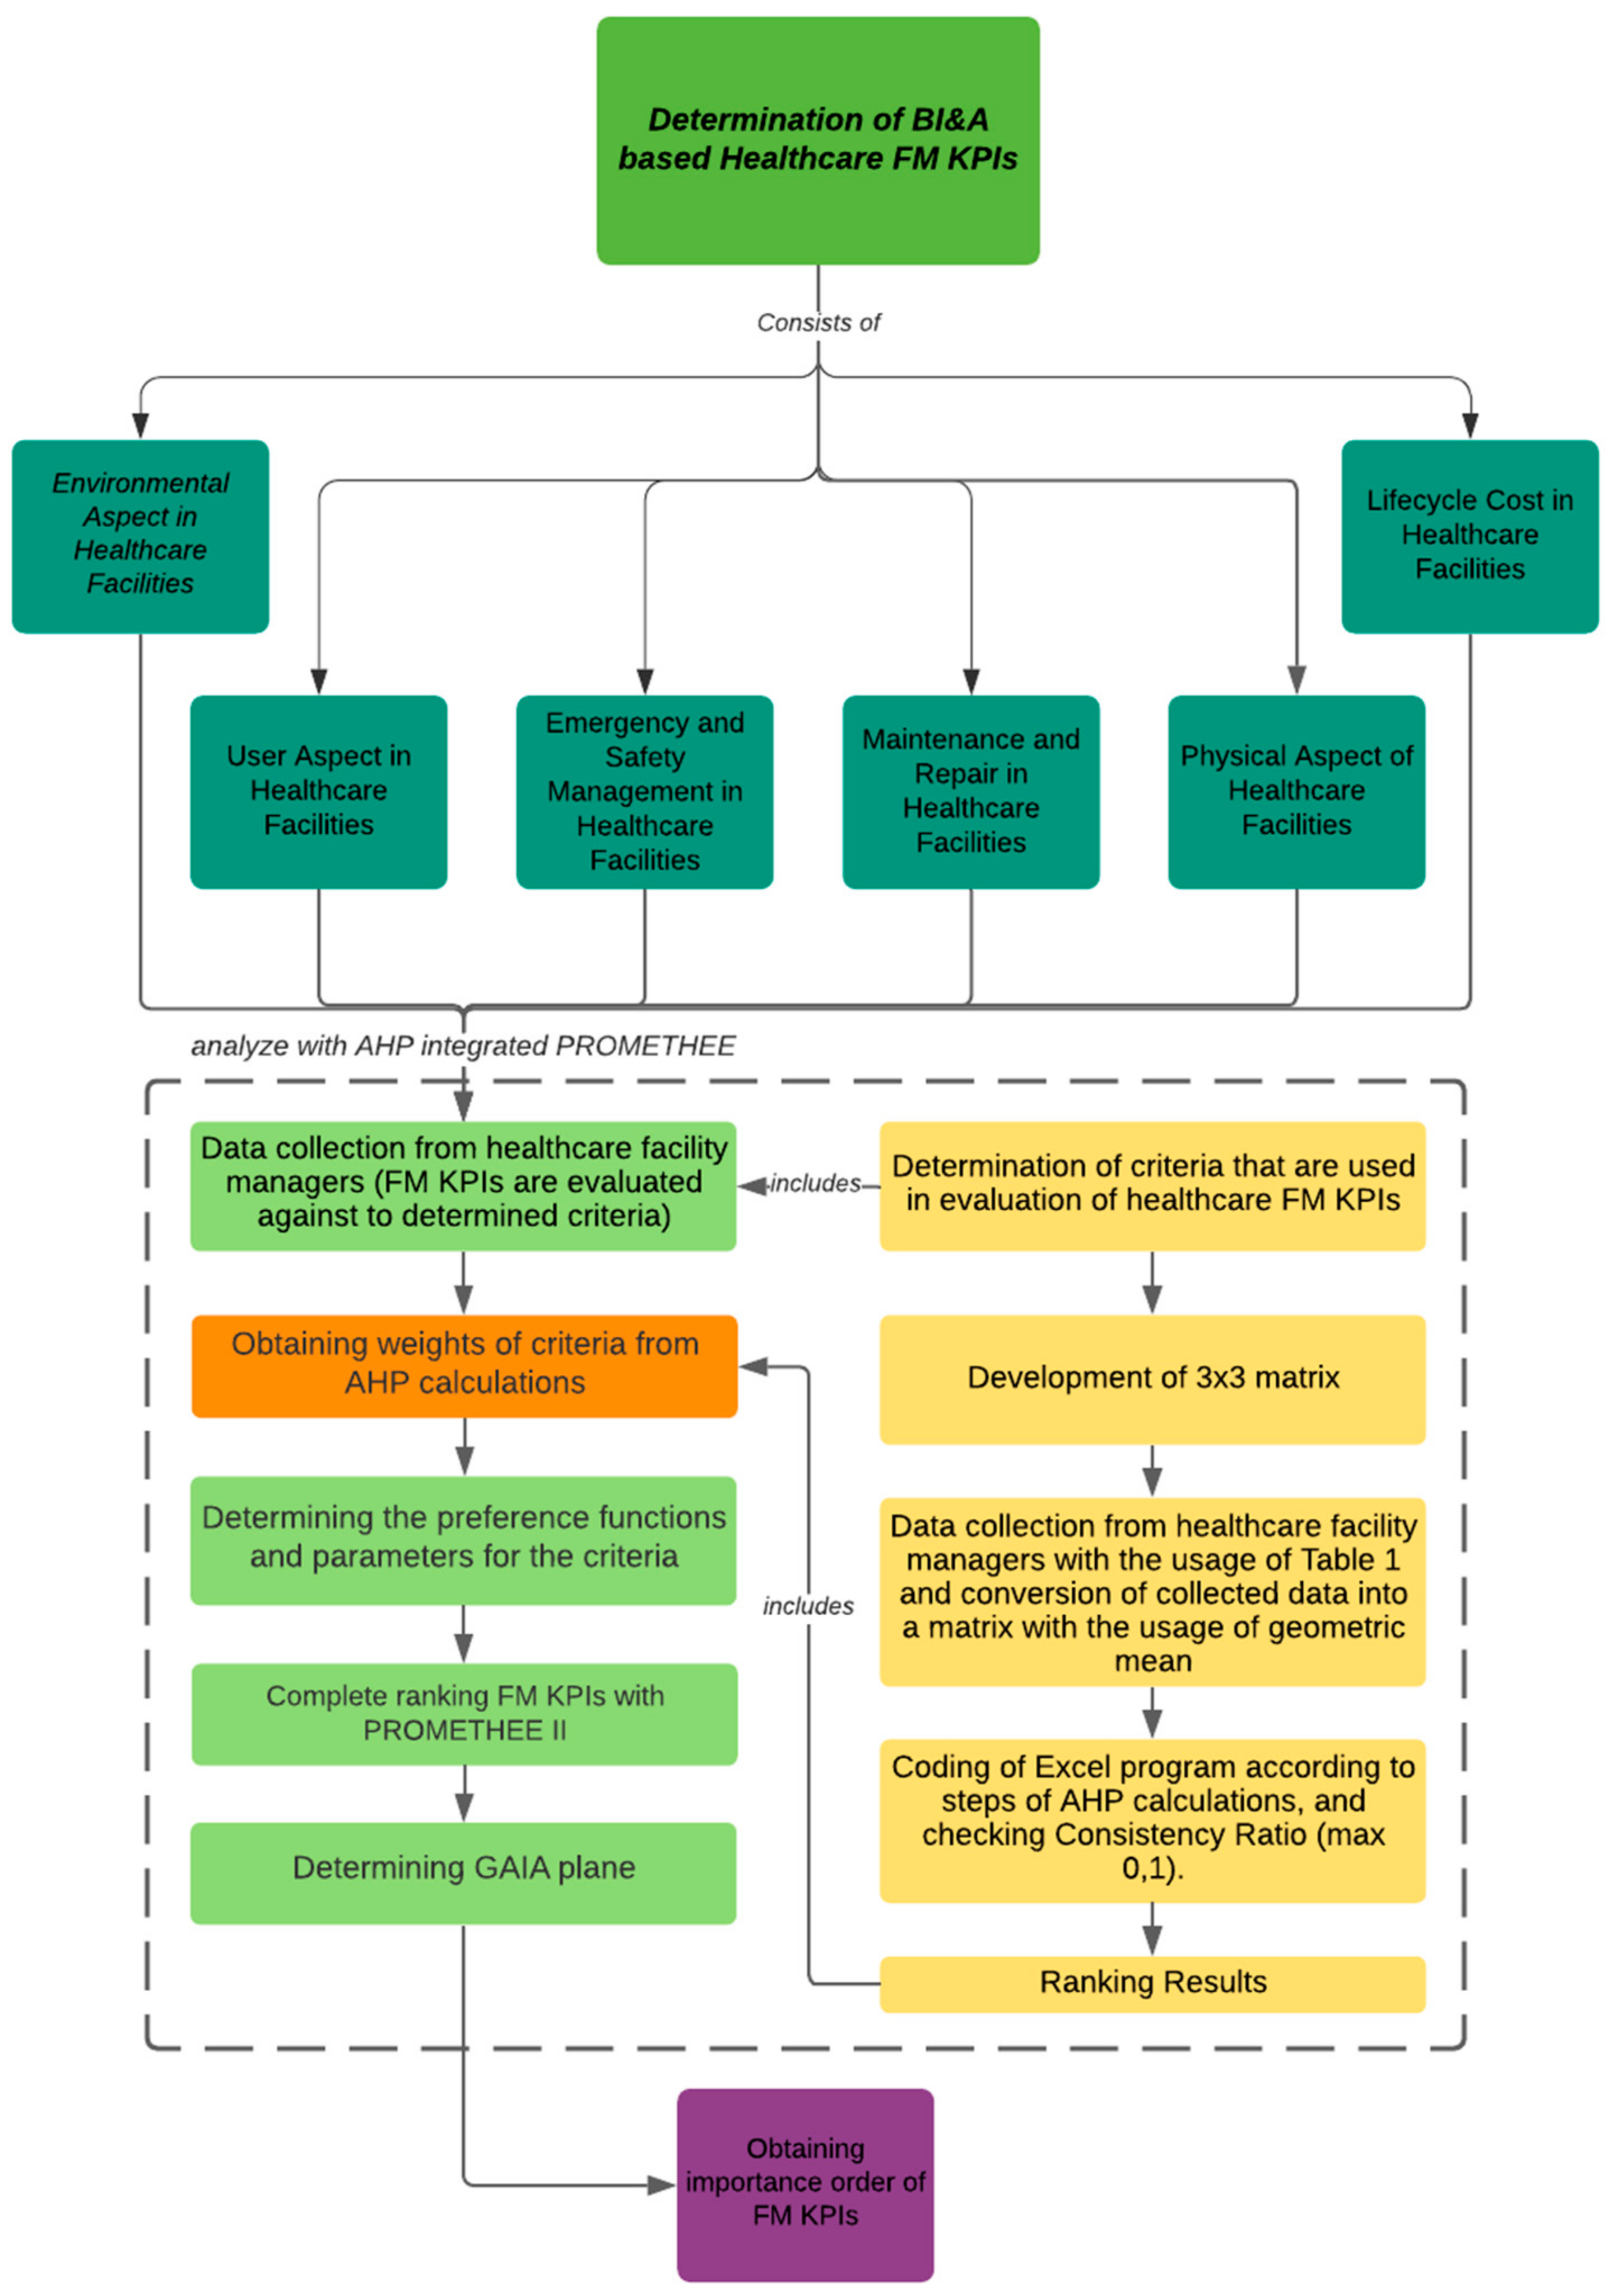
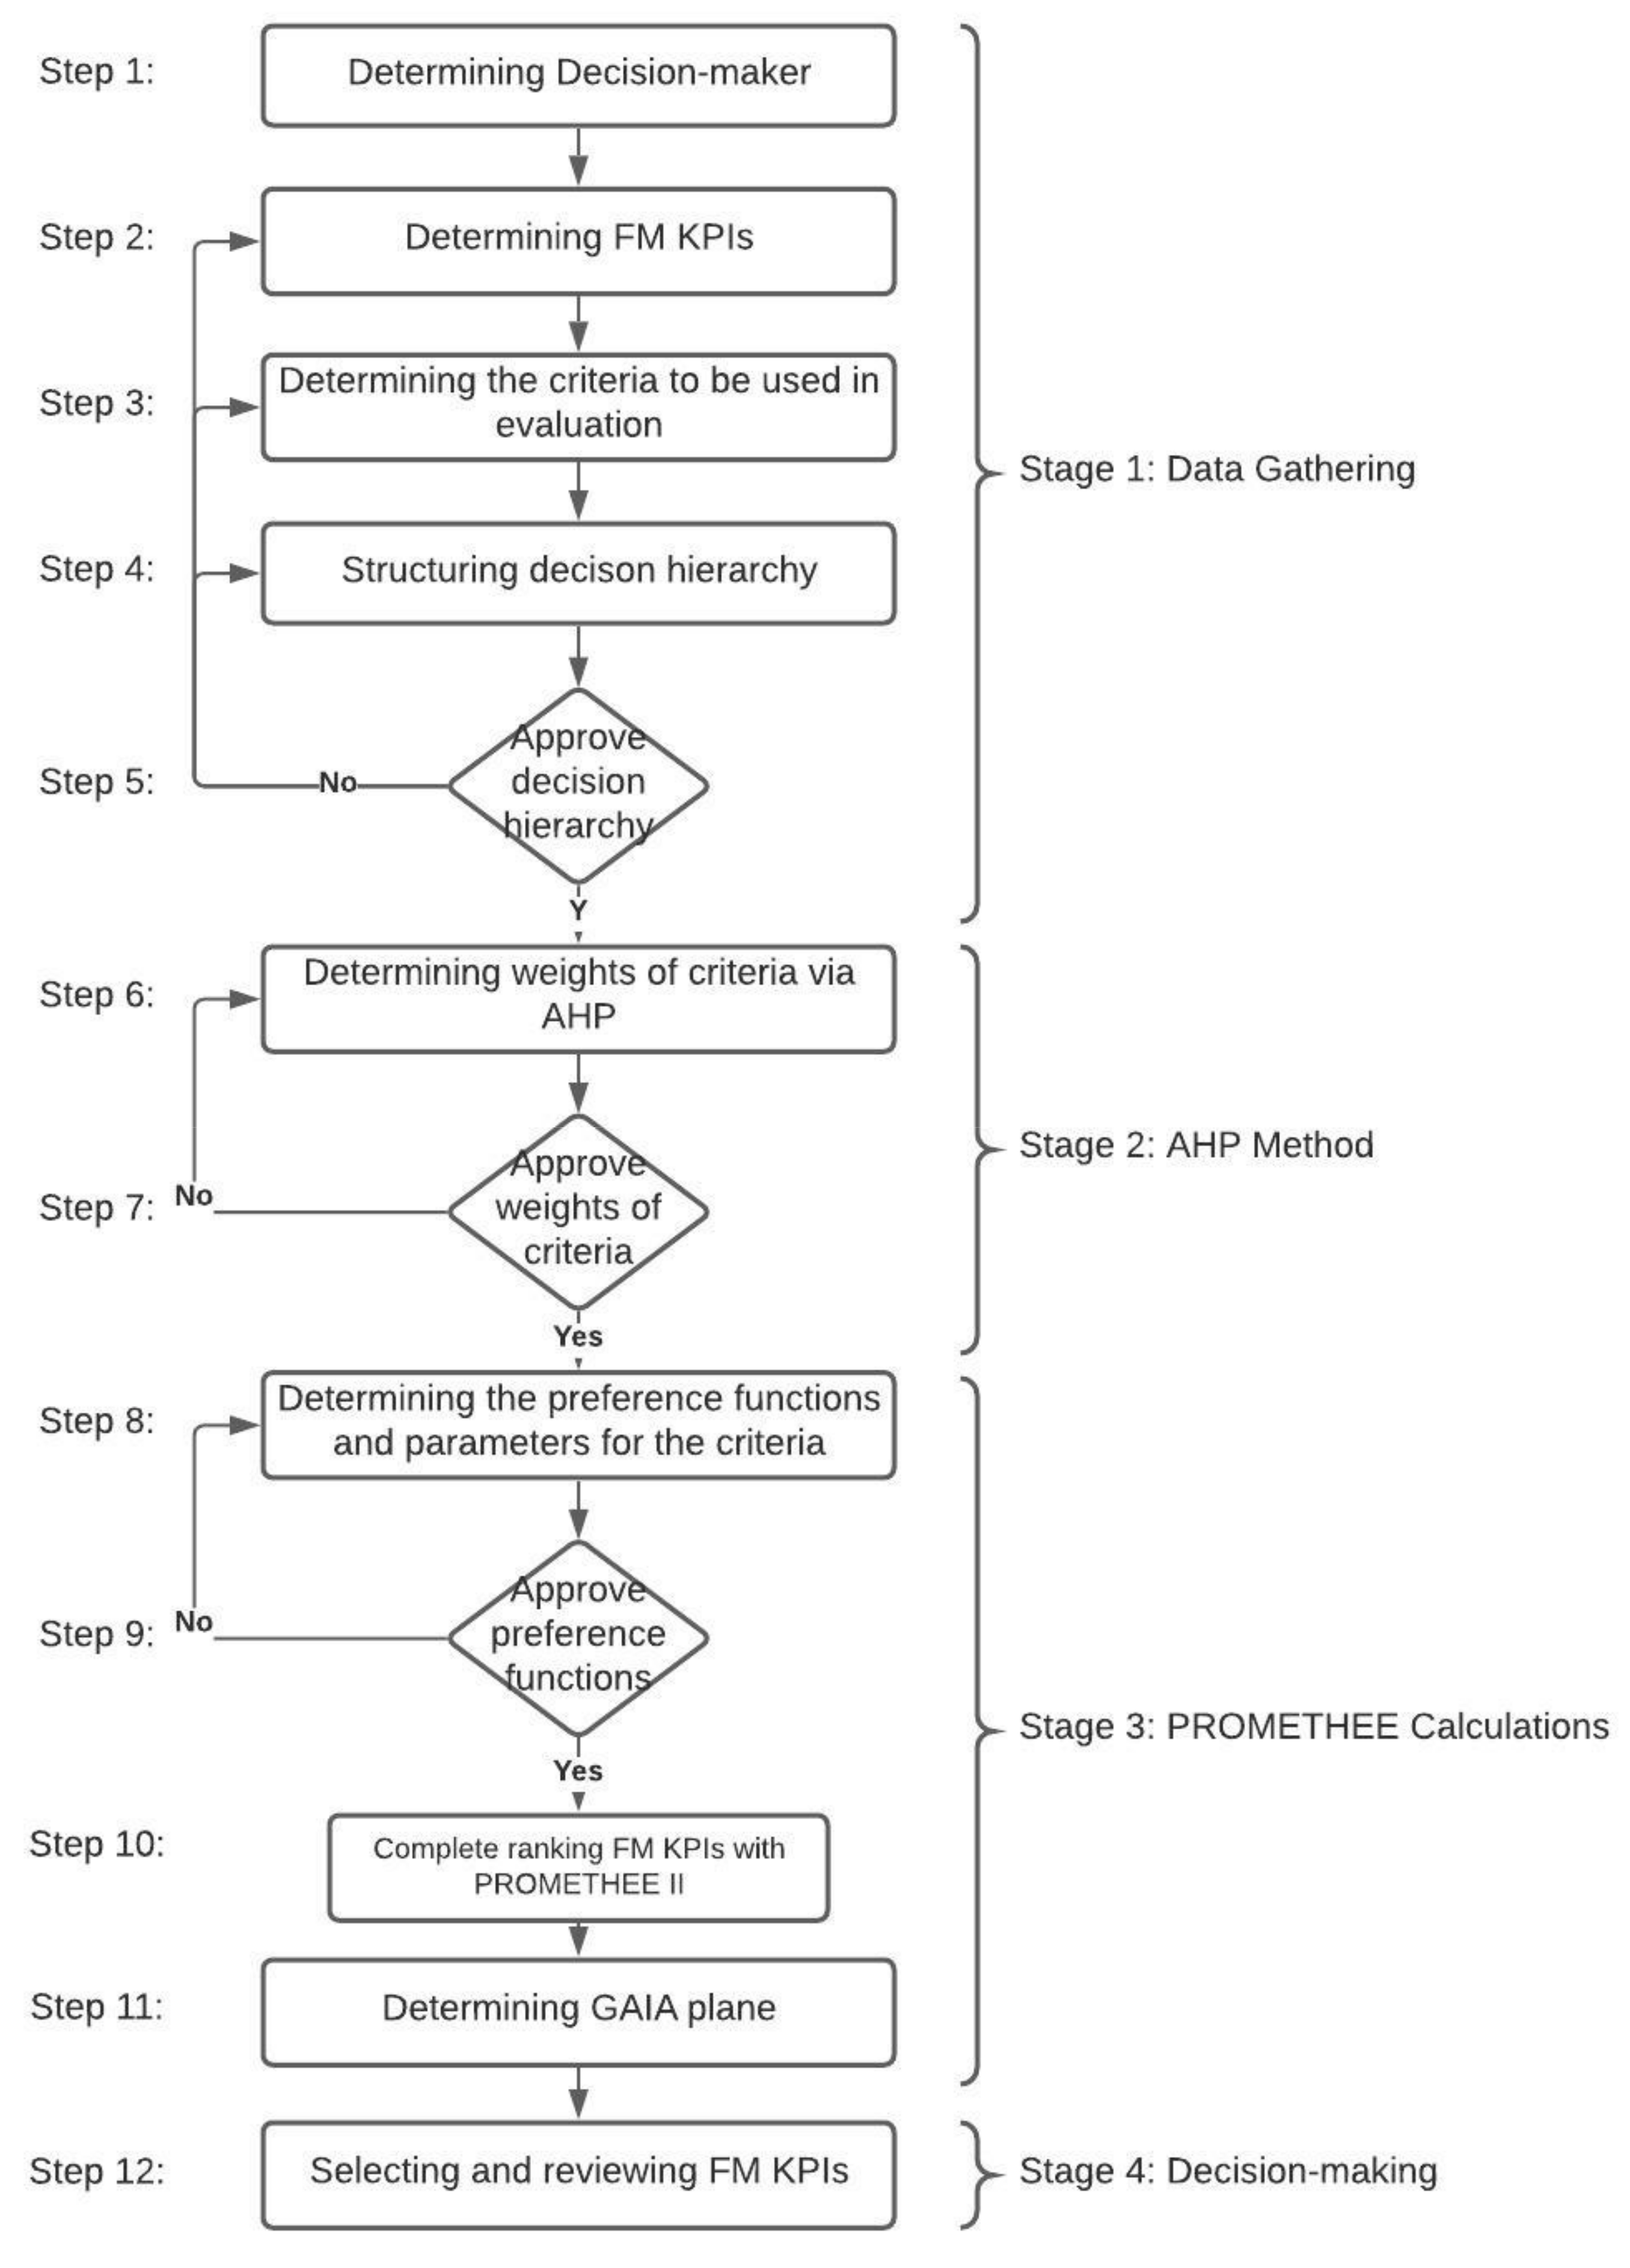
4.2. Analysis and Results
- Environmental Aspect in Healthcare Facilities: After usability analysis with responders, “Resource/Energy consumption with respect to geographical location”, “Resource/Energy consumption with respect to weather condition”, “Resource/Energy consumption with respect to the number of hospital discharges”, “Resource/Energy consumption with respect to user behavior”, “Resource/Energy consumption with respect to occupancy schedule”, “Resource/Energy consumption in emergency condition”, “Resource/Energy consumption with respect to user profile”, “Prediction of Resource/Energy consumption by considering occupant comfort”, “Resource/Energy optimization ratio by considering occupant comfort”, “Resource/Energy optimization ratio by considering indoor daylight”, “Resource/Energy optimization ratio by considering occupancy schedule”, “Resource/Energy optimization ratio by considering control strategies”, “Identification of parameters having an impact on system or equipment load”, “Percentage of the estate with an energy consumption of 410 kWh per area or less”, and “Measurement of exergy” were eliminated, since they were not found important. Therefore, thirteen indicators were identified.
- User Aspect in Healthcare Facilities: As a result of usability analysis, “Predictive patient/worker complaint’s frequencies”, “Indoor environmental quality”, “Temporal distribution of complaints”, “Aural comfort”, “Recognition of patient/worker behavior pattern”, “Utilization index”, “Predictive space occupancy schedule”, and “Occupancy/density coefficients” indicators were eliminated. Therefore, eighteen indicators were used in the analysis.
- Emergency and Safety Management in Healthcare Facilities: Usability analysis showed that, “Number of legal cases per year”, “Percentage of the estate that is required to take action with the current plan to comply with relevant guidance and statutory requirements”, “Amount of compensation paid per year”, “Number of detection of trapped victims”, “Identification of emergency rate”, “Number of false fire incidents calls per gross internal area (GIA)”, “Number of usage of historical data for the solution of health and safety incidents”, “Overall percentage compliance score from Statutory Compliance Audit and Risk Tool”, and “Number of compensation cases per year” are not important for Turkish healthcare facility management.
- Maintenance and Repair in Healthcare Facilities: As a result of literature analysis, forty-three indicators were identified. However, usability analysis showed that “Predicted maintenance ratio”, “Percentage/Number of condition-based maintenance work”, “Number of man hours per capacity of installation”, “Urgent repair request index”, “Predicted maintenance time”, “Percentage compliance with required response time”, “Number of deferred maintenances”, “Significant and high risk backlog maintenance as percentage of total backlog expenditure requirement”, “Total risk adjusted backlog maintenance”, “Maintenance overtime”, “Failure/Breakdown frequency”, “Mean time to repair”, “Number of work orders depending on healthcare service, system and equipment level”, “Fault pattern analysis”, “Identification of impact of maintenance and faults on energy consumption (filters, fans, pumps, cooling tower, chillers, boilers, thermostats)”, “Managerial span of control”, “Identification and prediction of maintenance cycle”, “Number of preventive maintenance depending on comparison of real energy consumption with simulation results”, and “Sustain rate” are not important for Turkish healthcare facility management performance measurement.
- Physical Aspect of Healthcare Facilities: Usability analysis showed that “Identification of usage pattern of system-equipment in the facility”, “Physical condition change rate for facility”, “Percentage of properties less than 50 years”, and “Age coefficient” indicators are found to be unusable for Turkish healthcare facility management.
- Lifecycle Cost in Healthcare Facilities: As a result of the literature review, forty-three KPIs were identified for lifecycle cost in Turkish healthcare facilities. However, “Equipment replacement value”, “Maintenance stock turnover”, “O&M cost per capacity of installation”, “Cost of equipment added or replaced”, “Custodial and janitorial cost”, “Maintenance cost index”, “Normalized annual maintenance expenditure”, “Replacement efficiency index”, “Prediction of maintenance costs”, “Prediction of operational costs”, “Rates cost”, “Pottering cost per consumer week”, “Laundry and linen cost per consumer week”, and “Waste cost per consumer week” were found to be unusable as a result of usability analysis.
- Approximately 8% data loss for environmental aspect FM KPIs,
- Approximately 21% data loss for user aspect FM KPIs,
- Approximately 9% data loss for emergency and safety management FM KPIs,
- Approximately 9% data loss for maintenance and repair FM KPIs,
- Approximately 2% data loss for physical aspect, and
- Approximately 17% data loss for lifecycle cost management.
5. Discussion
6. Conclusions
Author Contributions
Funding
Institutional Review Board Statement
Informed Consent Statement
Data Availability Statement
Conflicts of Interest
References
- Torres, R.; Sidorova, A.; Jones, M.C. Enabling firm performance through business intelligence and analytics: A dynamic capabilities perspective. Inf. Manag. 2018, 55, 822–839. [Google Scholar] [CrossRef]
- Božič, K.; Dimovski, V. Business intelligence and analytics for value creation: The role of absorptive capacity. Int. J. Inf. Manag. 2019, 46, 93–103. [Google Scholar] [CrossRef]
- Ahmed, V.; Aziz, Z.; Tezel, A.; Riaz, Z. Challenges and drivers for data mining in the AEC sector. Eng. Constr. Archit. Manag. 2018, 25, 1436–1453. [Google Scholar] [CrossRef]
- Gawin, B.; Marcinkowski, B. Business Intelligence in Facility Management: Determinants and Benchmarking Scenarios for Improving Energy Efficiency. Inf. Syst. Manag. 2017, 34, 347–358. [Google Scholar] [CrossRef]
- Liu, R.; Issa, R.R.A. Survey: Common Knowledge in BIM for Facility Maintenance. J. Perform. Constr. Facil. 2015, 30, 04015033. [Google Scholar] [CrossRef]
- Kim, E.; Park, S. Three-dimensional visualized space and asset management system for large-scale airports: The case of Incheon International Airport. Int. J. Archit. Comput. 2016, 14, 233–246. [Google Scholar] [CrossRef]
- Hwang, J.K.; Yun, G.Y.; Lee, S.H.; Seo, H.; Santamouris, M. Using deep learning approaches with variable selection process to predict the energy performance of a heating and cooling system. Renew. Energy 2019, 149, 1227–1245. [Google Scholar] [CrossRef]
- Zou, Z.; Yu, X.; Ergan, S. Towards optimal control of air handling units using deep reinforcement learning and recurrent neural network. Build. Environ. 2020, 168, 106535. [Google Scholar] [CrossRef]
- O’Neill, Z.; Pang, X.; Shashanka, M.; Haves, P.; Bailey, T. Model-based real-time whole building energy performance monitoring and diagnostics. J. Build. Perform. Simul. 2014, 7, 83–99. [Google Scholar] [CrossRef]
- Gunay, H.B.; Shen, W.; Yang, C. Text-mining building maintenance work orders for component fault frequency. Build. Res. Inf. 2019, 47, 518–533. [Google Scholar] [CrossRef]
- Mawed, M.; Aal-Hajj, A. Using big data to improve the performance management: A case study from the UAE FM industry. Facilities 2017, 35, 746–765. [Google Scholar] [CrossRef]
- Becerik-Gerber, B.; Jazizadeh, F.; Li, N.; Calis, G. Application Areas and Data Requirements for BIM-Enabled Facilities Management. J. Constr. Eng. Manag. 2011, 138, 431–442. [Google Scholar] [CrossRef]
- Bortolini, R.; Forcada, N. Analysis of building maintenance requests using a text mining approach: Building services evaluation. Build. Res. Inf. 2020, 48, 207–217. [Google Scholar] [CrossRef]
- Pärn, E.A.; Edwards, D.J.; Sing, M.C.P. The building information modelling trajectory in facilities management: A review. Autom. Constr. 2017, 75, 45–55. [Google Scholar] [CrossRef] [Green Version]
- Fan, C.; Xiao, F.; Li, Z.; Wang, J. Unsupervised data analytics in mining big building operational data for energy efficiency enhancement: A review. Energy Build. 2018, 159, 296–308. [Google Scholar] [CrossRef]
- Ciribini, A.L.C.; Pasini, D.; Tagliabue, L.C.; Manfren, M.; Daniotti, B.; Rinaldi, S.; De Angelis, E. Tracking Users’ Behaviors through Real-time Information in BIMs: Workflow for Interconnection in the Brescia Smart Campus Demonstrator. In Procedia Engineering; Elsevier Ltd.: Sydney, Australia, 2017; Volume 180, pp. 1484–1494. [Google Scholar] [CrossRef]
- Burak Gunay, H.; Shen, W.; Newsham, G. Data analytics to improve building performance: A critical review. Autom. Constr. 2019, 97, 96–109. [Google Scholar] [CrossRef]
- Hu, Z.Z.; Zhang, J.P.; Yu, F.Q.; Tian, P.L.; Xiang, X.S. Construction and facility management of large MEP projects using a multi-Scale building information model. Adv. Eng. Softw. 2016, 100, 215–230. [Google Scholar] [CrossRef]
- Hopland, A.O.; Kvamsdal, S. On the ranking of critical success factors: The role of cost efficiency and score uncertainty for public facilities management. J. Facil. Manag. 2018, 16, 1472–5967. [Google Scholar] [CrossRef]
- Kang, T.W.; Choi, H.S. BIM perspective definition metadata for interworking facility management data. Adv. Eng. Inform. 2015, 29, 958–970. [Google Scholar] [CrossRef]
- Gerrish, T.; Ruikar, K.; Cook, M.; Johnson, M.; Phillip, M. Using BIM capabilities to improve existing building energy modelling practices. Eng. Constr. Archit. Manag. 2017, 24, 190–208. [Google Scholar] [CrossRef] [Green Version]
- Dong, B.; O’Neill, Z.; Li, Z. A BIM-enabled information infrastructure for building energy Fault Detection and Diagnostics. Autom. Constr. 2014, 44, 197–211. [Google Scholar] [CrossRef]
- Cavalheiro, J.; Carreira, P. A multidimensional data model design for building energy management. Adv. Eng. Inform. 2016, 30, 619–632. [Google Scholar] [CrossRef]
- Peng, Y.; Lin, J.R.; Zhang, J.P.; Hu, Z.Z. A hybrid data mining approach on BIM-based building operation and maintenance. Build. Environ. 2017, 126, 483–495. [Google Scholar] [CrossRef]
- Srivastava, C.; Yang, Z.; Jain, R.K. Understanding the adoption and usage of data analytics and simulation among building energy management professionals: A nationwide survey. Build. Environ. 2019, 157, 139–164. [Google Scholar] [CrossRef]
- Yu, X.; Ergan, S.; Dedemen, G. A data-driven approach to extract operational signatures of HVAC systems and analyze impact on electricity consumption. Appl. Energy 2019, 253, 113497. [Google Scholar] [CrossRef]
- McGlinn, K.; Yuce, B.; Wicaksono, H.; Howell, S.; Rezgui, Y. Usability evaluation of a web-based tool for supporting holistic building energy management. Autom. Constr. 2017, 84, 154–165. [Google Scholar] [CrossRef] [Green Version]
- Lavy, S.; Garcia, J.A.; Scinto, P.; Dixit, M.K. Key performance indicators for facility performance assessment: Simulation of core indicators. Constr. Manag. Econ. 2014, 32, 1183–1204. [Google Scholar] [CrossRef]
- Dutta, S.; Burak Gunay, H.; Bucking, S. A method for extracting performance metrics using work-order data. Sci. Technol. Built Environ. 2020, 26, 414–425. [Google Scholar] [CrossRef]
- Lavy, S.; Garcia, J.A.; Dixit, M.K. Establishment of KPIs for facility performance measurement: Review of literature. Facilities 2010, 28, 440–464. [Google Scholar] [CrossRef] [Green Version]
- Shohet, I.M.; Lavy, S. Facility maintenance and management: A health care case study. Int. J. Strateg. Prop. Manag. 2017, 21, 170–182. [Google Scholar] [CrossRef]
- Wright, S.; Edwards, N. Investing in hospitals of the future. Eur. Obs. Health Syst. Policies 2009, 16, 1–200. [Google Scholar] [CrossRef]
- Lavy, S.; Garcia, J.A.; Dixit, M.K. KPIs for facility’s performance assessment, Part I: Identification and categorization of core indicators. Facilities 2014, 32, 256–274. [Google Scholar] [CrossRef]
- Lavy, S.; Garcia, J.A.; Dixit, M.K. KPIs for facility’s performance assessment, Part II: Identification of variables and deriving expressions for core indicators. Facilities 2014, 32, 275–294. [Google Scholar] [CrossRef] [Green Version]
- Lai, J.; Yuen, P.L. Performance evaluation for hospital facility management: Literature review and a research methodology. J. Facil. Manag. Educ. Res. 2019, 3, 38–43. [Google Scholar] [CrossRef]
- Róka-Madarász, L.; Mályusz, L.; Tuczai, P. Benchmarking facilities operation and maintenance management using CAFM database: Data analysis and new results. J. Build. Eng. 2016, 6, 184–195. [Google Scholar] [CrossRef]
- Talib, Y.; Rajagopalan, P.; Yang, R.J. Evaluation of building performance for strategic facilities management in healthcare: A case study of a public hospital in Australia. Facilities 2013, 31, 681–701. [Google Scholar] [CrossRef] [Green Version]
- Shohet, I.M. Key Performance Indicators for Strategic Healthcare Facilities Maintenance. J. Constr. Eng. Manag. 2006, 132, 345–352. [Google Scholar] [CrossRef]
- Lai, J.; Hou, C.; Chiu, B.; Edwards, D.; Yuen, P.L.; Sing, M.; Wong, P. Importance of hospital facilities management performance indicators: Building practitioners’ perspectives. J. Build. Eng. 2021, 45, 103428. [Google Scholar] [CrossRef]
- Wang, H.; Meng, X. Transformation from IT-based knowledge management into BIM-supported knowledge management: A literature review. Expert Syst. Appl. 2019, 121, 170–187. [Google Scholar] [CrossRef] [Green Version]
- Diong, B.; Zheng, G.; Ginn, M. Establishing the foundation for energy management on university campuses via data analytics. In Conference Proceedings of the—IEEE SOUTHEASTCON; Institute of Electrical and Electronics Engineers Inc.: Fort Lauderdale, FL, USA, 9–12 April, 2015. [Google Scholar] [CrossRef]
- Lim, E.P.; Chen, H.; Chen, G. Business intelligence and analytics: Research directions. ACM Trans. Manag. Inf. Syst. 2013, 3, 1–10. [Google Scholar] [CrossRef]
- Rouse, M. What is Data Analytics?—Definition from WhatIs.com, (n.d.). Available online: https://searchdatamanagement.techtarget.com/definition/data-analytics (accessed on 14 April 2020).
- Yafooz, W.M.S.; Binti, Z.; Bakar, A.; Fahad, S.A.; Mithun, A.M. Business Intelligence through Big Data Analytics, Data Mining and Machine Learning. In Data Management, Analytics and Innovation; Springer: Singapore, 2019; pp. 217–230. [Google Scholar] [CrossRef] [Green Version]
- Sharda, R.; Delen, D.; Turban, E. Business Intelligence and Analytics Systems for Decision Support, 10th ed.; Pearson: London, UK, 2015; pp. 1–686. [Google Scholar] [CrossRef]
- Ioannidis, D.; Tropios, P.; Krinidis, S.; Stavropoulos, G.; Tzovaras, D.; Likothanasis, S. Occupancy driven building performance assessment. J. Innov. Digit. Ecosyst. 2016, 3, 57–69. [Google Scholar] [CrossRef] [Green Version]
- Ahmed, A.; Korres, N.E.; Ploennigs, J.; Elhadi, H.; Menzel, K. Mining building performance data for energy-efficient operation. Adv. Eng. Inform. 2011, 25, 341–354. [Google Scholar] [CrossRef]
- Reffat, R.; Gero, J.; Peng, W. Using Data Mining Techniques for Improving Building Life Cycle; CRC for Construction Innovation: Brisbane, Australia, 2003. [Google Scholar]
- Motamedi, A.; Hammad, A.; Asen, Y. Knowledge-assisted BIM-based visual analytics for failure root cause detection in facilities management. Autom. Constr. 2014, 43, 73–83. [Google Scholar] [CrossRef]
- Mo, Y.; Zhao, D.; Syal, M.; Aziz, A. Construction Work Plan Prediction for Facility Management Using Text Mining; American Society of Civil Engineers (ASCE) International Workshop on Computing in Civil Engineering: Seattle, WA, USA, 2017; pp. 92–100. [Google Scholar] [CrossRef]
- Bashir, M.R.; Gill, A.Q. Towards an IoT big data analytics framework: Smart buildings systems. In Proceedings of the 2016 IEEE 18th International Conference on High Performance Computing and Communications; IEEE 14th International Conference on Smart City; IEEE 2nd International Conference on Data Science and Systems (HPCC/SmartCity/DSS), Sydney, Australia, 12–14 December 2016; pp. 1325–1332. [Google Scholar] [CrossRef]
- Philip Chen, C.L.; Zhang, C.Y. Data-intensive applications, challenges, techniques and technologies: A survey on Big Data. Inf. Sci. 2014, 275, 314–347. [Google Scholar] [CrossRef]
- Ip, R.H.L.; Ang, L.M.; Seng, K.P.; Broster, J.C.; Pratley, J.E. Big data and machine learning for crop protection. Comput. Electron. Agric. 2018, 151, 376–383. [Google Scholar] [CrossRef]
- Bilal, M.; Oyedele, L.O.; Qadir, J.; Munir, K.; Ajayi, S.O.; Akinade, O.O.; Owolabi, H.A.; Alaka, H.A.; Pasha, M. Big Data in the construction industry: A review of present status, opportunities, and future trends. Adv. Eng. Inform. 2016, 30, 500–521. [Google Scholar] [CrossRef]
- Hassani, H.; Beneki, C.; Unger, S.; Mazinani, M.T.; Yeganegi, M.R. Text Mining in Big Data Analytics. Big Data Cogn. Comput. 2020, 4, 1. [Google Scholar] [CrossRef] [Green Version]
- Grolinger, K.; L’Heureux, A.; Capretz, M.A.M.; Seewald, L. Energy forecasting for event venues: Big data and prediction accuracy. Energy Build. 2016, 112, 222–233. [Google Scholar] [CrossRef] [Green Version]
- Farghaly, K.; Abanda, F.H.; Vidalakis, C.; Wood, G. Taxonomy for BIM and Asset Management Semantic Interoperability. J. Manag. Eng. 2018, 34, 04018012. [Google Scholar] [CrossRef] [Green Version]
- Demirdöğen, G.; ISIK, Z.; Arayici, Y. Facility Management Information Taxonomy Framework for Queries in Healthcare Buildings. J. Build. Eng. 2021, 102510. [Google Scholar] [CrossRef]
- Dagdeviren, M. Decision making in equipment selection: An integrated approach with AHP and PROMETHEE. J. Intell. Manuf. 2008, 19, 397–406. [Google Scholar] [CrossRef]
- Macharis, C.; Springael, J.; De Brucker, K.; Verbeke, A. PROMETHEE and AHP: The design of operational synergies in multicriteria analysis.: Strengthening PROMETHEE with ideas of AHP. Eur. J. Oper. Res. 2004, 153, 307–317. [Google Scholar] [CrossRef]
- Turcksin, L.; Bernardini, A.; Macharis, C. A combined AHP-PROMETHEE approach for selecting the most appropriate policy scenario to stimulate a clean vehicle fleet. Procedia Soc. Behav. Sci. 2011, 20, 954–965. [Google Scholar] [CrossRef] [Green Version]
- Saaty, R.W. The analytic hierarchy process-what it is and how it is used. Math. Model. 1987, 9, 161–176. [Google Scholar] [CrossRef] [Green Version]
- Brans, J.P.; Mareschal, B. How to select and how to rank projects: The PROMETHEE method. Eur. J. Oper. Res. 1986, 24, 228–238. [Google Scholar] [CrossRef]
- Lennerts, K.; Abel, J.; Pfründer, U.; Sharma, V. Step-by-step process analysis for hospital facility management: An insight into the OPIK research project. Facilities 2005, 23, 164–175. [Google Scholar] [CrossRef]
- Lucas, J.; Bulbul, T.; Thabet, W. An object-oriented model to support healthcare facility information management. Autom. Constr. 2013, 31, 281–291. [Google Scholar] [CrossRef]
- Edirisinghe, R.; London, K.A.; Kalutara, P.; Aranda-Mena, G. Building information modelling for facility management: Are we there yet? Eng. Constr. Archit. Manag. 2017, 24, 1119–1154. [Google Scholar] [CrossRef]
- Koch, C.; Neges, M.; König, M.; Abramovici, M. Natural markers for augmented reality-based indoor navigation and facility maintenance. Autom. Constr. 2014, 48, 18–30. [Google Scholar] [CrossRef]
- Lavy, S.; Shohet, I.M. Computer-aided healthcare facility management. J. Comput. Civ. Eng. 2007, 21, 363–372. [Google Scholar] [CrossRef] [Green Version]
- Tang, S.; Shelden, D.R.; Eastman, C.M.; Pishdad-Bozorgi, P.; Gao, X. A review of building information modeling (BIM) and the internet of things (IoT) devices integration: Present status and future trends. Autom. Constr. 2019, 101, 127–139. [Google Scholar] [CrossRef]
- Cavallaro, F. An Integrated Multi-Criteria System to Assess Sustainable Energy Options: An Application of the Promethee Method IEM-International Energy Markets. 2005. Available online: http://ssrn.com/abstract=666741 (accessed on 31 August 2020).
- Genç, D. PROMETHEE Yöntemi ve GAIA Düzlemi. IIBF Derg. 2013, 15, 133–154. Available online: https://dergipark.org.tr/tr/pub/akuiibfd/issue/1619/20284 (accessed on 1 December 2021).
- PROMETHEE & GAIA Software, (n.d.). Available online: http://www.promethee-gaia.net/vpa.html (accessed on 3 September 2020).
- Capozzoli, A.; Piscitelli, M.S.; Gorrino, A.; Ballarini, I.; Corrado, V. Data analytics for occupancy pattern learning to reduce the energy consumption of HVAC systems in office buildings. Sustain. Cities Soc. 2017, 35, 191–208. [Google Scholar] [CrossRef]
- Costa, A.; Keane, M.M.; Torrens, J.I.; Corry, E. Building operation and energy performance: Monitoring, analysis and optimisation toolkit. Appl. Energy 2013, 101, 310–316. [Google Scholar] [CrossRef]
- Woo, J.-H.; Peterson, M.A.; Gleason, B. Developing a Virtual Campus Model in an Interactive Game-Engine Environment for Building Energy Benchmarking. J. Comput. Civ. Eng. 2016, 30, C4016005. [Google Scholar] [CrossRef]
- Al-Ali, A.R.; Zualkernan, I.A.; Rashid, M.; Gupta, R.; Alikarar, M. A Smart Home Energy Management System Using IoT and Big Data Analytics Approach. IEEE Trans. Consum. Electron. 2017, 63, 426–434. [Google Scholar] [CrossRef]
- Mantha, B.R.K.; Menassa, C.C.; Kamat, V.R. A taxonomy of data types and data collection methods for building energy monitoring and performance simulation. Adv. Build. Energy Res. 2016, 10, 263–293. [Google Scholar] [CrossRef]
- Yang, J.; Ning, C.; Deb, C.; Zhang, F.; Cheong, D.; Lee, S.E.; Sekhar, C.; Tham, K.W. k-Shape clustering algorithm for building energy usage patterns analysis and forecasting model accuracy improvement. Energy Build. 2017, 146, 27–37. [Google Scholar] [CrossRef]
- Alahakoon, D.; Yu, X. Smart Electricity Meter Data Intelligence for Future Energy Systems: A Survey. IEEE Trans. Ind. Inform. 2016, 12, 425–436. [Google Scholar] [CrossRef]
- Abdelalim, A.; O’brien, W.; Shi, Z. Data visualization and analysis of energy flow on a multi-zone building scale. Autom. Constr. 2017, 84, 258–273. [Google Scholar] [CrossRef]
- Chou, J.S.; Ngo, N.T. Smart grid data analytics framework for increasing energy savings in residential buildings. Autom. Constr. 2016, 72, 247–257. [Google Scholar] [CrossRef]
- Crosbie, T.; Dawood, N.; Dawood, S. Improving the energy performance of the built environment: The potential of virtual collaborative life cycle tools. Autom. Constr. 2011, 20, 205–216. [Google Scholar] [CrossRef]
- Fan, C.; Xiao, F.; Madsen, H.; Wang, D. Temporal knowledge discovery in big BAS data for building energy management. Energy Build. 2015, 109, 75–89. [Google Scholar] [CrossRef]
- Hong, T.; Yang, L.; Hill, D.; Feng, W. Data and analytics to inform energy retrofit of high performance buildings. Appl. Energy 2014, 126, 90–106. [Google Scholar] [CrossRef] [Green Version]
- Lee, D.; Cha, G.; Park, S. A study on data visualization of embedded sensors for building energy monitoring using BIM. Int. J. Precis. Eng. Manuf. 2016, 17, 807–814. [Google Scholar] [CrossRef]
- Liu, X.; Nielsen, P.S. A hybrid ICT-solution for smart meter data analytics. Energy 2016, 115, 1710–1722. [Google Scholar] [CrossRef] [Green Version]
- Bourikas, L.; Costanza, E.; Gauthier, S.; James, P.A.B.; Kittley-Davies, J.; Ornaghi, C.; Rogers, A.; Saadatian, E.; Huang, Y. Camera-based window-opening estimation in a naturally ventilated office. Build. Res. Inf. 2018, 46, 148–163. [Google Scholar] [CrossRef]
- Prouzeau, A.; Dharshini, M.B.; Balasubramaniam, M.; Henry, J.; Hoang, N.; Dwyer, T. Visual Analytics for Energy Monitoring in the Context of Building Management. In Proceedings of the 2018 International Symposium on Big Data Visual and Immersive Analytics (BDVA), Konstanz, Germany, 17–19 October 2018; Volume 2018, pp. 1–9. [Google Scholar] [CrossRef]
- Zhao, J.; Lasternas, B.; Lam, K.P.; Yun, R.; Loftness, V. Occupant behavior and schedule modeling for building energy simulation through office appliance power consumption data mining. Energy Build. 2014, 82, 341–355. [Google Scholar] [CrossRef]
- Li, X.; Chen, S.; Li, H.; Lou, Y.; Li, J. Multi-dimensional analysis of air-conditioning energy use for energy-saving management in university teaching buildings. Build. Environ. 2020, 185, 107246. [Google Scholar] [CrossRef]
- Song, K.; Jang, Y.; Park, M.; Lee, H.-S.; Ahn, J. Energy efficiency of end-user groups for personalized HVAC control in multi-zone buildings. Energy 2020, 206, 118116. [Google Scholar] [CrossRef]
- Akil, M.; Tittelein, P.; Defer, D.; Suard, F. Statistical indicator for the detection of anomalies in gas, electricity and water consumption: Application of smart monitoring for educational buildings. Energy Build. 2019, 199, 512–522. [Google Scholar] [CrossRef]
- Chou, J.S.; Truong, N.S. Cloud forecasting system for monitoring and alerting of energy use by home appliances. Appl. Energy 2019, 249, 166–177. [Google Scholar] [CrossRef]
- Du, S.; Li, M.; Han, S.; Shi, J.; Li, H. Multi-pattern data mining and recognition of primary electric appliances from single non-intrusive load monitoring data. Energies 2019, 12, 992. [Google Scholar] [CrossRef] [Green Version]
- Capozzoli, A.; Piscitelli, M.S.; Brandi, S.; Grassi, D.; Chicco, G. Automated load pattern learning and anomaly detection for enhancing energy management in smart buildings. Energy 2018, 157, 336–352. [Google Scholar] [CrossRef]
- Ploennigs, J.; Ahmed, A.; Hensel, B.; Stack, P.; Menzel, K. Virtual sensors for estimation of energy consumption and thermal comfort in buildings with underfloor heating. Adv. Eng. Inform. 2011, 25, 688–698. [Google Scholar] [CrossRef]
- Zhu, J.; Shen, Y.; Song, Z.; Zhou, D.; Zhang, Z.; Kusiak, A. Data-driven building load profiling and energy management. Sustain. Cities Soc. 2019, 49, 101587. [Google Scholar] [CrossRef]
- Christiansen, N.; Kaltschmitt, M.; Dzukowski, F. Electrical energy consumption and utilization time analysis of hospital departments and large scale medical equipment. Energy Build. 2016, 131, 172–183. [Google Scholar] [CrossRef]
- Ruiz, L.G.B.; Pegalajar, M.C.; Arcucci, R.; Molina-Solana, M. A time-series clustering methodology for knowledge extraction in energy consumption data. Expert Syst. Appl. 2020, 160, 113731. [Google Scholar] [CrossRef]
- Gupta, M.; Phillips, N. Poster Abstract: Topological Analysis for Knowledge Discovery from Building Sensor Data. Sensors 2020, 20, 4914. [Google Scholar] [CrossRef]
- Ashouri, M.; Fung, B.C.M.; Haghighat, F.; Yoshino, H. Systematic approach to provide building occupants with feedback to reduce energy consumption. Energy 2019, 194, 116813. [Google Scholar] [CrossRef]
- Yin, X.; Liu, H.; Chen, Y.; Wang, Y.; Al-Hussein, M. A BIM-based framework for operation and maintenance of utility tunnels. Tunn. Undergr. Space Technol. 2020, 97, 103252. [Google Scholar] [CrossRef]
- Amasyali, K.; El-Gohary, N.M. A review of data-driven building energy consumption prediction studies. Renew. Sustain. Energy Rev. 2018, 81, 1192–1205. [Google Scholar] [CrossRef]
- Schmidt, M.; Moreno, M.V.; Schülke, A.; Macek, K.; Mařík, K.; Pastor, A.G. Optimizing legacy building operation: The evolution into data-driven predictive cyber-physical systems. Energy Build. 2017, 148, 257–279. [Google Scholar] [CrossRef]
- Schmidt, M.; Åhlund, C. Smart buildings as Cyber-Physical Systems: Data-driven predictive control strategies for energy efficiency. Renew. Sustain. Energy Rev. 2018, 90, 742–756. [Google Scholar] [CrossRef] [Green Version]
- Dobbs, J.R.; Hencey, B.M. Model predictive HVAC control with online occupancy model. Energy Build. 2014, 82, 675–684. [Google Scholar] [CrossRef] [Green Version]
- Ramos, D.; Teixeira, B.; Faria, P.; Gomes, L.; Abrishambaf, O.; Vale, Z. Using diverse sensors in load forecasting in an office building to support energy management. Energy Rep. 2020, 6, 182–187. [Google Scholar] [CrossRef]
- Blume, C.; Blume, S.; Thiede, S.; Herrmann, C. Manufacturing and Materials Processing Data-Driven Digital Twins for Technical Building Services Operation in Factories: A Cooling Tower Case Study. J. Manuf. Mater. Process. 2020, 4, 97. [Google Scholar] [CrossRef]
- Pan, Y.; Zhang, L. Data-driven estimation of building energy consumption with multi-source heterogeneous data. Appl. Energy 2020, 268, 114965. [Google Scholar] [CrossRef]
- Wang, R.; Lu, S.; Feng, W. A novel improved model for building energy consumption prediction based on model integration. Appl. Energy 2020, 262, 114561. [Google Scholar] [CrossRef]
- Ahmad, T.; Chen, H.; Shair, J.; Xu, C. Deployment of data-mining short and medium-term horizon cooling load forecasting models for building energy optimization and management. Int. J. Refrig. 2019, 98, 399–409. [Google Scholar] [CrossRef]
- Fan, C.; Xiao, F.; Yan, C.; Liu, C.; Li, Z.; Wang, J. A novel methodology to explain and evaluate data-driven building energy performance models based on interpretable machine learning. Appl. Energy 2019, 235, 1551–1560. [Google Scholar] [CrossRef]
- Ahmad, T.; Chen, H.; Guo, Y.; Wang, J. A comprehensive overview on the data driven and large scale based approaches for forecasting of building energy demand: A review. Energy Build. 2018, 165, 301–320. [Google Scholar] [CrossRef]
- Molina-Solana, M.; Ros, M.; Ruiz, M.D.; Gómez-Romero, J.; Martin-Bautista, M.J. Data science for building energy management: A review. Renew. Sustain. Energy Rev. 2017, 70, 598–609. [Google Scholar] [CrossRef] [Green Version]
- Tang, F.; Kusiak, A.; Wei, X. Modeling and short-term prediction of HVAC system with a clustering algorithm. Energy Build. 2014, 82, 310–321. [Google Scholar] [CrossRef]
- GhaffarianHoseini, A.; Zhang, T.; Nwadigo, O.; GhaffarianHoseini, A.; Naismith, N.; Tookey, J.; Raahemifar, K. Application of nD BIM Integrated Knowledge-based Building Management System (BIM-IKBMS) for inspecting post-construction energy efficiency. Renew. Sustain. Energy Rev. 2017, 72, 935–949. [Google Scholar] [CrossRef] [Green Version]
- Loftness, V.; Aziz, A.; Choi, J.H.; Kampschroer, K.; Powell, K.; Atkinson, M.; Heerwagen, J. The value of post-occupancy evaluation for building occupants and facility managers. Intell. Build. Int. 2009, 1, 249–268. [Google Scholar] [CrossRef]
- Zhang, C.; Zhao, Y.; Li, T.; Zhang, X. A post mining method for extracting value from massive amounts of building operation data Keywords: Building energy systems Data mining Association rule mining Post mining Operation pattern identification Building energy management. Energy Build. 2020, 223, 110096. [Google Scholar] [CrossRef]
- Fan, C.; Sun, Y.; Shan, K.; Xiao, F.; Wang, J. Discovering gradual patterns in building operations for improving building energy efficiency. Appl. Energy 2018, 224, 116–123. [Google Scholar] [CrossRef]
- Hodorog, A.; Petri, I.; Rezgui, Y.; Hippolyte, J.-L. Building information modelling knowledge harvesting for energy efficiency in the Construction industry. Clean Technol. Environ. Policy 2021, 23, 1215–1231. [Google Scholar] [CrossRef]
- Márquez, A.C.; de la Fuente Carmona, A.; Antomarioni, S. A process to implement an artificial neural network and association rules techniques to improve asset performance and energy efficiency. Energies 2019, 12, 3454. [Google Scholar] [CrossRef] [Green Version]
- Peña, M.; Biscarri, F.; Guerrero, J.I.; Monedero, I.; León, C. Rule-based system to detect energy efficiency anomalies in smart buildings, a data mining approach. Expert Syst. Appl. 2016, 56, 242–255. [Google Scholar] [CrossRef]
- Li, L.; Li, Z.; Li, X.; Wu, G. A review of global lean construction during the past two decades: Analysis and visualization. Eng. Constr. Archit. Manag. 2019, 26, 1192–1216. [Google Scholar] [CrossRef]
- Chen, Y.; Xu, P.; Gu, J.; Schmidt, F.; Li, W. Measures to improve energy demand flexibility in buildings for demand response (DR): A review. Energy Build. 2018, 177, 125–139. [Google Scholar] [CrossRef]
- Gerrish, T.; Ruikar, K.; Cook, M.; Johnson, M.; Phillip, M. Analysis of basic building performance data for identification of performance issues. Facilities 2017, 35, 801–817. [Google Scholar] [CrossRef] [Green Version]
- Marzouk, M.; Seleem, N. Assessment of existing buildings performance using system dynamics technique. Appl. Energy 2018, 211, 1308–1323. [Google Scholar] [CrossRef]
- Sağlık Bakanlığı. Türkiye Sağlık Yapıları Asgari Tasarım Standartları 2010 Yılı Kılavuzu. 2010. Available online: https://sbu.saglik.gov.tr/Ekutuphane/kitaplar/s.b.2010_klavuz_lowres_23092010.pdf (accessed on 1 December 2021).
- Sağlık Bakanlığı. Kamu Hastaneleri Birlikleri Verimlilik Değerlendirmesi Hakkinda Yönerge. 2014. Available online: https://khgmstokyonetimidb.saglik.gov.tr/Eklenti/19220/0/kamu-hastane-birlikleri-verimlilik-karne-degerlendirmesi-hakkinda-yonerge-26122014pdf.pdf (accessed on 1 December 2021).
- Roskams, M.; Haynes, B. Predictive analytics in facilities management: A pilot study for predicting environmental comfort using wireless sensors. J. Facil. Manag. 2019, 17, 356–370. [Google Scholar] [CrossRef]
- Jaribion, A.; Khajavi, S.H.; Holmstrom, J. IoT-Enabled Workplaces: A Case Study of Energy Management and Data Analytics. In Proceedings of the IECON 2019-45th Annual Conference of the IEEE Industrial Electronics Society, Lisbon, Portugal, 14–17 October 2019; pp. 5325–5330. [Google Scholar] [CrossRef]
- Corry, E.; Pauwels, P.; Hu, S.; Keane, M.; O’Donnell, J. A performance assessment ontology for the environmental and energy management of buildings. Autom. Constr. 2015, 57, 249–259. [Google Scholar] [CrossRef] [Green Version]
- Lai, J.H.K.; Yik, F.W.H. An analytical method to evaluate facility management services for residential buildings. Build. Environ. 2011, 46, 165–175. [Google Scholar] [CrossRef]
- Qi, M.; Li, X.; Zhu, E.; Shi, Y. Evaluation of perceived indoor environmental quality of five-star hotels in China: An application of online review analysis. Build. Environ. 2016, 111, 1–9. [Google Scholar] [CrossRef]
- Ruiz-Ruiz, A.J.; Blunck, H.; Prentow, T.S.; Stisen, A.; Kjaergaard, M.B. Analysis methods for extracting knowledge from large-scale WiFi monitoring to inform building facility planning. In Proceedings of the 2014 IEEE International Conference on Pervasive Computing and Communications (PerCom), Budapest, Hungary, 24–28 March 2014; Volume 2014, pp. 130–138. [Google Scholar] [CrossRef] [Green Version]
- Wang, Y.; Shao, L. Understanding occupancy and user behaviour through Wi-Fi-based indoor positioning. Build. Res. Inf. 2018, 46, 725–737. [Google Scholar] [CrossRef]
- Liang, X.; Hong, T.; Shen, G.Q. Occupancy data analytics and prediction: A case study. Build. Environ. 2016, 102, 179–192. [Google Scholar] [CrossRef] [Green Version]
- Cheong, K.H.; Poeschmann, S.; Lai, J.W.; Koh, J.M.; Acharya, U.R.; Yu, S.C.M.; Tang, K.J.W. Practical Automated Video Analytics for Crowd Monitoring and Counting. IEEE Access 2019, 7, 183252–183261. [Google Scholar] [CrossRef]
- Dzeng, R.-J.; Lin, C.-W.; Hsiao, F.-Y. Application of RFID tracking to the optimization of function-space assignment in buildings. Autom. Constr. 2014, 40, 68–83. [Google Scholar] [CrossRef]
- Li, Y.; Cao, L.; Han, Y.; Wei, J. Development of a Conceptual Benchmarking Framework for Healthcare Facilities Management: Case Study of Shanghai Municipal Hospitals. J. Constr. Eng. Manag. 2019, 146, 05019016. [Google Scholar] [CrossRef]
- Lai, J.H.; Man, C.S. Performance indicators for facilities operation and maintenance (Part 1): Systematic classification and mapping. Facilities 2018, 36, 476–494. [Google Scholar] [CrossRef]
- Gajzler, M. Knowledge Modeling in Construction of Technical Management System for Large Warehousing Facilities. Procedia Eng. 2015, 122, 181–190. [Google Scholar] [CrossRef] [Green Version]
- McArthur, J.J.; Shahbazi, N.; Fok, R.; Raghubar, C.; Bortoluzzi, B.; An, A. Machine learning and BIM visualization for maintenance issue classification and enhanced data collection. Adv. Eng. Inform. 2018, 38, 101–112. [Google Scholar] [CrossRef]
- Dutta, S.; Burak Gunay, H.; Bucking, S.; Dutta, Ã. Benchmarking operational performance of buildings by text mining tenant surveys. Sci. Technol. Built Environ. 2021, 27, 741–755. [Google Scholar] [CrossRef]
- Abidi, M.H.; Umer, U.; Mohammed, K.; Aboudaif, M.K.; Alkhalefah, H. Mathematics Automated Maintenance Data Classification Using Recurrent Neural Network: Enhancement by Spotted Hyena-Based Whale Optimization. Mathematics 2020, 8, 2008. [Google Scholar] [CrossRef]
- Wen, Q.; Zhang, J.-P.; Hu, Z.-Z.; Xiang, X.-S.; Shi, T. A Data-Driven Approach to Improve the Operation and Maintenance Management of Large Public Buildings. IEEE Access 2019, 7, 176127–176140. [Google Scholar] [CrossRef]
- Gholami, P.; Hafezalkotob, A. Maintenance scheduling using data mining techniques and time series models. Int. J. Manag. Sci. Eng. Manag. 2018, 13, 100–107. [Google Scholar] [CrossRef]
- Cao, Y.; Song, X.; Wang, T. Development of an Energy-Aware Intelligent Facility Management System for Campus Facilities. Procedia Eng. 2015, 118, 449–456. [Google Scholar] [CrossRef] [Green Version]
- Kim, K.; Yu, J.; Student, P.D. Improvement of Facility Condition Assessment Processes Using BIM Data. Constr. Res. Congr. 2016, 2016, 2432–2442. [Google Scholar] [CrossRef]
- Hwang, H.J.; Lee, J.H.; Hwang, J.S.; Jun, H.B. A study of the development of a condition-based maintenance system for an LNG FPSO. Ocean Eng. 2018, 164, 604–615. [Google Scholar] [CrossRef]
- Foresti, R.; Rossi, S.; Magnani, M.; Guarino Lo Bianco, C.; Delmonte, N. Smart Society and Artificial Intelligence: Big Data Scheduling and the Global Standard Method Applied to Smart Maintenance. Engineering 2020, 6, 835–846. [Google Scholar] [CrossRef]
- Ma, Z.; Ren, Y.; Xiang, X.; Turk, Z. Data-driven decision-making for equipment maintenance. Autom. Constr. 2020, 112, 103103. [Google Scholar] [CrossRef]
- Benndorf, G.A.; Wystrcil, D.; Réhault, N. A fault detection system based on two complementary methods and continuous updates. IFAC-PapersOnLine 2018, 51, 353–358. [Google Scholar] [CrossRef]
- Karim, R.; Westerberg, J.; Galar, D.; Kumar, U. Maintenance Analytics—The New Know in Maintenance. IFAC-PapersOnLine 2016, 49, 214–219. [Google Scholar] [CrossRef]
- Cheng, J.C.P.; Chen, W.; Chen, K.; Wang, Q. Data-driven predictive maintenance planning framework for MEP components based on BIM and IoT using machine learning algorithms. Autom. Constr. 2020, 112, 103087. [Google Scholar] [CrossRef]
- Aziz, Z.; Arslan, M. Leveraging BIM and Big Data to deliver well maintained highways. Facilities 2017, 35, 818–832. [Google Scholar] [CrossRef] [Green Version]
- Pruvost, H.; Enge-Rosenblatt, O.; Haufe, J. Information integration and semantic interpretation for building energy system operation and maintenance. In Proceedings of the IECON 2018-44th Annual Conference of the IEEE Industrial Electronics Society, Washington, DC, USA, 21–23 October 2018; pp. 813–818. [Google Scholar] [CrossRef]
- Gajzler, M. Text and data mining techniques in aspect of knowledge acquisition for decision support system in construction industry. Technol. Econ. Dev. Econ. Balt. J. Sustain. 2010, 16, 219–232. [Google Scholar] [CrossRef] [Green Version]
- Reffat, R.M.; Gero, J.S.; Peng, W. Improving the Management of Building Life Cycle: A Data Mining Approach. In Proceedings of the Clients Driving Innovation International Conference, Surfers Paradise, Australia, 25–27 October 2004; pp. 1–14. [Google Scholar]
- Xu, C.; Chen, H. A hybrid data mining approach for anomaly detection and evaluation in residential buildings energy data. Energy Build. 2020, 215, 109864. [Google Scholar] [CrossRef]
- Capozzoli, A.; Lauro, F.; Khan, I. Fault detection analysis using data mining techniques for a cluster of smart office buildings. Expert Syst. Appl. 2015, 42, 4324–4338. [Google Scholar] [CrossRef]
- Savino Piscitelli, M.; Mazzarelli, D.M.; Capozzoli, A. Enhancing operational performance of AHUs through an advanced fault detection and diagnosis process based on temporal association and decision rules. Energy Build. 2020, 226, 110369. [Google Scholar] [CrossRef]
- Aguilar, J.; Ardila, D.; Avendaño, A.; Macias, F.; White, C.; Gomez-Pulido, J.; Gutierrez De Mesa, J.; Garces-Jimenez, A.; Co, A.A. ) An Autonomic Cycle of Data Analysis Tasks for the Supervision of HVAC Systems of Smart Building. Energies 2020, 13, 3103. [Google Scholar] [CrossRef]
- Park, J.Y.; Wilson, E.; Parker, A.; Nagy, Z. The good, the bad, and the ugly: Data-driven load profile discord identification in a large building portfolio. Energy Build. 2020, 215, 109892. [Google Scholar] [CrossRef]
- Fan, C.; Xiao, F.; Song, M.; Wang, J. A graph mining-based methodology for discovering and visualizing high-level knowledge for building energy management. Appl. Energy 2019, 251, 113395. [Google Scholar] [CrossRef]
- Miller, C.; Nagy, Z.; Schlueter, A. A review of unsupervised statistical learning and visual analytics techniques applied to performance analysis of non-residential buildings. Renew. Sustain. Energy Rev. 2018, 81, 1365–1377. [Google Scholar] [CrossRef]
- Yang, C.; Shen, W.; Chen, Q.; Gunay, B. A practical solution for HVAC prognostics: Failure mode and effects analysis in building maintenance. J. Build. Eng. 2018, 15, 26–32. [Google Scholar] [CrossRef]
- Marzouk, M.; Abdelaty, A. Monitoring thermal comfort in subways using building information modeling. Energy Build. 2014, 84, 252–257. [Google Scholar] [CrossRef]
- Lin, M.; Afshari, A.; Azar, E. A data-driven analysis of building energy use with emphasis on operation and maintenance: A case study from the UAE. J. Clean. Prod. 2018, 192, 169–178. [Google Scholar] [CrossRef]
- Amos, D.; Nisham Musa, Z.; Peng Au-Yong, C. Modelling the performance of waste management services in Ghana’s public hospitals A facilities management perspective. Facilities 2020, 9, 715–738. [Google Scholar] [CrossRef]
- Kalluri, B.; Kamilaris, A.; Kondepudi, S.; Kua, H.W.; Tham, K.W. Applicability of using time series subsequences to study office plug load appliances. Energy Build. 2016, 127, 399–410. [Google Scholar] [CrossRef]
- Salvado, F.; Almeida, N.; Vale Azevedo, A. Aligning financial and functional equivalent depreciations rates of building assets. Eng. Cons. Arch. Mgmt. 2019, 27, 441–457. [Google Scholar] [CrossRef]
- Bartels, L.B.; Liu, L.Y.; El-Rayes, K.; El-Gohary, N.; Golparvar, M.; Grussing, M.N. Work Optimization with Association Rule Mining of Accelerated Deterioration in Building Components. J. Perform. Constr. Facil. 2020, 34, 04020033. [Google Scholar] [CrossRef]
- Marmo, R.; Nicolella, M.; Polverino, F.; Tibaut, A. A Methodology for a Performance Information Model to Support Facility Management. Sustainability 2019, 11, 7007. [Google Scholar] [CrossRef] [Green Version]
- Kim, J.M.; Kim, T.; Yu, Y.J.; Son, K. Development of a maintenance and repair cost estimation model for educational buildings using regression analysis. J. Asian Archit. Build. Eng. 2018, 17, 307–312. [Google Scholar] [CrossRef] [Green Version]
- Szönyi, L. Building Information Modelling in the decision process of retrofitting the envelope of public buildings—A case Study. Period. Polytech. Civ. Eng. 2010, 54, 143–154. [Google Scholar] [CrossRef]
- Kepplinger, P.; Huber, G.; Petrasch, J. Autonomous optimal control for demand side management with resistive domestic hot water heaters using linear optimization. Energy Build. 2015, 100, 50–55. [Google Scholar] [CrossRef]
- Doloi, H. Application of AHP in improving construction productivity from a management perspective. Constr. Manag. Econ. 2008, 26, 841–854. [Google Scholar] [CrossRef]
- Ishak, A. Technology assessment of liquid waste in rubber factory using analytical hierarchy process and promethee methods Supplier Selection Using Analytical Hierarchy Process (AHP) and Technique for Order Preference bu Similarity to Ideal Solution (TOPSIS) View project. In Proceedings of the 5th International Conference on Industrial, Mechanical, Electrical, and Chemical Engineering, Surakarta, Indonesia, 17–18 September 2019; Volume 2217, pp. 1–8. [Google Scholar] [CrossRef]
- Darko, A.; Chan, A.P.; Ameyaw, E.E.; Owusu, E.K.; Pärn, E.; Edwards, D.J. Review of application of analytic hierarchy process (AHP) in construction. Int. J. Constr. Manag. 2018, 19, 436–452. [Google Scholar] [CrossRef]
- Sapkota, M.; Arora, M.; Malano, H.; Sharma, A.; Moglia, M. Integrated evaluation of hybridwater supply systems using a PROMETHEE-GAIA approach. Water 2018, 10, 610. [Google Scholar] [CrossRef] [Green Version]
- Kowalski, W. Health Care Facilities. In Ultraviolet Germicidal Irradiation Handbook; Springer: Berlin/Heidelberg, Germany, 2009. [Google Scholar] [CrossRef]
- Lai, J.; Yuen, P.L. Identification, classification and shortlisting of performance indicators for hospital facilities management. Facilities 2021, 39, 4–18. [Google Scholar] [CrossRef]
- Si, X.S.; Wang, W.; Hu, C.H.; Zhou, D.H. Remaining useful life estimation—A review on the statistical data driven approaches. Eur. J. Oper. Res. 2011, 213, 1–14. [Google Scholar] [CrossRef]
- Musa, Z.N.; Pitt, M. Defining facilities management service delivery in UK shopping centres. J. Retail Leis. Prop. 2009, 8, 193–205. [Google Scholar] [CrossRef]
- Naghshbandi, S.N. Civil Engineering Journal BIM for Facility Management: Challenges and Research Gaps. 2016. Available online: www.CivileJournal.org (accessed on 30 September 2020).
- Shah Ali, A. Cost decision making in building maintenance practice in Malaysia. J. Facil. Manag. 2009, 7, 298–306. [Google Scholar] [CrossRef] [Green Version]
- Kim, S.; Lee, S.; Ahn, Y.H. Evaluating Housing Maintenance Costs with Loss-Distribution Approach in South Korean Apartment Housing. J. Manag. Eng. 2018, 35, 04018062. [Google Scholar] [CrossRef]

| No | Environmental Aspect in Healthcare Facilities | O | T | S | No | Environmental Aspect in Healthcare Facilities | O | T | S |
|---|---|---|---|---|---|---|---|---|---|
| E1 | Resource/Energy consumption with respect to working days and non-working days (with motif discovery, clustering analysis, etc.) | X | X | E8 | Prediction of Resource/Energy consumption by considering daylighting | X | |||
| E2 | Resource/Energy consumption with respect to seasons (with motif discovery, clustering analysis, etc.) | X | X | E9 | Prediction of Resource/Energy consumption by considering occupant schedule | X | X | ||
| E3 | Identification of Resource/Energy load profile (plug loads, lighting, heating, cooling, water, etc.) | X | X | E10 | Resource/Energy use intensity | X | X | ||
| E4 | Prediction of Resource/Energy load profile (plug loads, lighting, heating, cooling, water, etc.) | X | X | E11 | Green energy’s ratio with respect to energy consumption | X | X | ||
| E5 | Resource/Energy consumption with respect to the number of staff | X | X | E12 | Greenhouse gas emissions per building area/number of patient/patient bed | X | X | ||
| E6 | Resource/Energy consumption with respect to the number of beds | X | X | E13 | Energy/Resource efficiency | X | X | ||
| E7 | Resource/Energy consumption with respect to zone/spaces (area) | X | X | ||||||
| Sources: [4,9,11,12,15,16,17,18,22,24,25,26,27,29,31,33,34,35,36,37,38,39,41,46,47,51,56,69,70,71,72,73,74,75,76,77,78,79,80,81,82,83,84,85,86,87,88,89,90,91,92,93,94,95,96,97,98,99,100,101,102,103,104,105,106,107,108,109,110,111,112,113,114,115,116,117,118,119,120,121,122,123,124,125,126,127,128] | |||||||||
| No | User Aspect in Healthcare Facilities | O | T | S | No | User Aspect in Healthcare Facilities | O | T | S |
|---|---|---|---|---|---|---|---|---|---|
| U1 | Indoor air quality | X | X | U10 | Catering satisfaction | X | X | ||
| U2 | Prediction of indoor air parameters and indoor quality | X | X | U11 | Security satisfaction | X | X | ||
| U3 | Number of patient/worker complaints per year | X | U12 | Maintenance satisfaction | X | X | |||
| U4 | Complaint intensity per floor area | X | U13 | Care satisfaction | X | X | |||
| U5 | Categorical and spatial breakdown of the complaints per area | X | U14 | Identification of space occupancy | X | X | |||
| U6 | Percentage patient/worker dissatisfied | X | U15 | Identification of visit frequency of facility | X | X | |||
| U7 | Predictive mean vote (Thermal) | X | X | U16 | Identification of facility impact on user productivity | X | X | ||
| U8 | Predictive percentage dissatisfied (Thermal) | X | X | U17 | Accessibility for disabled | X | |||
| U9 | Cleaning satisfaction | X | X | U18 | Adjust treatment index | X | X | ||
| Sources: [4,10,13,15,16,17,24,25,27,29,30,31,33,34,35,36,37,38,39,46,73,76,79,81,86,87,88,89,90,96,100,103,105,106,115,116,117,126,127,128,129,130,131,132,133,134,135,136,137,138] | |||||||||
| No | Emergency and Safety Management in Healthcare Facilities | O | T | S | No | Emergency and Safety Management in Healthcare Facilities | O | T | S |
|---|---|---|---|---|---|---|---|---|---|
| S1 | Gross floor area under safety and security patrol | X | S4 | Number of lost work days per year | X | X | |||
| S2 | Number of accidents per year | X | S5 | Identification of the number of alarm activation depending on emergency situation within the facility | X | ||||
| S3 | Number of health and safety complaints per year | X | S6 | Number of security incidents per year | X | ||||
| Sources: [11,24,31,33,34,35,36,37,38,39,51,69,126,127,139,140,141] | |||||||||
| No | Maintenance and Repair in Healthcare Facilities | O | T | S | No | Maintenance and Repair in Healthcare Facilities | O | T | S |
|---|---|---|---|---|---|---|---|---|---|
| M1 | Work request response rate | X | M13 | Schedule compliance | X | X | |||
| M2 | Scheduling intensity | X | X | M14 | Work order turnover | X | |||
| M3 | Manpower utilization rate | X | X | M15 | Corrective maintenance time | X | |||
| M4 | Manpower efficiency | X | X | M16 | Preventive maintenance time | X | |||
| M5 | Manpower utilization index | X | X | M17 | Average response time for maintenance | X | X | ||
| M6 | Preventive maintenance ratio | X | M18 | Backlog size | X | X | |||
| M7 | Percentage/Number of corrective work | X | M19 | Number of maintenance-induced interruptions | X | ||||
| M8 | Percentage/Number of preventive work | X | M20 | Mean time between failures | X | ||||
| M9 | Percentage/Number of predictive maintenance work | X | M21 | Number of usage classified maintenance data for the solution of maintenance activity | X | ||||
| M10 | Percentage/Number of improvement work | X | M22 | Number of replaced or repaired spare parts and needed spare parts for maintenance activities | X | X | |||
| M11 | Number of completed work orders per staff | X | M23 | Downtime analysis to detect rate loss | X | ||||
| M12 | Schedule realization rate | X | X | M24 | Outsourcing ratio | X | |||
| Sources: [4,9,10,11,13,14,15,17,18,24,26,27,29,30,31,33,34,35,36,37,38,39,41,49,50,74,79,82,83,84,92,93,97,102,114,116,118,121,126,127,130,139,140,142,143,144,145,146,147,148,149,150,151,152,153,154,155,156,157,158,159,160,161,162,163,164,165,166,167,168,169] | |||||||||
| No | Physical Aspect of Healthcare Facilities | O | T | S | No | Physical Aspect of Healthcare Facilities | O | T | S |
|---|---|---|---|---|---|---|---|---|---|
| P1 | System-equipment availability (including lift, and fire services system) | X | P5 | Condition index | X | ||||
| P2 | Useful-life determination for equipment/system | X | X | P6 | Space utilization | X | X | ||
| P3 | Identification of annualized failure rate for equipment | X | X | P7 | Beds per 1000 people | X | |||
| P4 | Average age | X | P8 | Theatres per 10,000 people | X | ||||
| Sources: [9,14,15,17,26,29,30,31,33,34,35,36,37,38,39,46,73,76,81,84,100,105,106,114,118,119,126,127,149,156,165,169,170,171,172,173] | |||||||||
| No | Lifecycle Cost in Healthcare Facilities | O | T | S | No | Lifecycle Cost in Healthcare Facilities | O | T | S |
|---|---|---|---|---|---|---|---|---|---|
| L1 | Percentage of personnel cost | X | L16 | Security expenditure per building area/per person | X | ||||
| L2 | Percentage of subcontractor cost | X | L17 | O&M cost (including depreciation and amortization costs) per building area/per patient bed | X | X | |||
| L3 | Percentage of contractor cost | X | L18 | Grounds-keeping costs | X | ||||
| L4 | Actual costs within budgeted costs | X | X | L19 | Maintenance efficiency index | X | |||
| L5 | Maintenance cost per building area/per patient bed/by functional area | X | X | L20 | Spending percentage on deferred maintenance | X | X | ||
| L6 | Annual maintenance cost per patient bed | X | L21 | Cleaning/hygiene costs | X | X | |||
| L7 | Breakdown severity | X | X | L22 | Healthcare income per building area/number of patient | X | |||
| L8 | Percentage of maintenance material cost | X | L23 | Ratio of total O&M cost to healthcare income | X | ||||
| L9 | Percentage/Average of downtime cost | X | L24 | Current replacement value | X | X | |||
| L10 | Percentage/Average of corrective maintenance cost | X | L25 | Resource/Energy expenditure per building area/per person | X | X | |||
| L11 | Percentage/Average of preventive maintenance cost | X | L26 | Cost efficiency score | X | ||||
| L12 | Percentage/Average of predictive maintenance cost | X | L27 | Backlog maintenance cost per area | X | ||||
| L13 | Direct maintenance cost (corrective, preventive) | X | L28 | Total maintenance backlog cost per GIA | X | ||||
| L14 | Total operating cost | X | X | L29 | Cost of materials used per year | X | |||
| L15 | Total safety and security expenditure | X | X | ||||||
| Sources: [4,11,17,24,30,31,33,34,35,36,37,38,39,41,48,75,76,80,81,102,114,126,127,128,140,151,165,174,175,176] | |||||||||
| Time | Cost | Quality | |
|---|---|---|---|
| Time | 1.00 | 1.04 | 3.32 |
| Cost | 0.96 | 1.00 | 3.81 |
| Quality | 0.30 | 0.26 | 1.00 |
| Sum of Columns | 2.26 | 2.30 | 8.13 |
| Time | Cost | Quality | Priority Vector | |
|---|---|---|---|---|
| Time | =1.00/2.26 = 0.44 | =1.04/2.30 = 0.45 | 0.43 | =(0.44 + 0.45 + 0.43)/3 = 0.43 |
| Cost | =0.96/2.26 = 0.42 | 0.43 | 0.44 | 0.44 |
| Quality | =0.30/2.26 = 0.13 | 0.11 | 0.12 | 0.12 |
| Weighted Sum Matrix | Eigen Values | |
|---|---|---|
| Time | =(1 × 0.43 + 1.04 × 0.44 + 3.32 × 0.12) = 1.30 | =1.30/0.43 = 3.0045 |
| Cost | 1.33 | 3.0048 |
| Quality | 0.37 | 3.0013 |
| λmax | =(3.0045 + 3.0048 + 3.0013)/3 = 3.0035 | |
| Indicator | Phi Values | Indicator | Phi Values |
|---|---|---|---|
| E4 | 0.7576 | E9 | 0.0101 |
| E13 | 0.6010 | E10 | −0.3569 |
| E1 | 0.5320 | E11 | −0.4731 |
| E3 | 0.4966 | E6 | −0.7012 |
| E8 | 0.3788 | E12 | −0.7542 |
| E2 | 0.3670 | E5 | −0.8897 |
| E7 | 0.0320 |
| Indicator | Phi Values | Indicator | Phi Values |
|---|---|---|---|
| U2 | 0.8919 | U5 | −0.1218 |
| U1 | 0.7219 | U10 | −0.1622 |
| U14 | 0.6815 | U9 | −0.2169 |
| U3 | 0.2585 | U4 | −0.2347 |
| U7 | 0.2335 | U15 | −0.3060 |
| U16 | 0.1943 | U18 | −0.3119 |
| U11 | 0.1610 | U17 | −0.4652 |
| U8 | −0.0303 | U6 | −0.5389 |
| U13 | −0.1052 | U12 | −0.6494 |
| Indicator | Phi Values | Indicator | Phi Values |
|---|---|---|---|
| S2 | 0.9030 | S1 | −0.2444 |
| S4 | 0.6000 | S5 | −0.6525 |
| S3 | 0.1192 | S6 | −0.7253 |
| Indicator | Phi Values | Indicator | Phi Values |
|---|---|---|---|
| M6 | 0.7817 | M5 | −0.1014 |
| M13 | 0.7541 | M16 | −0.1910 |
| M4 | 0.7448 | M22 | −0.2921 |
| M3 | 0.6605 | M14 | −0.3184 |
| M12 | 0.5740 | M18 | −0.3298 |
| M20 | 0.5046 | M10 | −0.3808 |
| M23 | 0.4616 | M15 | −0.4695 |
| M2 | 0.3882 | M24 | −0.4787 |
| M21 | 0.3333 | M1 | −0.5318 |
| M19 | 0.1146 | M17 | −0.5415 |
| M8 | 0.0272 | M11 | −0.8437 |
| M9 | 0.0272 | M7 | −0.8933 |
| Indicator | Phi Values | Indicator | Phi Values |
|---|---|---|---|
| P5 | 1.0000 | P6 | −0.2121 |
| P1 | 0.5873 | P4 | −0.4978 |
| P3 | 0.3276 | P7 | −0.7186 |
| P2 | 0.2323 | P8 | −0.7186 |
| Indicator | Phi Values | Indicator | Phi Values |
|---|---|---|---|
| L17 | 0.5895 | L27 | 0.0061 |
| L25 | 0.5819 | L11 | −0.0927 |
| L5 | 0.4957 | L12 | −0.0927 |
| L15 | 0.4457 | L18 | −0.1140 |
| L20 | 0.4372 | L13 | −0.1703 |
| L7 | 0.4098 | L19 | −0.2056 |
| L26 | 0.3997 | L23 | −0.2583 |
| L14 | 0.3038 | L21 | −0.2670 |
| L9 | 0.2702 | L24 | −0.2677 |
| L6 | 0.2475 | L8 | −0.4820 |
| L4 | 0.2063 | L1 | −0.5289 |
| L2 | 0.0924 | L22 | −0.6342 |
| L3 | 0.0887 | L10 | −0.6977 |
| L29 | 0.0462 | L16 | −0.8247 |
| L28 | 0.0148 |
Publisher’s Note: MDPI stays neutral with regard to jurisdictional claims in published maps and institutional affiliations. |
© 2022 by the authors. Licensee MDPI, Basel, Switzerland. This article is an open access article distributed under the terms and conditions of the Creative Commons Attribution (CC BY) license (https://creativecommons.org/licenses/by/4.0/).
Share and Cite
Demirdöğen, G.; Işık, Z.; Arayici, Y. Determination of Business Intelligence and Analytics-Based Healthcare Facility Management Key Performance Indicators. Appl. Sci. 2022, 12, 651. https://doi.org/10.3390/app12020651
Demirdöğen G, Işık Z, Arayici Y. Determination of Business Intelligence and Analytics-Based Healthcare Facility Management Key Performance Indicators. Applied Sciences. 2022; 12(2):651. https://doi.org/10.3390/app12020651
Chicago/Turabian StyleDemirdöğen, Gökhan, Zeynep Işık, and Yusuf Arayici. 2022. "Determination of Business Intelligence and Analytics-Based Healthcare Facility Management Key Performance Indicators" Applied Sciences 12, no. 2: 651. https://doi.org/10.3390/app12020651