Article

Development of a Stock Price Prediction Framework for Intelligent Media and Technical Analysis

1
Department of Electrical and Electronic Engineering Science, University of Johannesburg, Johannesburg 2006, South Africa
2
Instituted for Intelligent Systems, University of Johannesburg, Johannesburg 2006, South Africa
*
Author to whom correspondence should be addressed.
Appl. Sci. 2022, 12(2), 719; https://doi.org/10.3390/app12020719
Submission received: 3 December 2021 / Revised: 30 December 2021 / Accepted: 3 January 2022 / Published: 12 January 2022
(This article belongs to the Special Issue Artificial Intelligence Applications and Innovation)

Abstract

:
Equity traders are always looking for tools that will help them maximise returns and minimise risk, be it fundamental or technical analysis techniques. This research integrates tools used by equity traders and uses them together with machine learning and deep learning techniques. The presented work introduces a South African-based sentiment classifier to extract sentiment from new headlines and tweets. The experimental work uses four machine learning models for fundamental analysis and six long short-term memory model architectures, including a developed encoder-decoder long short-term memory model for technical analysis. Data used in the experiments is mined and collected from news sites, tweets from Twitter and Yahoo Finance. The results from 2 experiments show an accuracy of 96% in predicting one of the major telecommunication companies listed on the JSE closing price movement while using the linear discriminant analysis model and an RMSE of 0.023 in predicting a significant telecommunication company closing price using encoder-decoder long short-term memory. These findings reveal that the sentiment feature contains an essential fundamental value, and technical indicators also help move closer to predicting the closing price.

1. Introduction

The problem of minimising risk and maximising returns bundled with predicting future price movements is what stock market traders have been trying to solve for years. Many have provided tools and solutions to solve this massive problem of predicting the increase and decrease of selected companies’ stock prices. These equity traders have depended on news headlines (fundamental analysis) and technical indicators (technical analysis) as tools for prediction. Stock price prediction and stock price movement prediction predict what the future prices will look like from observing past and present price data. Researchers have also realised that stock price prediction depends not only on historical data but also on social media data. In 2018, a social media influencer expressed her unhappiness with Snapchat on Twitter; her tweet caused the Snapchat share price to drop by 6%, wiping out $1.3 billion [1]. Tesla CEO Elon Musk caused Telsa’s share price to decrease by 10% after sending a negative tweet concerning Tesla’s share price [2]. The age of mobile devices has seen a vast increase in social media and news data. This social and news data is filled with essential facts and opinions that may be harvested to create a stock price movement prediction and closing price prediction tool. In developing this framework, the research aims to answer the following questions: Can a framework on social media and news headlines be used to forecast a company’s stock price movement? Additionally, can that same framework use technical indicators as features to increase the accuracy of predicting a company’s stock closing price?
This paper presents a framework for forecasting stock price movements and closing prices using machine learning and deep learning models. The framework uses a text classifier model for sentiment analysis on social media and news data. Using machine learning, the research also investigates predicting the increase and decrease of a selected company’s stock based on sentiment score. Technical indicators are applied together with times series analysis and deep learning to predict the closing price of a telecommunication company listed on the Johannesburg Stock Exchange.
The presented research design is based on a quantitative research methodology, and the experimental method is used, whereby actual social media and stock price data is collected and analysed. This paper discusses using social media and technical indicators to predict stock price movements and closing prices; the article compares different machine learning models for stock price movement prediction (fundamental analysis) and deep learning models for closing price prediction (technical analysis). The remainder of the paper is arranged as follows. Section 2 looks at a summary of relevant literature. Section 3 discusses data collection and methodology. Results from the experiments are discussed in Section 4. The conclusion is provided in the final quarter of the paper.

2. Materials and Methods

2.1. Theoretical Fundamentals

2.1.1. Forecasting Using Sentiment Analysis

Sentiment analysis studies people’s attitudes, opinions, emotions, and assessment towards concerning topics, issues, and current affairs. Shah et al. [3] developed a sentiment analysis dictionary for the financial sector to better understand the effects of news sentiments on the stock market. Their model considered the pharmaceutical market and how the news affected the stock. Their model also suggested buying, selling or holding based on the sentiment score. Wu et al. [4] proposed a sentence-based sentiment analyser based on the Chinese Sentiment Analysis Ontology Base and Hownet. This paper integrated sentiment analysis into a support vector machine using the rolling window method to explore the relationship between stock price movements and stock forum sentiment. The paper regards the sentiment feature as one of the leading indicators due to the valuable information it carries.

2.1.2. Forecasting Using Recurrent Neural Networks

Li et al. [5] proposed a multi-input LSTM model for stock market prediction that mines relevant information from low relational features and removes irrelevant information using additional input gates. The paper included data from the Chinese stock market and prices related to the stocks. Using a two-stage attention mechanism and related stock prices improved the efficiency and accuracy of the model. D. Lein Minh et al. [6] proposed a sentiment word-embedding Stock2Vec trained on Hardvard IV-4 and a two-way gated recurrent neural unit for stock price direction prediction. The paper used historical S&P 500 prices and articles from Bloomberg and Reuter to predict the S&P 500 stock price movement. The paper showed that Stock2Vec can handle financial datasets more efficiently and that the two-way gated recurrent unit outperforms advanced models, including the gated recurrent unit and the long short-term memory.

2.1.3. Forecasting Using Hybrid CNNxLSTM and ConvLSTM Network

Xingjian et al. [7] introduced ConvLSTM as a short intensity prediction method. Lee & Kim [8] developed NuNet, a framework constructed using the ConvLSTM network. This study’s framework successfully learned high-level features from KOSPI200, FTSE100, and S&P500 stock market data. Livieris et al. [9] proposed a CNNxLSTM model for accurate gold price movement and gold price prediction. The model increased its performance by combining LSTM layers with convolutional layers. Chen et al. [10] proposed a framework constructed using the ConvLSTM model for short-term traffic flow prediction. The model performed better than vanilla LSTM, stacked LSTM, and bidirectional LSTM.

2.1.4. Stock Market Prediction

Khan et al. [11] used algorithms to evaluate the effects of data from financial news and social media on the stock market. This paper used spam tweet reduction and feature selection to increase the quality and performance of predictions. Khan et al. [12] developed a framework that checks whether public and political domain sentiments affect company market trends. This paper showed an improvement of about 3% due to the sentiment feature. Vargas et al. [13] used two technical indicators and financial news articles to input a deep learning model for stock price prediction. This study compared two models for financial news and technical indicators and showed that the addition of technical indicators and financial news stabilises and improves the output. Chen and Shih [14] proposed a stock movement prediction framework based on Chinese news and technical indicators. The paper also proposed the use of the GATSP algorithm. Both experiments show the effectiveness of the two methods.

2.2. Background

In this section of the paper, a brief background is given on the machine and deep learning models considered by the paper to achieve a better understanding. The section is split into two; the first portion covers machine learning models used in the fundamental analysis experiment, and lastly, deep learning models in the technical analysis experiment are discussed.

2.2.1. Machine Learning Models

A support vector machine (SVM) is a supervised machine learning model used in classification. An SVM finds an optimal way to divide a dataset into two categories and determines the hyperplane from any point in the training dataset [15].
Fisher formulated linear discriminant analysis in 1936, and Welch in 1939. This classification and discrimination model is constructed with labelled observations from a dataset and a set of a new unlabeled dataset used to predict the dataset [16].
The decision tree is a classification and covers regression machine learning algorithms influenced by real-life analogy. Each leaf node on the tree is assigned a class label, and the root and other non-terminal nodes split the records with different test conditions [17].
Random forest was introduced in 2001 by Leo Breiman; this classification or regression machine learning model also gets its name from real-life analogy. A random forest comprises many decision trees that work together to produce a class prediction, and the trees with the most predictions become the final prediction [18].

2.2.2. Deep Learning Models

Long short-term memory (LSTM) was introduced by Hochreiter and Schimidhuber. The LSTM stems from recurrent neural networks but differs in architecture. Recurrent neural networks suffer from the exploding and vanishing gradient problem, and the LSTM solves that problem, as it can learn long-term dependencies because of its feedback loop. The specialty of LSTM is the cell state, also known as the memory bank; this is a horizontal line running through the LSTM block that carries information from the previous timestamps [19].

2.3. Methodology

This paper develops two frameworks: one to predict stock price movements using fundamental analysis and the second to predict the stock closing price using technical analysis. The paper determines a sentiment feature from tweets and news headlines related to South African companies in the telecommunication industry. A comparison is employed between four machine learning models and a sentiment classifier to predict stock price movement and use five LSTM architectures and technical indicators to predict the closing price. It should be highlighted that the framework does not include a recommender system on which stock to buy or sell or validate social media postings. The presented research focuses on the closing prices on both experiments due to the occurrence of news headlines being posted either at the end or beginning of the day.

2.3.1. Sentiment Classifier

Data from Twitter was first collected using an API called GetOldTweets [20] and then taken through the pre-processing stage, including labelling, to prepare for the sentiment classification.
Step 1, Twitter scraper: In this step, the GetOldTweets python API gathered South African-based tweets to introduce South African grammar into the sentiment classifier. Tweets were collected from famous South African television shows, the Datamustfall movement, telecommunication companies on the JSE, and finally, the Stanford Twitter Sentiment Corpus. The paper uses hashtags “#” to collect relevant tweets. These hashtags are considered due to the amount of pertinent sentiment they provide to the classifier. The popular South African television dataset uses the following hashtags: Date-My-Family, South African Idols, and Uyajola99, which amounts to a total of 3000 tweets. The next 1000 come from the hashtag Datamustfall movement, and the last 3000 tweets are from telecommunication companies. The paper considered the following hashtags: Vodacom, Mtn, and Telkom, and excluded tweets from their companies’ Twitter accounts for this data, as this only has relevant marketing tweets.
Step 2, Data cleaning: To prepare the dataset for the training of the sentiment classifier, the dataset needed to go through a pre-processing step. As a result, a python function was written using regular expressions and a few other techniques to clean the dataset. The function first drops all empty rows in the dataset and turns all the letters into lower case. Next, the function removes all URLs, usernames, dates, whitespace, and the hashtag sign (#). Finally, columns are renamed to text, and all the collected tweets are targeted and labeled such that 0 = negative, 2 = neutral, and 4 = positive. This was conducted using the same method used to label the text in the Stanford Twitter Sentiment Corpus [21]. The final clean dataset consists of 14,000 tweets.
Step 3, Sentiment analyser training: To train the sentiment classifier, a pre-trained language model, BERT (Bidirectional Encoder Representation from Transformers), was chosen [22]. The paper can train its sentiment analysis classifier using the Hugging Face Python library to fine-tune the BERT model [23].

2.3.2. Fundamental Analysis

Fundamental analysis studies the stock market by analysing new headlines, economic and social reports, and political forces that may affect the price movement [24]. This paper employs a similar strategy through the use of fundamental analysis by looking at news headlines and social media reports in its research. The fundamental analysis experiment is split into three different sub-experiments using four different models to evaluate performance: linear discriminant analysis, support vector machine, decision tree, and random forest. To assess the performance of the models, the paper uses accuracy, precision, recall, the F-measure, and a confusion matrix. The data is split into 80/20 for training and testing; three datasets for fundamental analysis were constructed, considering dates from 2012 to 2019. The first dataset was the news headlines dataset, scraped off the Money web site. This dataset consisted of news headlines linked to the Vodacom Group Limited Company. The second dataset was composed of tweets collected using the GetOldTweets API with the hashtag #vodacom. The total length of the combined dataset was 893 rows. The combined dataset was then labelled according to price movement on the closing price for that particular day, with +1 indicating an increase and −1 indicating a decrease.
The data collected from the scraped Moneyweb site and the #vodacom tweets were processed using the same python function mentioned above. This function removes all URLs, usernames, dates, whitespace, and the hashtag sign (#) to prepare the dataset for the experiments. The last stage to take the dataset through is the transformation stage. Here, categorical encoding and scaling were applied to the data to transform the dataset. These two techniques convert text into numerical representations and scale the data into a specific range, respectively [25]. Categorical encoding on the fundamental analysis experiment was applied to the target column. This column contains the variables ‘UP’ and ‘Down’, which categorises whether Vodacom’s stock price went up or down on a given day. These up-down variables were replaced with 1 and −1. The dataset was also scaled using the sklearn MinMaxScaler Python library [26]; this technique scales all the numerical data between 0 and 1 but does not scale the target and sentiment column.
Feature engineering is the process of extracting new features by transforming the current features [25]. The sentiment was extracted from all news headlines and tweets in the collected dataset, and this sentiment feature determined whether the polarity of the text was negative, positive, or neutral.

2.3.3. Technical Analysis

Technical analysis studies market trends gathered from volume and price movement. This paper looks at Vodacom Group Limited, one of South Africa’s biggest telecommunication companies. Like the fundamental analysis experiment, this technical analysis experiment is also split into three sub-experiments. Let us now introduce two datasets to this experiment, the closing price dataset (univariate) and the closing price with technical indicators dataset (multivariate). An 80/20 split was applied to the datasets for training and testing. Six different long short-term memory (LSTM) architectures are introduced: ordinary LSTM, bidirectional LSTM, stacked (deep) LSTM, convLSTM, CNNxLSTM. Encoder-decoder LSTM was applied in the last experiment. The ordinary LSTM architecture is comprised of 2 layers: 1 LSTM layer with 200 units and a dense layer at the output. Stacked LSTM has 3 layers: 1 LSTM layer with 200 units, a second with 100 units and a dense layer with 1 output unit. Bidirectional LSTM is comprised of 3 layers; the first layer is a bidirectional LSTM with 200 units, while the second LSTM layer has 100 units. ConvLSTM has three layers. First is a ConvLSTM layer with 64 filters; the second is a flatten layer, and this is followed by a dense layer with 1 output. To evaluate the models, the present paper considers using the mean squared error (MSE) and root mean squared error (RMSE). The MSE and RMSE are the sum of the variance estimator and the squared basis of the estimator. These two are used to determine the model’s performance, and the result closest to zero shows which model performed better.
Mean Squared Error
MSE y , y ^ = 1 n samples i = 0 n samples 1   ( y i y ^ i ) 2
MSE = mean squared error
n = number of data points
y i = observed values
y ^ i = predicted values
The present paper collected stock price data from 1 January 2012 to 1 December 2019 on Vodacom Group Limited. Pandas-DataReader, a Pandas Python library, pulls all this stock data from Yahoo finance with the tag VOD.JO [27]. The DataReader pulled Vodacom’s opening price, high price, low price, volume, and closing price. The closing price was extracted from this data to make up the univariate dataset. The second dataset is comprised of three technical indicators: the three moving average, MACD, and Bollinger Bands. These indicators were considered due to their popularity in the equity trading space, as most traders use them. This is an excellent way to mimic what traders would use to enhance their decision making. This collected a total of 2040 rows and 17 columns. The data collected using the Python Pandas DataReader consisted of 2040 rows. The DataReader does most of the hard work in making sure the data is imported in a friendly format, ready for the modelling stage.
Before modelling, the last stage was data transformation to both the univariate and multivariate datasets. The present paper scaled the data using the sklearn MinMaxScaler Python library, which scales the data between zero and one.
The experiment on technical analysis extracted features from Vodacom using three technical indicators: the three moving average, MACD, and Bollinger Bands. In total, the 3 technical indicators yielded a total of 11 features.

3. The Developed Model

3.1. Data Summary

The data collected for Experiment 1 were split into three different datasets to test whether the addition of new data points and features extracted from the data helps in the quest to predict stock price movements. First, the news headlines dataset was introduced; this was purely comprised of news headlines collected from the Moneyweb site. The second dataset was the news headlines with sentiment analysis; this dataset had the addition of the sentiment feature extracted using the sentiment analysis model mentioned above. The last dataset was the news headlines and tweets with sentiment analysis; like the second dataset, this had sentiment extracted using the sentiment analysis model, but with an addition of tweets concatenated with the news headlines. The dataset mentioned above was used in the three experiments for the fundamental analysis. An 80/20 split was applied to the dataset for training and testing. Experiment 2 has two primary datasets used in all three sub-experiments: the univariate and multivariate datasets. The first dataset was comprised of the Vodacom Group Limited closing price pulled from Yahoo finance using Python Pandas Datareader library. The second dataset was the Vodacom Group Limited stock data, including the opening price, high price, low price, volume, closing price, and features extracted from three technical indicators, the three moving average, MACD, and Bollinger Bands. An 80/20 split was applied to the dataset for training and testing.

3.2. Experiments

The first experiment used a count vectoriser with ngram_range set to (1, 2). The count vectorizer model from the Scikit-learn Python library converts the text corpus into a matrix of token counts. The target column, together with the matrix of token counts, were used to train the models. Three forms of machine learning were considered in this experiment: the decision tree, random forest, and support vector machine.
In the second experiment, sentiment analysis was introduced to the dataset in Experiment 1.1. A sentiment feature was extracted from Vodacom’s news headlines, whether negative, positive, or neutral. Other additional features were introduced, including Vodacom’s opening, price, high price, low price, volume, and closing price. The scaled financial data and the sentiment feature’s polarity are used to train the four machine learning models: the decision tree, random forest, support vector machine, and linear discriminant analysis.
The last experiment introduced the last dataset, which was composed of the news headlines, tweets, and sentiment feature. The paper follows the same method as Experiment 1.2. A new sentiment feature was extracted from the news headlines and tweets. Vodacom’s opening, price, high price, low price, volume, and closing price are again included as features together with the extracted sentiment feature. The scaled financial data and the sentiment feature’s polarity are used to train the four machine learning models: the decision tree, random forest, support vector machine, and linear discriminant analysis.
In the first experiment, the LSTM sequence model and univariate time series forecasting were introduced. After transforming the univariate dataset, the dataset must be reshaped before presenting it to the models. LSTM models expect a three-dimensional data shape at the input in this order; these dimensions are samples (batch size), time steps (a point of observation in the samples), and features (an observation at a time step) [19]. The two hybrid architectures, the CNNxLSTM and ConvLSTM input shape, are four-dimensional; the dimensions are samples, subsequences, time steps, and features. The present study applied the correct type of reshaping to all six LSTM architectures.
Next, the multivariate dataset, consisting of Vodacom’s stock data and additional technical indicators as features, was introduced. The same transformation and reshaping were applied to the dataset with one change. The feature variable was altered, as this dataset now has more than one feature. The same six LSTM architectures are used in this experiment.
The last experiment introduces a different objective to that of the first two experiments. The same multivariate dataset from the previous experiment was used, but here, the encoder-decoder model with an altered multi-step dataset was presented. The data sequence was altered, as the model expects a multi-parallel time series.

3.3. Results from Fundamental and Technical Analysis Experiments

This section discusses results from the two main experiments, the fundamental and technical analysis experiments. We first begin with experiment one, which is split into three sub-experiments, whereby data is divided into three datasets for fundamental analysis: the news headlines dataset, the news headline and sentiment analysis dataset and lastly, the news headlines, tweets and sentiment analysis dataset. Experiment two is also split into three sub-experiments using three datasets, namely the univariate dataset, the multivariate dataset and, finally, the multi-step dataset for technical analysis.

3.3.1. Fundamental Analysis: Experiment 1

The main objective for Experiment 1 was to predict whether Vodacom’s stock would go up or down for 14 days by analysing and extracting sentiments from news headlines and tweets linked to Vodacom. The experiment used a comparison of four machine learning models in its quest to predict the stock movement. To evaluate the performance of all three experiments, the experiment used accuracy, precision, recall, the f1-score, and a confusion matrix.
Table 1 shows the results from Experiment 1.1; this experiment yielded the lowest accuracy in the three sub experiments. It can also be seen that the random forest model was the best performing model on the news headlines dataset in Experiment 1.1. Experiment 1.2 introduced the same objectives as Experiment 1.1, and a sentiment feature and Vodacom’s stock financial data were also introduced to the dataset. Experiment 1.2 returns a far better accuracy in all the models due to the abovementioned features. Linear discriminant analysis was the best performing model, with an accuracy of 94%, as seen in Table 2. The last experiment followed the same objective as the first two; in this experiment, tweets related to Vodacom were added onto the news headlines, the sentiment feature from this text, and Vodacom’s stock financial data. The experiment outperformed both experiments, and the linear discriminant analysis was also the best performing model, with an accuracy of 96%, as seen in Table 3.

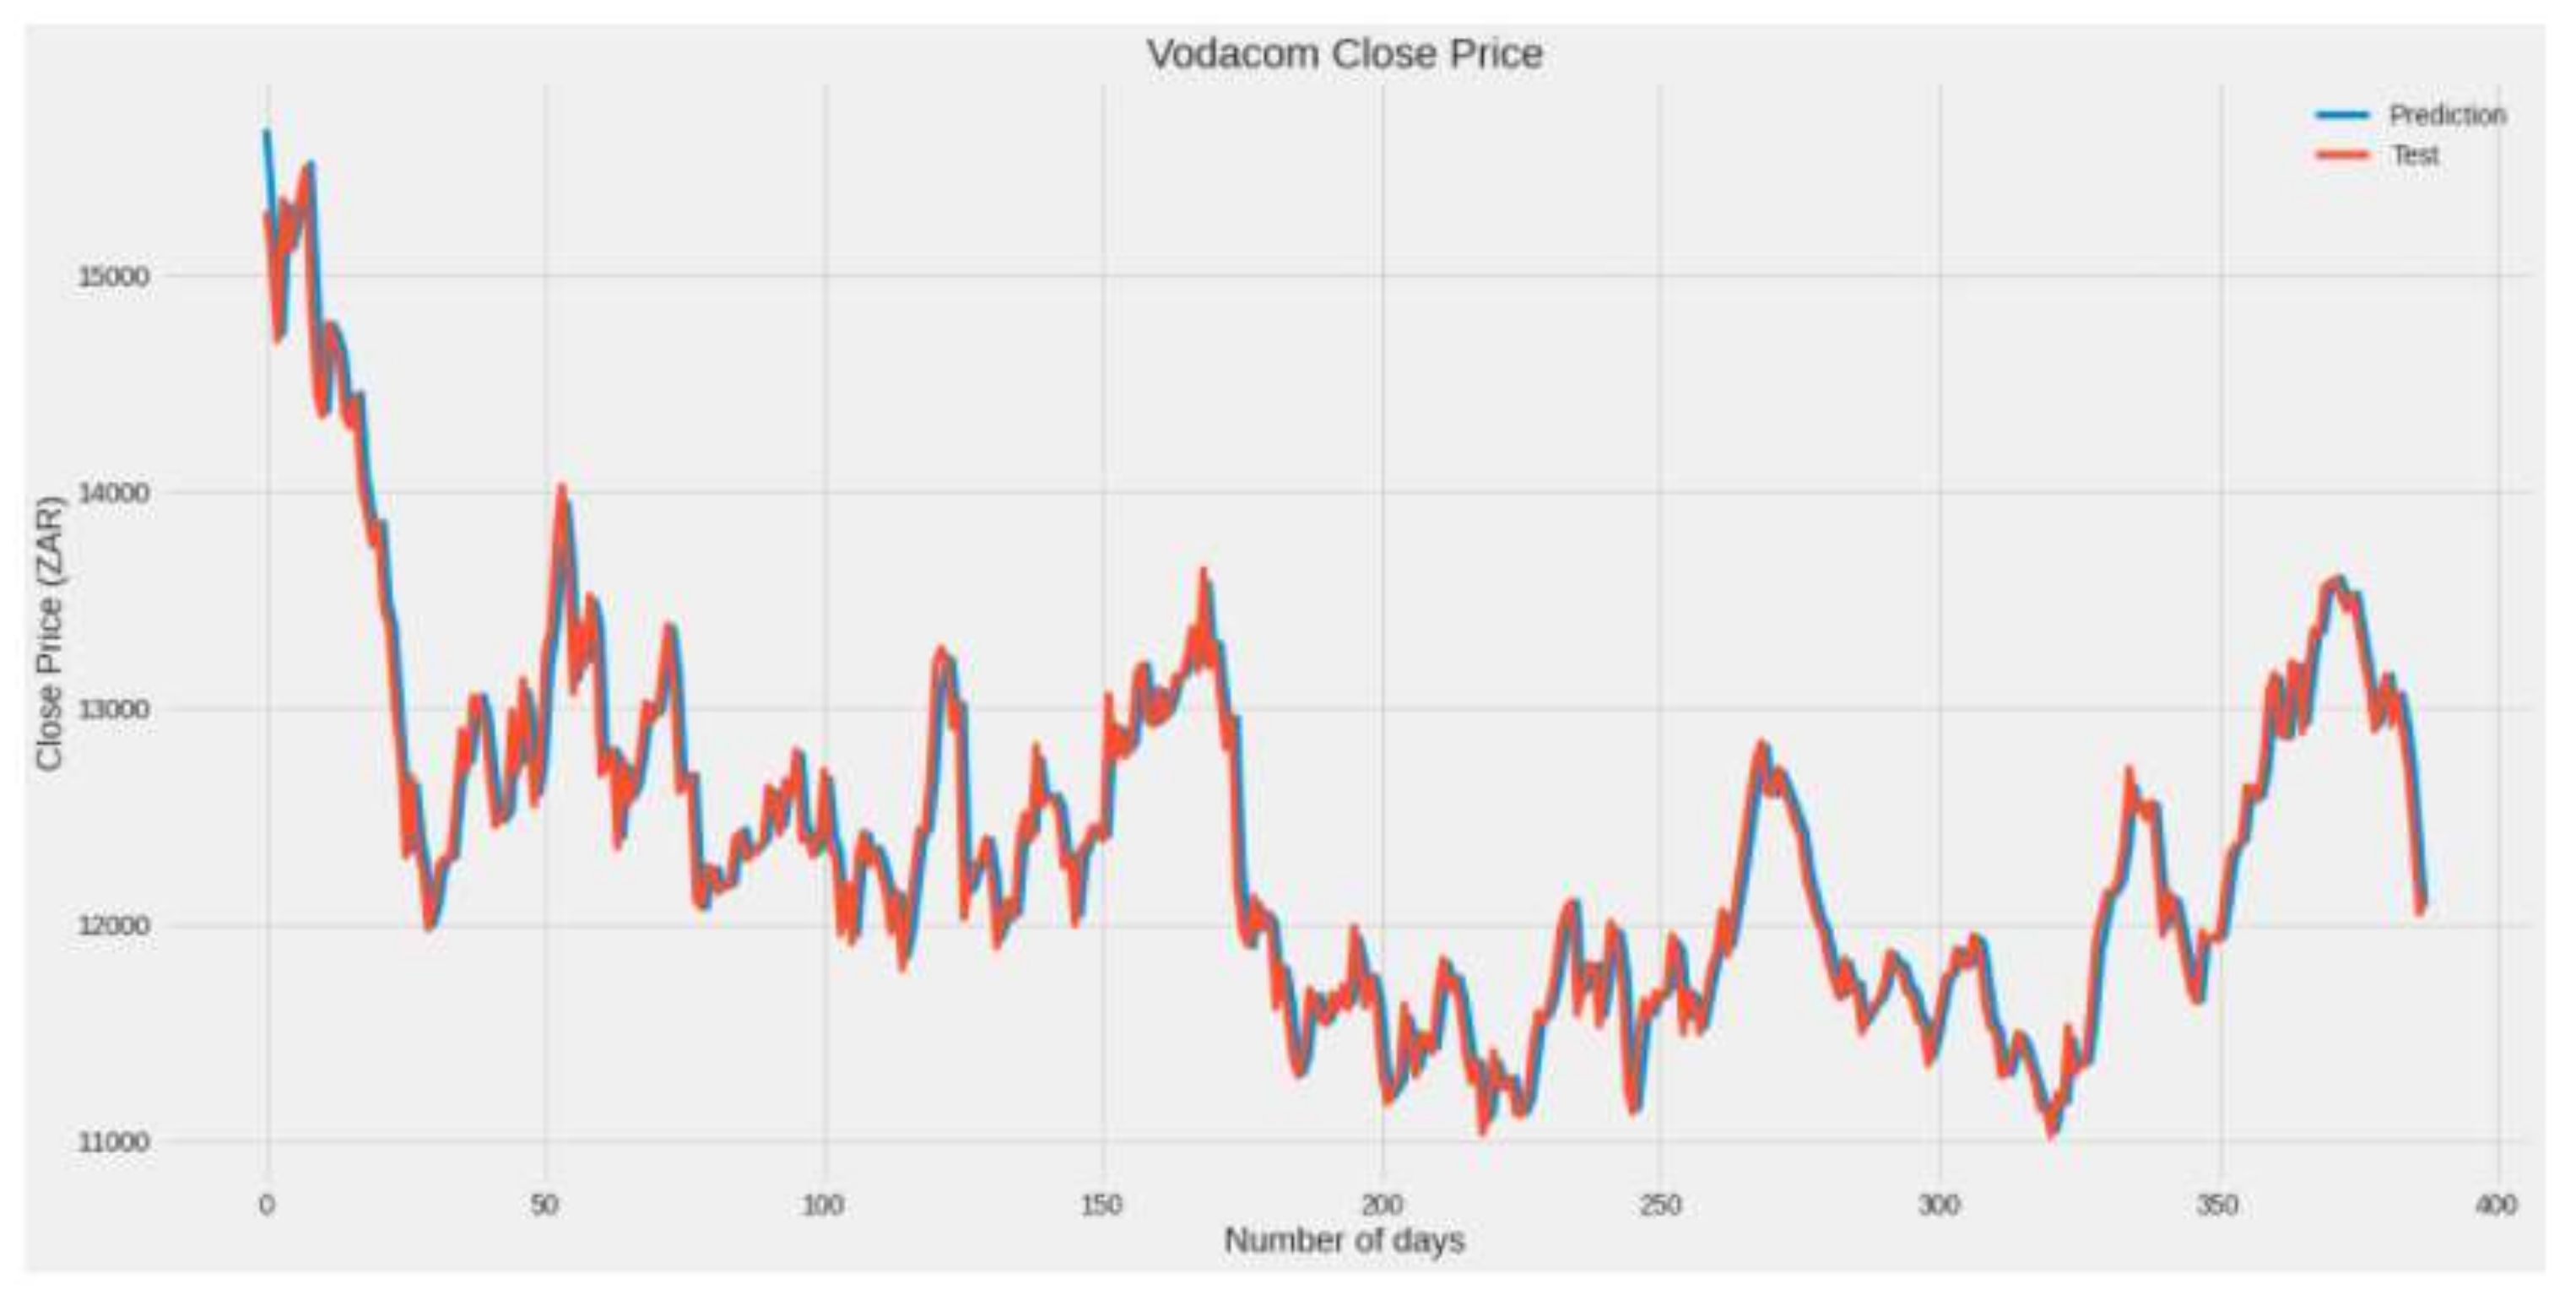
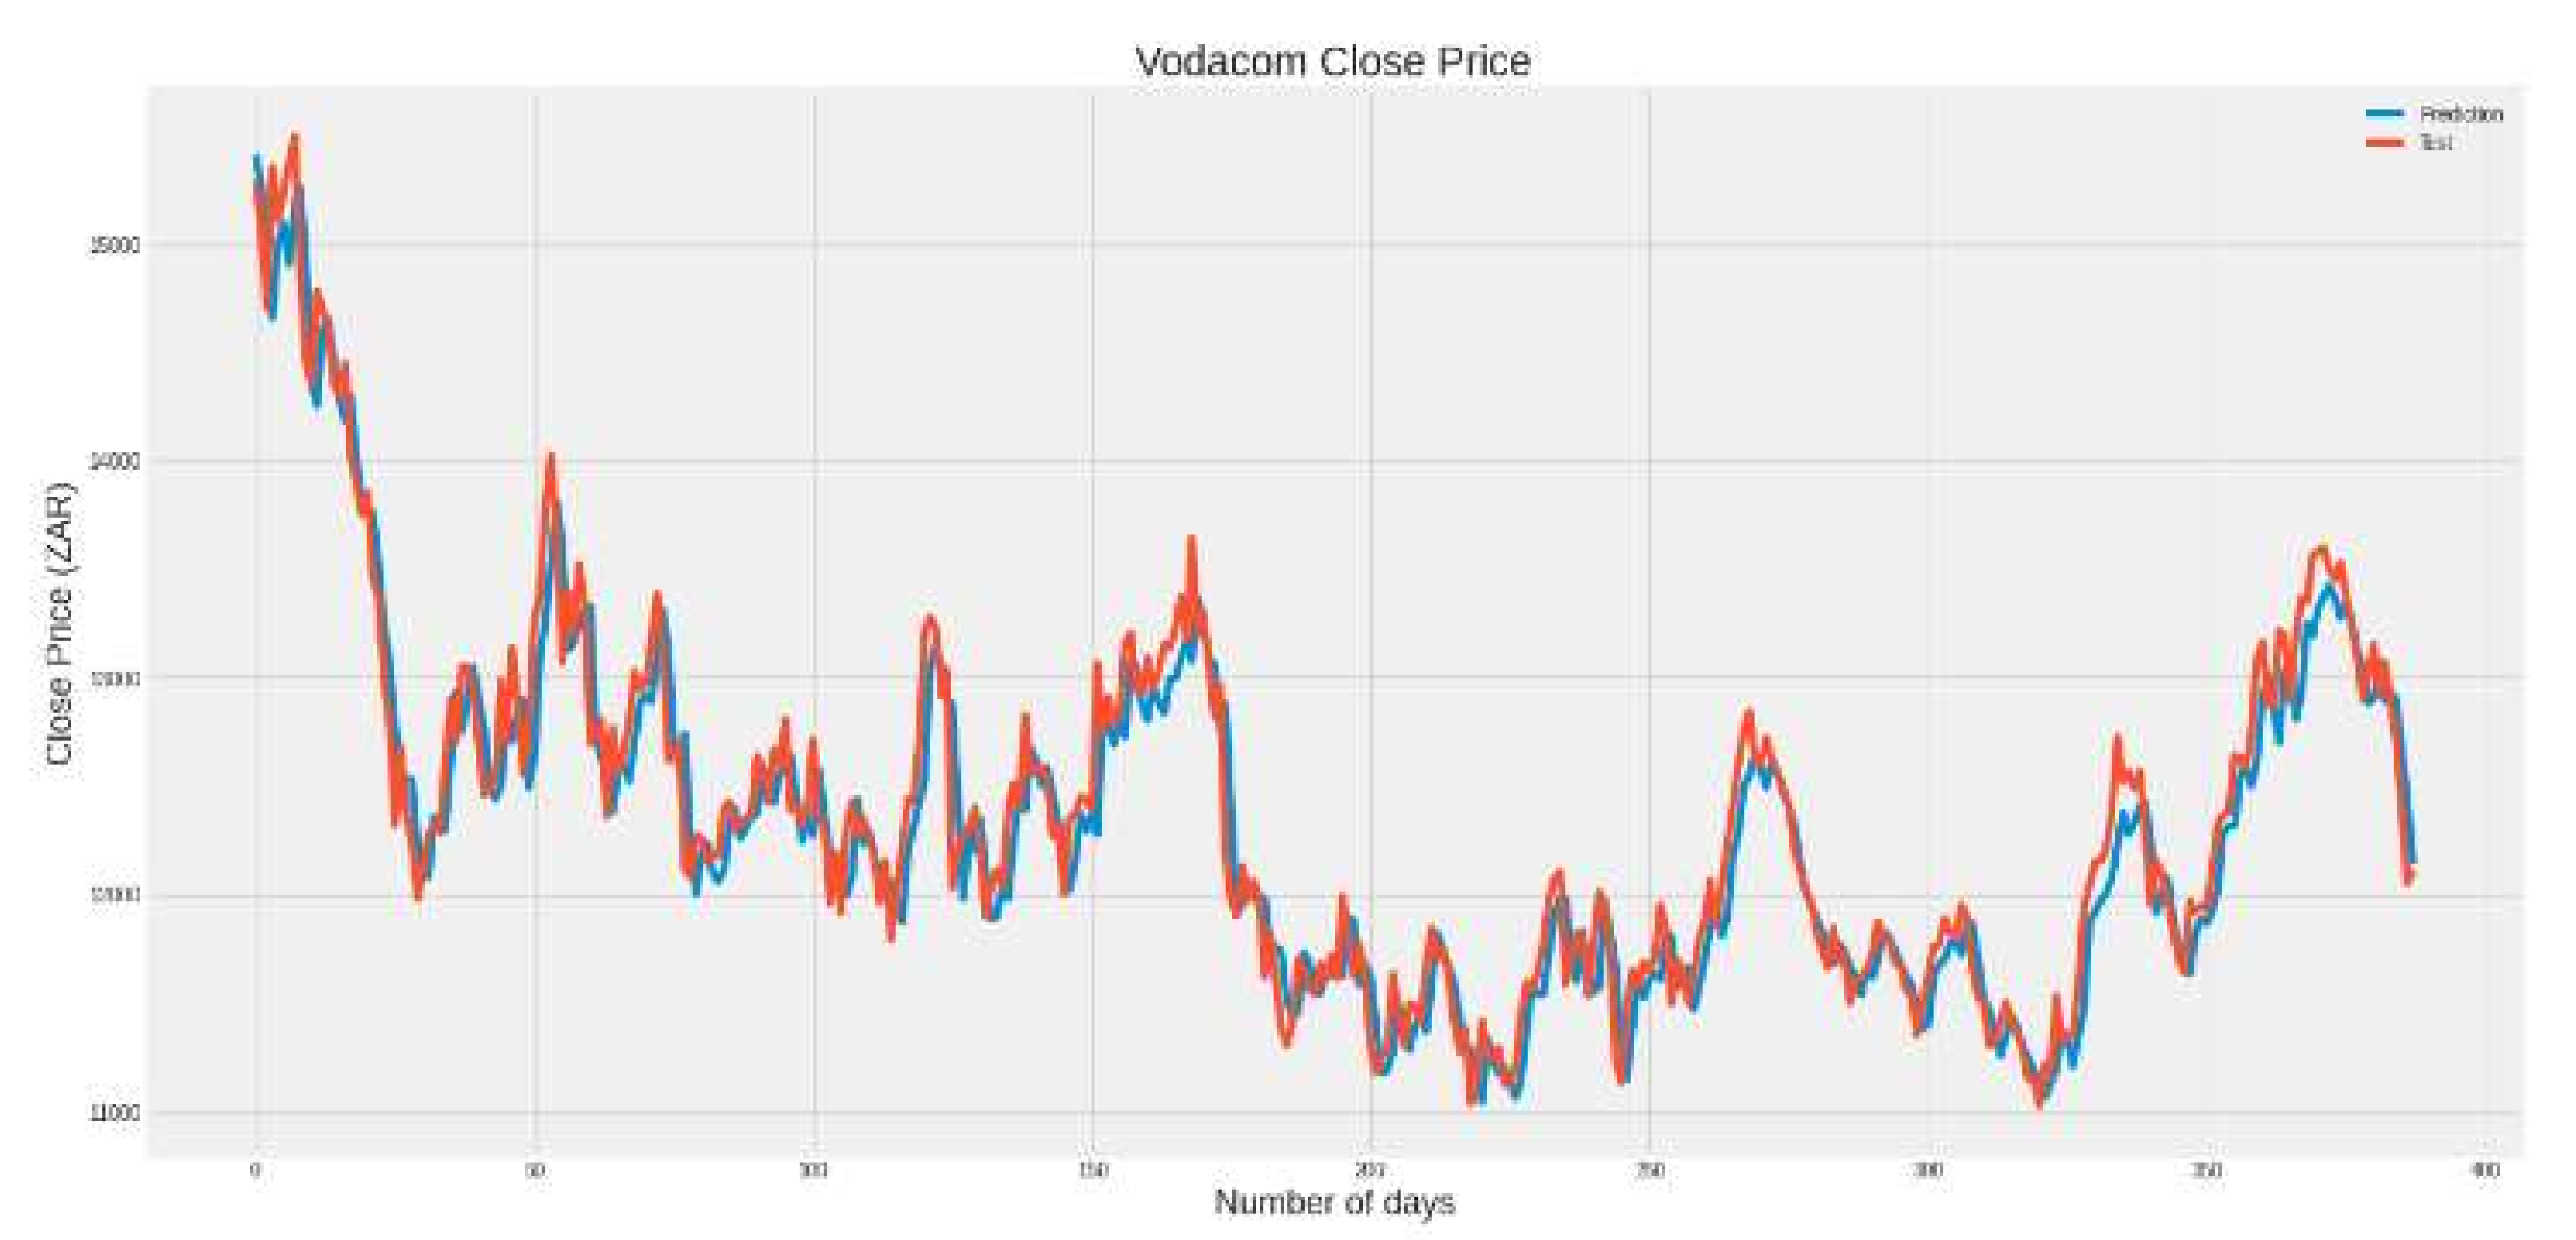
3.3.2. Technical Analysis: Experiment 2

The objective of Experiment 2 was to predict Vodacom’s closing price using 20 days of Vodacom data, thereby predicting day 21. The experiment introduced two datasets; the first was the univariate (closing price) dataset, and the second was the multivariate (technical indicators) dataset. Five LSTM architectures were presented in the first two experiments, and in the third, the encoder-decoder LSTM was introduced. All LSTM architectures applied the mean square error as their loss function and the Adam optimiser to update the weights during training. To evaluate the performance of the experiments, the mean squared error and root mean squared error were used.
Table 4 shows a summary of the results from Experiment 2.1. First, ordinary LSTM is introduced; this model has 2 layers with 200 units and a dense layer with 1 output. The model is trained for 100 epochs with a learning rate of 1   e 4 . The prediction results are displayed against the test data in Figure 1.
Stacked LSTM, which was the best performing model in this section, was comprised of 2 LSTM layers with 200 and 100 units each and a dense layer at the output. The model was trained for 100 epochs with a learning rate of 1   e 4 . The prediction results are displayed against the test data in Figure 2.
The third model was the bidirectional LSTM; this model was made up of three layers. The first layer had 200 units, the second had 100 units, and the last was a dense layer at the output. The model was trained for 100 epochs with a learning rate of 1   e 4 . The prediction results are displayed against the test data in Figure 3.
The convolutional neural network LSTM model has a total of eight layers, as seen in Figure 4. This model was trained for 100 epochs with a learning rate of 2   e 4 . The prediction results are displayed against the test data in Figure 5.
The last hybrid experiment is ConvLSTM, shown in Figure 6 with three layers. The first layer is a ConvLSTM with 64 filters; the second is a flatten layer and the third and final layer is a dense layer at the output. The model is trained for 100 epochs with a learning rate of 2   e 4 .
The second part of Experiment 2 introduces the multivariate dataset applied to the same five LSTM models as Experiment 2.1. With the addition of three technical indicators that generate 16 features to the dataset, there is a significant improvement in this experiment, as seen in Table 5. Experiment 2.2 follows the same process used in Experiment 2.1, and all models have the same architecture, including the same amount of layers, amount of epochs and the same learning rate as used in Experiment 2.1 to train the models.
The ordinary LSTM is the best-performing model in Experiment 2.2, with an RMSE of 75.54, as shown in Figure 7.
The stacked and bidirectional LSTM shows a significant improvement in RMSE compared to Experiment 2.1, with a final RMSE of 132.77 and 167.87. On the other hand, the hybrid models returned mixed results. The CNNxLSTM model Figure 8 saw an increase in RMSE, which resulted in impaired performance compared to experiment 2.1 in predicting the closing price. The ConvLSTM shows an improvement in prediction performance compared to the first experiment.
Overall, the performance of the models in Experiment 2.2 showed an improvement compared to the first experiment. This may be due to the addition of three technical indicators to the dataset.
The last experiment introduced the encoder-decoder LSTM model for the univariate and multivariate datasets. The MSE was used for the loss function to reduce the error in the prediction, and the Adam optimiser was used to update the weights during training. Like the first two experiments, MSE and RMSE were used to evaluate the model’s performance.
The experiment applied multi-step to the dataset and predicted five days of closing price stock data from an input of 20 days. The model was comprised of four layers: an LSTM with 200 units, a repeat vector and another LSTM layer with 200 units, and finally, a dense layer at the output. The model was trained for 100 epochs.
Regarding the univariate dataset, the encoder-decoder LSTM returned the best performance in prediction with an RMSE of 0.023. The model was also trained and tested on the multivariate dataset and returned an RMSE of 507.49; Table 6 and Table 7 show the five-day prediction results on the univariate and multivariate datasets.

4. Conclusions

The scientific novelty of the present research is that it aimed to construct a framework for intelligent media and technical analysis by forecasting stock price movement and closing prices using news headlines, tweets, and technical indicators. The paper first constructed a sentiment analysis classifier using BERT. A South African dataset was constructed by scraping South African-related tweets on Twitter; these were then concatenated with the Stanford Twitter Sentiment Corpus to create the training dataset. Two experiments were constructed: the fundamental analysis experiment to predict Vodacom’s closing price movement and the technical analysis experiment to predict Vodacom’s closing price. The first experiment was split into three sub-experiments which were run on three datasets. The first dataset was the news headlines dataset, the second was the news headlines and sentiment dataset, and the last was the news headlines, tweets, and sentiment dataset. These datasets were constructed by scraping news headlines related to Vodacom Group Limited on the Moneyweb site and tweets with the hashtag vodacom on Twitter.
The BERT-trained sentiment classifier extracted the sentiment feature from the collected text. The experiment included four machine learning models: support vector machine, linear discriminant analysis, decision tree, and random forest. The fundamental analysis experiment returned positive results, with the linear discriminant analysis being the best performing model in the experiment. The model achieved an accuracy of 96% in predicting Vodacom’s closing price movement. The second experiment, the technical analysis experiment, presented a different objective than the first. In this experiment, Vodacom’s closing price was predicted based on two datasets. The first dataset was constructed using Vodacom’s closing price and named the univariate dataset. The second dataset utilized Vodacom’s stock data, namely the opening price, high price, low price, volume, closing price, and features extracted from three technical indicators, the three moving average, MACD, and Bollinger Bands. This second dataset was called the multivariate dataset. Three sub-experiments were performed; the first two included five different LSTM architectures, namely ordinary LSTM, stacked (deep) LSTM, convLSTM, and CNNxLSTM. These LSTM architectures were chosen to compare and assess which model would perform the best on the data; as seen in the results, the most complex model was not always the best performing one.
The final experiment introduced the encoder-decoder LSTM architecture and yielded different outcomes between the univariate and multivariate datasets. For the first experiment, stacked LSTM archived the best results in predicting the closing price, with an RMSE of 220.83, and ordinary LSTM performed best with an RMSE of 75.54. The last experiment in Experiment 2 introduced encoder-decoder LSTM; this model achieved the best overall performance on the univariate dataset, with an RMSE of 0.023. In Experiment 1, the addition of the sentiment feature returned a significant improvement in predicting Vodacom’s stock price movement due to the introduction of a South African-based sentiment classifier. The second experiment yielded mixed results. Though the developed encoder-decoder LSTM achieved the best performance on the univariate dataset, the multivariate dataset achieved the best overall performance in predicting Vodacom’s closing price via the LSTM architectures.
The presented outcomes of the experiments provide beneficial results in answering the research questions by predicting price movements for fundamental analysis and predicting the closing price using technical indicators. The present research has shown that including a sentiment feature taken from the sentiment analysis classifier improves the prediction accuracy by a tremendous amount. The study has also seen the same results in the technical analysis experiment; the addition of technical indicators improves closing price predictions.
Future work shall consider extending the demographics of the dataset collected for the sentiment classification. The collection of more news headlines and tweets ensures that the training dataset is sufficiently large for the machine learning models to learn different underlying patterns in the data. The research could also include intraday prices to ensure the study has a larger dataset, as some of the models perform better with larger datasets. Other LSTM architectures could also be explored, such as deep LSTM with attention, encoder-decoder with attention, and sequence-to-sequence LSTM to improve overall performance. Recently, generative adversarial networks (GANs) have also been applied to time series data.

Author Contributions

Conceptualization, S.T.M.; Study design; Performed experiments and data analysis; Manuscript writing; review and editing, B.S.P.; Results review and critique; Manuscript review and editing W.D.; Study design evaluation; Results review and critique; Manuscript review and editing. All authors have read and agreed to the published version of the manuscript.

Funding

This research received no external funding.

Institutional Review Board Statement

Not applicable.

Informed Consent Statement

Not applicable.

Data Availability Statement

Not applicable.

Acknowledgments

The first author would like to thank Nedbank for its financial support.

Conflicts of Interest

The authors declare no conflict of interest.

References

  1. Yurieff, K. Snapchat Stock Loses $1.3 Billion after Kylie Jenner Tweet. CNN. 23 February 2018. Available online: https://money.cnn.com/2018/02/22/technology/snapchat-update-kylie-jenner/index.html (accessed on 1 May 2020).
  2. Bursztynsky, J. Tesla Shares Tank after Elon Musk Tweets the Stock Price Is ‘too high’. CNBC. 1 May 2020. Available online: https://www.cnbc.com/2020/05/01/tesla-ceo-elon-musk-says-stock-price-is-too-high-shares-fall.html (accessed on 18 February 2012).
  3. Dev, S.; Haruna, I.; Farhana, Z. Predicting the Effects of News Sentiments on the Stock Market. In Proceedings of the IEEE International Conference on Big Data (Big Data), Seattle, WA, USA, 10–13 December 2018. [Google Scholar]
  4. Wu, D.D.; Ren, R.; Liu, T. Forecasting Stock Market Movement Direction Using Sentiment Analysis and Support Vector Machine. IEEE Syst. J. 2019, 13, 760–770. [Google Scholar]
  5. Li, H.; Shen, Y.; Zhu, Y. Stock Price Prediction Using Attention-based Multi-Input LSTM. In Proceedings of the Machine Learning Research, Beijing, China, 14–16 November 2018; pp. 454–469. [Google Scholar]
  6. Minh, D.L.; Sadeghi-Niaraki, A.; Huy, H.D.; Min, K.; Moon, H. Deep Learning Approach for Short-Term Stock Trends Prediction Based on Two-Stream Gated Recurrent Unit Network. IEEE Access 2018, 6, 55392–55404. [Google Scholar] [CrossRef]
  7. Shi, X.; Chen, Z.; Wang, H.; Yeung, D.-Y.; Wong, W.-K.; Woo, W.-C. Convolutional LSTM network: A machine learning approach for precipitation nowcasting. In Proceedings of the 29th Annual Conference on Neural Information Processing Systems, Montreal, QC, Canada, December 2015. [Google Scholar]
  8. Lee, S.W.; Kim, H.Y. Stock market forecasting with super-high dimensional time-series data. Expert Syst. Appl. 2020, 161, 113704. [Google Scholar] [CrossRef]
  9. Livieris, I.E.; Pintelas, E.; Pintelas, P. A CNN–LSTM model for gold price time-series forecasting. Neural Comput. Appl. 2020, 32, 17351–17360. [Google Scholar] [CrossRef]
  10. Chen, X.; Xie, X.; Teng, D. Short-term Traffic Flow Prediction Based on ConvLSTM Model. In Proceedings of the 2020 IEEE 5th Information Technology and Mechatronics Engineering Conference (ITOEC 2020), Chongqing, China, 12–14 June 2020. [Google Scholar]
  11. Khan, W.; Ghazanfar, M.A.; Azam, M.A.; Karami, A.; Alyoubi, K.H.; Alfakeeh, A.S. Stock market prediction using machine learning classifiers and social media, news. J. Ambient Intell. Humaniz. Comput. 2020, 11, 1–24. [Google Scholar] [CrossRef]
  12. Khan, W.; Malik, U.; Ghazanfar, M.A.; Azam, M.A.; Alyoubi, K.H.; Alfakeeh, A.S. Predicting stock market trends using machine learning algorithms via public sentiment and political situation analysis. Soft Comput. 2020, 8, 11019–11043. [Google Scholar] [CrossRef]
  13. Vargas, M.R.; Anjos, C.E.M.d.; Bichara, G.L.G.; Evsukoff, A.G. Deep Learning for Stock Market Prediction Using Technical Indicators and Financial News Articles. In Proceedings of the 2018 International Joint Conference on Neural Networks (IJCNN), Rio de Janeiro, Brazil, 8–13 July 2018. [Google Scholar]
  14. Chen, C.-H.; Shih, P. A Stock Trend Prediction Approach based on Chinese News and Technical Indicator Using Genetic Algorithms. In Proceedings of the 2019 IEEE Congress on Evolutionary Computation, Wellington, New Zealand, 10–13 June 2019. [Google Scholar]
  15. Manning, C.D.; Raghavan, P.; Schütze, H. Introduction to Modern Information Retrieval, 2nd ed.; Cambridge University Press: Cambridge, UK, 2009. [Google Scholar]
  16. Izenman, A.J. Discriminant Analysis and Other Linear. In Modern Multivariate; Springer: New York, NY, USA, 2013; pp. 237–238. [Google Scholar]
  17. Tan, P.-N.; Steinbach, M.; Kumar, V. Classification: Basic Concepts, Decision Trees, and Model Evaluation. In Introduction to Data Mining; University of Minnesota: Minnesota, MN, USA, 2006; pp. 145–205. [Google Scholar]
  18. Cutler, A.; Cutler, D.R.; Stevens, J.R. Random Forests. Mach. Learn. 2011, 45, 157–176. [Google Scholar]
  19. Olah, C. Understanding LSTM Networks. Github. 27 August 2015. Available online: http://colah.github.io/posts/2015-08-Understanding-LSTMs/ (accessed on 2 June 2020).
  20. Henrique, J. Get Old Tweets Python. 21 November 2018. Available online: https://pypi.org/project/GetOldTweets3/ (accessed on 28 January 2020).
  21. Go, A.; Bhayani, R.; Huang, L. Twitter Sentiment Classification using Distant Supervision. CS224N Proj. Rep. Stanf. 2009, 1, 2009. [Google Scholar]
  22. Devlin, J.; Chang, M.-W.; Lee, K.; Toutanova, K. BERT: Pre-training of Deep Bidirectional Transformers for Language Understanding. arXiv 2018, preprint. arXiv:1810.04805. [Google Scholar]
  23. Face, H. BERT. Hugging Face. 2020. Available online: https://huggingface.co/transformers/model_doc/bert.html (accessed on 10 September 2020).
  24. Markets, A. An Introduction to Fundamental Analysis in Forex. Admiral Markets. 2 September 2020. Available online: https://admiralmarkets.com/education/articles/forex-analysis/introduction-to-forex-fundamental-analysis (accessed on 14 September 2020).
  25. Ronaghan, S. Data Preparation for Machine Learning: Cleansing, Transformation & Feature Engineering. Towards Data Science. 20 September 2019. Available online: https://towardsdatascience.com/data-preparation-for-machine-learning-cleansing-transformation-feature-engineering-d2334079b06d (accessed on 26 August 2020).
  26. Scikit Learn. Sklearn. Preprocessing. MinMaxScaler. Scikit Learn. 4 August 2007. Available online: https://scikit-learn.org/stable/modules/generated/sklearn.preprocessing.MinMaxScaler.html (accessed on 26 August 2020).
  27. The PyData Development Team. Pandas-datareader. PyData. 21 August 2020. Available online: https://pandas-datareader.readthedocs.io/en/latest/ (accessed on 21 August 2020).
Figure 1. Ordinary LSTM Experiment 2.1.
Applsci 12 00719 g001
Figure 2. Stacked LSTM Experiment 2.1.
Applsci 12 00719 g002
Figure 3. Bidirectional LSTM Experiment 2.1.
Applsci 12 00719 g003
Figure 4. CNNxLSTM.
Figure 4. CNNxLSTM.
Applsci 12 00719 g004
Figure 5. CNNxLSTM Experiment 2.1.
Applsci 12 00719 g005
Figure 6. ConvLSTM Experiment 2.1.
Applsci 12 00719 g006
Figure 7. Ordinary LSTM Experiment 2.2.
Applsci 12 00719 g007
Figure 8. CNNxLSTM LSTM Experiment 2.2.
Applsci 12 00719 g008
Table 1. Experiment 1.1 results.
ModelsAccuracy
Support vector machine44%
Decision tree46%
Random forest49%
Table 2. Experiment 1.2 results.
ModelsAccuracy
Support vector machine54%
Decision tree75%
Random forest66%
Linear discriminant analysis94%
Table 3. Experiment 1.3 results.
ModelsAccuracy
Support vector machine49%
Decision tree82%
Random forest74%
Linear discriminant analysis96%
Table 4. Experiment 2.1 results.
ModelsOrdinary LSTMStacked LSTMBidirect LSTMCNN LSTMConv
LSTM
MSE48,991.8948,766.5248,946.153,773.4754,060.72
RMSE221.34220.83221.23231.8232.51
Table 5. Experiment 2.2 Results.
ModelsOrdinary LSTMStacked LSTMBidirect LSTMCNN LSTMConv
LSTM
MSE5706.5717,627.828,18162,873.739295.55
RMSE75.54132.77167.87250.7596.41
Table 6. Experiment 2.3 results.
Test Data (ZAR)Predictions (ZAR)
12,90112,901.025
12,70012,700.019
12,37612,376.02
12,05112,051.023
12,11212,112.027
Table 7. Experiment 2.3 results.
Test Data (ZAR)Predictions (ZAR)
12,90112,959.947
12,70012,939.186
12,37612,875.924
12,05112,830.503
12,11212,801.53
Publisher’s Note: MDPI stays neutral with regard to jurisdictional claims in published maps and institutional affiliations.

