Next Article in Journal
Metal Accumulation Properties of Eight Traditionally Utilized Nutritional Plants and Their Potential as Suitable Crops for Cultivation on Acidic Soils of the Northern Province Uíge, Angola
Next Article in Special Issue
Chinese Neural Question Generation: Augmenting Knowledge into Multiple Neural Encoders
Previous Article in Journal
Food Products with High Antioxidant and Antimicrobial Activities and Their Sensory Appreciation
 
 
Correction published on 28 October 2022, see Appl. Sci. 2022, 12(21), 10925.
Article

Intelligent Educational Evaluation of Research Performance between Digital Library and Open Government Data

1
Department of Civil and Construction Engineering, Chaoyang University of Technology, Taichung 41349, Taiwan
2
Department of Computer Science and Information Engineering, National Taichung University of Science and Technology, Taichung 40401, Taiwan
*
Author to whom correspondence should be addressed.
Appl. Sci. 2022, 12(2), 791; https://doi.org/10.3390/app12020791
Submission received: 14 November 2021 / Revised: 10 January 2022 / Accepted: 12 January 2022 / Published: 13 January 2022 / Corrected: 28 October 2022
(This article belongs to the Special Issue Technologies and Environments of Intelligent Education)

Abstract

:
This study evaluates institutional research performance in benchmark technological universities in Taiwan through intelligent research databases (SciVal) in digital libraries with Ministry of Education open data to explore the performance of research indicators and the research trend of topic clusters to ascertain accountability for decision makers. The research performance of eight benchmark technological universities in Taiwan is compared in this study. In addition, the trends in research topics in the top 10% of journals are explored. Descriptive statistics, correlation, ANOVA, and the Boston Consulting Group matrix were used in this study. Research personnel, publications, productivity, total citations, number of international collaborations, and academic research income in 2018 significantly positively correlated with each other. From 719 records of research topics, topic clusters and school types are the significant factors in research outputs. Biosensors, electrodes, and voltammetry are the leading topic clusters in the research trend. The topic cluster of decision-making, fuzzy sets, and models has the best growth rate in the SciVal results. This analysis provides useful insights to policymakers to improve institutional administration and research resource allocation.

1. Introduction

Accountability in higher education plays an important role in evaluating production, and national rankings are part of performance-based accountability [1,2]. There are several critical indexes of performance evaluation, such as administration, teaching, research, students’ learning outcomes, society responsibility, and financial sustainability, to help decision makers to allocate resources in annual accountability reports. Through surveys and analyses, institutions share their performance with the public and link institutional performance with budget allocation [3,4,5]. According to some certified world university rankings, such as the Quacquarelli Symonds (QS) World University Rankings, the Times Higher Education (THE) World University Rankings, the Academic Ranking of World Universities (ARWU), and the Webometrics Ranking of World Universities, institutional performance can be evaluated effectively. The QS World University Rankings is more focused on reputation surveys, while the ARWU emphasizes the outcome of outstanding researchers; the ranking applies indicators in teaching (the learning environment), research (volume, income, and reputation), citations (research influence), international outlook (staff, students, and research), and industry income (research from industry and knowledge transfer) to cover all university activities [6]. The Times’ measures of research influence, output, revenue, and reputation collectively account for 62.5% of the ranking. Compared to other rankings, the Times’ methodology offers a sharper picture of a university’s capabilities and is praised for having a new, improved ranking methodology since 2010. It is described as one of the most influential international university rankings [7,8,9]. Their data are trusted by governments and institutions and are also beneficial to parents and students in deciding upon which university to choose.
In Taiwan, the Ministry of Education (MOE) collects and publishes five types of institutional data (student, teaching, research, institutional management, and finance) that are accessible to the public each year to offer the public the right to understand the status of each university in comparison to other universities. From the open data on websites, some institutional information and statistics are easily collected; however, the MOE open database only discloses the research income [10]. Neither the volume of publications nor the citations can be found easily. Therefore, the initial survey of the THE and MOE databases was only analyzed via four indicators (teaching, research income, international outlook, and industry income) in Taiwan [11].
To solve the problem of insufficient information in open databases, it is necessary to apply data-mining techniques such as data visualization of digital libraries in academic university library services [12]. In addition to physical libraries, digital libraries have primarily used functions including resource exploration, databases, e-journals, e-books, web resources, and VOD media. Most researchers have analyzed and searched the literature from a digital library database. As an institution procures the database from digital publishers, its internal users have the right to explore the references or the full text in the resources. SciVal is a useful database in a digital library, and it can help us to evaluate indicators in THE, including the number of publications, proportion of publications with international collaboration, and proportion of publications with academic collaboration. Through intelligent educational databases in a digital library, some hidden information that could help in understanding the competition among universities all over the world may be disclosed. To explore the highest weight of research indicator in the THE rankings, we link data from the SciVal database in digital libraries and open data from the MOE to explore research (volume and income) and citations. The interdisciplinary survey method is known to some researchers, who understand government open access and intelligent libraries [13,14]; therefore, the intelligent educational database plays an important role in research. In addition to the quantity of the research, the benchmark scholars’ publications in the top 10% of journals could be presented in terms of the quality of research. According to the classification in the SciVal database, the market share and market growth rate of the topic clusters were collected among the benchmark universities to detect the recent research trends.
According to the MOE, Taiwan, there are different educational resources for general universities and universities of science and technology. Because the accountability and institutional research performance comparisons with the case university belong to the universities of science and technology, the samples from general universities have been disregarded in this institutional research. Besides this, analysis of research performance within technological education will significantly benefit the development of high-technological industries. Moreover, the MOE’s Higher Education Sprout Project in Taiwan evaluated research and internationalization funding according to the global competition among universities; therefore, evidence-based analysis is deemed to be necessary in higher education [15]. In summary, the objective of this study is to evaluate institutional research performance in benchmark technological universities in Taiwan through intelligent research databases (SciVal) in digital libraries with MOE open data and to explore the performance of research indicators and the research trend of topic clusters to ascertain accountability for decision makers.
This paper is organized as follows: In Section 2, the factors affecting research performance, the THE ranking, SciVal database, and Boston Consulting Group (BCG) Matrix are included; Section 3 describes the research samples, procedure, variables, and methods analysis; In Section 4, basic statistics in outcomes of research indicators, inferential statistics (correlation), topic cluster, and BCG matrix analysis are presented; finally, discussion, implications, recommendations, and conclusion are presented in Section 5 and Section 6, respectively.

2. Literature Review

2.1. Research Performance

Several factors affect research production, such as financial funding [16,17,18], teaching quality [19], and leadership [20]. In addition to the number of publications, the citations and indicators of journal articles have also been mentioned by some researchers [21,22]. The benchmark quantitative and qualitative data could be taken into account through the research comprehensive assessment. Moreover, collaboration between the local and international scholars is discussed in research evaluation [23,24,25]. It indicates the degree of internationalization of the institution and the degree to which it promotes academic exchange by cooperation. The strengths and weaknesses of research influence the development of government support and institutional reputations; therefore, many universities have emphasized the importance of a link between research performance and institutional rank [26,27,28]. Therefore, in turn, research evaluation has become a critical factor among global universities’ ranking and hence must be discussed further.

2.2. THE Ranking

Global university rankings can allow countries to see their universities compete with the world’s best and expect a rise in rankings due to the link between education and prosperity [9]. Rankings help raise a country’s overall academic reputation and have therefore become the basic measure of quality in the global university marketplace to improve universities’ sustainability. In addition, because of the trend of fewer onshore enrolments, the global ranking of a university plays an important role in offshore enrolments that improve the institutional revenue [29]. The THE Ranking is often considered to be one of the most widely observed university rankings, compared with the ARWU and the QS World University Rankings [9,30,31], as well as one of the most mance indicator research carries over half the total weight, and hence, exploring the qinfluential international university rankings [7,8]. Based on the THE methodology, the perforuality and quantity of research indicators is crucial.

2.3. Intelligent Educational Database

The SciVal database provides information on 27 major disciplines of journal classification, with a total of 8500 data points in institutions’ databases in the electronic library. SciVal evaluation indicators include the number of articles in the field of competition, the number of institutions ranked first in five years, output comparison values, citation ratios, and innovation indicators. In ordinary databases, only basic information, including abstracts or the full texts of manuscripts, is made available. The research intelligence of the SciVal database helps count publications in Scopus to visualize research performance, benchmarks institutional progress, and develops collaborative partnerships, as well as analyzes research trends [32]. In addition, the topic prominence could be clustered from big data and citation links; therefore, it is called an intelligent educational database. Baskaran (2013) used SciVal to analyze the research productivity of universities, using quantitative research to conduct a statistical analysis of various cooperation relationships from countries, institutions, and topics [23]. Yu et al. (2016) compared the ResearchGate, SciVal databases, and research products through a correlation matrix analysis. Combining the QS World Ranking and the research output, they found that the performance of research output in the database is positively correlated with world ranking performance [33]. Dresbeck (2015) found that SciVal helps us to answer recruitment, organizational, and investment issues and allows us to allocate institutional resources reasonably [34]. Thus, this study uses SciVal and open data in MOE to illustrate the research output and calculate and analyze the quantitative indicators of the statistical data in its database.

2.4. BCG Matrix

The BCG matrix is one of the most iconic strategic frameworks and portfolio analysis tools for determining the growth–share matrix, developed by the management consulting firm BCG in the mid-1970s [35,36]. It is widely used as a corporate portfolio planning and management tool by practitioners [37,38]. It is a 2 × 2 matrix, and Allio (2006) called it a way to “milk the cows, divest the dogs, invest in the stars, and analyze the question marks [39]”. This strategy is applied in consulting firms, business schools, and business media [40]. Sheoran et al. (2018) established the growth and research direction for it in the field of marketing for researchers; therefore, this study uses the BCG matrix to explore the growth and market share of research topics in the top 10% of journals to evaluate their qualitative performance [41].

3. Methodology

3.1. Research Variables and Procedure

To be considered for evaluation in the THE Ranking, every institution must meet seven criteria: 1. sufficient publications, 2. undergraduate students, 3. subject breadth, 4. sufficient data in overall submission, 5. sufficient overall values, 6. at least one subject submission, and 7. not featured in custom exclusions list. Specifically, more than 1000 papers (more than 150 publications a year) must have been published over the previous 5 years. An institution is required to teach at an undergraduate level (there is an insufficient number of postgraduate-only institutions in the ranking). Regarding subject breadth, each institution must have published research in at least one applicable subject area, and the research output must not have focused on a single field. If more than two of the critical values including academic staff, international academic staff, research staff, students, international students, undergraduate degrees awarded, doctorates awarded, institutional income, research income, research income from industry, and commerce are null or not supplied, the institutions are excluded from the ranking. Finally, institutions must not be in the custom exclusions list of the THE.
The data in the MOE open database used in this study were collected from August 2018 to July 2019 (the 2018–2019 academic year). The SciVal data used in this study were collected from 2017 to 2019. Thereafter, we analyzed the rankings using different performance indicators, as shown in Table 1. To understand the number of research faculty and their research income in each institution in Taiwan, data were collected and computed from the MOE open database. In addition, the volume and international outlook of research requires an intelligent educational database (SciVal) in the digital library to help us evaluate the research performance. Regarding the research indicator of the MOE database in Taiwan, data on only research income could be collected from the open data web. Hence, the researcher collected data for the public and private universities regarding their research resources from government, industries, and the self during the 2018–2019 academic year. Furthermore, the researcher logged into the digital database (SciVal) in a digital library and searched for recent statistics regarding publications in Scopus. As complete data for the 2017–2019 period were available, the 3 years’ data were downloaded for the research indicators, and their trends and development were subsequently observed. Additionally, the database included three meaningful indicators—namely, the number of publications, number of citations of the superior subject, and proportion of publications with international collaboration. The data were saved in Excel files, so that they could be used according to the research objectives. After checking for any missing data, we fed the raw data from the MOE open database, the SciVal digital database in the library, and the THE World University Ranking indicators in Tableau to conduct further analyses.

3.2. Benchmark Samples

Taiwan is experiencing rapid growth and innovation in the research and development of high-technology industries. Therefore, exploring research performance within technological education will be of significant benefit. In additional to the different funding sources in MOE in Taiwan between general universities and universities of science and technology, the accountability and institutional research performance comparison with the case university belong to the universities of science and technology. Therefore, the samples from general universities have been disregarded in this institutional research. Moreover, the characteristics of higher education in Taiwan are also clustered into teaching universities and research–doctoral universities. The teachers in doctoral universities, besides teaching courses, are required to submit research proposals to attract funding, carry out publications, supervise students for research. However, the teachers in teaching universities focus on student–instructor relationships and innovative pedagogies; therefore, the output of research is insufficient in the statistical analysis of the selection. A total of 83 public and private universities of science and technology were operational in Taiwan during the 2018–2019 academic year. However, not all institutions were selected in this study. The first inclusion criterion is that the technological university is part of the THE Ranking list in 2018 and 2019. Then, according to the research threshold (150 outputs each year and 1000 publications over 5 years) in the THE Ranking, only the top eight technological universities are selected and used as benchmark samples in this study. According to the Pareto principle, roughly 80% of consequences come from 20% of causes [42]. The leading performance among the samples played a vital role in this research.
To avoid disclosing author information, the samples were coded as symbols according to the school type (National: N; Private: P) and numbers based on geography (north, center, south) (N1-N5; P1-P3). From the THE World University Ranking (collected in 2017), there are five technological universities in the 1001+ list, including N1, N2, N3, N4, and P2. After 2017, N5 was merged with three national universities of science and technology in south Taiwan, and its manpower is currently the highest among the eight universities. P1 and P3 met the quantities of publication threshold, and hence, there was a total of eight samples in this study.

3.3. Analysis Methods

The data were analyzed through basic statistical analysis, correlation, ANOVA, and BCG matrix. Regarding the inferential test of the correlation analysis, the research indicators could be evaluated regarding the direction of their effects on each other. The market share and market growth rate of the topic clusters could be collected from the SciVal database among the eight sample schools. In total, there are 719 records of topics in the top 10% of journals from 2017–2019. The topic was coded as cluster ID, scholarship output, market share, and market growth. In ANOVA, the independent variables include the topic cluster, school, and type (national/private) of institution, and the dependent variable is the scholarship output. The hypotheses were equal in topic cluster, school, and type. We can detect the significant variables related to research topics and discuss their trends (cows, dogs, stars, and question marks) in the BCG matrix.

4. Results

The outcomes of research indicators, including the number of publications, productivity, number of citations of the superior subject, and research income, as well as the international outlook indicator that consisted of the proportion of publications with international collaboration were presented as follows.

4.1. Research Indicators in the THE Ranking

Based on the number of publications, citations, collaborations, and internationalization, the top four technological universities were N1, N2, N5, and N4 from 2017 to 2019 in Table 2. Regarding private technological universities, the rank of research performance between publications and collaborations is P2, P1, and P3. However, because of higher internalization in P1 than in P2, the citation in P1 is higher than in P2.

4.2. Productivity and Research Income

The productivity of the research output performance was measured by the PH ratio. The PH ratio is the number of publications over total research personnel who publish research articles. Research manpower includes tenure track teachers, project teachers, and graduate students. The PH ratios of the eight schools are listed in Table 3. P1, N1, and P2 were the top three technological universities in Taiwan in terms of PH ratio.
Based on the MOE database in 2018, N1, N2, and N5 were the top three universities in terms of research income in Table 3. National universities received more resources from government, industries, and self-institutions than private universities.

4.3. Correlation

In Taiwan, there were 83 technological universities in 2018. To conduct the correlation analysis, the top 30 samples of SciVal are listed in Table 4. The number of research personnel, publications, total citations, international collaboration, and research income is analyzed in the correlation. The results showed that personnel, publication, citation, international collaboration, and research income were significantly positively correlated with each other. In particular, the coefficient between international collaboration and citation of papers is 0.989.

4.4. Topic Cluster

The scholar outputs of topic clusters are over 10 papers, and these are accessed in the top 10% of journals. The top three topics in eight sample schools are TC 0: Algorithms; Computer Vision; Models (Mean = 66); TC 8: Photocatalysis; Photocatalysts; Solar Cells (Mean = 62); TC 13: Electric Potential; Electric Inverters; DC–DC Converters (Mean = 55), TC 30: Secondary Batteries, Electric Batteries, Lithium Alloys (Mean = 47), and TC 128: Biosensors; Electrodes; Voltammetry (Mean = 39) (Table 5). Schools N1, N2, and N5 performed better than other schools. The average output in national universities (13) is better than the average output in private schools (7).
Based on ANOVA, the variables of topic cluster, school (eight samples), and type (national/private) are significantly different (p-value < 0.05) in Table 6.

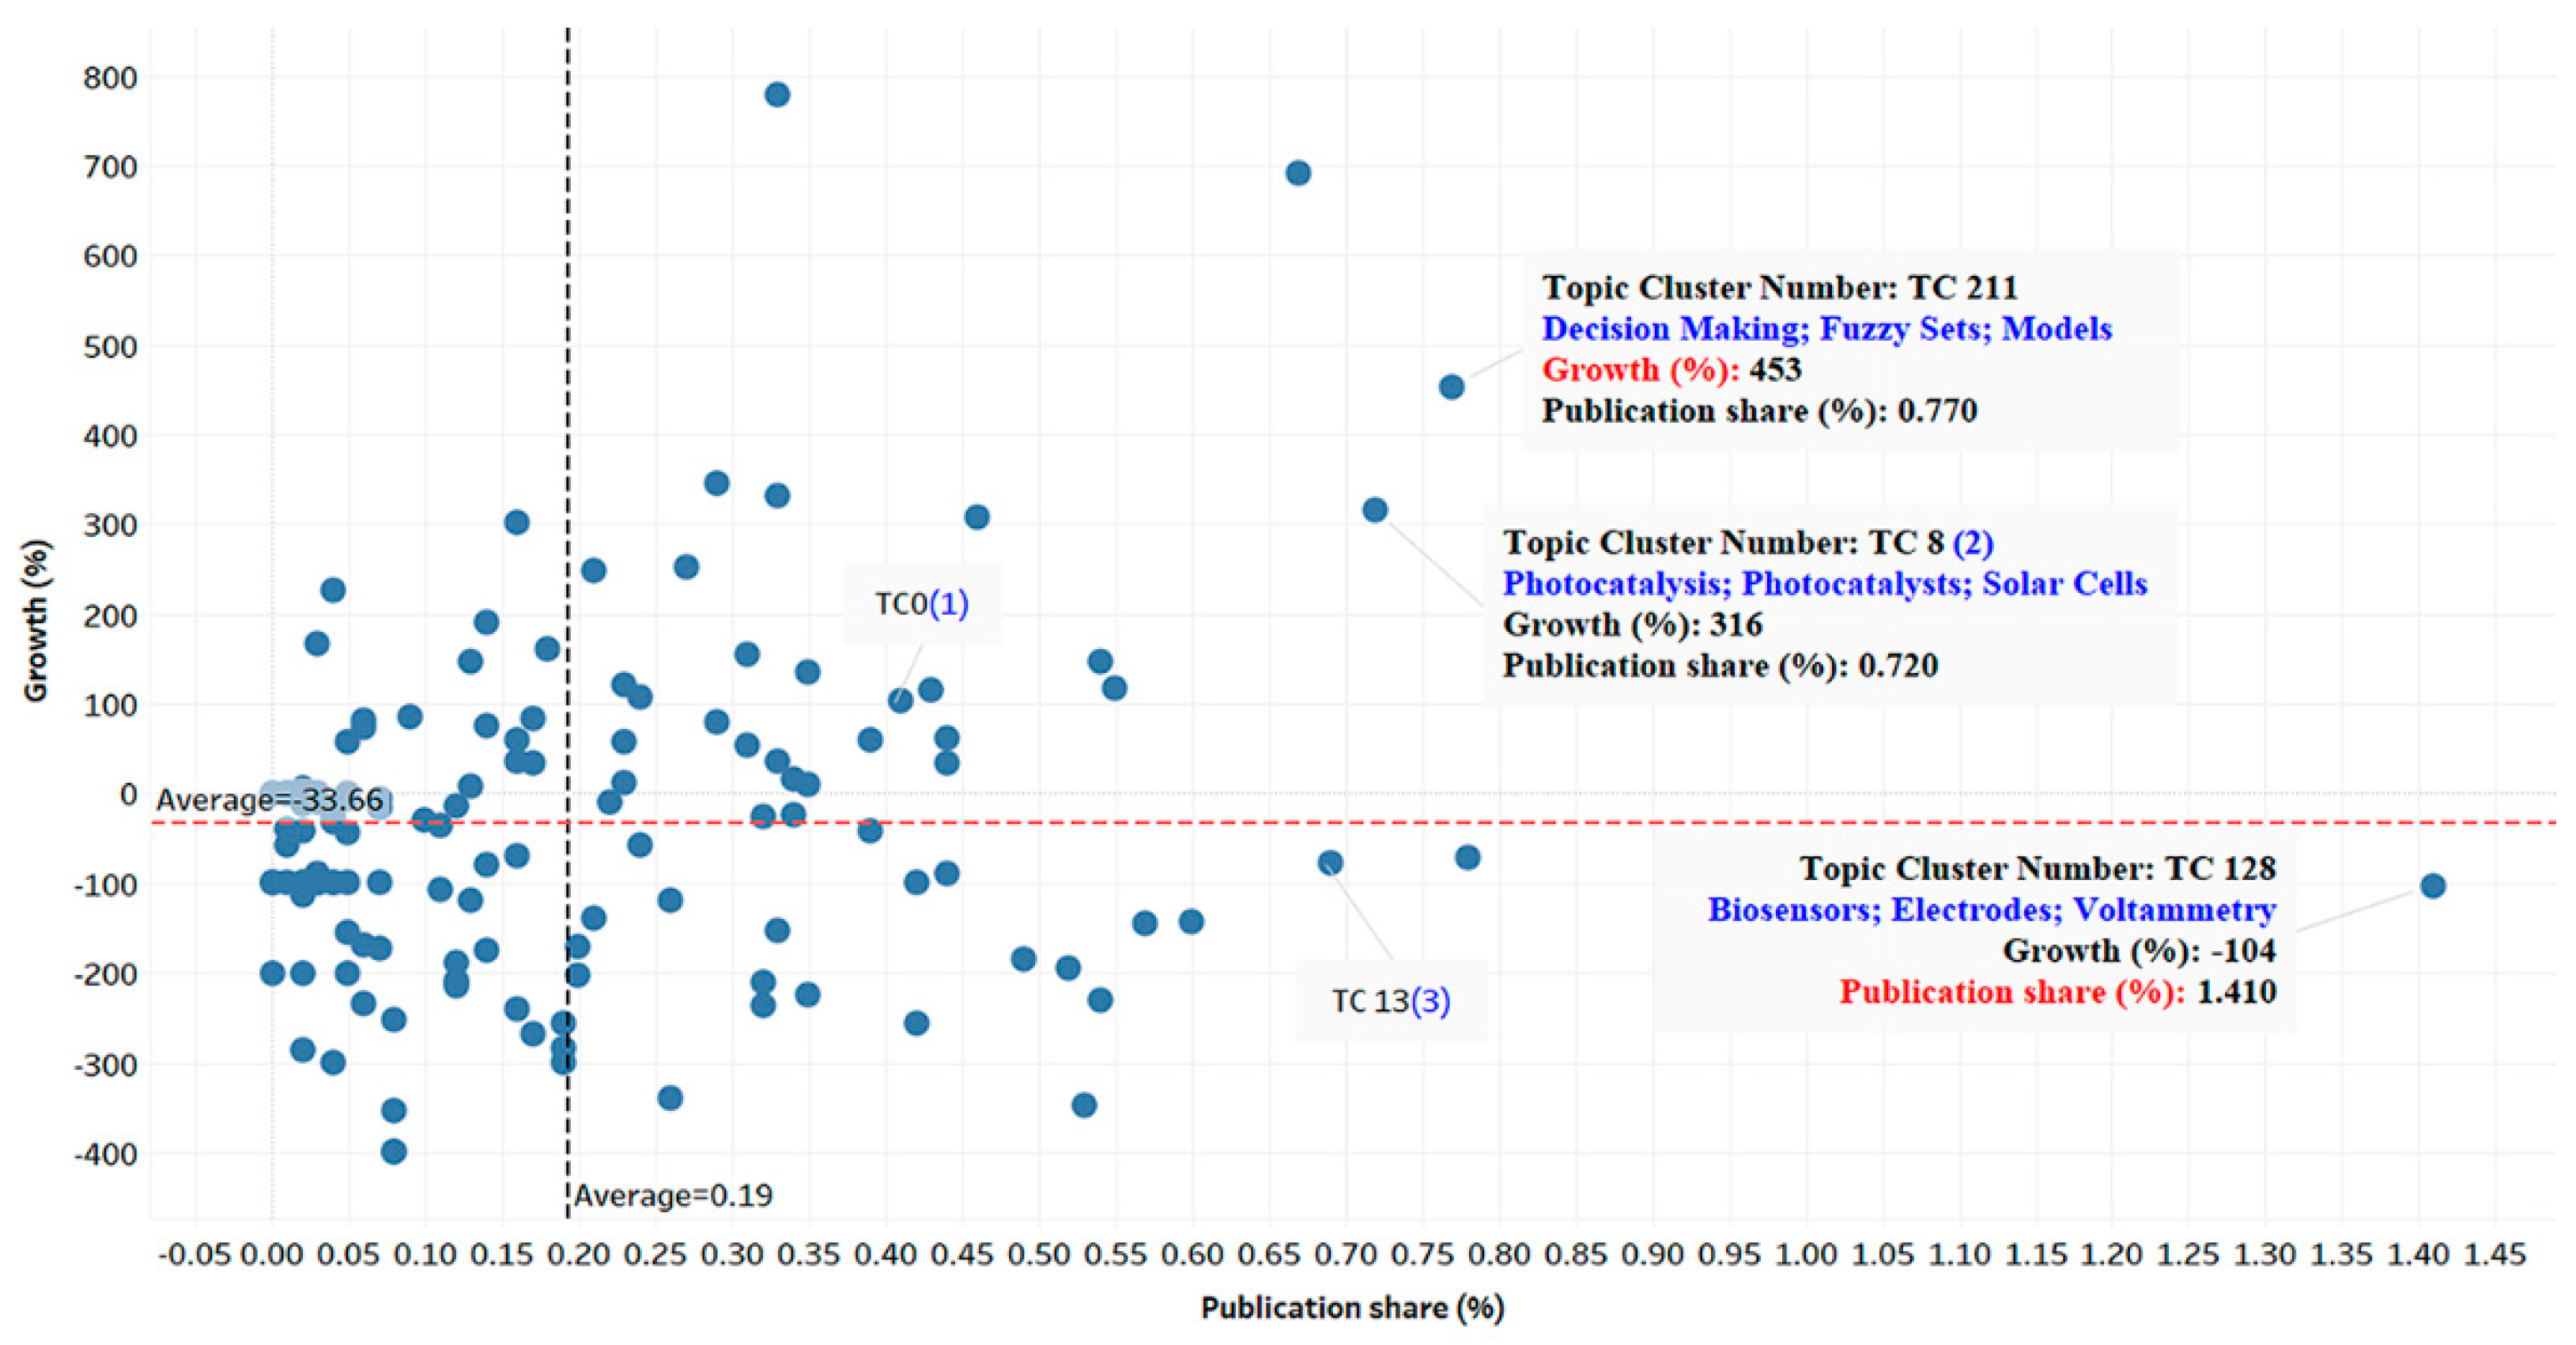
4.5. BCG Matrix Analysis

From Figure 1, the topic clusters of decision-making, fuzzy sets, and models (TC 211) belong to the star category (high market share and high growth rate), but the biosensors, electrodes, and voltammetry (TC 128) belong to the cow category (high market share and low growth rate). Photocatalysis, Photocatalysts, and Solar Cells (TC 8) are stable between good quality and good quantity (the second most frequently occurring subject of papers).

5. Discussion

5.1. Productivity

Based on the results of the correlation analysis, personnel, publication, citation, international collaboration, and research income were significantly positively correlated with each other. The research productivity of an institution is reflected by its number of publications against the research personnel involved. A working team with sufficient resources can create excellent outcomes [43,44]. Meanwhile, superior productivity can also result from higher job satisfaction [45,46]. However, due to budget limitations in personnel, some welfare to encourage research productivity is necessary for manpower. From the data on research income in the MOE database, the average income in national universities was higher than in the private ones. Thus, the research and development departments or other administrative offices in private technological universities should apply for more projects from the government or industries. Therefore, more income and subsidies could increase publication. Scholars should be incentivized and rewarded through pay-for-performance schemes, which would increase their motivation and would lead to higher levels of repute [47]. In Taiwan, the MOE (2018) started offering a jump project fund for some national universities that had lower research than the average of the national group [48]. Regardless of editing and publication fees, research masters’ workshop and methodology seminars were supported by the government. Hence, research productivity could be improved. As the bonus and reward, either psychological or material, would be shared by the institutions, the manpower for research would feel motivated and devote more time and effort to analyses in the long run.

5.2. Collaboration and Internationalization

In the correlation analysis results, the more the international collaboration, the higher the number of citations. This result is consistent with the findings of various studies from different fields worldwide [49,50,51]. Because the THE World Universities Ranking also surveyed global scholars about the reputation of the world universities, international collaboration raised the visibility of institutions and fared better compared to universities with only local cooperation. Castillo and Powell (2018) stated that international collaboration has a positive effect on research productivity as well [52]. Multinational issues and fluent native language writing can increase the speed and volume of published articles. However, Brew et al. (2013) demonstrated that although research performance increased, international collaboration raised the complexity of the research, thus increasing structural risk [53]. In addition, international collaboration in research is particularly beneficial to low-resource countries such as those in the Asia–Pacific region [54]. According to the top authors in different fields in SciVal, each institution can invite its master to be the visiting scholar or the keynote speaker in seminars or conferences, thus creating an opportunity for international collaboration.

5.3. BCG Matrix of Topic Cluster

Based on the ANOVA analysis of school and type, there are better scholar outputs in national schools. In Taiwan, the government allocates more resources and budgets in national universities than in private universities. Related to the topic clusters, most scholars have conducted research on TC 0: Algorithms, Computer Vision, Models [55,56]; TC 8: Photocatalysis, Photocatalysts, Solar Cells during 2017–2019 [57,58]; and TC 13: Electric Potential, Electric Inverters, DC–DC Converters [59,60].
In addition, with the help of the BCG matrix, decision-making, fuzzy sets, and models (TC 211) comprise the star category (high market share and high growth rate) among different topic clusters in the top 10% of journals [61,62]. This means that there is a new trend in the benchmark technological universities in Taiwan. Biosensors, electrodes, and voltammetry (TC 128) comprise the cow category (high market share and low growth rate) [63,64]. This implies that the topic cluster is in a mature status and is the market leader because of the market share rate of over 1. These topics are deeply related to the science industries’ development, specifically in precision machines or semiconductor manufacturing in Taiwan. Hence, the training of elite talent is required to facilitate industry–academia cooperation.

5.4. Practical Implications and Further Research

From the theoretical and methodological perspectives, the BCG matrix can be utilized not only in marketing fields but also in publication fields. The cow and star topics are popular in the research clusters. Therefore, the related scholars could be invited to make their research public and deposit valuable outcomes in real or digital libraries. From the practical implications point of view, the findings revealed that the more the international collaboration, the higher the number of citations. The driving force in research and development could be the invitation of international scholars to improve research performance in the local universities. Although this is a local case study, the intelligent SciVal database could be applied worldwide to detect the international research performance. The indicators in the THE ranking could also be evaluated on the evidence-based institutional outcomes. In addition, research topics in different universities could be positioned through the BCG matrix to forecast the potential of scholars and researchers.
In the study, the benchmark technological universities in Taiwan met the quality and quantity criteria of the THE ranking. This study contributes to the existing literature by linking interdisciplinary databases of open and private data to collect important indicators of research. This study evaluates the positive correlation among personnel, publications, productivity, citations, number of publications with one or more co-authors, number of international collaborations, and academic research income. These findings can be beneficial to institutions intending to join the international university rankings, providing directions for the correct allocation of institutional resources for the research development. In addition, the most mature and best-growing research topic clusters are found in our study. Future research should further explore the star and question topics. Administration managers should be encouraged to devote more resources to support such scholars’ publications.

6. Conclusions

A meaningful research evaluation could benefit decision-makers regarding the world university ranking. Most open data were analyzed by the institutions to compare their performances with the benchmark competitors. However, some hidden information and data were collected and explored in digital databases, such as research intelligent educational databases in SciVal in digital libraries. In our research, we linked common indicators from the digital database (SciVal), the MOE open database, and the THE world university ranking. Some research evaluations from eight technical university samples were selected and analyzed. First, the results revealed that research personnel, publications, productivity, citations, number of international collaborations, and academic research income were significantly positively correlated with each other. The more the international collaboration, the higher the number of citations. Therefore, the excellent and international manpower for research played an important role in the universities’ ranking and institutional sustainability. Second, topic clusters and school types are the significant factors in research outputs. The national benchmark universities performed better in the top 10% of journals than private schools. In Taiwan, the government allocates more resources and budgets to national universities than private universities, thus, the motivation for scholars to do research is unequal in terms of the resource allocation. Finally, biosensors, electrodes, and voltammetry are leading the research trend. The topic cluster of decision-making, fuzzy sets, and models has the best growth rate in the SciVal results. These topics are deeply related to the development of science and industry, specifically in precision machines or semiconductor manufacturing in Taiwan. Hence, training of elite talent is required to facilitate industry–academia cooperation. Based on the analysis, more capital and further effort could be invested into different factors that enhance the research performance of a university. Therefore, the institution could strive for exceeding the competitive benchmarks.

Author Contributions

Conceptualization, T.-M.C., H.-Y.H.; methodology, H.-Y.H.; software, H.-Y.H.; validation, T.-M.C., H.-Y.H.; formal analysis, H.-Y.H.; resources, T.-M.C.; data curation, H.-Y.H.; writing—original draft preparation, H.-Y.H.; writing—review and editing, H.-Y.H.; visualization, H.-Y.H.; supervision, T.-M.C.; funding acquisition, H.-Y.H. All authors have read and agreed to the published version of the manuscript.

Funding

This research was funded by MOE grant number PGE1100940. The APC was funded by MOE in Taiwan.

Conflicts of Interest

The authors declare no conflict of interest.

References

  1. Burke, J.C. Achieving Accountability in Higher Education: Balancing Public, Academic, and Market Demands, 1st ed.; The Jossey-Bass Adult and Higher Education Series; Jossey-Bass: San Francisco, CA, USA, 2005. [Google Scholar]
  2. Semyonov, D.; Platonova, D. Accountability of higher education institutions. In The Global Education Monitoring Report; Global Education Monitoring Report Team: Paris, France, 2017; pp. 1–17. [Google Scholar]
  3. Burke, J.C.; Minassians, H. Real Accountability of Accountability Lite: Seventh Annual Survey; The Rockefeller Institute of Government: Albany, NY, USA, 2003.
  4. Martinez, M.C.; Nilson, M. Assessing the connection between higher education policy and performance. Educ. Policy 2006, 20, 299–322. [Google Scholar] [CrossRef]
  5. Shin, J.C. Impacts of performance-based accountability on institutional performance in the US. High. Educ. 2010, 60, 47–68. [Google Scholar] [CrossRef]
  6. The 2019 World University Rankings Methodology. Available online: https://www.timeshighereducation.com/sites/default/files/the_2019_world_university_rankings_methodology_pwc.pdf (accessed on 19 September 2018).
  7. Beck, S.; Morrow, A. Canada’s Universities Make the Grade Globally. The Globe and Mail. Available online: https://www.theglobeandmail.com/news/national/canadas-universities-make-the-grade-globally/article4326026/ (accessed on 10 January 2021).
  8. Samarasekera, I.; Amrhein, C. Top Schools Don’t Always Get Top Marks, Edmonton Journal. Available online: https://www.pressreader.com/canada/edmonton-journal/20100922/282870842154432 (accessed on 3 October 2010).
  9. Zirulnick, A. New World University Ranking Puts Harvard Back on Top. Christian Science Monitor, Boston, MA, USA. Available online: https://www.csmonitor.com/World/2010/0916/New-world-university-ranking-puts-Harvard-back-on-top (accessed on 16 September 2010).
  10. MOE Open Database. Available online: https://udb.moe.edu.tw/ReportCategories (accessed on 1 September 2018).
  11. Hou, H.Y.; Agrawal, S.; Lee, C.F. Comparison of institutional performance between national and private universities of science and technology in Taiwan using world university ranking indicators. In Proceedings of the SEAAIR 2019 19th Annual Conference, Taipei, Taiwan, 25–27 September 2019. [Google Scholar]
  12. Chang, Y.-S.; Hu, K.-J. Usability Evaluation for the Integration of Library Data Analysis and an Interactive Artwork by Sensing Technology. Appl. Sci. 2020, 10, 7499. [Google Scholar] [CrossRef]
  13. Chen, M.; Shen, C.W. The correlation analysis between the service quality of intelligent library and the behavioral intention of users. Electron. Libr. 2019, 538, 95–112. [Google Scholar] [CrossRef]
  14. Zhang, H.; Xiao, J. Quality assessment framework for open government data: Meta-synthesis of qualitative research, 2009–2019. Electron. Libr. 2020, 38, 209–222. [Google Scholar] [CrossRef]
  15. MOE Higher Education Sprout Project. Available online: https://www.edu.tw/News_Content.aspx?n=9E7AC85F1954DDA8&s=8365C4C9ED53126D (accessed on 13 February 2018).
  16. Auranen, O.; Nieminen, M. University research funding and publication performance—An international comparison. Res. Policy 2010, 39, 822–834. [Google Scholar] [CrossRef]
  17. Johnes, J.; Johnes, G. Research funding and performance in U.K. university departments of economics: A frontier analysis. Econ. Educ. Rev. 1995, 14, 301–314. [Google Scholar] [CrossRef]
  18. Zhou, W.; Lia, Y.; Hsieh, C.J.; Chang, K.C.; Kiang, Y.J.; Kene, Y. Research performance and university–industry–government funding sources in Taiwan’s technological and vocational universities innovation: Management. Policy Pract. 2016, 18, 340–351. [Google Scholar] [CrossRef]
  19. Artés, J.; Pedraja-Chaparro, F.; Salinas-JiméneZ, M.M. Research performance and teaching quality in the Spanish higher education system: Evidence from a medium-sized university. Res. Policy 2017, 46, 19–29. [Google Scholar] [CrossRef]
  20. Goodall, A.H.; McDowell, J.M.; Singell, L.D. Leadership and the research productivity of university departments. IZA Discuss. Pap. 2014, 1–26. [Google Scholar] [CrossRef]
  21. Butler, L.; Mcallister, I. Professional evaluating university research performance using metrics. Eur. Political Sci. 2011, 10, 44–58. [Google Scholar] [CrossRef]
  22. Uma, V.; Rao, M.K. Evaluation of research performance using journal citations of University of Hyderabad: A case study. Int. J. Inf. Dissem. Technol. 2014, 4, 168–172. [Google Scholar]
  23. Aldieri, L.; Guida, G.; Kotsemir, M.; Vinci, C.P. An investigation of impact of research collaboration on academic performance in Italy. Qual. Quant. 2019, 53, 2003–2040. [Google Scholar] [CrossRef]
  24. Baskaran, C. Research productivity of Alagappa University during 1999–2011: A bibliometric study. DESIDOC J. Libr. Inf. Technol. 2013, 33, 236–242. [Google Scholar] [CrossRef]
  25. Vuong, Q.H.; Ho, M.T.; Vuong, T.T.; Nguyen, V.H.; Napier, N.K.; Pham, H.H. Nemo Solus Satis Sapit: Trends of research collaborations in the Vietnamese social sciences, observing 2008–2017 Scopus data. Publications 2017, 5, 24. [Google Scholar] [CrossRef]
  26. Bornmann, L.; Stefaner, M.; de Moya Anegón, F.; Mutz, R. What is the effect of country-specific characteristics on the research performance of scientific institutions? Using multi-level statistical models to rank and map universities and research-focused institutions worldwide. J. Informetr. 2014, 8, 581–593. [Google Scholar] [CrossRef]
  27. Uddin, A.; Singh, V.K. A quantity-quality composite ranking of Indian institutions in CS research. IETE Technol. Rev. 2015, 32, 273–283. [Google Scholar] [CrossRef]
  28. Bennell, P. The internationalisation of higher education provision in the United Kingdom: Patterns and relationships between onshore and offshore overseas student enrolment. Int. J. Educ. Dev. 2020, 74, 102162. [Google Scholar] [CrossRef]
  29. Vernon, M.M.; Balas, E.A.; Momani, S. Are university rankings useful to improve research? A systematic review. PLoS ONE 2018, 13, e0193762. [Google Scholar] [CrossRef]
  30. Altbach, P.G. The state of the rankings. Inside High. Ed. 2010, 11. Available online: www.insidehighered.com/views/2010/11/11/altbach (accessed on 29 March 2018).
  31. Network, QS Asia News. The History and Development of Higher Education Ranking. QS WOWNEWS. Available online: https://qswownews.com/history-development-higher-education-ranking-systems/ (accessed on 29 March 2018).
  32. Vardell, E.; Feddern-Bekcan, T.; Moore, M. SciVal experts: A collaborative tool. Med. Ref. Serv. Q. 2011, 30, 283–294. [Google Scholar] [CrossRef]
  33. Yu, M.C.; Wu, Y.C.; Alhalabi, W.; Kao, H.Y.; Wu, W.H. Research gate: An effective altmetric indicator for active researchers? Comput. Hum. Behav. 2016, 55, 1001–1006. [Google Scholar] [CrossRef]
  34. Dresbeck, R. Resource reviews. Scival J. Med. Libr. Assoc. 2015, 103, 164–166. [Google Scholar] [CrossRef]
  35. Ghemawat, P. Competition and business strategy in historical perspective. Bus. Hist. Rev. 2002, 76, 37–74. [Google Scholar] [CrossRef]
  36. Whitehead, J. BCG (Growth Share) Matrix. In Wiley Encyclopedia of Management; John Wiley & Sons, Ltd.: Hoboken, NJ, USA, 2015. [Google Scholar]
  37. Jung, N.; Kieser, A. Consultants in the management fashion arena. In The Oxford Handbook of Management, Consulting; Kipping, M., Clark, T., Eds.; Oxford University Press: New York, NY, USA, 2012; pp. 327–346. [Google Scholar]
  38. Pidun, U.; Rubner, H.; Krühler, M.; Untiedt, R.; Nippa, M. Corporate portfolio management: Theory and practice. J. Appl. Corp. Financ. 2011, 23, 63–76. [Google Scholar] [CrossRef]
  39. Allio, R.J. Strategic thinking: The ten big ideas. Strateg. Leadersh. 2006, 34, 4–13. [Google Scholar] [CrossRef]
  40. Madsen, D.Ø. Not dead yet: The rise, fall and persistence of the BCG Matrix. Probl. Perspect. Manag. 2017, 15, 19–34. [Google Scholar]
  41. Sheoran, M.; Kumar, D.; Kumar, V.; Verma, D. Understanding the trends of marketing research and its future directions: A citation analysis. Bottom Line 2018, 31, 191–207. [Google Scholar] [CrossRef]
  42. Bunkley, N. Joseph Juran, 103, pioneer in quality control, dies. The New York Times, 3 March 2008. [Google Scholar]
  43. Xanthopoulou, D.; Bakker, A.B.; Schaufeli, W.B. The role of personal resources in the Job Demands-Resources model. Int. J. Stress Manag. 2007, 14, 121–141. [Google Scholar] [CrossRef]
  44. Demerouti, E.; Bakker, A.B.; Nachreiner, F.; Schaufeli, W.B. The job demands-resources model of burnout. J. Appl. Psychol. 2001, 86, 499–512. [Google Scholar] [CrossRef]
  45. Albert, C.; Davia, M.A.; Legazpe, N. Job satisfaction amongst academics: The role of research productivity. Stud. High. Educ. 2018, 43, 1362–1377. [Google Scholar] [CrossRef]
  46. Callaghan, C.W.; Coldwell, D. Job satisfaction and job performance: The case of research productivity. J. Econ. 2014, 5, 97–113. [Google Scholar] [CrossRef]
  47. Irs, R. Pay-for-performance in Estonian general educational schools: The situation for further development. Balt. J. Manag. 2012, 7, 302–332. [Google Scholar] [CrossRef]
  48. MOE. The Jump Project in Higher Education. Available online: https://nutcup.nutc.edu.tw/files/11-1096-10447.php (accessed on 1 September 2018).
  49. Kumaresan, R.; Vinitha, K.; Kannan, K. Mapping of Cyprinus carpio research: A global perspective. Libr. Philos. Pract. 2018, 1750, 1–14. [Google Scholar]
  50. Leydesdorff, L.; Bornmann, L.; Wagner, C.S. The Relative Influences of Government Funding and International Collaboration on Citation Impact. J. Assoc. Inf. Sci. Technol. 2019, 70, 198–201. [Google Scholar] [CrossRef] [PubMed]
  51. Wang, L.; Thijs, B.; Glänzel, W. Characteristics of international collaboration in sport sciences publications and its influence on citation impact. Scientometrics 2015, 105, 843–862. [Google Scholar] [CrossRef]
  52. Castillo, J.A.; Powell, M.A. Research productivity and international collaboration: A study of Ecuadorian science. J. Hisp. High. Educ. 2020, 19, 369–387. [Google Scholar] [CrossRef]
  53. Brew, A.; Boud, D.; Lucas, L.; Crawford, K. Reflexive deliberation in international research collaboration: Minimising risk and maximising opportunity. High. Educ. 2013, 66, 93–104. [Google Scholar] [CrossRef]
  54. Low, W.Y.; Tong, W.T.; Gunasegaran, V. Constraints in journal publishing and international research collaboration in the Asia Pacific Region. Int. J. Inf. Sci. Manag. 2016, 12, 13–19. [Google Scholar]
  55. Hung, W.-C.; Tsai, Y.-H.; Liou, Y.-T.; Lin, Y.-Y.; Yang, M.-H. Adversarial learning for semi-supervised semantic segmentation. In Proceedings of the British Machine Vision Conference 2018 (BMVC 2018), Newcastle, UK, 3–6 September 2018. [Google Scholar]
  56. Tu, W.-C.; Liu, M.-Y.; Jampani, V.; Sun, D.; Chien, S.-Y.; Yang, M.-H.; Kautz, J. Learning superpixels with segmentation-aware affinity loss. In Proceedings of the IEEE Computer Society Conference on Computer Vision and Pattern Recognition, Salt Lake City, UT, USA, 18–23 June 2018; pp. 568–576. [Google Scholar]
  57. Chiu, Y.-H.; Chang, T.-F.M.; Chen, C.-Y.; Sone, M.; Hsu, Y.-J. Mechanistic insights into photodegradation of organic dyes using heterostructure photocatalysts. Catalysts 2019, 9, 430. [Google Scholar] [CrossRef]
  58. Lee, G.-J.; Wu, J.J. Recent developments in ZnS photocatalysts from synthesis to photocatalytic applications—A review. Powder Technol. 2017, 318, 8–22. [Google Scholar] [CrossRef]
  59. Liu, M.-J.; Hsu, S.S.H. A miniature 300-MHz resonant DC-DC converter with GaN and CMOS integrated in IPD technology. IEEE Trans. Power Electron. 2018, 33, 9656–9668. [Google Scholar] [CrossRef]
  60. Yang, N.-C.; Chen, H.-C. Decomposed Newton algorithm-based three-phase power-flow for unbalanced radial distribution networks with distributed energy resources and electric vehicle demands. Int. J. Electr. Power Energy Syst. 2018, 96, 473–483. [Google Scholar] [CrossRef]
  61. Cheng, S.H. Autocratic decision making using group recommendations based on hesitant fuzzy sets for green hotels selection and bidders selection. Inf. Sci. 2018, 467, 604–617. [Google Scholar] [CrossRef]
  62. Zeng, S.; Xiao, Y. A method based on TOPSIS and distance measures for hesitant fuzzy multiple attribute decision making. Technol. Econ. Dev. Econ. 2018, 24, 969–983. [Google Scholar] [CrossRef]
  63. Li, J.; Bi, X.; Tamulevičius, S.; Erts, D.; Chang, C.-F.; Gu, Y. Fabrication of a biocompatible and continuous glucose biosensor with the poly (3,4-ethylenedioxythiophene) modified electrode. J. Taiwan Inst. Chem. Eng. 2019, 104, 1–7. [Google Scholar] [CrossRef]
  64. Liu, X.; Hsu, S.P.C.; Liu, W.-C.; Wang, Y.-M.; Liu, X.; Lo, C.-S.; Lin, Y.-C.; Nabilla, S.C.; Li, Z.; Hong, Y.; et al. Salivary electrochemical cortisol biosensor based on tin disulfide nanoflakes. Nanoscale Res. Lett. 2019, 14, 189. [Google Scholar] [CrossRef]
Figure 1. BCG matrix analysis of topic clusters in the top 10% of journals.
Applsci 12 00791 g001
Table 1. MOE database, SciVal, and THE World University Ranking common indicators.
THE IndicatorMOE and SciVal Items
Teaching (the learning environment)Reputation
Staff-to-student ratio
Institutional income
Research (volume, income, and reputation)No. of publications (SciVal) *
No. of citations of the superior subject (SciVal) *
Research income (MOE) *
International outlook (staff, students, research)Proportion of international students
Proportion of international staff
Proportion of publications with international collaboration (SciVal) *
Industry income (knowledge transfer)Institutional income from industry and commerce/academic staff
* research-related indicators analyzed in this study.
Table 2. Number of publications during 2017–2019.
School NamePublicationsCitationsCollaborationInternalization
N1417524,13641031370
N2356420,30134611074
N5223582702131532
N4145549711382341
P2113430971075276
P1108567871053309
P37732660744110
N36612088616126
Table 3. PH Ratio in 2018.
School NamePublicationHRPH RatioResearch Income (NT Dollars)
P13556810.521102,228,451
N1133358820.227497,164,554
P234915560.22445,825,000
N2119055520.214304,882,112
N320611640.17788,433,709
N446635290.132140,922,212
P324418840.13081,962,999
N569159910.115239,032,328
Table 4. Correlation analysis.
12345
  • personnel
1
2.
publication
0.904 **1
3.
citation
0.834 **0.980 **1
4.
international collaboration
0.883 **0.983 **0.989 **1
5.
research income
0.834 **0.832 **0.822 **0.847 **1
Note: ** p-value is significantly smaller than 0.01.
Table 5. Basic statistical analysis (output >10).
VariableCodingMeanFrequencySD
TopicTC 066.00862.108
TC 861.88855.573
TC 1354.25842.948
TC 3046.13852.684
TC 12838.86771.627
SchoolN119.6611229.894
N217.5011429.616
N59.0311712.515
N48.568211.403
P27.667312.371
P17.238113.524
N35.14586.309
P34.13824.949
TypeNational12.9548322.481
Private6.2923610.959
Table 6. ANOVA.
Table 6. ANOVA.
SSdfMSFSig.
output ∗ topicbetween112,715.706144782.7482.7040.000
within166,132.625574289.430
Total278,848.331718
output ∗ schoolbetween21,939.26373134.1808.6740.000
within256,909.068711361.335
Total278,848.331718
output ∗ typebetween7032.21817032.21818.5500.000
within271,816.113717379.102
Total278,848.331718
Publisher’s Note: MDPI stays neutral with regard to jurisdictional claims in published maps and institutional affiliations.

