
The Amber Project: A Survey of Methods and Inks for the Reproduction of the Color of Translucent Objects


Abstract
:Featured Application
Abstract
1. Introduction
2. Materials and Methods
2.1. Detail of the Two Different Printing Methods
2.1.1. Lithography
2.1.2. Screen Printing
2.2. Inks
2.3. Paper
2.4. Halftoning
2.5. Color Separations and Screen Angles
2.6. Printing Order
2.7. Measurements
3. Results
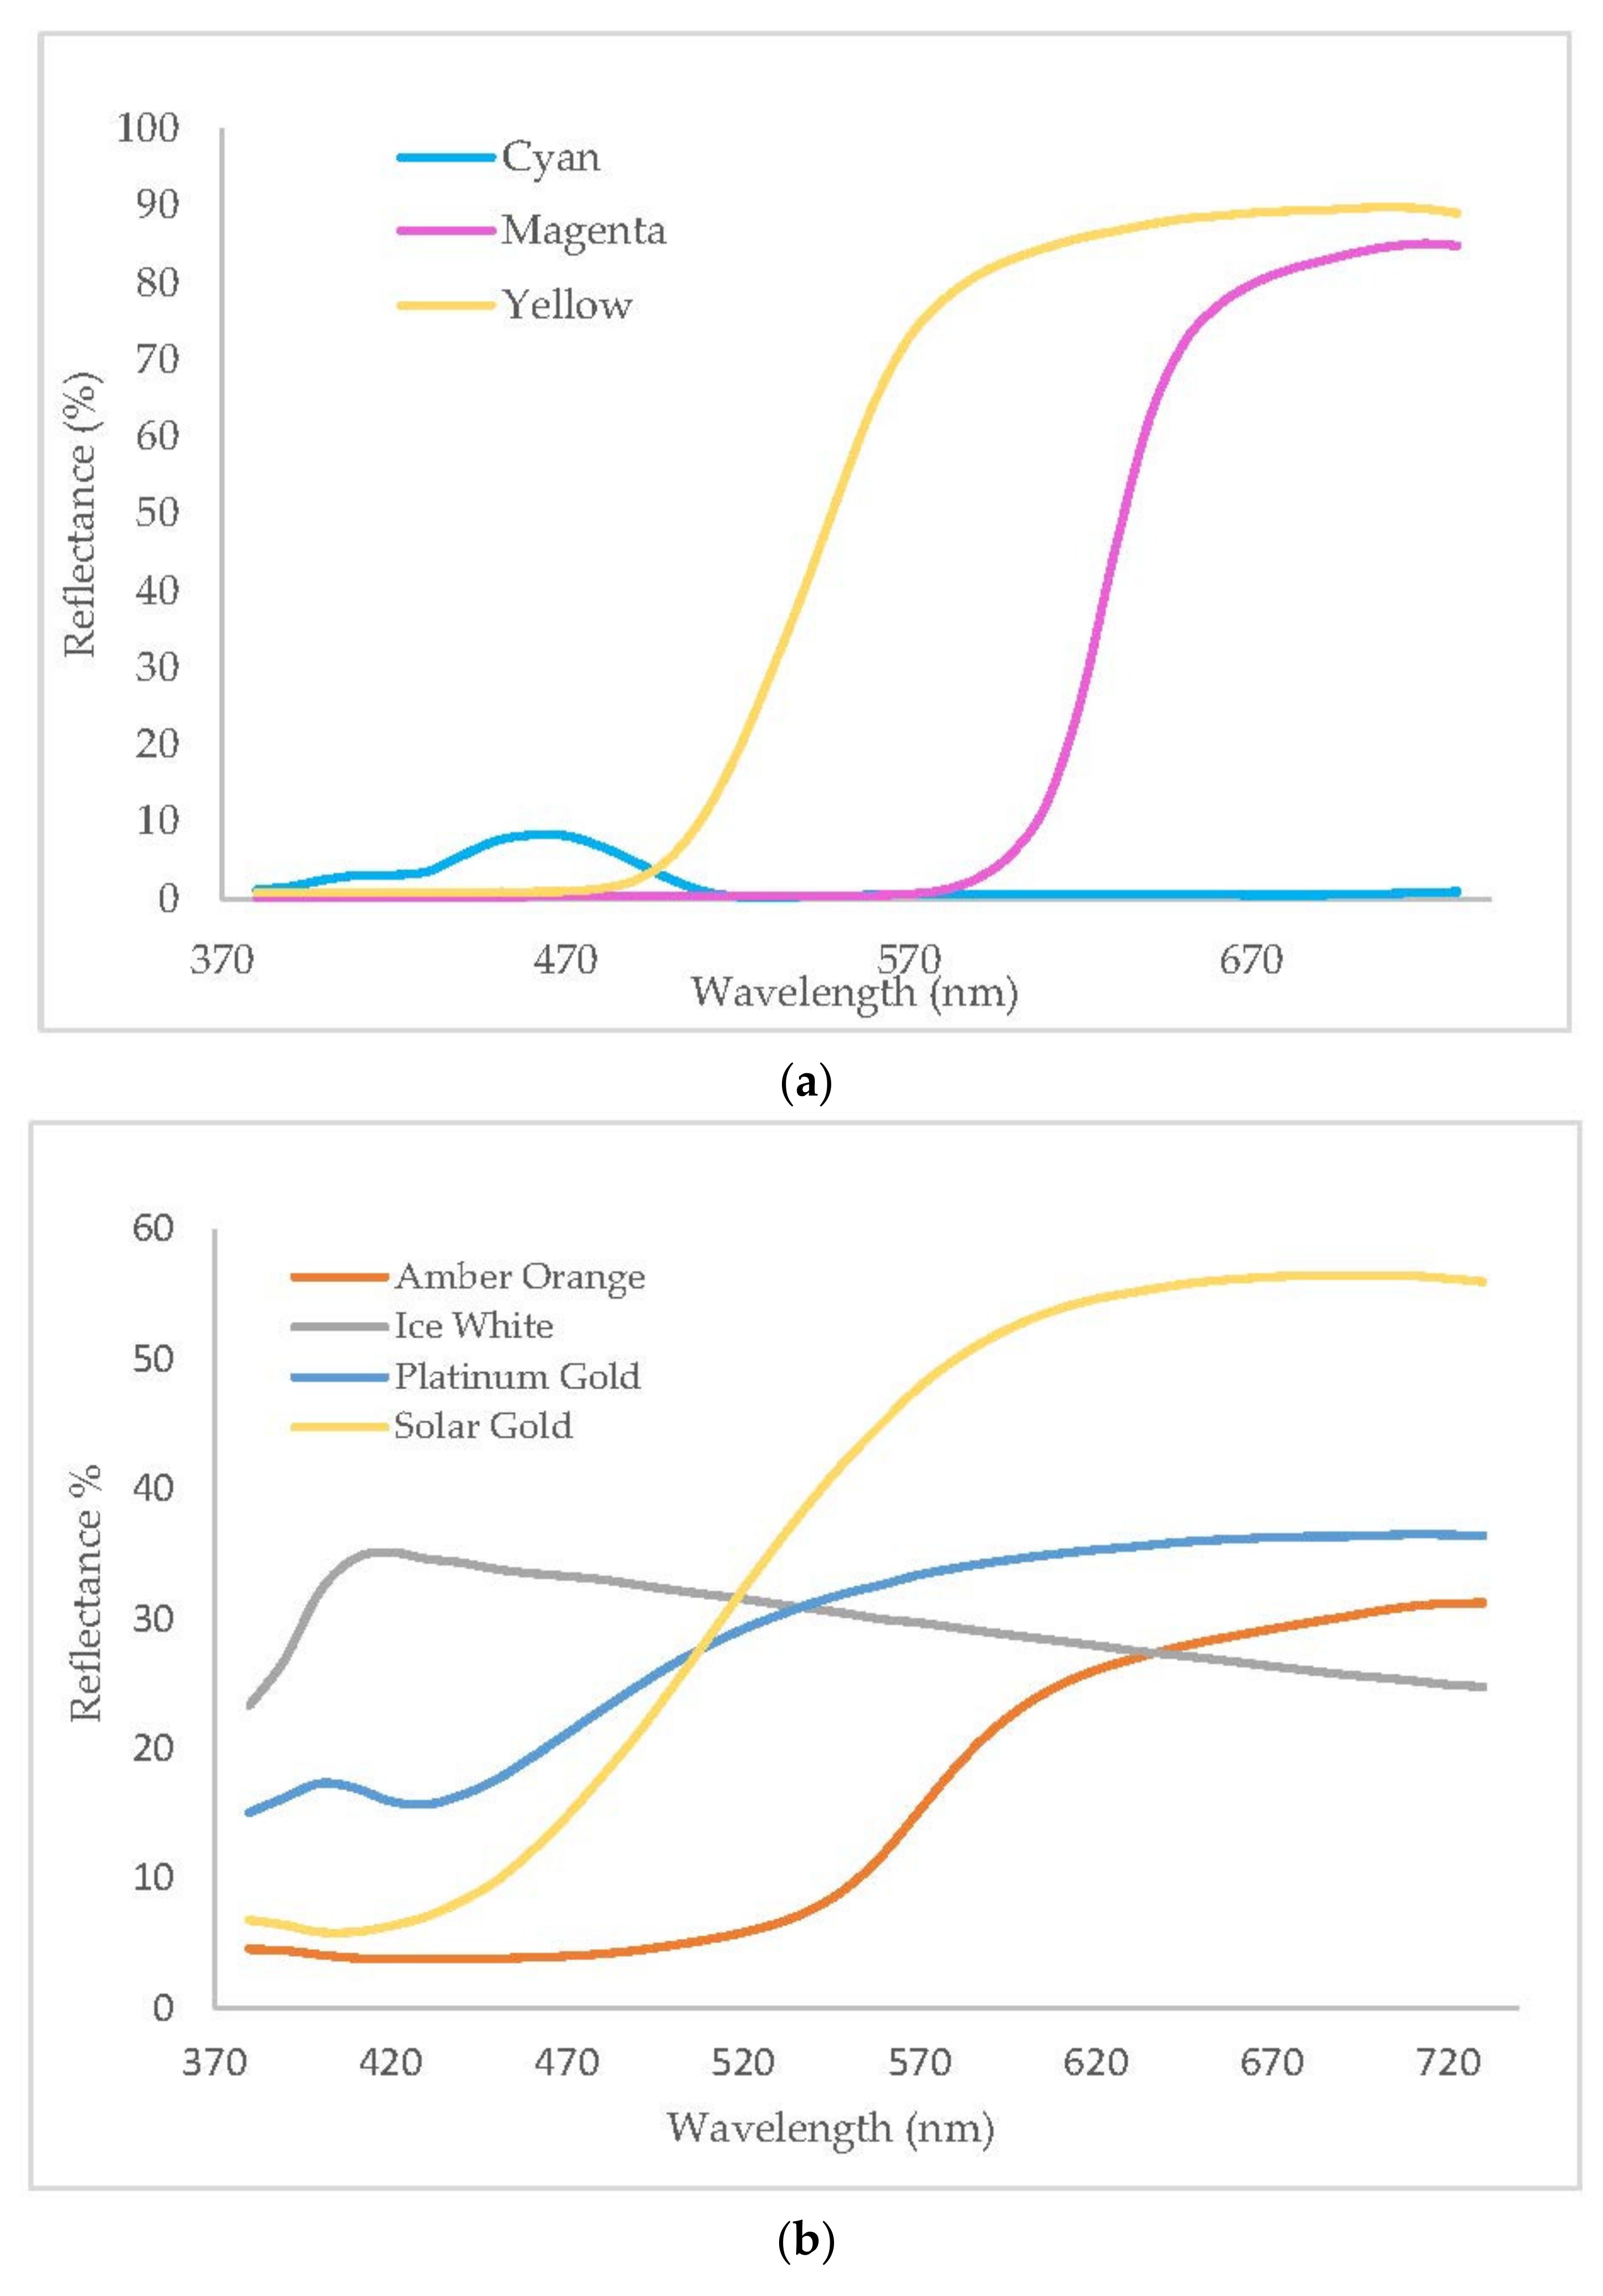
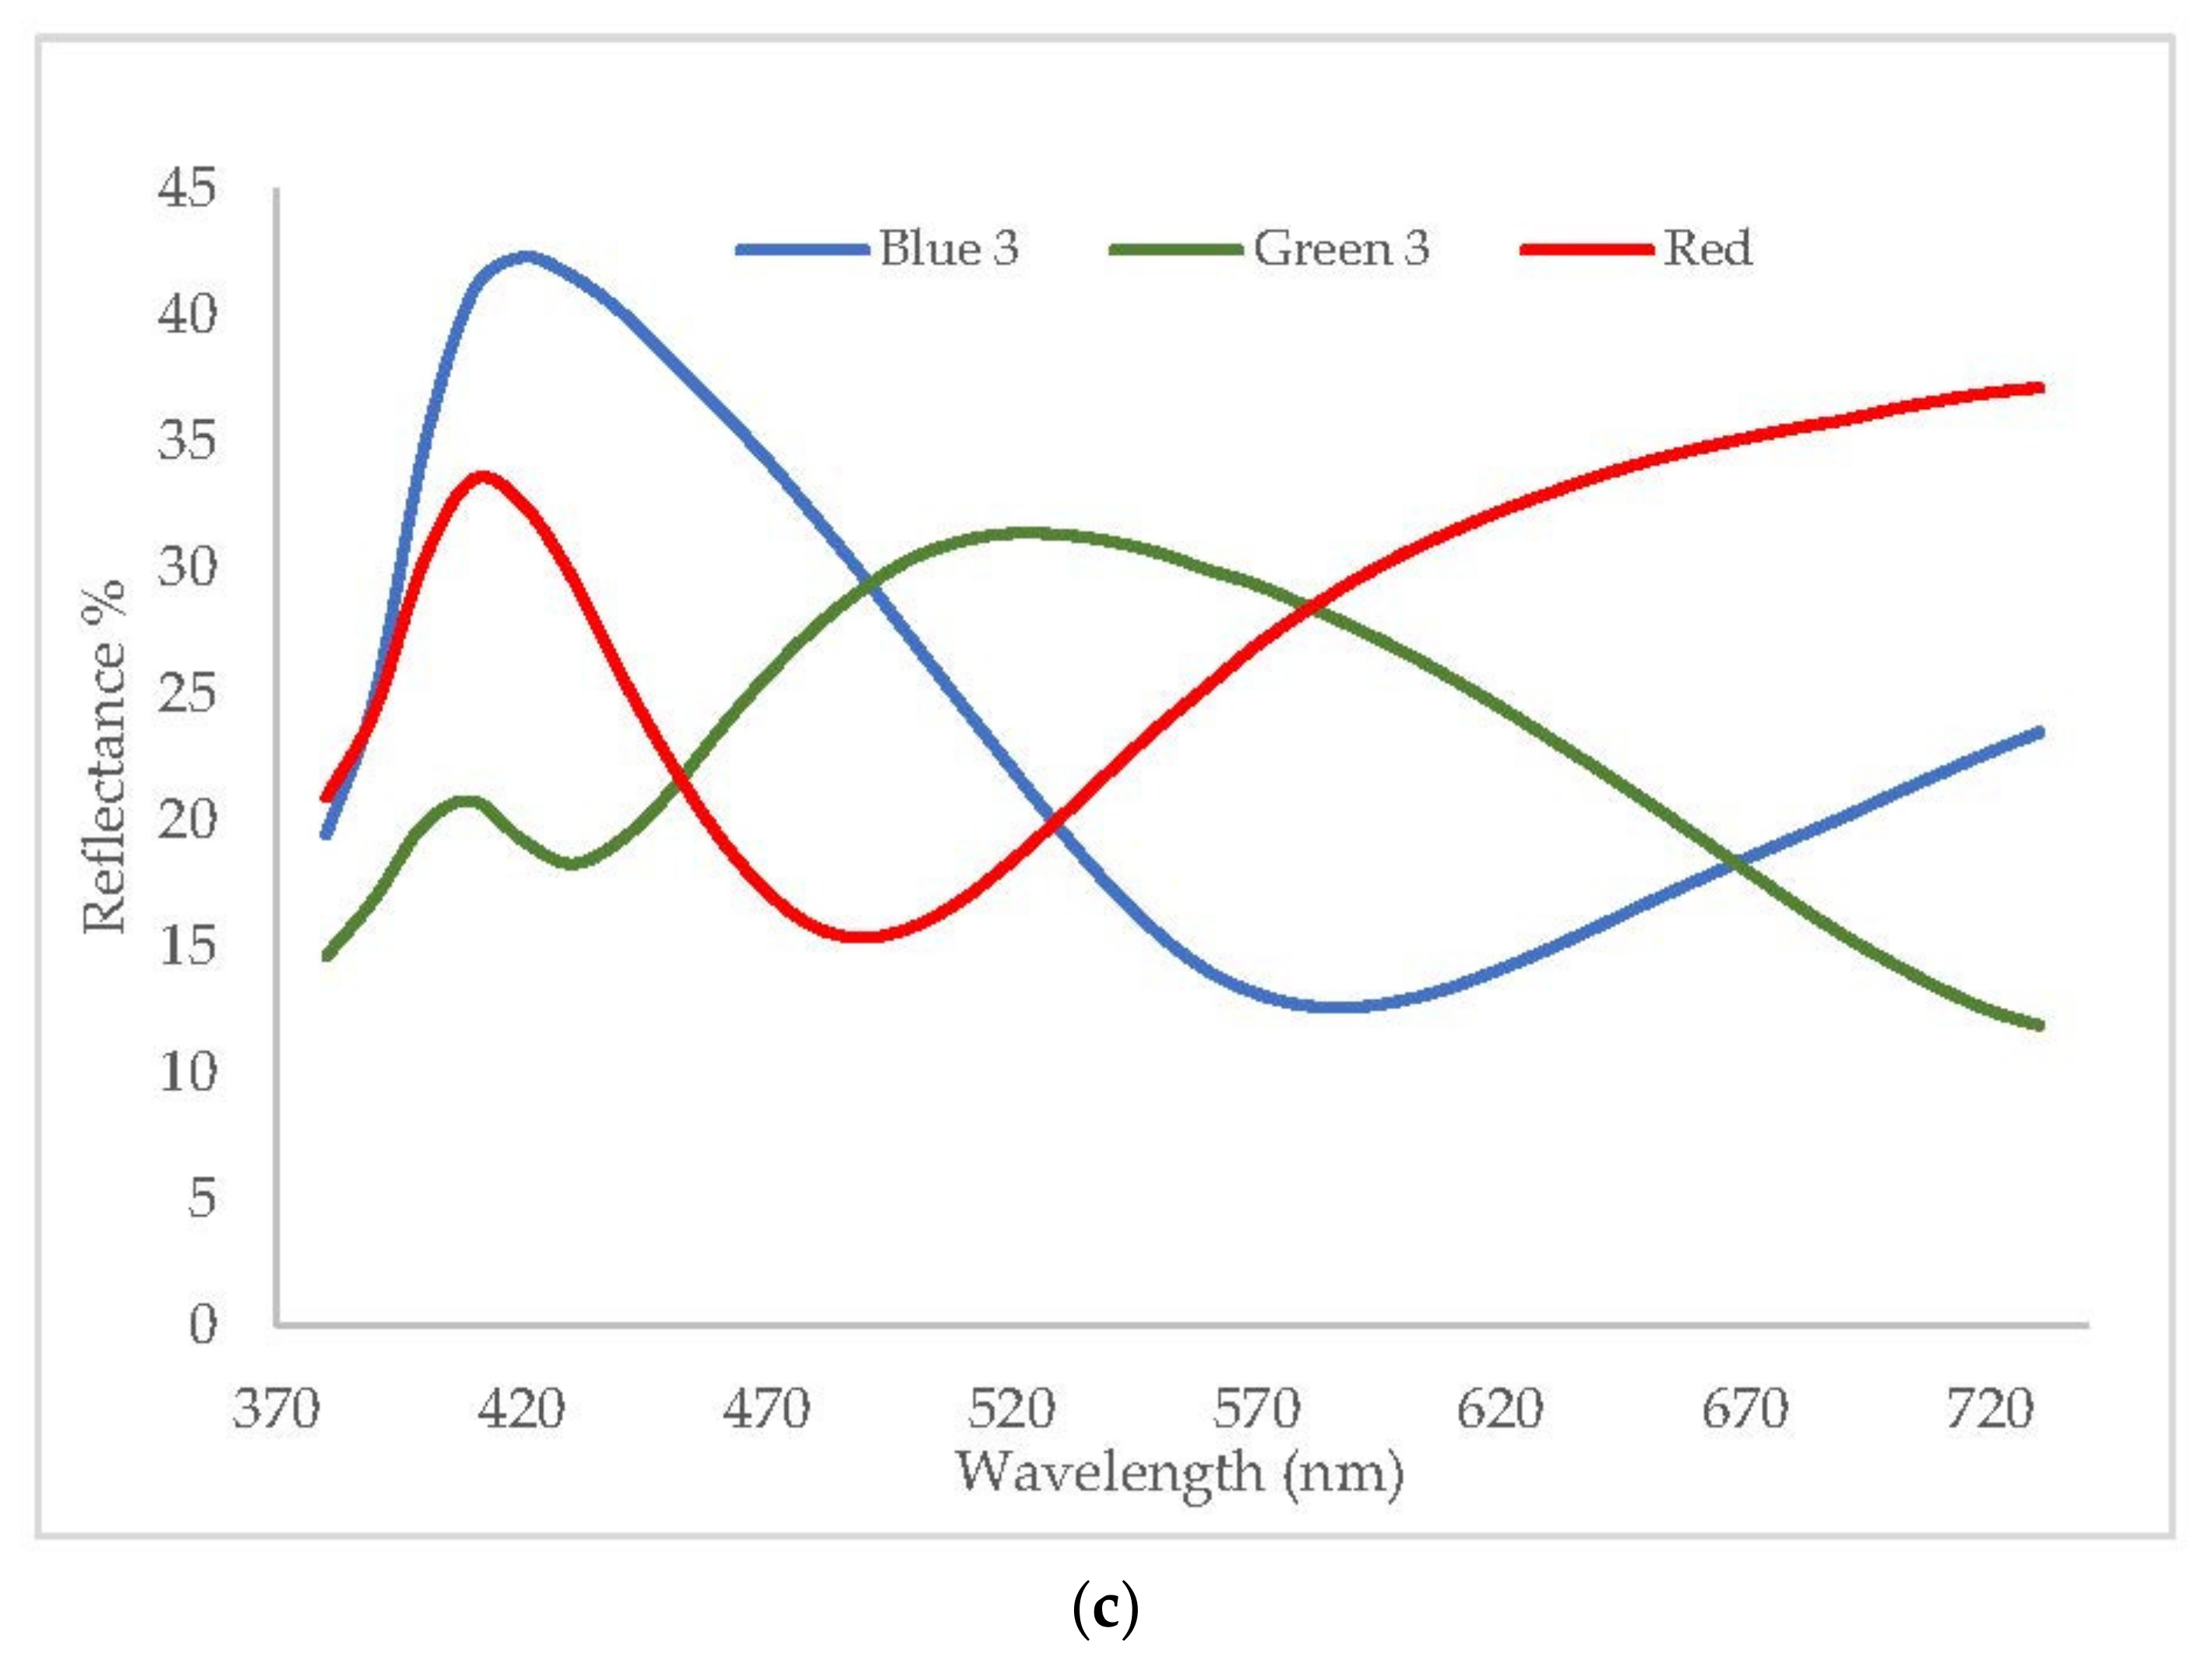
3.1. Spectral Properties of the Inks
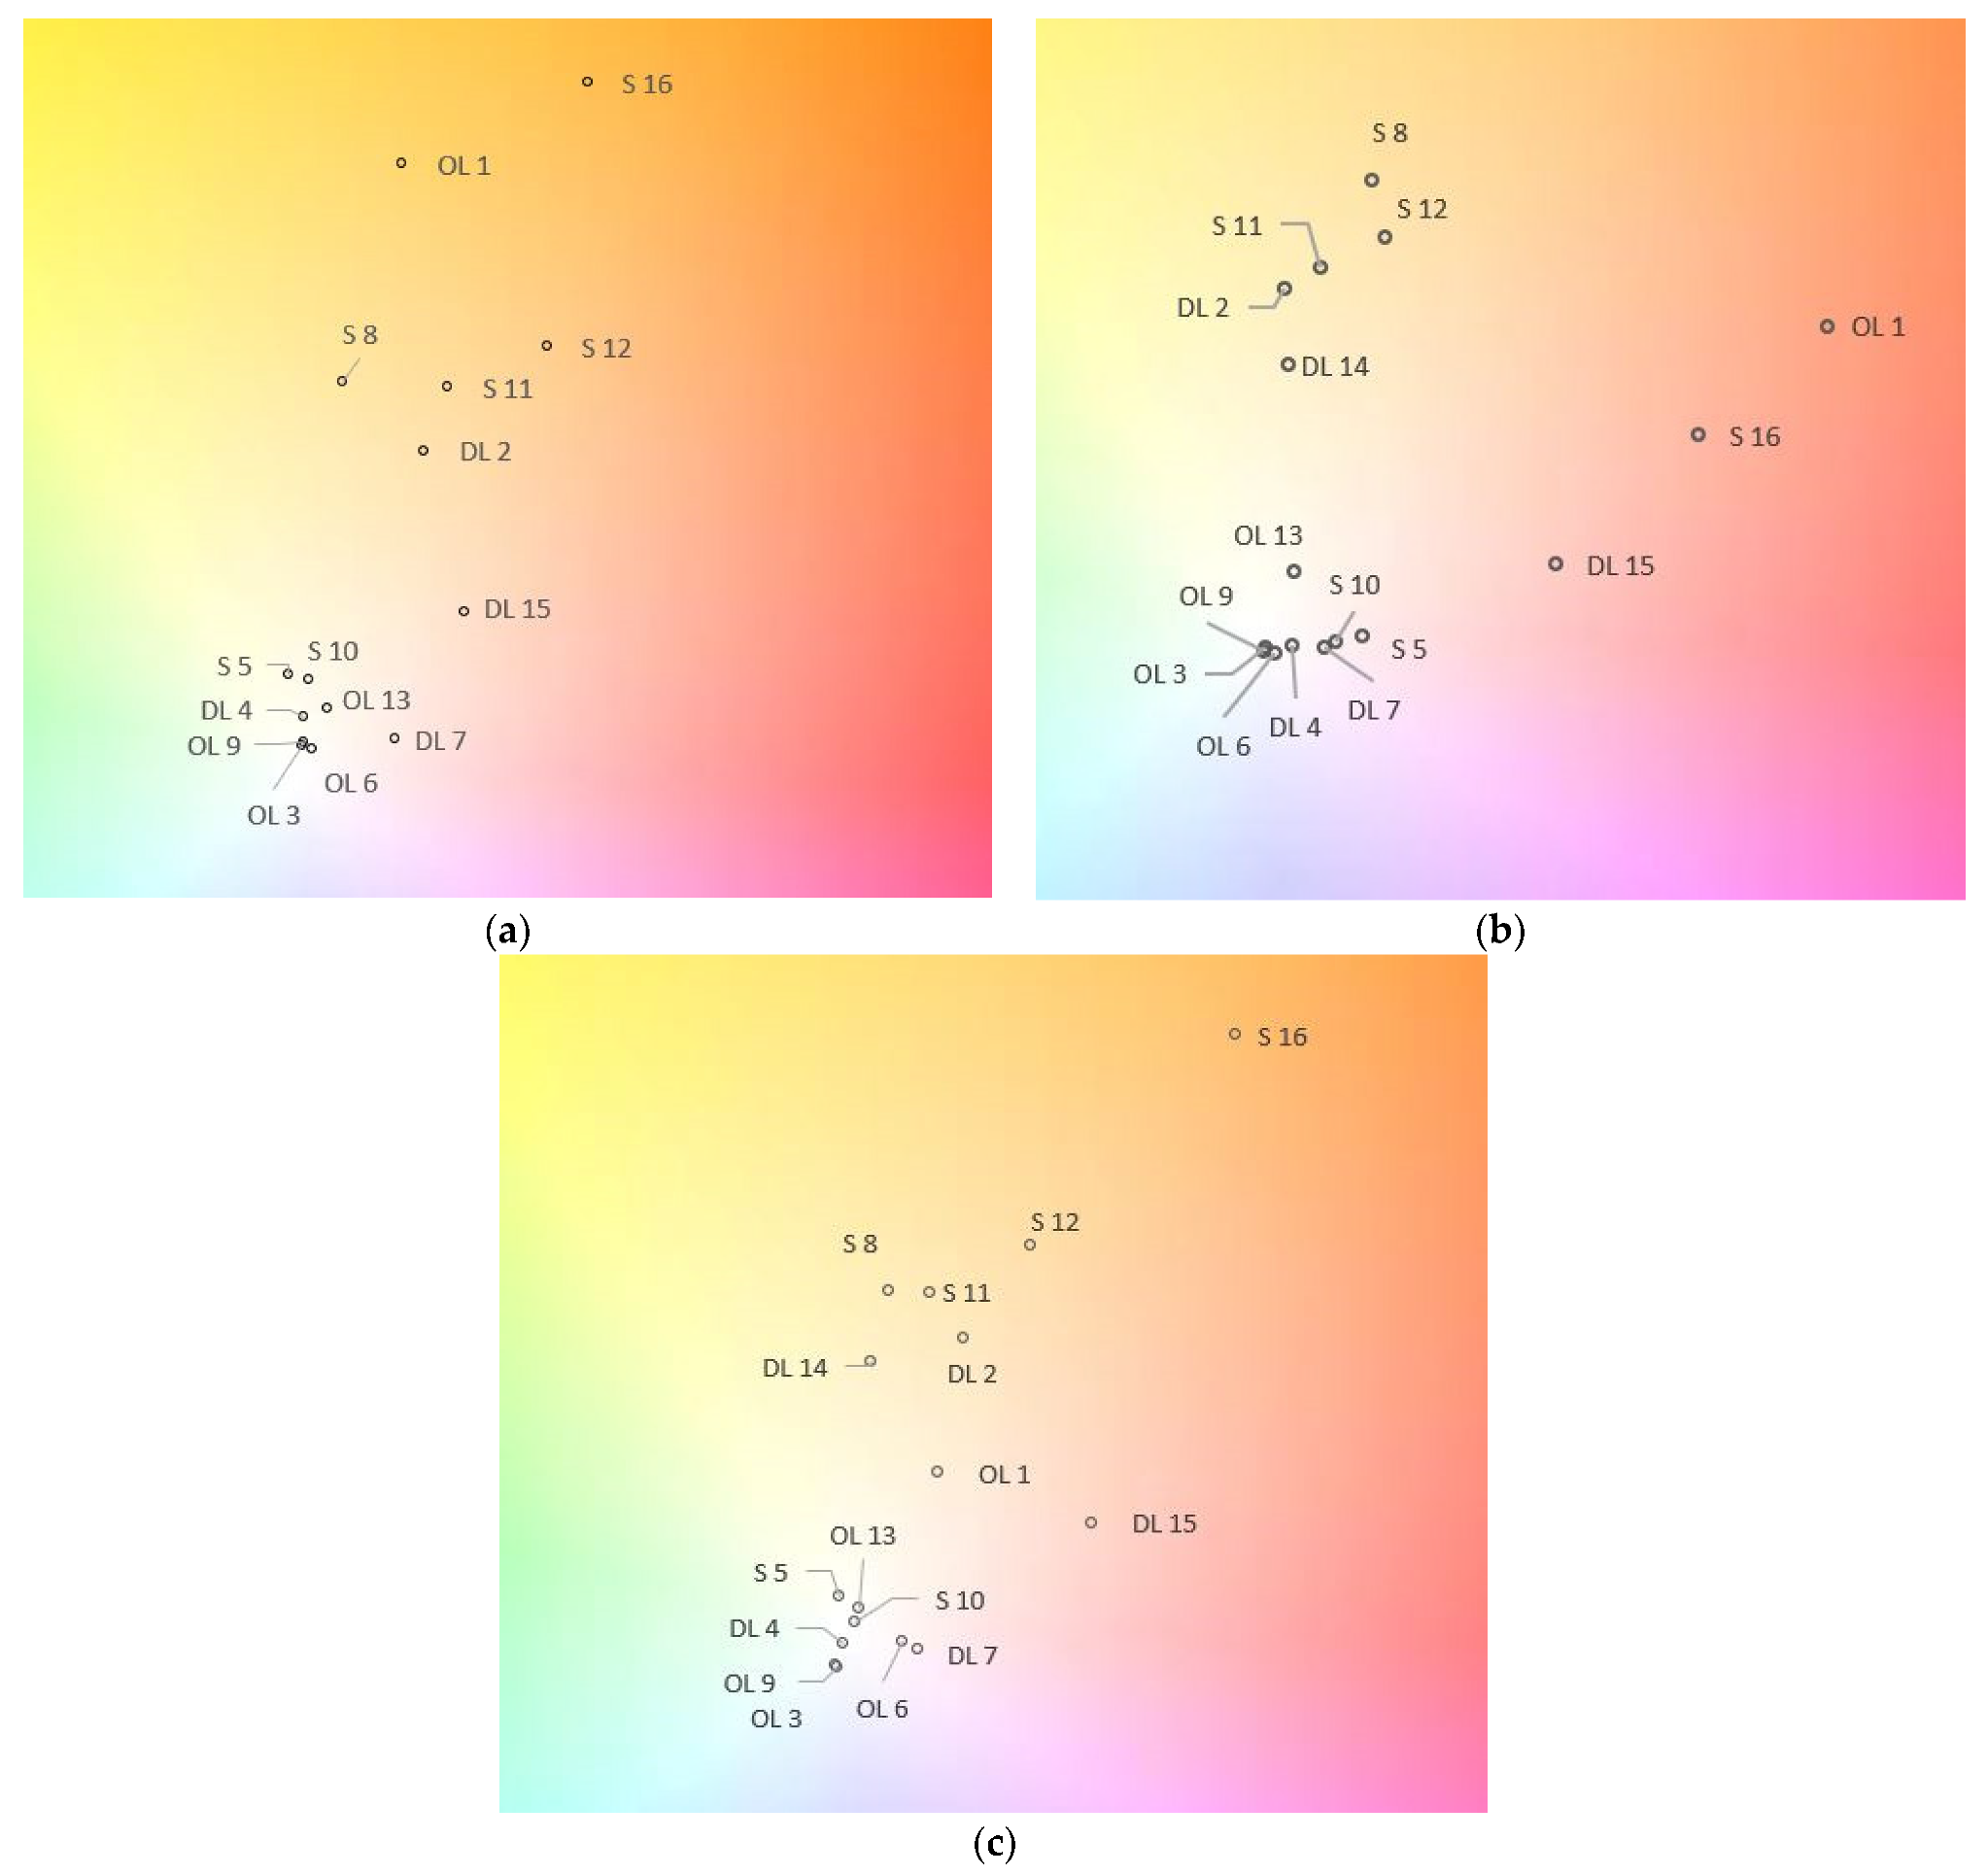
3.2. Prints
- Offset lithography (OL)
- Direct lithography (DL)
- Screen printing (S)
4. Discussion
5. Conclusions
Author Contributions
Funding
Institutional Review Board Statement
Data Availability Statement
Conflicts of Interest
Appendix A


References
- Falk, D.; Brill, D. David Stork: Seeing the Light. Optics in Nature, Photography, Color, Vision, and Holography; Echo Point Books & Media: Brattleboro, VT, USA, 2020. [Google Scholar]
- Loske, A.; Colour, A. Visual History; ILEX: Lewes, UK, 2019. [Google Scholar]
- Eckstut, J.; Eckstut, A. The Secret Language of Color; Black Dog & Leventhal Publishers: New York, NY, USA, 2013. [Google Scholar]
- Parraman, C.; Klein, S. Printing the light. Color. Technol. 2021, 137, 86–89. [Google Scholar] [CrossRef]
- Carter, K. How to Print Successfully Using Soft and Hard Proofs. Canon Europe. 2021. Available online: https://www.canon-europe.com/pro/stories/soft-hard-proofing/ (accessed on 31 October 2021).
- Maile, F.J.; Pfaff, G.; Reynders, P. Effect pigments—Past, present and future. Prog. Org. Coat. 2005, 54, 150–163. [Google Scholar] [CrossRef]
- Merck. Effect Pigments. 2021. Available online: https://www.merckgroup.com/en/expertise/effect-pigments/services/basic-pigment-technology.html (accessed on 31 October 2021).
- Merck. RGB Printing. 2021. Available online: https://www.merckgroup.com/en/expertise/effect-pigments/solutions/printing/rgb.html (accessed on 31 October 2021).
- Kipphan, H. Printing Technologies with Permanent Printing Master. In Handbook of Print Media; Kipphan, H., Ed.; Springer: Berlin/Heidelberg, Germany, 2001. [Google Scholar] [CrossRef]
- Association FoFT. FLEXOGRAPHY: Principles & Practices 6.0; Association FoFT: Bohemia, NY, USA, 2013. [Google Scholar]
- Print Club London. Screen Printing. The Ultimate Studio Guide, from Sketchbook to Squeegee; Thames and Hudson: London, UK, 2017; pp. 18–19. [Google Scholar]
- Spruill, S.J. Analysis of Ink Film Thickness on Screenless Lithographic Plates by Microscopy; School of Printing Rochester Institute of Technology, 1982; Available online: https://scholarworks.rit.edu/theses/5048/ (accessed on 30 October 2021).
- Horwood, R. Towards a Better Understanding of Screen Print Thickness Control. Electrocompon. Sci. Technol. 1974, 1, 129–136. [Google Scholar] [CrossRef] [Green Version]
- Kawauchi, I.; Nagashima, A.; Mizutani, K. Positive-Working Presensitized Plate for Use in Making Lithographic Printing Plate. European Patent 0 589 309 A1, 10 September 1993. [Google Scholar]
- Merck. Effect Pigments: Color Card Print; KGaA M: Darmstadt, Germany, 2021. [Google Scholar]
- Atlas Screen Supply Company. Available online: https://www.atlasscreensupply.com/blog/choosing-the-right-mesh-and-halftone-dot.htm (accessed on 30 October 2021).
- Yanoff, M.; Duker, J.S. Ophthalmology, 5th ed.; Elsevier: Amsterdam, The Netherlands, 2019; Volume xxiii, p. 1411. [Google Scholar]
- Heijl, A.; Lindgren, G.; Olsson, J. Normal Variability of Static Perimetric Threshold Values Across the Central Visual Field. Arch. Ophthalmol. 1987, 105, 1544–1549. [Google Scholar] [CrossRef] [PubMed]
- Ly, B.C.K.; Dyer, E.B.; Feig, J.L.; Chien, A.L.; Del Bino, S. Research Techniques Made Simple: Cutaneous Colorimetry: A Reliable Technique for Objective Skin Color Measurement. J. Investig. Dermatol. 2020, 140, 3–12.e1. [Google Scholar] [CrossRef] [PubMed] [Green Version]
- Klein, S.; Parraman, C.; Voges, L. How to print a rainbow. NIP Digit. Fabr. Conf. 2019, 2019, 52–55. [Google Scholar] [CrossRef]


| Pigment Name | Size Range (μm) |
|---|---|
| Spectraval Red | 5–25 |
| Spectraval Green | 5–25 |
| Spectraval Blue | 1–20 |
| Iriodin Icy White | 5–40 |
| Iriodin Platinum Gold | 10–60 |
| Iriodin Solar Gold | 10–60 |
| Pyrisma Amber cup Orange | 5–35 |
| Ingredient | Percentage by Weight |
|---|---|
| Effect pigment | 30 |
| Talc | 20 |
| Linseed oil, 45 poise | 40 |
| Linseed oil | 10 |
| Color | Pigment | Medium |
|---|---|---|
| Red 1 | 36 g | 400 g |
| Green 1 | 48 g | 400 g |
| Blue 1 | 40 g | 400 g |
| Red 2 | 18 g | 400 g |
| Green 2 | 24 g | 400 g |
| Blue 2 | 20 g | 400 g |
| Color Separation | Screen Angle |
|---|---|
| Cyan positive | 105 |
| Magenta positive | 75 |
| Yellow positive | 0 |
| Black positive | 45 |
| Red negative | 15 |
| Green negative | 75 |
| Blue negative | 45 |
| Cyan negative | 105 |
| Magenta negative | 75 |
| Yellow negative | 0 |
| Black negative | 45 |
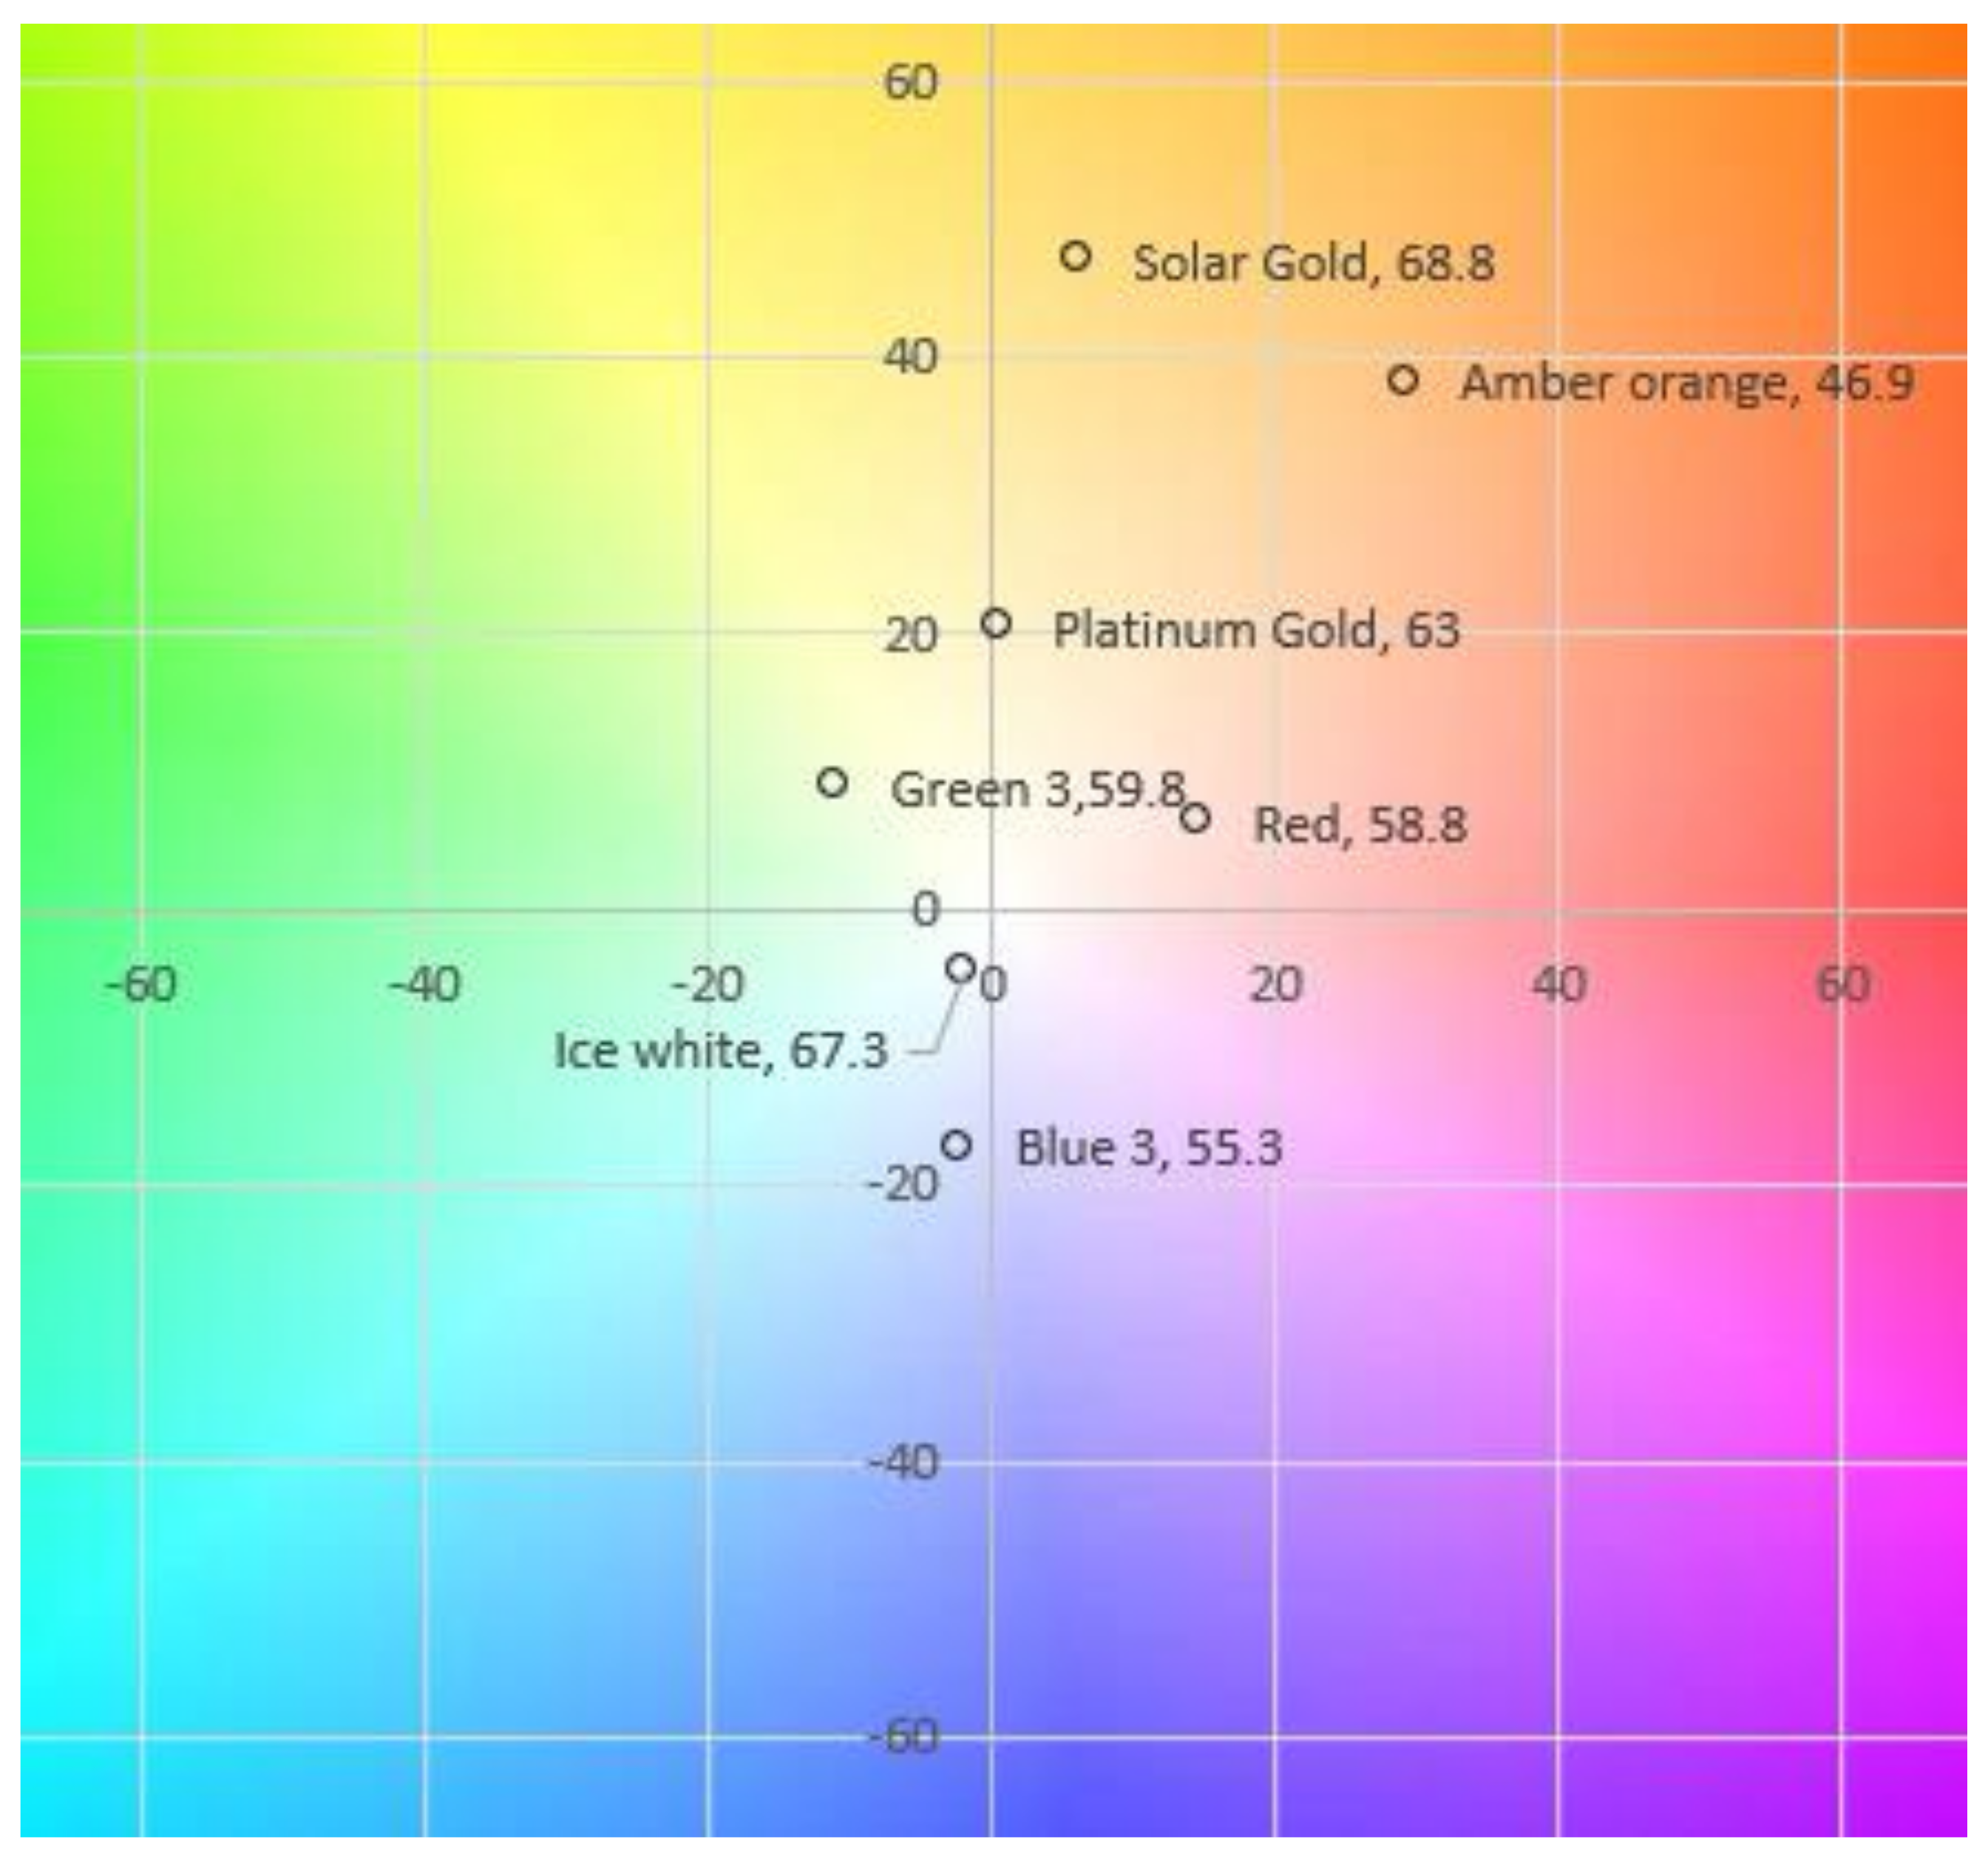
| Code | L* | ΔL* | a* | Δa* | b* | Δb* |
|---|---|---|---|---|---|---|
| Amber Orange | 46.94 | 2.66 | 29.18 | 2.74 | 38.24 | 3.19 |
| Blue 3 | 52.72 | 6.31 | 2.39 | 0.09 | −30.39 | 2.02 |
| Green 3 | 59.76 | 4.63 | −10.96 | 0.88 | 8.81 | 0.85 |
| Icy white | 67.29 | 5.38 | −2.02 | 0.12 | −4.44 | 0.66 |
| Platinum Gold | 62.99 | 0.43 | 0.44 | 0.07 | 20.34 | 0.56 |
| Red | 58.82 | 1.61 | 14.57 | 0.07 | 6.23 | 0.53 |
| Solar Gold | 68.84 | 3.44 | 6.15 | 0.65 | 47.01 | 4.50 |
| Code | Method | Paper 1 | Film | Inks | Image Number |
|---|---|---|---|---|---|
| S 5 | Screen Printing | Black | Negative | RGB 1 | 1 |
| DL 15 | Direct Litho | White | Positive | S S on Y plate + M | 2 |
| OL 1 | Offset Litho | White | Positive | YMCK | 3 |
| DL 2 | Direct Litho | White | Positive | YMCK+ S | 4 |
| DL 14 | Direct Litho | White | Positive | S on Y plate | 5 |
| OL 13 | Offset Litho | Black | Positive | I & P, l to d | 6 |
| OL 9 | Offset Litho | Black | Negative | R″G‴B″ | 7 |
| DL 7 | Direct Litho | Black | Negative | BGR | 8 |
| DL 4 | Direct Litho | Black | Negative | RGB | 9 |
| OL 6 | Offset Litho | Black | Negative | R″G‴B‴ | 10 |
| OL 3 | Offset Litho | Black | Negative | R″G‴B’’’’ | 11 |
| S 16 | Screen Printing | White | Positive | CMYK | 12 |
| S 8 | Screen Printing | Black | Negative | RGB 2 | 13 |
| S 12 | Screen Printing | White | Positive | I & P, l to d | 14 |
| S 11 | Screen Printing | Black | Positive | I & P, d to l | 15 |
| S 10 | Screen Printing | Black | Negative | RGB 3 |
| Code | L* | ΔL | a* | Δa* | b* | Δb* |
|---|---|---|---|---|---|---|
| DL 14 | 88.80 | 0.66 | 2.45 | 0.27 | 20.28 | 0.67 |
| DL 15 | 82.43 | 0.67 | 14.67 | 0.67 | 11.55 | 0.67 |
| DL 2 | 78.41 | 1.74 | 11.17 | 2.09 | 26.20 | 3.09 |
| OL 1 | 77.99 | 1.63 | 9.22 | 2.49 | 52.08 | 2.54 |
| S 16 | 69.45 | 4.71 | 25.67 | 8.51 | 59.46 | 1.72 |
| S 5 | 63.29 | 0.43 | −0.90 | 0.24 | 5.99 | 0.27 |
| S 8 | 60.37 | 0.94 | 3.82 | 0.12 | 32.33 | 0.86 |
| S 12 | 56.87 | 0.45 | 22.06 | 1.90 | 35.56 | 1.39 |
| S 10 | 47.39 | 1.02 | 0.92 | 0.13 | 5.49 | 0.08 |
| S 11 | 45.02 | 1.68 | 13.28 | 1.64 | 31.95 | 0.35 |
| DL 4 | 40.45 | 0.76 | 0.41 | 0.31 | 2.10 | 0.14 |
| DL 7 | 38.58 | 0.66 | 8.48 | 0.59 | 0.12 | 0.06 |
| OL 9 | 29.84 | 0.56 | 0.36 | 0.12 | −0.23 | 0.20 |
| OL 6 | 29.27 | 0.98 | 1.17 | 0.50 | −0.75 | 0.74 |
| OL 13 | 26.93 | 0.17 | 2.47 | 0.10 | 2.97 | 0.33 |
| OL 3 | 26.59 | 0.00 | 0.26 | 0.00 | −0.51 | 0.00 |
| Code | L* | ΔL | a* | Δa* | b* | Δb* |
|---|---|---|---|---|---|---|
| DL 14 | 90.03 | 0.70 | 2.14 | 0.29 | 19.34 | 1.31 |
| DL 15 | 80.46 | 1.47 | 21.78 | 2.11 | 4.93 | 0.49 |
| S 12 | 63.11 | - | 9.20 | - | 28.52 | - |
| DL 2 | 60.90 | 0.01 | 1.85 | 0.20 | 24.80 | 1.04 |
| S 11 | 60.23 | - | 4.44 | - | 26.35 | - |
| S 8 | 46.39 | 0.00 | 8.26 | 0.23 | 32.64 | 0.12 |
| S 5 | 37.92 | 0.78 | 7.48 | 0.07 | −0.21 | 0.15 |
| S 16 | 34.73 | 1.84 | 32.25 | 3.61 | 14.21 | 0.83 |
| OL 1 | 33.49 | 1.25 | 41.61 | 0.39 | 22.16 | 1.93 |
| DL 7 | 32.31 | 0.08 | 4.69 | 0.04 | −1.02 | 0.00 |
| DL 4 | 30.90 | - | 2.43 | - | −0.91 | - |
| S 10 | 30.10 | 0.39 | 5.56 | 0.15 | −0.69 | 0.25 |
| OL 13 | 28.86 | 0.33 | 2.49 | 0.02 | 4.45 | 0.04 |
| OL 6 | 25.67 | - | 1.07 | - | −1.47 | - |
| OL 9 | 24.81 | 0.29 | 0.29 | 0.14 | −1.29 | 0.16 |
| OL 3 | 24.68 | - | 0.41 | - | −1.08 | - |
| Code | L* | ΔL | a* | Δa* | b* | Δb* |
|---|---|---|---|---|---|---|
| DL 14 | 88.42 | 0.35 | 2.73 | 0.13 | 21.28 | 0.46 |
| DL 15 | 79.59 | 0.38 | 19.72 | 0.58 | 8.71 | 0.45 |
| OL 1 | 72.28 | 5.85 | 7.90 | 0.82 | 12.61 | 2.28 |
| DL 2 | 69.99 | 0.10 | 9.87 | 0.98 | 23.16 | 0.16 |
| S 16 | 63.13 | 0.37 | 30.79 | 0.02 | 46.66 | 2.13 |
| S 5 | 60.12 | 0.79 | 0.31 | 0.51 | 3.05 | 0.12 |
| S 12 | 59.82 | 0.69 | 15.04 | 0.14 | 30.35 | 1.03 |
| S 8 | 59.21 | 1.16 | 4.10 | 0.27 | 26.84 | 1.44 |
| S 11 | 51.40 | 0.14 | 7.34 | 0.33 | 26.66 | 0.29 |
| S 10 | 43.86 | 0.46 | 1.48 | 0.17 | 1.01 | 0.29 |
| DL 7 | 43.59 | 1.29 | 6.36 | 1.12 | −1.09 | 0.35 |
| DL 4 | 37.97 | 1.94 | 0.59 | 0.35 | −0.74 | 0.45 |
| OL 6 | 32.64 | 5.43 | 5.12 | 2.87 | −0.59 | 0.25 |
| OL 9 | 28.92 | 0.68 | 0.20 | 0.06 | −2.49 | 0.37 |
| OL 3 | 26.35 | 0.00 | 0.02 | 0.00 | −2.36 | 0.00 |
| OL 13 | 25.86 | 0.25 | 1.73 | 0.20 | 2.06 | 0.23 |
| Code | L | ΔL | C | ΔC | h | Δh | Paper/Film/Ink |
|---|---|---|---|---|---|---|---|
| DL 14 | 88.28 | 1.18 | 21.54 | 1.81 | 1.44 | 0.02 | White Positive S on Y plate |
| DL 15 | 80.28 | 0.76 | 21.00 | 0.45 | 0.45 | 0.09 | White Positive S on Y plate |
| DL 2 | 73.65 | 7.16 | 30.39 | 1.75 | 1.20 | 0.07 | White Positive YMCK+ S |
| S 16 | 69.45 | - | 64.76 | - | 1.16 | - | White Positive CMYK |
| OL 1 | 66.58 | 10.09 | 50.39 | 4.06 | 1.21 | 0.17 | White Positive YMCK |
| S 5 | 60.08 | 3.53 | 4.94 | 1.24 | −0.10 | 1.56 | Black Negative RGB 1 |
| S 8 | 57.73 | 2.41 | 33.48 | 0.79 | 1.44 | 0.01 | Black Negative RGB 2 |
| S 12 | 57.48 | 1.15 | 29.80 | 19.96 | 1.06 | 0.07 | White Positive I & P, dark to light |
| S 11 | 49.53 | 4.35 | 31.37 | 3.20 | 1.24 | 0.06 | Black Positive I & P, dark to light |
| S 10 | 45.70 | 3.75 | 4.94 | 1.38 | 0.30 | 1.57 | Black Negative RGB 3 |
| DL 4 | 39.27 | 1.06 | 1.70 | 0.64 | 0.99 | 0.57 | Black Negative S on Y plate |
| DL 7 | 36.70 | 3.91 | 6.17 | 2.18 | −0.04 | 0.04 | Black Negative BGR |
| OL 9 | 28.84 | 0.93 | 1.23 | 0.67 | −1.03 | 0.31 | Black Negative R″G‴B″ |
| OL 6 | 28.53 | 0.93 | 1.64 | 0.32 | −0.75 | 0.21 | Black Negative R″G‴B‴ |
| OL 13 | 26.74 | 0.32 | 3.41 | 0.40 | 0.92 | 0.04 | Black Positive I & P, light to dark |
| OL 3 | 26.30 | 0.34 | 1.14 | 0.48 | −1.27 | 0.17 | Black Negative R″G‴B’’’’ |
| Code | L | ΔL | C | ΔC | h | Δh | Paper/Film/Ink |
|---|---|---|---|---|---|---|---|
| DL 14 | 89.73 | 0.58 | 19.76 | 1.15 | 1.46 | 0.00 | White Positive S on Y plate |
| DL 15 | 79.60 | 1.02 | 23.53 | 1.04 | 0.20 | 0.04 | White Positive S on Y plate |
| S 12 | 64.33 | 1.73 | 30.15 | 0.26 | 1.29 | 0.04 | White Positive I & P, dark to light |
| DL 2 | 61.62 | 0.67 | 25.23 | 1.65 | 1.44 | 0.14 | White Positive CMYK + S |
| S 11 | 60.73 | 0.44 | 24.85 | 1.62 | 1.41 | 0.01 | White Positive YMCK |
| S 8 | 46.39 | 0.58 | 29.38 | 6.44 | 1.30 | 0.04 | Black Negative RGB 2 |
| S 5 | 37.25 | 1.66 | 7.33 | 0.51 | −0.05 | 0.09 | Black Negative RGB 1 |
| S 16 | 34.73 | 35.24 | 0.41 | White Positive CMYK | |||
| OL 1 | 31.85 | 0.88 | 28.58 | 21.93 | 0.30 | 0.44 | White Positive YMCK |
| DL 7 | 32.00 | 0.27 | 4.50 | 0.26 | −0.21 | 0.01 | Black negative BGR |
| DL 4 | 29.51 | 1.31 | 2.33 | 1.63 | −0.40 | 0.05 | Black Negative S on Y plate |
| S 10 | 29.41 | 1.03 | 5.40 | 0.22 | −0.12 | 0.07 | Black Negative RGB 3 |
| OL 13 | 28.12 | 0.80 | 4.25 | 0.87 | 1.04 | 0.02 | Black Positive I & P, light to dark |
| OL 6 | 26.18 | 0.44 | 1.86 | 0.16 | −0.77 | 0.29 | Black Negative R″G‴B‴ |
| OL 9 | 25.13 | 0.33 | 1.38 | 0.06 | −1.25 | 0.14 | Black negative R″G‴B″ |
| OL 3 | 24.61 | 0.38 | 1.16 | 0.07 | −1.22 | 0.20 | Black Negative R″G‴B’’’’ |
| Code | L | ΔL | C | ΔC | h | Δh | Paper/Film/Ink |
|---|---|---|---|---|---|---|---|
| DL 14 | 90.90 | 3.50 | 18.79 | 3.77 | 1.49 | 0.07 | White Positive S on Y plate |
| DL 15 | 80.21 | 0.88 | 21.39 | 0.24 | 0.37 | 0.06 | White Positive S on Y plate |
| OL 1 | 69.34 | 4.16 | 22.36 | 10.58 | 0.98 | 0.05 | White Positive YMCK |
| DL 2 | 74.78 | 6.77 | 20.59 | 6.49 | 1.10 | 0.09 | White Positive CMYK + S |
| S 16 | 63.13 | 55.90 | 0.99 | 0.00 | White Positive YMCK | ||
| S 5 | 60.79 | 0.95 | 1.65 | 2.01 | 0.93 | 0.76 | Black Negative RGB 1 |
| S 12 | 59.82 | 0.00 | 33.87 | 0.00 | 1.11 | 0.00 | White Positive I & P, dark to light |
| S 8 | 61.60 | 3.37 | 21.59 | 7.87 | 1.40 | 0.03 | Black Negative RGB 2 |
| S 11 | 45.05 | 8.98 | 25.87 | 2.51 | 1.24 | 0.08 | White Positive YMCK |
| S 10 | 44.64 | 1.10 | 1.68 | 0.16 | −0.42 | 1.45 | Black Negative RGB 3 |
| DL 7 | 42.72 | 1.23 | 5.92 | 0.76 | −0.20 | 0.04 | Black negative BGR |
| DL 4 | 38.26 | 0.40 | 1.46 | 0.73 | −0.63 | 0.38 | Black Negative S on Y plate |
| OL 9 | 32.03 | 0.86 | 3.73 | 2.02 | 0.46 | 0.81 | Black negative R″G‴B″ |
| OL 6 | 29.15 | 0.32 | 2.83 | 0.47 | −1.34 | 0.21 | Black Negative R″G‴B‴ |
| OL 3 | 27.67 | 1.86 | 2.04 | 0.45 | −0.31 | 1.76 | Black Negative R″G‴B’’’’ |
| OL 13 | 25.35 | 0.72 | 1.86 | 1.17 | 0.77 | 0.14 | Black Positive I & P, light to dark |
Publisher’s Note: MDPI stays neutral with regard to jurisdictional claims in published maps and institutional affiliations. |
© 2022 by the authors. Licensee MDPI, Basel, Switzerland. This article is an open access article distributed under the terms and conditions of the Creative Commons Attribution (CC BY) license (https://creativecommons.org/licenses/by/4.0/).
Share and Cite
Trujillo-Vazquez, A.; Fuller, H.; Klein, S.; Parraman, C. The Amber Project: A Survey of Methods and Inks for the Reproduction of the Color of Translucent Objects. Appl. Sci. 2022, 12, 793. https://doi.org/10.3390/app12020793
Trujillo-Vazquez A, Fuller H, Klein S, Parraman C. The Amber Project: A Survey of Methods and Inks for the Reproduction of the Color of Translucent Objects. Applied Sciences. 2022; 12(2):793. https://doi.org/10.3390/app12020793
Chicago/Turabian StyleTrujillo-Vazquez, Abigail, Harrie Fuller, Susanne Klein, and Carinna Parraman. 2022. "The Amber Project: A Survey of Methods and Inks for the Reproduction of the Color of Translucent Objects" Applied Sciences 12, no. 2: 793. https://doi.org/10.3390/app12020793
APA StyleTrujillo-Vazquez, A., Fuller, H., Klein, S., & Parraman, C. (2022). The Amber Project: A Survey of Methods and Inks for the Reproduction of the Color of Translucent Objects. Applied Sciences, 12(2), 793. https://doi.org/10.3390/app12020793