Article

Multi-Objective Optimization of Hybrid Renewable Tri-Generation System Performance for Buildings

1
Mechanical Department, Faculty of Engineering, Alexandria University, Alexandria 21928, Egypt
2
Natural Resources Canada, Canmet Energy Technology Centre, 1 Haanel Dr, Ottawa, ON K1A 1M1, Canada
3
Korea Institute of Energy Research, 152 Gajeong-ro, Yuseong-gu, Daejeon 34129, Korea
4
Department of Architectural Engineering, Pusan National University, 2 Busandaehak-ro 63beon-gil, Jangjeon 2(i)-dong, Geumjeong-gu, Busan 46241, Korea
*
Author to whom correspondence should be addressed.
Appl. Sci. 2022, 12(2), 888; https://doi.org/10.3390/app12020888
Submission received: 7 December 2021 / Revised: 11 January 2022 / Accepted: 11 January 2022 / Published: 16 January 2022
(This article belongs to the Section Energy Science and Technology)

Abstract

:
Hybrid renewable energy systems are subject to extensive research around the world and different designs have found their way to the market and have been commercialized. These systems usually employ multiple components, both renewable and conventional, combined in a way to increase the system’s overall efficiency and resilience and to lower GHG emissions. In this paper, a hybrid renewable energy system was designed for residential use and its annual energy performance was investigated and optimized. The multi-module hybrid system consists of a Ground-Air Heat Exchanger (GAHX), Photovoltaic Thermal (PVT) panels and Air to Water Heat Pump (AWHP). The developed system’s annual performance was simulated in the TRaNsient SYStem (TRNSYS) environment and optimized using the General Algebraic Modelling System (GAMS) platform. Multi-objective non-linear optimization algorithms were developed and applied to define optimal system design and performance parameters while reducing cost and GHG emissions. The results revealed that the designed system was able to satisfy building thermal heating/cooling loads throughout the year. The ground source heat exchanger contributed 21.3% and 26.3% of the energy during heating and cooling seasons, respectively. The initial design was optimized in terms of key performance parameters and module sizes. The annual simulation analysis showed that the system was able to self-generate and meet nearly 29.4% of the total HVAC electricity needs, with the rest being supplied by the grid. The annual system module performance efficiencies were 13.4% for the PVT electric and 5.5% for the PVT thermal, with an AWHP COP of 4.0.

1. Introduction

Micro combined heat and power systems (MCHP) can produce both heat and power at the point of use [1], and they are emerging as a novel solution to reduce energy consumption and pollutant emissions from the residential/commercial sector. MCHPs possess high efficiency, good environmental footprint, offset centrally-generated grid electricity, enhance energy security and avoid transmission/distribution losses [2,3,4,5]. In recent years, significant advances have been noticed in hybrid systems modeling, simulations and development featuring a family of technologies, such as micro-turbines [6,7], internal combustion engines [8,9,10,11,12,13], organic Rankine cycle [6,14,15], Stirling engines [8,16,17,18], fuel cells [7,19,20,21,22,23,24,25] and photovoltaic thermal (PVT) [8,19,26].
Recently, a handful of renewable technologies, such as wind turbines, solar photovoltaics, solar thermal, etc., are being developed and commercialized. One technology, photovoltaic thermal (PVT), is gaining rapid market share due to its dual function (power and heat generation), which results in a higher solar conversion rate and efficiency. However, the availability of PVT collectors and systems is still limited due to the high cost and product reliability [27,28], but a higher penetration rate is envisioned shortly, and significant improvements are still required in terms of energy conversion and effectiveness, thermal absorber design, materials and coating selections, cost minimization, overall system optimization, and control [27,28].
Kim et al. [29] studied Heat Exchange Rate Analysis of a Low-depth Modular Ground Heat Exchanger through a Real-scale Experiment, while Kim et al. [30] conducted a sensitivity study of the air baffle of a PVT model.
While micro-cogeneration is recognized as one of the most promising decentralized technologies, there is renewed interest in conventional options, such as ground source heat pumps (GSHPs), as an efficient and environmentally friendly way for heating and cooling buildings [31,32,33,34]. The number of installed GSHPs is on a rise [34] due to technological advances and integration with other conventional and renewable energy technologies. Most GSHPs feature ground-coupled heat pump systems with vertical boreholes that are considered the most valuable option [33,34]. GSHP system performance is the subject of continuous research in terms of physical parameters (e.g., heat reservoir temperature and geological characteristics of the site), operational characteristics (e.g., the time distribution of the cooling/heating demand), as well as construction and qualitative characteristics of the system [33,34].
The International Energy Agency’s Energy, Buildings and Communities (IEA/EBC) has undertaken an in-depth analysis of microgeneration and other associated energy technologies in buildings [35]. Annex 54 took a close look at multi-source micro-cogeneration systems, poly-generation systems, renewable hybrid systems, and analysis of integrated and hybrid systems performance when serving single and multiple buildings [35].
Some researchers have studied hybrid systems employing MCHP, geothermal and other renewable sources. Gusdorf [11] reported experimental results of a residential tri-generation system using an internal combustion engine and ground source heat pump. Chen [36] studied a trigeneration system for a sewage treatment plant under subtropical weather conditions and showed that the use of an absorption chiller provided the highest thermal efficiency and shortest payback period.
Recently, advanced design concepts have been introduced in buildings, significantly reducing heating and cooling loads. In Europe, the passive house concept has established standards for low-energy buildings, such as airtightness ≤0.6 air change per hour (ACH) and a maximum residential dwelling heating load of less than 15 kWh/m2-yr [37]. Chel et al. [38] investigated the thermal performance of an integrated air-air heat exchanger (AAHE) and Earth-Water Heat Exchanger (EWHE) in a multi-zone passive house. The main conclusion was that AAHE and EWHE systems reduced annual heating consumption by 72% with an energy intensity of 6.9 kWh/m2-yr. The effect of the earth tube heat exchanger on the energy savings for a single house, a row-house, and a small office were investigated [39] under three different climate conditions. The simulations showed that the energy-saving increased from 2.2 to 9.4 kWh/m2 for the single house and from 1.3 to 4.1 kWh/m2 for the row house. The geothermal system was able to save 43% and 37% of the primary energy consumption during the heating and cooling seasons [40].
Calise et al. [41] studied a novel renewable trigeneration plant powered by solar, geothermal and biomass energy, producing simultaneously electricity, heating and cooling. Additionally, they implemented a dynamic simulation of a thermo-economic optimization of the polygonation plant. Furthermore, Jalalizadeh et al. [42] conducted a dynamic simulation of a trigeneration system integrating an absorption cooling system and photovoltaic thermal solar collectors. The total efficiency of the trigeneration system was 18%, with an annual solar fraction of 28%. In addition, Cioccolanti et al. [43] developed a simulation model to investigate the integration of a concentrated solar Organic Rankine Cycle with an absorption chiller for residential applications. Furthermore, Braun et al. [44] conducted a feasibility study for zero office buildings using integrated trigeneration and PVT systems.
System optimization is an important part of technology design and operation. There are a variety of programming techniques that can be applied depending on problem complexity: linear programming [45,46], mixed-integer linear programming [47,48,49,50,51,52] and mixed-integer nonlinear programming [53,54,55,56,57]. Ashouri et al. [47] used mixed-integer linear programming techniques (MILPT) to select, size and control the optimal parameters of building energy systems, whereas [48] used MILPT to select the optimal building’s utility system. Fazlollahi and Maréchal [53] applied multi-objective optimization as an alternative to the combination of mixed-integer nonlinear programming and the evolutionary algorithms approach.
The current study aims to fill a gap in the literature by estimating the optimum design parameters of the hybrid renewable tri-generation system of integrated AWHP, PVT and GAHX technologies using dynamic simulation based on a multi-objective optimization model to minimize both system cost and environmental impact. A multi-objective optimization model is developed using General Algebraic Modeling System (GAMS) techniques and is coupled with the TRNSYS model. The hybrid system performance, employing the optimum design parameters, is evaluated under a variety of conditions and operational strategies.

1.1. Hybrid Trigeneration System

The designed hybrid trigeneration system features three components with core technology being an air-to-water heat pump (AWHP) integrated with a horizontal ground-to-air heat exchanger (GAHX) and plug-in-play photovoltaic thermal (PVT) modules, as shown in Figure 1. The GAHX is used to precondition the ambient air entering the AWHP, hence improving the heat pump performance. The PVT panels are used to generate power and to preheat the AWHP inlet air. A single typical residential house with a floor area of 200 m2 is simulated under Busan weather data. The house has a heating load intensity of 32 kWh/m2-yr, a cooling load intensity of 30 kWh/m2-yr, and a DHW load intensity of 23 kWh/m2-yr.

1.2. Simulation, Modeling, Optimization and Analysis Methodology

1.2.1. TRNSYS Simulation

A TRaNsient SYStems (TRNSYS-17) software platform [58] was used to model, simulate and analyze hybrid system performance. The TRNSYS library was utilized for component model development related to buildings, thermal and electrical energy systems, input and output data management, and other dependent functions [59]. The models have been validated and upgraded with test and manufacturing data before being integrated into the overall hybrid model. The specifications of a single residential building (type 56) are presented in Table 1.
The hot water storage tank has a volume of 500 L. It is modeled as a vertical one with immersed coiled tube heat exchangers (Type 534). The tank is divided into 10 isothermal temperature nodes to model stratification in the tank. The top node is 1 and the bottom node is 10. The compact ground heat exchanger model is based on imperial equations developed by Nam et al. [60]. The exiting fluid temperature of each compact heat exchanger modular is calculated as a function of thermal resistance, entering fluid temperature, and undisturbed ground temperature.
The AWHP operation is controlled by the tank aquastat temperature (TTankB) located near the bottom of the hot water tank. The AWHP is turned on when TTankB ≤ 40 °C and turned off when TTankB ≥ 45 °C. The ambient air is preheated by the PVT during the winter season if the average air temperature inside the PVT panels is 5 °C higher than the air near the outlet of the earth tub. This operation continues until the temperature difference is less than 2 °C as shown in Table 2. In the cooling season, the ambient air is pre-cooled by the GAHX before entering the AWHP.

1.2.2. Optimization Model

A General Algebraic Modeling System (GAMS) [61] platform is used to optimize system performance. Due to model complexity and nonlinear constraints, nonlinear programming was applied. The developed programming code utilizes a multi-objective algorithm with an optimization model of 1.5 million equations and 245,299 variables.
The hybrid trigeneration system has multiple power flows and a converter (multiplication factor) was applied to the input power (P) to produce outlet energy flows (L), as shown in Equation (1), where ηoi is the input power flows efficiency matrix and Foi is the converter units’ factor. The elements of the ηoi matrix are zero when no conversion exists between the input and output energy flows. In case there is a transfer of Pi to Lo, the coupling factor presents the technology’s single efficiency. The coupling factor is equal to the product of the technology’s efficiencies in the case of more than one energy conversion technology.
[ L 1 . L o . . L O ] = η o i F o i [ P 1 . P i . P I ] ,   where   η o i   = [ η 11 · η 1 I · η o i · η O 1 · η O I ]
In addition, at each time step, the input energy for each technology is constrained by the limitation of minimum and maximum capacity as per Equation (2).
P m i n   P i P max  
The transferred energy (ET) from the hybrid system is calculated as per Equation (3). where Eo is the energy output transfer from the system to the loads and N is the total number of technologies.
E o   = N E T    

1.2.3. Objective Function

The objective function goal is to minimize system annual cost and greenhouse gas emissions. The objective function includes capital (Ccapital), electrical (Celec.), operational and maintenance (COM) costs and emissions cost (Cemission) (Equation (4)). The revenues, such as subsidy cost (Csubs), for using renewable technology and electricity cost (Csell) sold back to the grid are subtracted from the annual costs.
Objective function = Min (Ccapital + Celec. + COM + Cemission − Csubs. − Cselling)

2. Constraints

The technology constraints are generation limitations by the technology employed at each time step of the optimization (h, d). The energy generated from each technology in operation at part load conditions is between maximum and minimum capacity allowable at every time step (Equation (5)).
P L R M a x   ( T e c h C a p . ) G   T e c h , h , d M a x   ( T e c h C a p . )   T e c h , h , d
The energy generation and demand load constraints are the balance between the thermal energy supply and the thermal load at each time step (h, d) as presented in Equation (6).
T e c h G h , d ( h e a t ) D e m h , d ( h e a t )   h , d
All-time, the sum of electrical energy generation from all technologies and imported/export electricity, should satisfy the balance of electrical energy demand loads (Equation (7)).
T e c h G h , d ( e l e c . ) + E ( P u r c h a s e   o r   S e l l i n g ) h , d = D e m ( e l e c . )   h , d
The relative magnitude of the energy generation (thermal and electric) is dependent on the energy demand loads and the technologies used to produce it. The generated electricity is directed to satisfy the hybrid system power needs with excess electricity exported to the grid at each time step. If the sum of generated electricity from different technologies in use is less than the electricity demand, the electricity sold to the grid is equal to zero (Equation (8)). The electricity exported to the grid is equal to the difference between the electricity generated and the sum of electricity demands for each time interval, as shown in Equation (9). At each time interval, when the electricity generated from all technology is less than the sum of the demand, the difference is imported from the grid, as shown in Equation (10).
If   G h , d ( e l e c . ) D e m h , d ( e l e c . )   Δ G T h , d ( e l e c . ) = E S h , d = 0   h , d
If   G h , d ( e l e c . ) > D e m h , d ( e l e c . )     E S h , d = Δ G T h , d ( e l e c . )   h , d
If   G h , d ( e l e c . ) < D e m h , d ( e l e c . )     E P u r c h a s e h , d = Δ G T h , d ( e l e c . )   h , d
The capital cost is calculated according to Equation (11).
C C a p . = T e c h M a x   ( C a p . T e c h ) C C a p . ( T e c h ) R 1 1 ( 1 + R ) n ˋ     T e c h
The grid electricity cost is calculated using Equation (12).
C E l e c . = d h E P d , h E P p r i c e       d , h  
The operation and maintenance costs are calculated based on annual fixed costs with a fraction value of the capital cost of each technology (Equation (13)).
C O M = T e c h C C a p . ( T e c h ) f r
The emission cost is calculated based on the tax charge per ton of emission (CAD 25/ton of CO2). The CO2 emission factor for grid electricity in Incheon (ROK) is 590 CO2e g/kWh. The generated energy by the PVT electricity reduces the CO2 emission with a value of MRCO2 (Equation (14)).
C e m i s s i o n = C e m i s s i o n   p e r   t o n ( M P CO 2 M R CO 2 )  
The revenue stream includes subsidies and incentives available for renewable technologies (Equation (15)).
C S u b s . = T e c h ( s f T e c h C o s t c a p . ( T e c h ) )     T e c h  
The cost of exported electricity to the grid is calculated according to Equation (16).
C S e l l i n g   = d h E S d , h E S p r i c e     d , h  

3. Simulation Methodology

An annual simulation was performed for a single house under Incheon, Republic of Korea, weather conditions. Co-simulation between GAMS and TRNSYS has been applied. Figure 2 shows flowchart design system optimization and simulation for Trigeneration System. The hybrid trigeneration system TRNSYS’s component models AWHP, PVT and GAHX have been validated using the manufacturers’ experimentally generated performance data. The performance for each component of the trigeneration system is fed to GAMS alone with thermal and non-HVAC electrical loads and weather data in addition to capital, installation and maintenance, and operation costs for each unit and energy price cost. To solve the complex optimization problem, a nonlinear programming solver of GAMS was used. The optimum design parameters of the AWHP size, GAHX length and PVT surface area are returned to the TRNSYS model for a complete hybrid system annual simulation. TRNSYS output is then used to conduct annual energy and cost analyses.
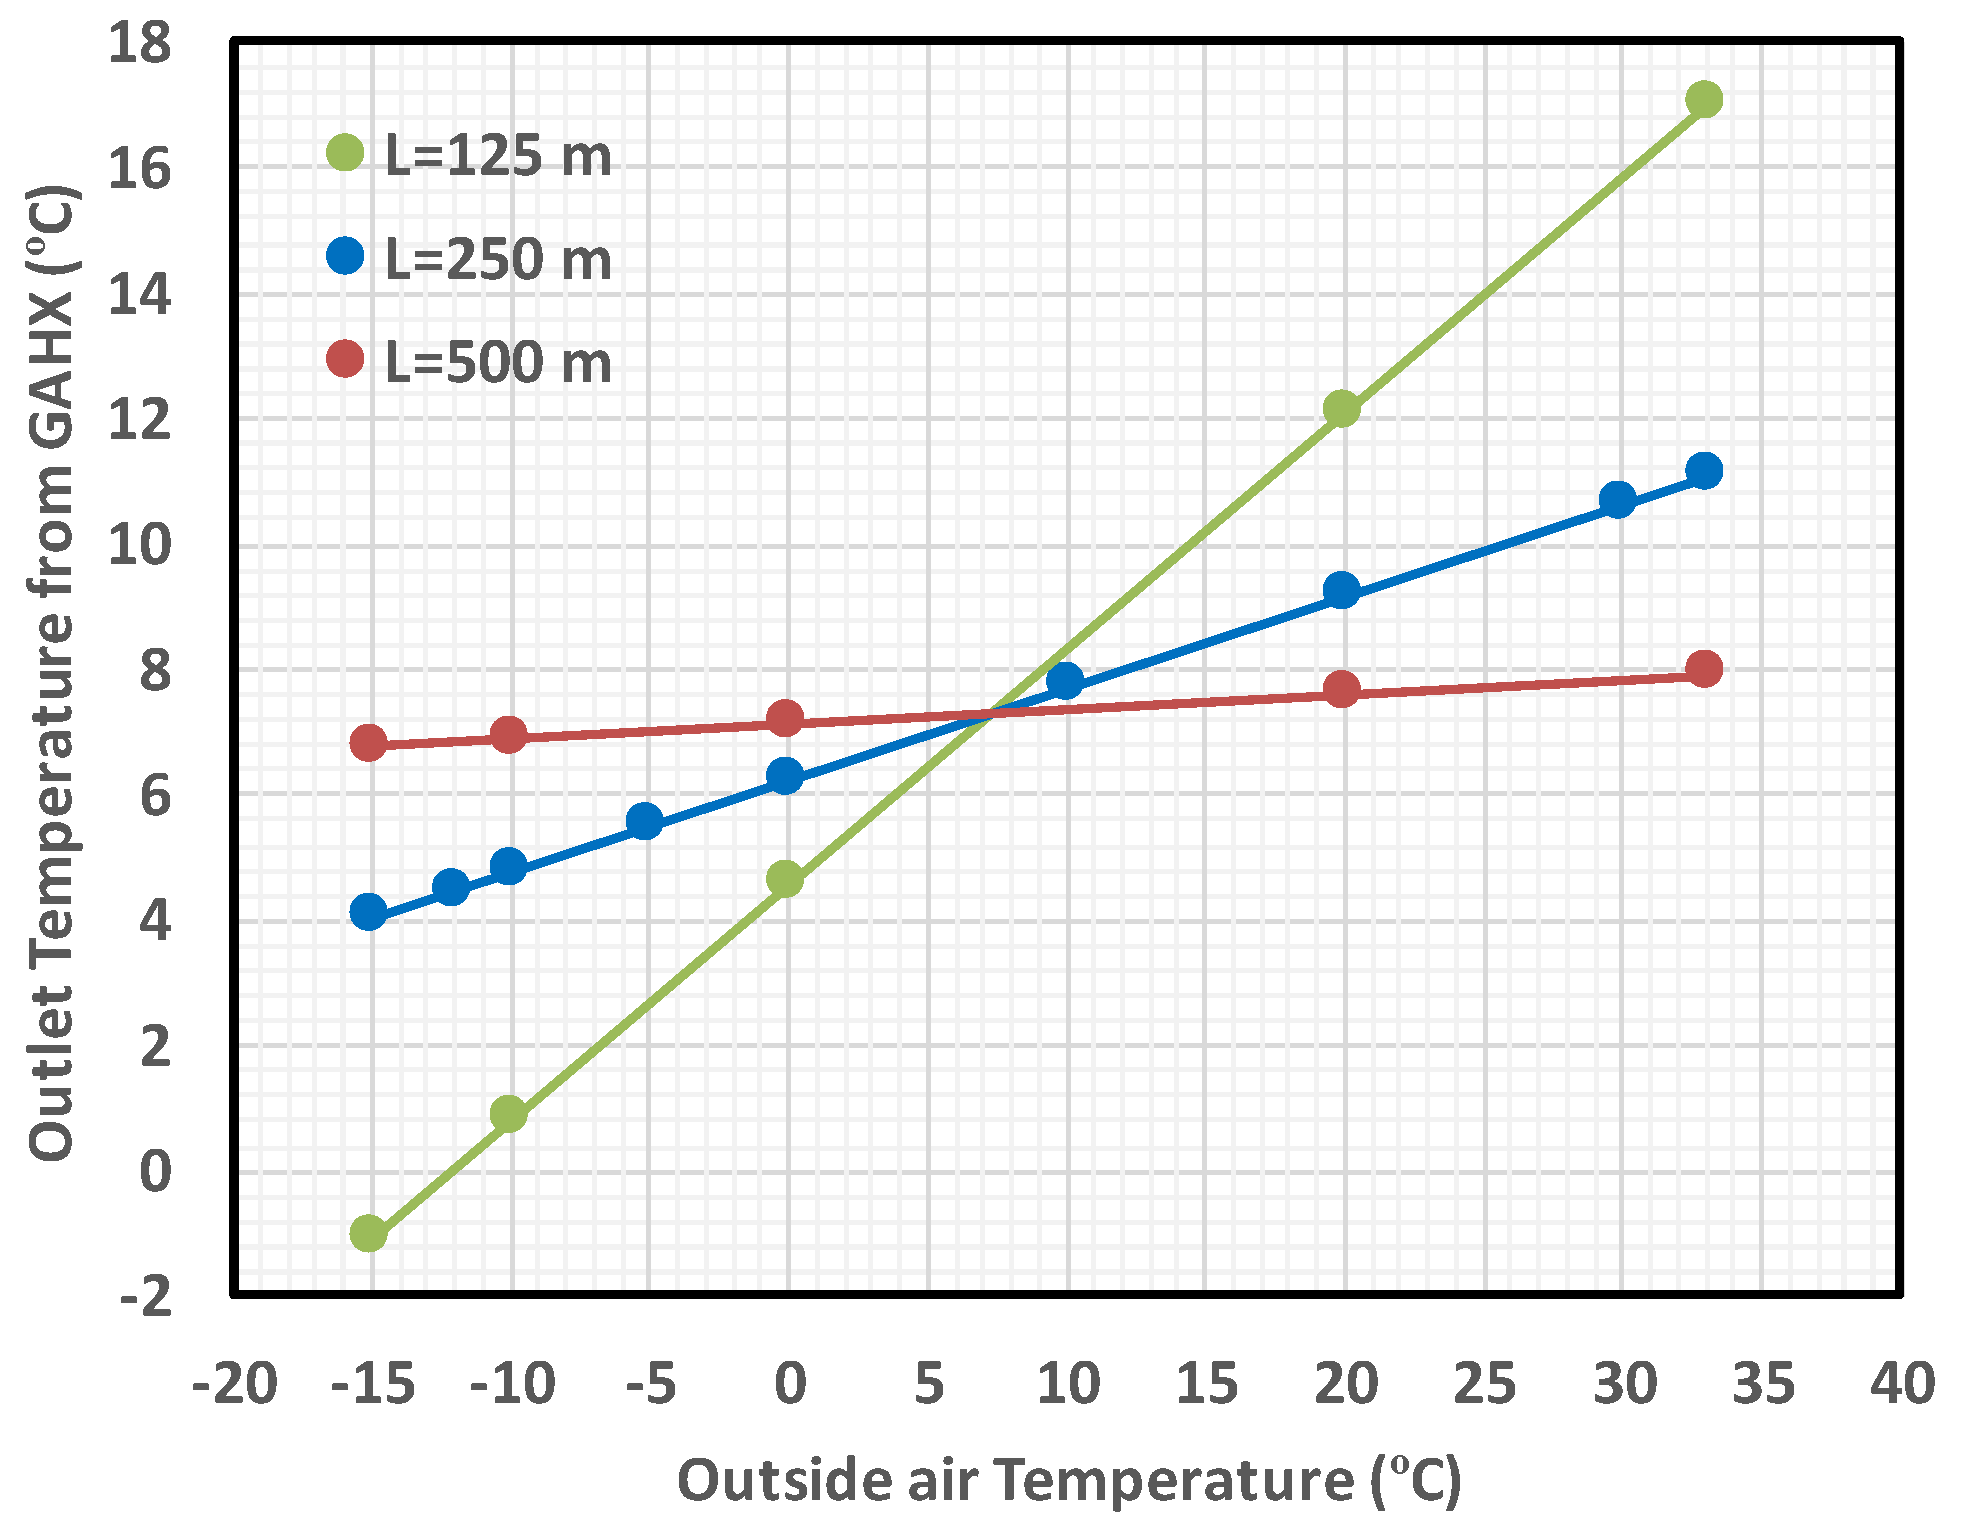
Figure 3 presents GAHX outlet temperatures at different pipe lengths and outside air temperatures during summer/winter conditions. The GAHX performance data are based on a constant airflow rate of 2900 kg/h. The results showed that the outlet airflow temperatures from the GAHX range from −1 °C to 4 °C when the outside air temperature is below zero degrees, with a GAHX length of 125 m. The outlet temperature from GAHX reaches 17 °C on the warmest day of 35 °C. Moreover, for further increases in GAHX length, the outlet airflow temperature from GAHX increases in the winter season and decreases in the summer season. At a GAHX length of 500 m, there is no significant variation in outlet airflow temperature from GAHX in winter and summer seasons, with an average temperature of 7 °C.
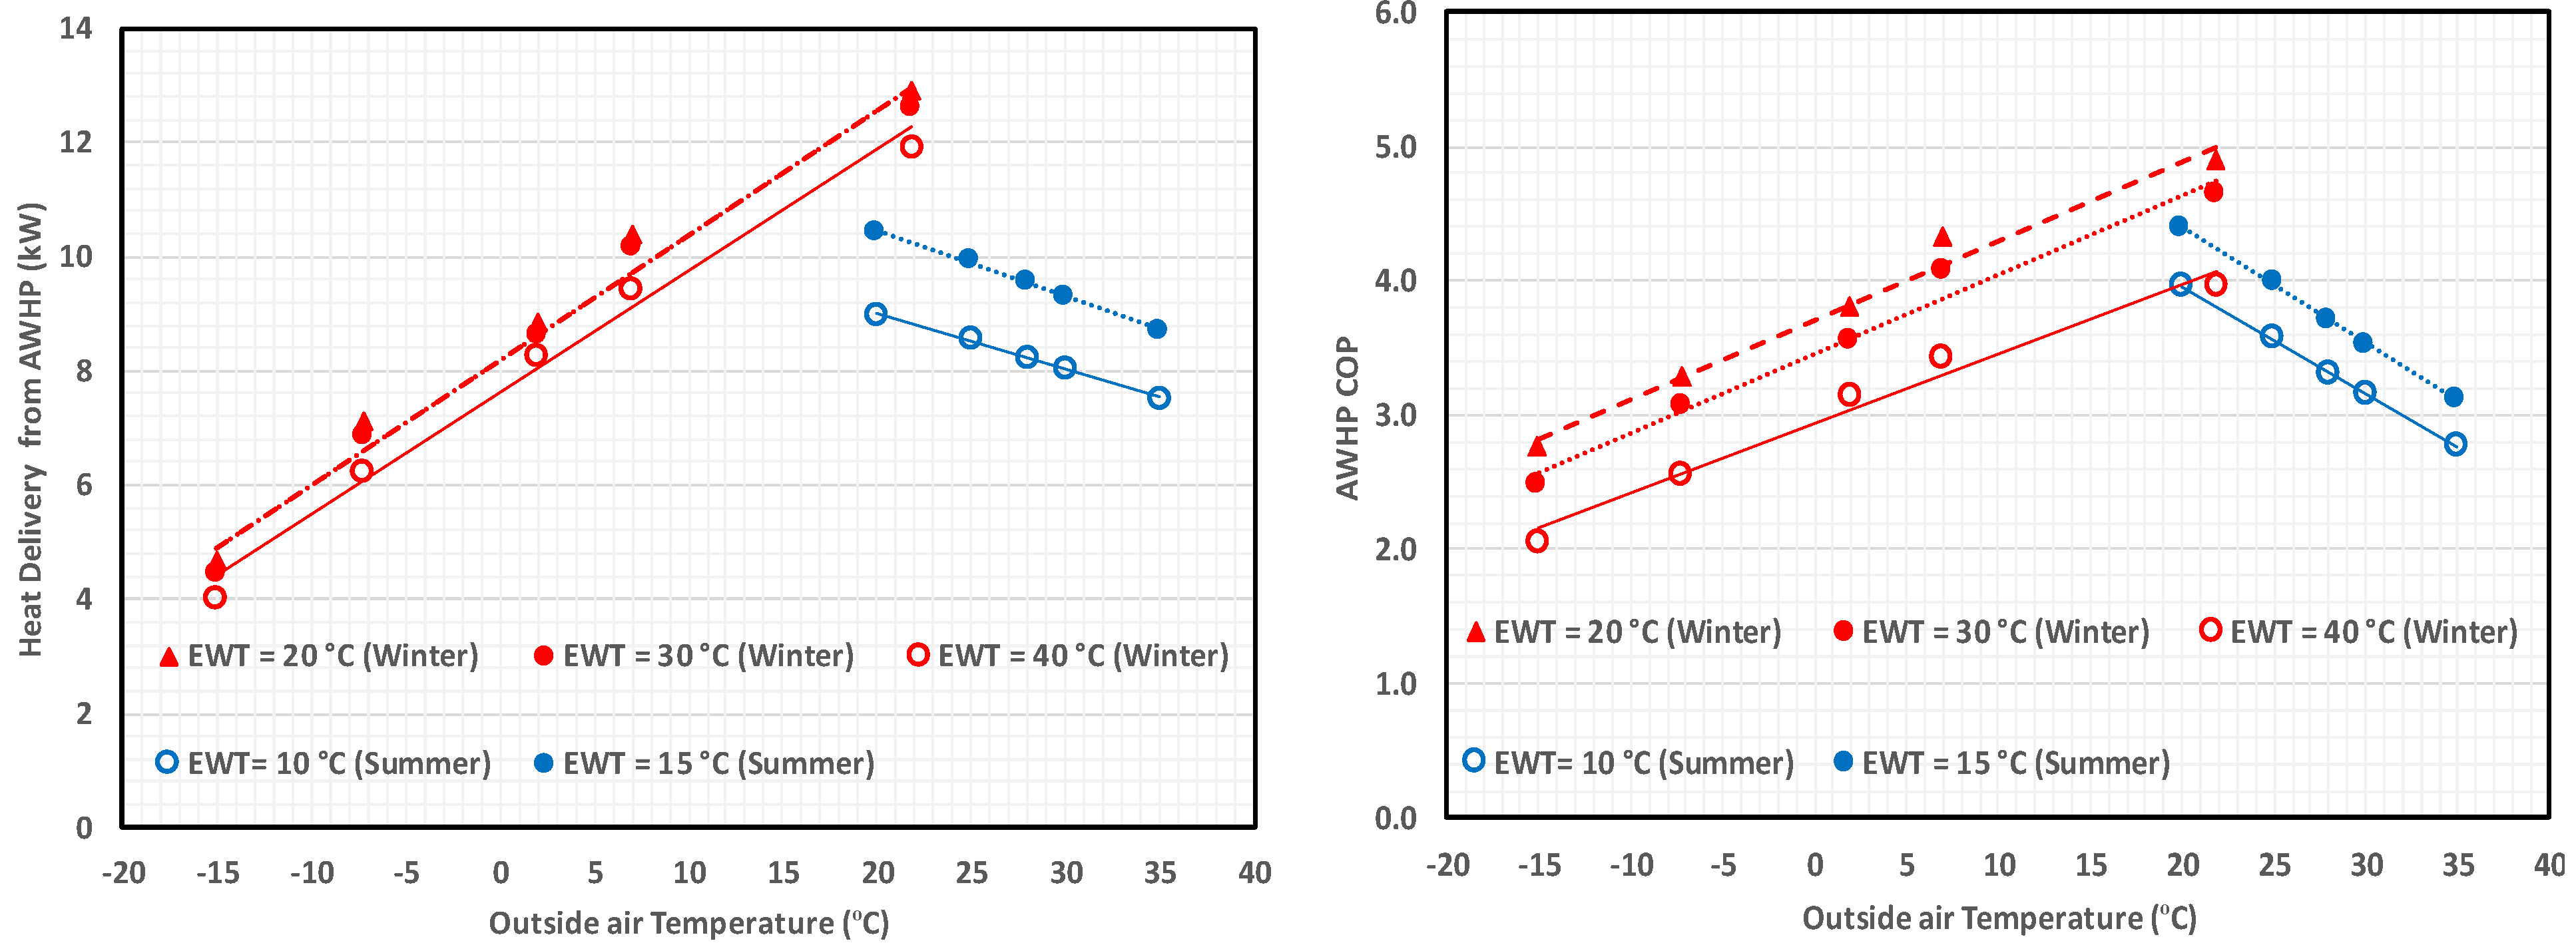
The AWHP performance data in terms of heat delivery and COP at different water inlet temperatures in the winter and summer seasons are presented in Figure 4. The AWHP performance at the inlet water temperature of 40 °C, 30 °C and 20 °C for the winter season and 10 °C and 15 °C for the summer season are modeled and presented. The results show that the heat transfer delivery from the AWHP increases with further increases in the outside air temperature during the winter period and decreases with the increase in the outside air temperature during the summer period, as presented in Figure 4a. In the winter period, the heat delivery from the AWHP increases by an average of 3% by decreasing inlet water temperature from 30 °C to 20 °C and increasing by an average of 7% for further decreases in inlet water temperature from 40 °C to 30 °C. However, the heat delivery increases by an average of 16% by increasing the inlet water temperature from 10 °C to 15 °C in the summer period. On the other hand, the COP for AWHP increases by 7% with a further decrease in the inlet water temperature to the AWHP from 30 °C to 20 °C and increases by an average of 15% with decreasing the inlet water temperature from 40 °C to 30 °C in the winter season, as shown in Figure 4b. Whereas, in the summer season, the COP of the AWHP increases at a high inlet water temperature of 15 °C by an average of 11% compared to an inlet water temperature of 10 °C.

4. Input Parameters

The components and system capital and installation costs are presented in Table 3. The electricity export–import cost is assumed to be the same with an average value of CAD 0.14/kWh. The emission parameters were set at CAD 25 per ton of CO2 and the emission factor was 590 CO2 g/kWh. There is no subsidy by the Korean Government for AWHP, PVT and GAHX. The operation and maintenance costs were 0.5–1.0% of the capital cost and the annual interest rate was set at 3.5%. Table 4 shows the boundary values of the optimization parameters, including the hybrid system components.

5. Results and Discussion

Hourly profiles of each input parameter for the entire year and the performance data for the system components under different design parameters are fed to the GAMS for the optimization simulation study. Figure 5 shows hourly heating and cooling loads and heat transfer delivery to the liquid fluid by AWHP to meet the demand loads for two selected days: 9 January presenting the coldest day in the winter season and 23 July presenting the warmest day in the summer season. The results show that the AWHP can meet the building heating loads. Heat delivery varies depending on the thermostat setting and outdoor conditions. For example, the AWHP heat delivery increases at low outside air temperature in the winter and high outside air temperature in the summer, as shown in Figure 5. Moreover, Figure 6 presents the hourly electrical load generated by the PVT system and consumed by HVAC and non-HVAC systems for the selected two days (9 January for winter and 23 July for summer). The hourly solar radiation in kW/m2 and CO2 emissions in kg for the corresponding two days are presented in Figure 6. The non-HVAC electrical load (electrical appliances and lighting) for an average single residential building with annual consumption of 8 MWh/yr. On the winter day, the total electrical load has a peak value of 6.04 kW at 8:00 with a high electrical demand load from the AWHP and non-HVAC systems. However, during the summer day, the electrical load peak has a value of 6.43 kW at 20:00. The results show that the solar radiation on the winter day (9 January) is higher than that on the selected summer day (23 July) and this is due to a cloudy day in the summer and a bright day in the winter. The net CO2 emissions increase with further increases in electrical demand loads and reductions in electrical energy generation from PVT systems. As shown in Figure 6, CO2 emissions increase during peak demand loads in the winter at 8:00 with a value of 3.6 kg and in the summer at 20:00 with a value of 3.8 kg due to an increase in non-HVAC loads.
Table 5 presents the breakdown of the system annual cost based on the optimum parameters study. The purchased electricity from the grid has the highest cost of CAD 2106/yr., followed by AWHP capital cost with the amount of CAD 809/yr. The PVT and GAHX systems have the cost of CAD 514 and CAD 266/yr., respectively. Electrical power for fans, pumps and fan coils will cost CAD 321/yr and the emissions cost has a value of CAD 222/yr. Moreover, selling electricity back to the grids and operation and maintenance has cost values of CAD 95 and CAD 15/yr., respectively. The objective optimization cost reaches a value of CAD 4158/yr.
The output optimum parameters of the modules were GAHX length of 125 m and PVT surface area of 10; AHWP heating and cooling sizes from the optimization simulation are 125 m, 10 m2, and AWHP size of 10 kW. A full-year dynamic simulation with a 10 s-time step was conducted using the optimum parameters under Incheon weather conditions.
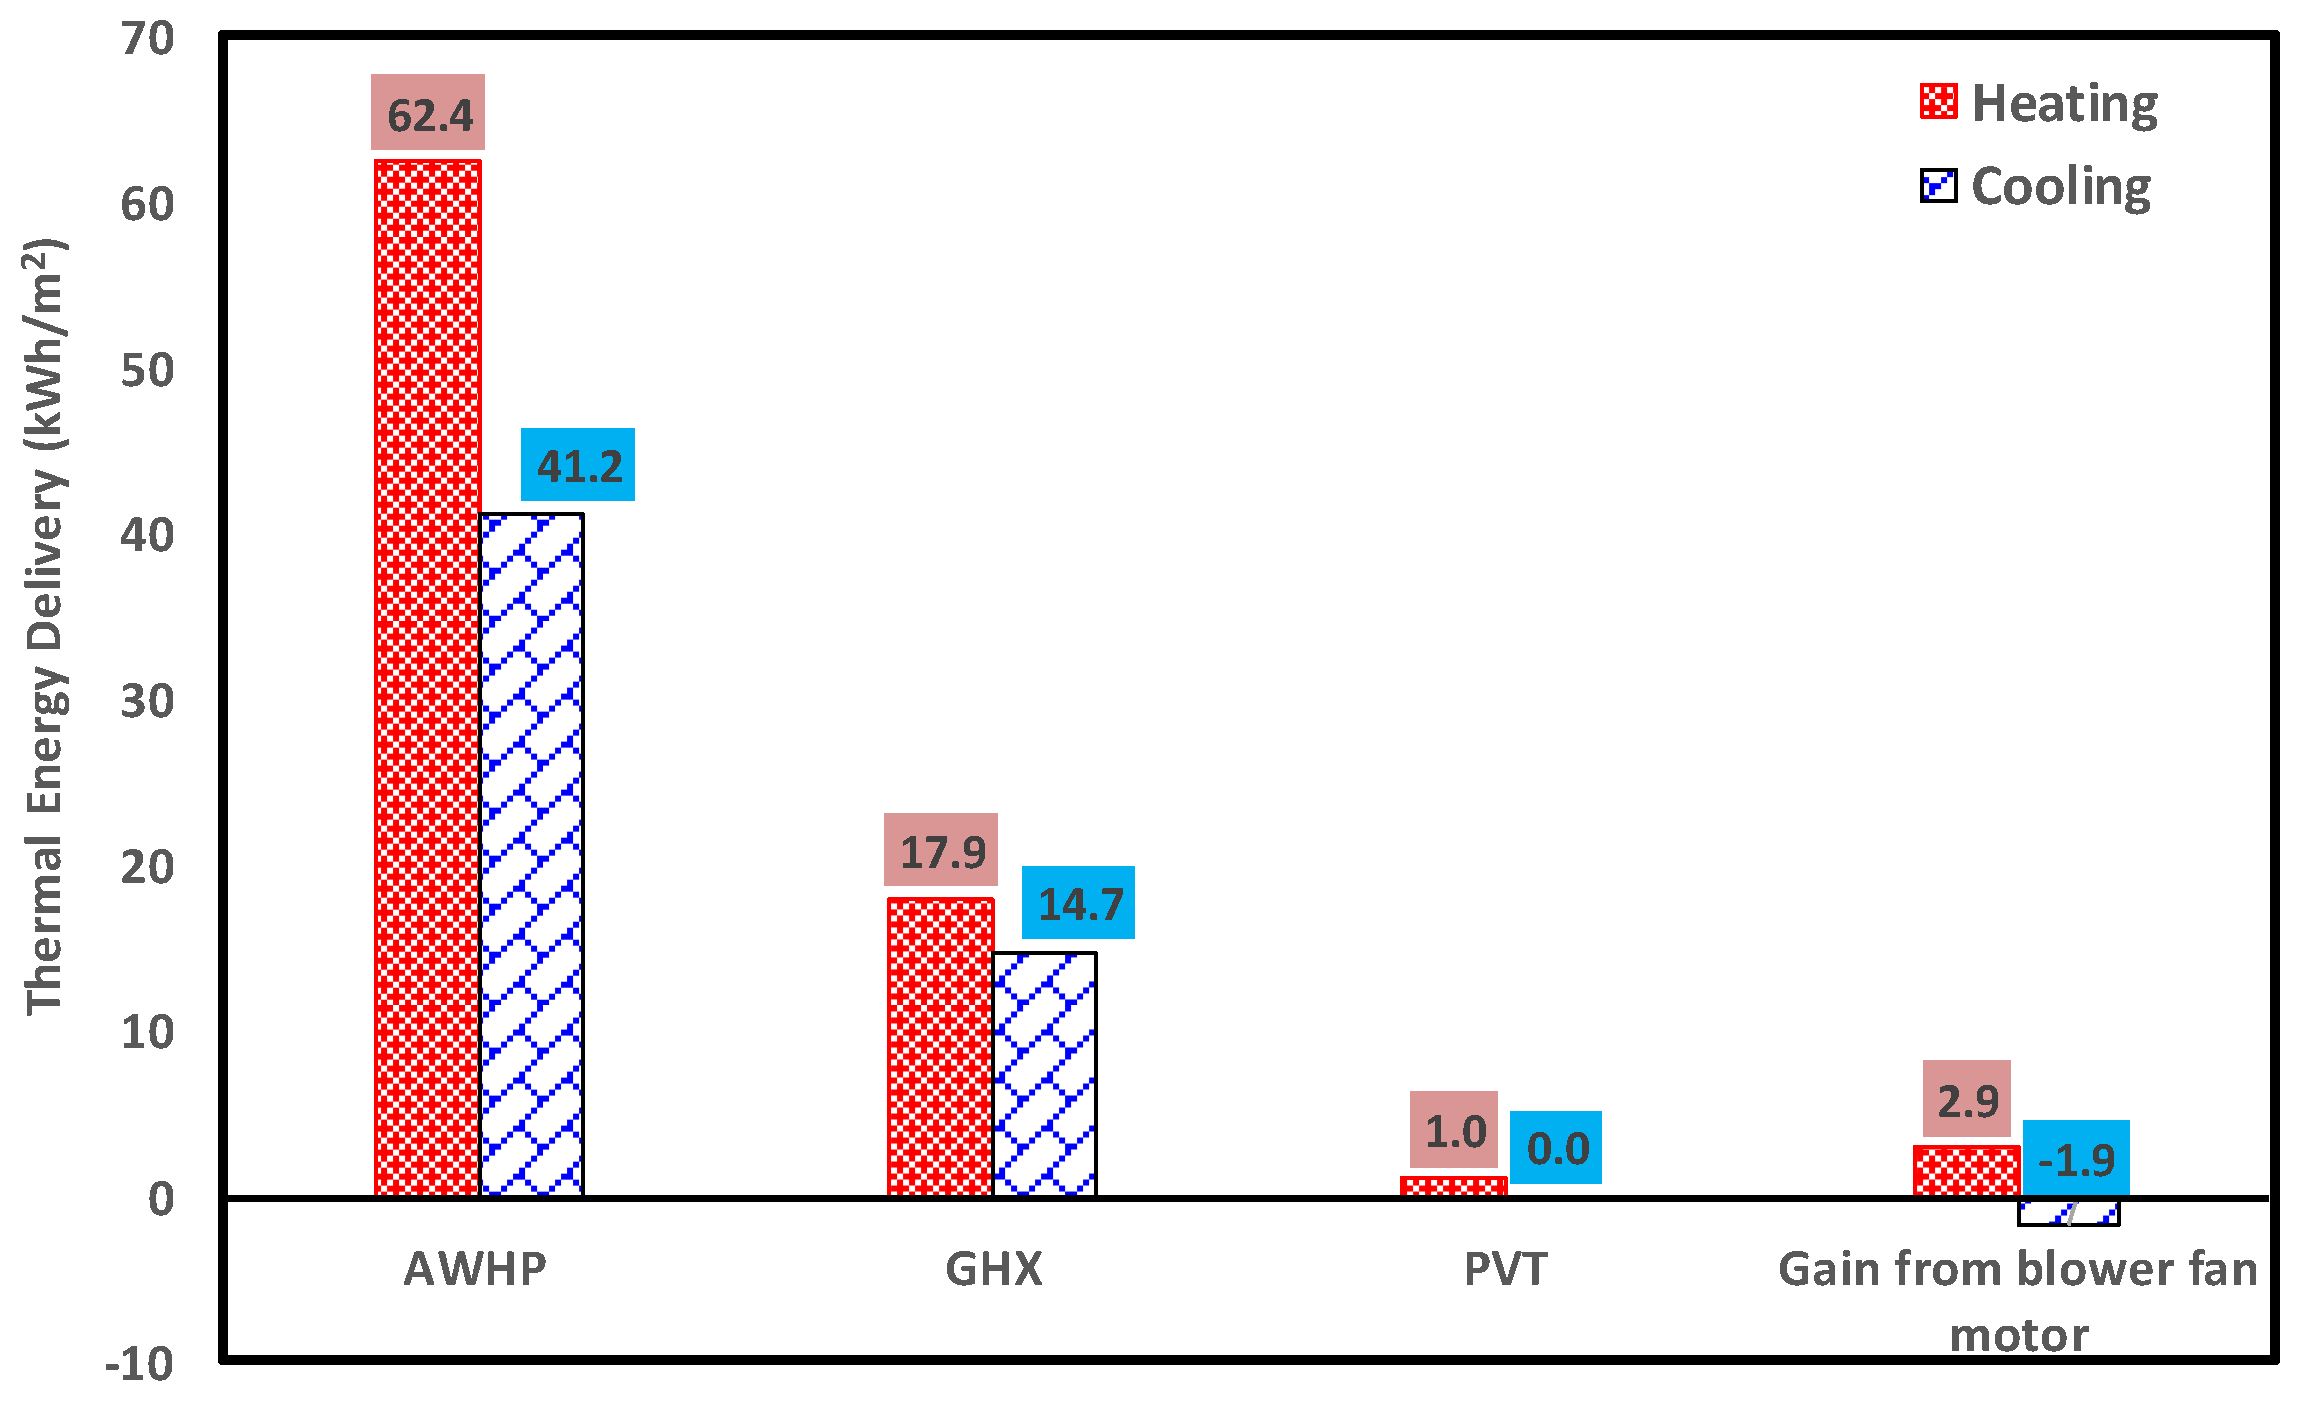
The analysis of thermal intensity energy delivery from each component of the trigeneration system is presented in Figure 7. The annual energy delivery from the AWHP to the fluid is 62.4 kWh/m2 and 41.2 kWh/m2 during the heating and cooling seasons, respectively. Moreover, the GAHX provides 17.9 kWh/m2 of energy to the preheating air in the winter period and 14.7 kWh/m2 of energy is extracted from the air in the summer period. The PVT system provides 1.0 kWh/m2 of thermal energy to the air in the winter season, as the optimum surface area is small. There is no PVT heat contribution to the tri-generation system during the summer season. On the other hand, there is a thermal energy gain from blower fan motors with values of 2.9 kWh/m2 and 1.9 kWh/m2 in the winter and summer seasons, respectively. This energy gain from the blower fan motor enhances the system performance during the heating period and reduces it during the cooling season.
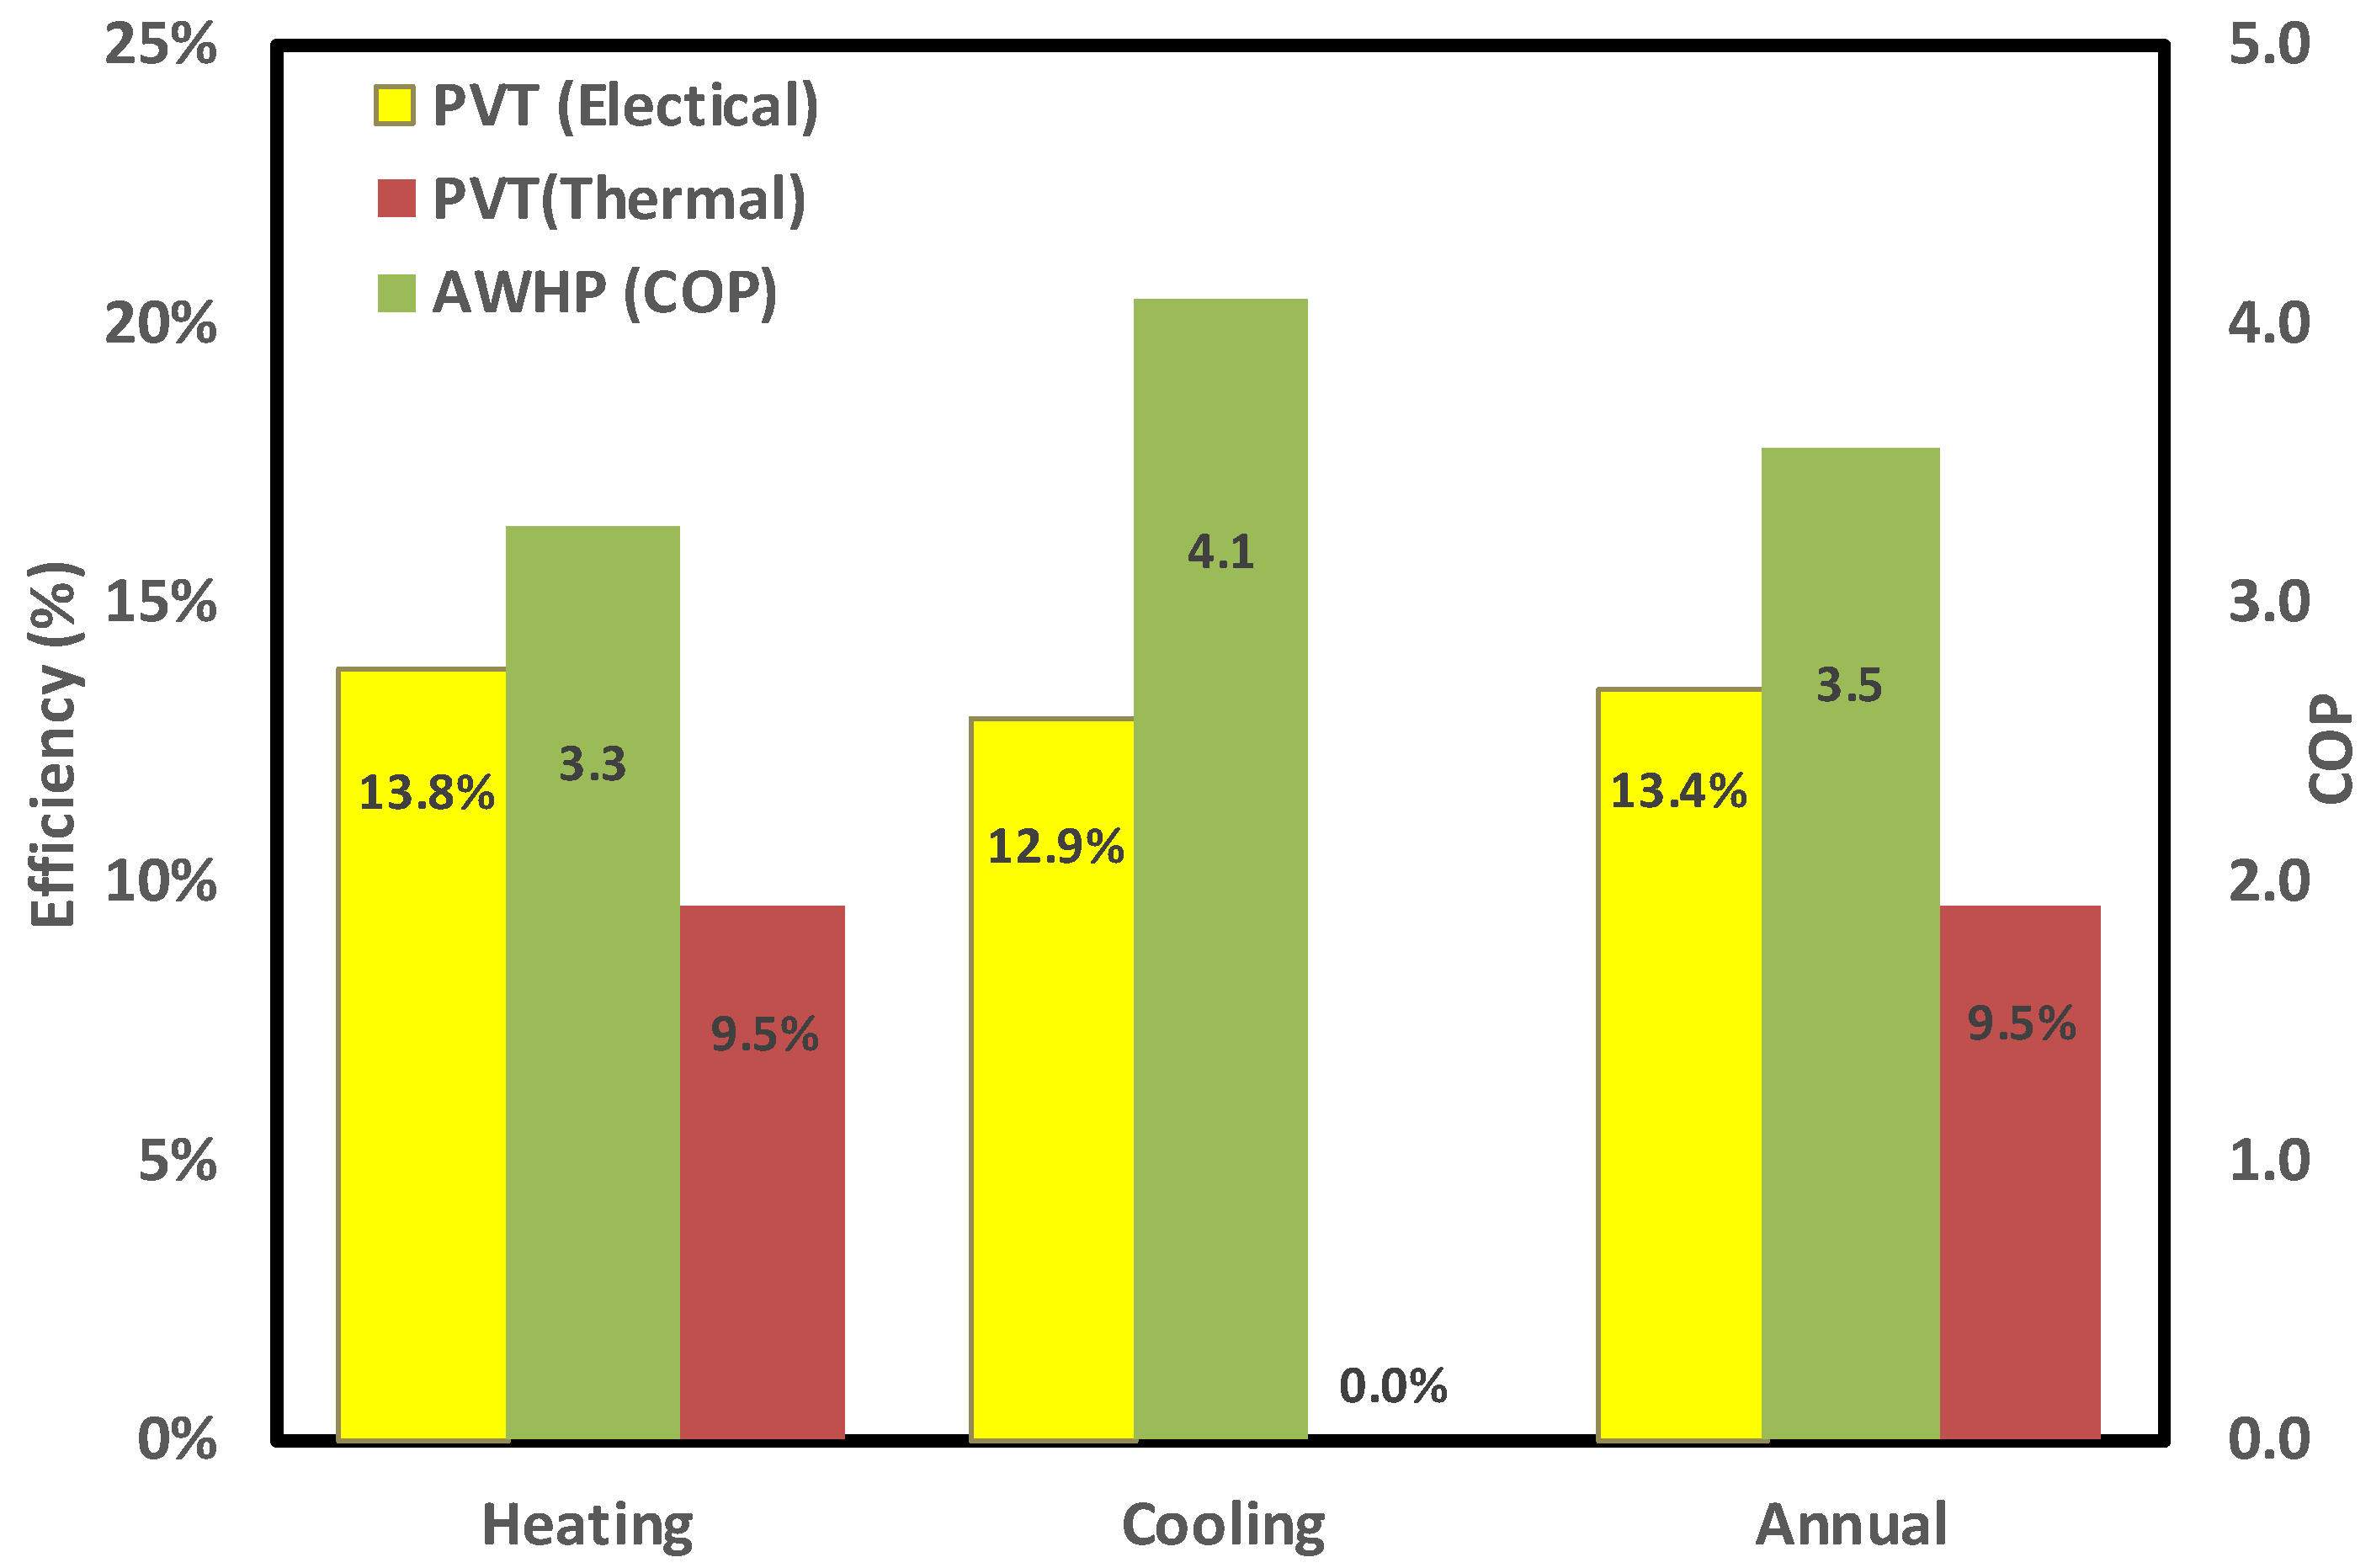
Figure 8 presents the annual electrical energy intensity consumption by the system and imported electricity from the grid. Figure 9 shows hybrid system performance during the heating/cooling seasons and average annual system performance. The AWHP has a COP of 3.5 with PVT annual overall electric/thermal efficiency of 13.4% and 9.5%, respectively.

6. Conclusions

The annual performance of a hybrid trigeneration system installed in a residential building in Incheon (Republic of Korea) was investigated and optimized through the co-running of TRNSYS and GAMS platforms. A multi-objective optimization code was developed and solved in GAMS to optimize the trigeneration system performance, design parameters, cost and emissions. System optimal design parameters were established for GAHX length, PVT surface area, and AWHP heating and cooling capacities. Annual dynamic simulation using the TRNSYS platform defined the heat delivery by each system component under optimum conditions. The thermal energy contribution from GAHX and PVT systems to the air before entering the mixing chamber is 28.7% and 1.6%, respectively, of the AWHP thermal energy delivery in the winter season. In addition, the blower fan motor contributes about 4.6% of the AWHP thermal energy delivery in the winter. Whereas in the summer, the GAHX removes about 35.7% of the thermal energy delivery by the AWHP from the air before entering the mixing chamber. However, the heat released from the blower fan motor increases the thermal energy load in the summer by 4.6% of the AWHP thermal energy provided in the summer season. The breakdown of annual electrical energy consumption, generation and imports from the electrical grids of the hybrid trigeneration system showed that 70% of the electricity is imported from the electric grid. The AWHP provides an annual average COP of 3.5, whereas the PVT has 13.4 percent thermal and 9.5 percent electrical performance.
It was found that government subsidies would play a substantial role in hybrid renewable system diffusion as they would accelerate their introduction in the residential/commercial sector with an immediate impact on greenhouse gas emissions.

Author Contributions

Conceptualization, M.G., L.Y., E.E. and E.-J.L.; methodology, M.G. L.Y., E.E. and E.-J.L.; software, M.G.; validation, M.G. L.Y., E.-C.K. and Y.-J.K.; formal analysis, M.G.; investigation, M.G.; resources, M.G., S.B., Y.N. and K.K.; data curation, M.G.; writing—original draft preparation, M.G.; writing—review and editing, M.G., E.E., E.-J.L. and Y.N.; visualization, M.G. All authors have read and agreed to the published version of the manuscript.

Funding

Korea Institute of Energy Research (KIER), Korean Energy Technology Evaluation and Planning (KETEP) and the Ministry of Trade, Industry and Energy (MOTIE) of the Republic of Korea (No. 20188550000430), Natural Resources Canada through the Program of Energy Research and Development (PERD).

Institutional Review Board Statement

Not applicable.

Informed Consent Statement

Not applicable.

Data Availability Statement

Not applicable.

Acknowledgments

This work is supported by the Korea Institute of Energy Research (KIER), Korean Energy Technology Evaluation and Planning (KETEP) and the Ministry of Trade, Industry and Energy (MOTIE) of the Republic of Korea (No. 20188550000430). Funding for this work is also provided by Natural Resources Canada through the Program of Energy Research and Development (PERD).

Conflicts of Interest

The authors declare no conflict of interest.

References

  1. Directive 2004/8/EC of the European Parliament and of the Council of the 11 February 2004 on the promotion of cogeneration based on the useful heat demand in the internal energy market and amending Directive 92/42/EEC. Off. J. Eur. Union 2004, 8, 50–60. Available online: https://eur-lex.europa.eu/eli/dir/2004/8/oj (accessed on 21 February 2004).
  2. Maghanki, M.M.; Ghobadian, B.; Najafi, G.; Galogah, R.J. Micro combined heat and power (MCHP) technologies and applications. Renew. Sustain. Energy Rev. 2013, 28, 510–524. [Google Scholar] [CrossRef]
  3. Evangelisti, S.; Lettieri, P.; Clift, R.; Borello, D. Distributed generation by energy from waste technology: A life cycle perspective. Process Saf. Environ. Prot. 2015, 93, 161–172. [Google Scholar] [CrossRef]
  4. Angrisani, G.; Roselli, C.; Sasso, M. Distributed micro-trigeneration systems. Prog. Energy Combust. Sci. 2012, 38, 502–521. [Google Scholar] [CrossRef]
  5. Sonar, D.; Soni, S.L.; Sharma, D. Micro-trigeneration for energy sustainability: Technologies, tools and trends. Appl. Therm. Eng. 2014, 71, 790–796. [Google Scholar] [CrossRef]
  6. Barbieri, E.; Spina, P.; Venturini, M. Analysis of innovative micro-CHP systems to meet household energy demands. Appl. Energy 2012, 97, 723–733. [Google Scholar] [CrossRef]
  7. Moghaddam, A.; Seifi, A.; Niknam, T.; Pahlavani, M. Multi-objective operation management of a renewable MG (micro-grid) with backup micro-turbine/fuel cell/battery hybrid power source. Energy 2011, 36, 6490–6507. [Google Scholar] [CrossRef]
  8. Shaneb, O.; Coates, G.; Taylor, P. Sizing of residential μCHP systems. Energy Build. 2011, 43, 1991–2001. [Google Scholar] [CrossRef]
  9. Kim, J.; Cho, W.; Lee, K. Optimum generation capacities of micro combined heat and power systems in apartment complexes with varying numbers of apartment units. Energy 2012, 35, 5121–5131. [Google Scholar] [CrossRef]
  10. Dorer, V.; Weber, A. Energy and CO2 emissions performance assessment of residential micro-generation systems with dynamic whole-building simulation programs. Energy Convers. Manag. 2009, 50, 648–657. [Google Scholar] [CrossRef]
  11. Gusdorf, J.; Douglas, M.; Swinton, M.; Szadkowski, F.; Manning, M. Testing a residential system including combined heat and power and ground heat source heat pumps at the Canadian Centre for Housing Technology. In Proceedings of the 1st International Conference on Microgeneration and Related Technologies, Ottawa, ON, Canada, 10–14 March 2008. [Google Scholar]
  12. Yang, L.; Douglas, M.A.; Gusdorf, J.; Szadkowski, F.; Limouse, E.; Manning, M.; Swinton, M. Residential total energy system testing at the Canadian Center for Housing Technology. In Proceedings of the ASME Power, San Antonio, CA, USA, 17–19 July 2007. [Google Scholar]
  13. Smith, M.; Few, P. Domestic-scale combined heat-and-power system incorporating a heat pump: Analysis of a prototype plant. Appl. Energy 2011, 70, 215–232. [Google Scholar] [CrossRef]
  14. Tempesti, D.; Manfrida, G.; Fiaschi, D. Thermodynamic analysis of two micro-CHP systems operating with geothermal and solar energy. Appl. Energy 2012, 97, 609–617. [Google Scholar] [CrossRef]
  15. Guo, T.; Wang, H.; Zhang, S. Selection of working fluids for a novel low-temperature geothermally-powered ORC based cogeneration system. Energy Convers. Manag. 2011, 52, 2384–2391. [Google Scholar] [CrossRef]
  16. Ribberink, H.; Lombardi, K.; Yang, L.; Entchev, E. Investigation of a hybrid renewable-microgeneration energy system for power and thermal generation with reduced emissions. Proc. Inst. Mech. Eng. Part A. J. Power Energy 2013, 227, 62–72. [Google Scholar] [CrossRef]
  17. Hawkes, A.; Leach, M. Cost-effective operating strategy for residential micro-combined heat and power. Energy 2007, 32, 711–723. [Google Scholar] [CrossRef]
  18. Entchev, E.; Gusdorf, J.; Swinton, M.; Bell, M.; Szadkowski, F.; Kalbfleisch, W.; Marchand, R. Micro-generation technology assessment for housing technology. Energy Build. 2004, 36, 925–931. [Google Scholar] [CrossRef]
  19. Hamada, Y.; Takeda, K.; Goto, R.; Kubota, H. Hybrid utilization of renewable energy and fuel cells for residential energy systems. Energy Build. 2011, 43, 3680–3684. [Google Scholar] [CrossRef]
  20. International Energy Agency, Energy Conversion in Buildings and Community System Program (ECBCS) Annex 42, The Simulation of Building-Integrated Fuel Cell and Other Cogeneration Systems (COGEN-SIM). Available online: www.ecbcs.org/annexes/annex42.htm (accessed on 15 May 2018).
  21. Barelli, L.; Bidini, G.; Gallorini, F.; Ottaviano, A. Dynamic analysis of PEMFC-based CHP systems for domestic application. Appl. Energy 2012, 91, 13–28. [Google Scholar] [CrossRef]
  22. Calise, F.; Ferruzzi, G.; Vanoli, L. Transient simulation of polygeneration systems based on PEM fuel cells and solar heating and cooling technologies. Energy 2012, 41, 18–30. [Google Scholar] [CrossRef]
  23. Bang-Møller, C.; Rokni, M.; Elmegaard, B. Exergy analysis and optimization of a biomass gasification, solid oxide fuel cell and micro gas turbine hybrid system. Energy 2011, 36, 4740–4752. [Google Scholar] [CrossRef]
  24. Liso, V.; Olesen, A.; Nielsen, M.; Kær, S. Performance comparison between partial oxidation and methane steam reforming processes for solid oxide fuel cell (SOFC) micro combined heat and power (CHP) system. Energy 2011, 36, 4216–4226. [Google Scholar] [CrossRef]
  25. Thorsteinson, E. Performance testing of a 1 kWe PEM fuel cell cogeneration system. In Proceedings of the 2nd International Conference on Microgeneration and Related Technologies, Glasgow, UK, 1–3 April 2011. [Google Scholar]
  26. Obara, S.; Watanabe, S.; Rengarajan, B. Operation method study based on the energy balance of an independent microgrid using solar-powered water electrolyzer and an electric heat pump. Energy 2011, 36, 5200–5213. [Google Scholar] [CrossRef]
  27. Kumar, A.; Baredar, P.; Qureshi, U. Historical and recent development of photovoltaic thermal (PVT) technologies. Renew. Sustain. Energy Rev. 2015, 42, 1428–1436. [Google Scholar] [CrossRef]
  28. Chow, T.T. A review on photovoltaic/thermal hybrid solar technology. Appl. Energy 2010, 87, 365–379. [Google Scholar] [CrossRef]
  29. Kim, K.; Kim, J.; Nam, Y.; Lee, E.J.; Entchev, E. Heat Exchange Rate Analysis of a Low-depth Modular Ground Heat Exchanger through Real-scale Experiment. Energies 2021, 14, 1893. [Google Scholar] [CrossRef]
  30. Kim, Y.; Lee, K.S.; Yang, L.; Entchev, E.; Lee, E.J.; Kang, E.C. Validation and Numerical Sensitivity Study of Air Baffle Photovoltaic-Thermal Module, International Journal Air conditioning and Refrigeration. Energies 2020, 13, 1990. [Google Scholar] [CrossRef] [Green Version]
  31. Bayer, P.; Saner, D.; Bolay, S.; Rybach, L.; Blum, P. Greenhouse gas emission savings of ground source heat pump systems in Europe: A review. Renew. Sustain. Energy Rev. 2012, 16, 1256–1267. [Google Scholar] [CrossRef]
  32. Self, S.J.; Reddy, B.V.; Rosen, M.A. Geothermal heat pump systems: Status review and comparison with other heating options. Appl. Energy 2013, 101, 341–348. [Google Scholar] [CrossRef]
  33. Omer, A.M. Ground-source heat pumps systems and applications. Renew Sustain Energy Rev. 2008, 12, 344–371. [Google Scholar] [CrossRef]
  34. Sarbu, I.; Sebarchievici, C. General review of ground-source heat pump systems for heating and cooling of buildings. Energy Build. 2014, 70, 441–454. [Google Scholar] [CrossRef]
  35. International Energy Agency, Energy Conversion in Buildings and Community System Program (ECBCS) Annex 54, Analysis of Micro-Generation & Related Energy Technologies in Buildings. Available online: www.ecbcs.org/annexes/annex54.htm (accessed on 3 June 2012).
  36. Chen, Y.; Zhang, T.; Yang, H.; Peng, J. Study on energy and economic benefits of converting a combined heating and power system to a tri-generation system for sewage treatment plants in subtropical area. Appl. Therm. Eng. 2016, 94, 24–39. [Google Scholar] [CrossRef]
  37. Feist, W.; Schnieders, J.; Dorer, V.; Haas, A. Re-inventing air heating: Convenient and comfortable within the frame of the passive house concept. Energy Build. 2005, 37, 1186–1203. [Google Scholar] [CrossRef]
  38. Chel, A.; Janssens, A.; Michel, D.P. Thermal performance of a nearly zero energy passive house integrated with the air-air heat exchanger and the earth–water heat exchanger. Energy Build. 2015, 96, 53–63. [Google Scholar] [CrossRef]
  39. Murphy, M. Leco. Simulating Earth to Air Heat Exchangers. Ventilation Preheating and Pre-Cooling; SINTEF: 2011; 70, Research Report. Available online: http://hdl.handle.net/11250/2420221 (accessed on 31 December 2011).
  40. Urchueguía, J.F.; Zacarés, M.; Corberán, J.M.; Montero, Á.; Martos, J.; Witte, H. Comparison between the energy performance of a ground-coupled water to water heat pump system and an air to water heat pump system for heating and cooling in typical conditions of the European Mediterranean coast. Energy Convers. Manag. 2008, 49, 2917–2923. [Google Scholar] [CrossRef]
  41. Calise, F.; Cappiello, F.L.; D’Accadia, D.M.; Vicidomini, M. Thermo-economic optimization of a novel hybrid renewable trigeneration plant. Renew. Energy 2021, 175, 532–549. [Google Scholar] [CrossRef]
  42. Jalalizadeh, M.; Fayaz, R.; Delfani, S.; Mosleh, H.J.; Karami, M. Dynamic simulation of a trigeneration system using an absorption cooling system and building integrated photovoltaic thermal solar collectors. J. Build. Eng. 2021, 43, 102482. [Google Scholar] [CrossRef]
  43. Cioccolanti, L.; Tascioni, R.; Bocci, E.; Villarini, M. Parametric analysis of a solar Organic Rankine Cycle trigeneration system for residential applications. Energy Convers. Manag. 2018, 163, 407–419. [Google Scholar] [CrossRef]
  44. Braun, R.; Haag, M.; Stave, J.; Abdelnour, N.; Eicker, U. System design and feasibility of trigeneration systems with hybrid photovoltaic-thermal (PVT) collectors for zero energy office buildings in different climates. Sol. Energy 2020, 196, 39–48. [Google Scholar] [CrossRef]
  45. Rad, M.; Leon-Garcia, A. Optimal residential load control with price prediction in real-time electricity pricing environments. IEEE Trans. Smart Grid 2010, 1, 120–133. [Google Scholar]
  46. Rong, A.; Lahdelma, R. An efficient linear programming model and optimization algorithm for trigeneration. Appl. Energy 2005, 82, 40–63. [Google Scholar] [CrossRef]
  47. Ashouri, A.; Fux, S.; Benz, M.; Guzzella, L. Optimal design and operation of building services using mixed-integer linear programming techniques. Energy 2013, 59, 365–376. [Google Scholar] [CrossRef]
  48. Marachal, F.; Kalitventzeff, B. Process integration: Selection of the optimal utility system. Comput. Chem. Eng. 1998, 22, 149–156. [Google Scholar] [CrossRef]
  49. Bozchalui MHashmi SHassen HCanizares, C.; Bhattacharya, K. Optimal operation of residential energy hubs in smart grids. IEEE Trans. Smart Grid 2012, 3, 1755–1766. [Google Scholar]
  50. Chen ZWu, L.; Fu, Y. Real-time price-based demand response management for residential appliances via stochastic optimization and robust optimization. IEEE Trans. Smart Grid 2012, 3, 1822–1831. [Google Scholar] [CrossRef]
  51. Giorgio, A.; Pimpinella, L. An event-driven smart home controller enabling consumer economic saving and automated demand side management. Appl. Energy 2012, 96, 92–103. [Google Scholar] [CrossRef]
  52. Ha LJoumaa HPloix, S.; Jacomino, M. An optimal approach for electrical management problem in dwellings. Energy Build. 2012, 45, 1–14. [Google Scholar]
  53. Fazlollahi, S.; Maréchal, F. Multi-objective, multi-period optimization of biomass conversion technologies using evolutionary algorithms and mixed integer linear programming (MILP). Appl. Therm. Eng. 2013, 50, 1504–1513. [Google Scholar] [CrossRef] [Green Version]
  54. Lu, Y.; Wang, S.; Sun, Y.; Yan, C. Optimal scheduling of buildings with energy generation and thermal energy storage under dynamic electricity pricing using mixed-integer nonlinear programming. Appl. Energy 2015, 147, 49–58. [Google Scholar] [CrossRef]
  55. Babu, C.; Ashok, S. Peak load management in electrolytic process industries. IEEE Trans. Power Syst. 2008, 23, 399–405. [Google Scholar] [CrossRef]
  56. Geidl, M.; Andersson, G. Optimal power flow of multiple energy carriers. IEEE Trans. Power Syst. 2007, 22, 145–155. [Google Scholar] [CrossRef]
  57. Shirazi, E.; Jadid, S. Optimal residential appliance scheduling under dynamic pricing scheme via hemdas. Energy Build. 2015, 93, 40–49. [Google Scholar] [CrossRef]
  58. TEES company (TRNSYS Website). Available online: http://www.trnsys.com/ (accessed on 20 November 2017).
  59. University of Wisconsin-Madison, TRNSYS 17—Mathematical Reference, Vol. 4. Available online: http://web.mit.edu/parmstr/Public/TRNSYS/04-MathematicalReference.pdf (accessed on 5 February 2012).
  60. Nam, Y.J.; Ooka, R.; Hwang, S.H. Development of a numerical model to predict heat exchange rates for a ground-source heat pump system. Energy Build. 2008, 40, 2133–2140. [Google Scholar] [CrossRef]
  61. General Algebraic Modeling System (GAMS website). Available online: https://www.gams.com/ (accessed on 7 June 2019).
Figure 1. Trigeneration Renewable System schematic.
Applsci 12 00888 g001
Figure 2. Flowchart design system optimization and simulation for Trigeneration System.
Applsci 12 00888 g002
Figure 3. Outlet air temperature from GAHX at different outside temperatures and GAHX lengths.
Applsci 12 00888 g003
Figure 4. AWHP heat delivery and COP at different outside temperatures and inlet water temperatures in winter and summer seasons (a) Heat Delivery and (b) COP.
Applsci 12 00888 g004
Figure 5. Hourly heating/cooling demand load and AWHP heat delivery for hybrid trigeneration system in warmest and coldest days under optimum design conditions.
Applsci 12 00888 g005
Figure 6. Hourly HVAC and non-HVAC energy consumption, energy production, CO2 emissions and solar radiation under Incheon weather conditions for coldest and warmest days and under optimum design conditions.
Applsci 12 00888 g006
Figure 7. Breakdown of annual thermal energy delivery of the hybrid trigeneration system under optimum design conditions in heating and cooling periods.
Applsci 12 00888 g007
Figure 8. The annual electrical energy of the hybrid trigeneration system under optimum design conditions in heating and cooling periods.
Applsci 12 00888 g008
Figure 9. Hybrid Trigeneration system performance.
Applsci 12 00888 g009
Table 1. Single residential building specification.
ValueUnitComment
Infiltration0.15ACH
Window to area ratio35%Vertical glazing of wall
Ventilation10L/s. person
Internal equipment load8.07W/m2
Internal lighting load10.76W/m2
Roof U value 0.27 W/m2 k
Exterior walls U value0.43W/m2 k
Opaque doors U value 3.97W/m2 k
Slab on grade Floors0.934W/m k
Windows U value3.12W/m2 kMetal framing (SHGC 0.4)
Floor to ceiling height 2.7M
Attic height1.5M
Table 2. Control strategies for hybrid trigeneration system.
SystemSignal Heating ModeCooling Mode
AWHPONTTankB ≤ 40 °CTroom ≤ Tset − 0.5 °C
OFFTTankB ≥ 45 °CTroom ≥ Tset + 0.5 °C
PVT (preheating)ONTPVT – TGAHX ≥ 5 °C N/A
OFFTPVT – TGAHX ≤ 2 °CN/A
Table 3. Economic and emissions input parameters.
ParameterCost/ValueLifetime (yr.)/Unit
Ground Air Heat ExchangerCAD 35/m 25
AWHPCAD 1050 /kW 20
PVTCAD 11/We25
Storage tankCAD 130015
PumpCAD 52510
BlowerCAD 60010
Fan CoilCAD 60810
GAHX SubsidyCAD 0-
AWHP Subsidy CAD 0-
PVT Subsidy CAD 0-
Emission costCAD 25/ton CO2-
Electrical price (Buy)CAD 0.14/kWh-
Electrical price (Sell) CAD 0.14/kWh-
Interest rate3.5%-
Operation and maintenance 0.5–1% from capital cost
Emission Factor590CO2 g/kWhel
Table 4. Optimization variables and boundaries.
VariableBoundary RangeUnit
Ground Heat Exchanger length [125–500] m
AWHP heating size[6.6–17.2]kW
AWHP cooling size[5.6–10.5]kW
PVT area[10–200]m2
Table 5. Breakdown of the Annual Optimum Cost for a Trigeneration System.
SystemCost (CAD/Yr.)
GAHX Capital265.5
AWHP Capital809.1
PVT Capital514
Fan, Pump, Fan coil, etc.321.3
Operation &Maintenance14.6
Purchase Electricity2105.5
Selling Electricity94.5
Emission222.2
Subsidy0
Objective4157.5
Publisher’s Note: MDPI stays neutral with regard to jurisdictional claims in published maps and institutional affiliations.