Abstract
Magnetic anomaly signal detection (MASD) is a passive method for the detection of visually obscured ferromagnetic objects. This paper proposes a new method for MASD based on the ambient field of power frequency magnetic (power transmission line system). Moreover, a new information extraction technique is extended by employing Synchrosqueezed Wavelet Transform (SSWT) to improve the accuracy of the MASD method. With the extended information extraction technique, the time-frequency information of the anomalies can be efficiently distinguished from the power frequency magnetic anomaly signal. The multi-component of the time-frequency information is separated by extracting the time-frequency ridges in the spectrogram. The complexity of time-frequency information is evaluated using Rayleigh entropy. Compared with the continuous wavelet transform and short-time Fourier transform, the Rayleigh entropy of our method is reduced by 4.1886 and 4.3623, respectively. Finally, the efficiency of the new method is verified by the outfield experiments.
1. Introduction
Ferromagnetic materials become magnetized in the presence of a geomagnetic field or another magnetic field, resulting in the generation of an induced magnetic field (they may also generate a vortex field in an alternating magnetic field or when the target moves). Both alternating magnetic fields and moving targets will change the spatial magnetic field distribution, leading to a local anomaly of a magnetic field. Magnetic Anomaly Detection (MAD) technology typically refers to measuring fixed or moving targets in a non-contact way through magnetic detection and then performing data processing and analysis of the magnetic signals to detect and obtain correct target information [1]. This technology detects, locates, and traces magnetic targets (such as vehicles [2], unexploded ordnance [3,4], mines [5,6], underground ferromagnetic minerals [7,8,9], and submarine wrecks [10]) that are visually obscured by changes in the space magnetic field.
The magnetic field generated by the magnetic target is used to identify local magnetic field anomalies in geomagnetic anomaly detection. It is also mainly applied in the magnetotelluric (MT) methods. The magnetization intensity of the target is detected in magnetic anomaly detection by artificially creating electromagnetic waves. Methods based on this theory include the controlled-source audio-frequency magnetotellurics (CSAMT) method and the transient electromagnetics (TEM) method, etc. CSAMT detects targets using the magnetization effect of ferromagnets. TEM detects targets by using a secondary-generated eddy-current field. These two effects of producing magnetic anomaly are the necessary conditions of current magnetic anomaly detection technology.
The MT method is a passive detection method. It has two advantages over the positive method:
Firstly, it requires no artificial field sources, and the sensors of the MT method are low-cost and easy to operate.
Secondly, it can break through high-resistance layer shielding, obtains a high resolution to low-resistance layers, and associates the exploration depth only with the magnetic field frequency (from dozens of meters to several hundred kilometers).
Therefore, it has broader use in many fields than the positive method.
However, the magnetotelluric method has two fatal drawbacks: 1. The weak and random signal produces a dilemma between precision and efficiency. 2. The formula itself requires measuring two variables, an electric field, and a magnetic field, and contains quadratic terms, giving rise to increased error.
In two-dimensional earth (2D), the apparent resistivity of the transverse magnetic (TM) mode is given [11,12,13] by the following expression:
where is the apparent resistivity, is the magnetic permeability of free space, is the electric field, and is the magnetic field parallel to the strike of the 2D structure.
The transient electromagnetism method is a mainstream method for detecting extremely low-frequency/very low-frequency magnetic field anomalies using artificial field sources. This method uses an ungrounded loop or a grounded wire source to transmit the primary pulsed magnetic field, then observes the secondary vortex field by coil or grounding electrode during the primary pulsed magnetic field interval. In short, the ultimate principle of the transient electromagnetism method is the law of electromagnetic induction. The attenuation process is generally divided into early, middle, and late stages. The early electromagnetic field corresponds to the high-frequency component of the frequency domain featuring fast attenuation with a small skin depth, while the late part is equivalent to the low-frequency component of the frequency domain featuring slow attenuation with a large skin depth. The geoelectric characteristics at different depths can be obtained by measuring the time-varying law of the quadratic field in each period after powering off. The transient electromagnetic approach offers the following benefits: high construction efficiency, sensitivity to low-resistance geological bodies, insensitivity to topography, great anomaly perception ability, and the ability to perform profile and bathymetry simultaneously. However, it still has drawbacks, such as substantial metal interference, serious low-resistance layer interference, a requirement for more a priori information, a huge and heavy transceiver system, and so on [14].
In the above-mentioned research, the power frequency magnetic field signal is generally discarded as noise. However, it is widely disseminated and does not need the building of a transmitter–receiver system, which is a superb carrier of magnetic anomaly signals. Power frequency magnetic field signals also have difficulties such as high noise and poor signals. However, with the fast development of magnetic sensor material processing and manufacturing technology, a range of high-sensitivity, high-precision magnetometers has been launched [15,16], boosting the development of power frequency magnetic detecting techniques.
Magnetic targets are inevitably subjected to other magnetic fields (geomagnetic field, power frequency magnetic field, sizable electromagnetic leakage or other magnetic fields) in the natural environment, resulting in magnetic anomaly signals that are easily submerged in magnetic noise [17]. Therefore, efficient detection algorithms are always required to maximize the detection probability. In 2009, Ginzburg et al. divided the magnetic anomaly detection algorithms into two categories [18]: the detection algorithms based on targets and the detection algorithms based on noise.
The following conditions govern the target-based detection algorithm. The first is that the distance between the sensor and the target is significantly greater than the target’s actual size, satisfying the requirement that the magnetic dipole can be utilized to represent the target [19]. The second is to keep the magnetic moment’s magnitude and direction constant. The third step is to determine the target’s characteristic time. The sensor load platform’s motion path is predetermined, and the spatial position of the target is continually measured throughout the motion. The representative algorithms of this method mainly include the Target Analysis Algorithm based on the magnetic anomaly gradient model proposed by Yoshii in 1982 [20] and the Orthogonal Basis Function Decomposition Magnetic Anomaly Detection Algorithm proposed by Mori [21]. All of the above methods require a large amount of information to be gathered beforehand and have difficulty solving the variable noise problem.
When numerous conditions specified by the target-based detection algorithm are not met, another form of magnetic anomaly signal detection method, namely the statistical analysis approach based on magnetometer noise, should be utilized. The minimum entropy detector, high-order cross magnetic anomaly method, stochastic resonance method, and wavelet transform method are examples of common methods. The noise-based method assumes that the anomaly created by the induced magnetic field generated by the ferromagnetic target alters the pattern of the background magnetic field distribution. This approach does not require prior knowledge of the target’s CPA distance or motion direction. This simplifies the calculation. Although the minimal entropy filtering approach is straightforward to calculate, it is difficult to recognize data features when the background noise is complex. The High-order Crossing Magnetic Anomaly Method requires no multiplication, but it is incapable of detecting spatial signals because it is seriously being affected by the fixed plane. The Stochastic Resonance Method improves the output signal-to-noise ratio with noise-enhanced abnormal signals and is also greatly affected by input noises. The wavelet transform method can retain as much target information as possible without being affected by prior information.
Based on the excellent characteristics of the wavelet transform method, Mandrikova et al. [22] used the wavelet packet to decompose and extract the components of the geomagnetic signal for analysis. Singh et al. [23] used continuous wavelet transform and Euler Deconvolution to analyze the magnetic field data of the Jharia Coalfield in India and calculated different lithospheric depths. Zamudio-Ramirez et al. [24] used discrete wavelet to analyze the transient data of external magnetic field to achieve symmetry detection of the wound rotor. Although the above methods demonstrate that the wavelet transform is advanced enough to analyze very stationary signals, it is still limited by the Fourier Transform, i.e., the limited wavelet basis inevitably leads to energy leakage and ambiguity of the resolution ratio.
To eliminate the extra simple harmonics without physical meanings, which are introduced by the Fourier Transform (FT) and its derived methods for reflecting nonlinear and non-stationary processes, Huang proposed the Hilbert–Huang Transform (HHT) [25] in 1998. Compared with the wavelet analysis method, it not only retains the advantages of the wavelet transform method but also eliminates the ambiguity of the wavelet transform, having a more accurate spectral structure. However, the core algorithm of the Hilbert–Huang Transform—EMD lacks rigorous mathematical analysis.
To address the aforementioned issues, Daubechies et al. [26] suggested a new method that integrates the concept of EMD, called synchrosqueezed wavelet transform. The method uses the synchronous compression operator to reorganize the energy of the time-frequency plane based on the wavelet transform. Finally, a time-frequency image is obtained with a more focused frequency curve. The Synchrosqueezed Wavelet Transform (SSWT) provides a new idea for time-frequency analysis. The literature [27] proves that the synchrosqueezed wavelet transform is stable in the case of finite disturbance or white noise pollution and discusses a detailed Matlab implementation method. But the data image processed by the synchrosqueezed wavelet transform lacks a visual display of the target.
This paper combines the power frequency magnetic field detection method with the traditional magnetic anomaly signal detection method and proposes a method to detect the target by using the power frequency magnetic field. The power frequency magnetic field anomaly signal is weak, the noise is complex, and there is no effective time-frequency analysis method to detect the power frequency magnetic anomaly signal. In this paper, the synchrosqueezed wavelet transform method introduces the time-frequency characteristics of the power frequency magnetic anomaly signals extraction to improve the magnetic anomaly detection method in the following aspects: 1. It proposes to use the power frequency magnetic signal generated by the worldwide distributed power grid as the signal transmission source, which reduces the requirements of establishing a transmission source as compared with the magnetic anomaly detection method of artificial field source; 2. The synchrosqueezed wavelet transform introduces the magnetic anomaly signal detection, which increases the signal time-frequency resolution as compared with conventional methods; 3. It proposes to use the Greedy Algorithm to extract time-frequency ridges to efficiently capture the magnetic anomaly disturbance of the measured data.
The rest of this paper is organized as follows: In Section 2, we systematically review the previous magnetic detection and signal processing methods; in Section 3, we detail the processing method of the power frequency magnetic anomaly signal as proposed in this paper; in Section 4, we introduce the relevant simulations and experiments to prove the effectiveness of this method; Section 5 is a discussion; Section 6 is a summary of the work in this paper and discusses plans for future work.
2. Related Works
This paper will introduce the commonly used magnetic anomaly detection techniques from recent years in Section 2.1 and introduce the existing leading magnetic anomaly signal processing methods in Section 2.2.
2.1. Magnetic Anomaly Detection Technology
Magnetic anomaly detection technology has already undergone a long development, with the two current mainstream methods being geomagnetic anomaly detection and extremely low-frequency/very low-frequency magnetic field anomaly detection that uses artificial field sources. For these two magnetic anomaly detection techniques, Zhao [1] and Di [28] et al., respectively, gave a relatively comprehensive overview. Zhao mainly discussed the magnetic anomaly signal processing method based on the magnetotelluric method, and in recent years, Di focused on the introduction of several new artificial field sources of extremely low-frequency/very low-frequency magnetic field anomaly detection methods, such as the new electromagnetic detection technologies of the wireless electromagnetic method (WEM), the multi-channel transient electromagnetic method (MTEM), and the short-offset transient electromagnetic method (SOTEM).
The wireless electromagnetic detection method (WEM) is a low-frequency electromagnetic field detection technology developed in recent years, also known as “Skywave” detection. This “Skywave” refers to the electromagnetic wave generated by injecting hundreds of amperes of coded current into the ground with a 100 km long ground wire, which propagates upwards toward the ionosphere and is reflected from the bottom of the ionosphere to the ground. After reflecting between the bottom of the ionosphere and the ground, it is transmitted down from the ground to the underground ore. Finally, it is transmitted from the underground ore to the ground, and the ground receiver receives the electromagnetic field carrying the information of the underground target body. The “Skywave” is mainly used in military communications and navigation. Using “Skywave” for use in deep underground prospecting needs to be studied theoretically. Specifically, the conventional “atmosphere–lithosphere” half-space propagation theory needs to be extended to the whole space of the “ionosphere–atmosphere–lithosphere”.
The new “Skywave” theory fully reflects the influence of the displacement current between the ionosphere and the sky to deduce an accurate expression [29] applicable to a whole space “Skywave” response. Fu et al. [30] and Li [31,32] found that it propagates in a waveguide form, characterized by slow attenuation and long propagation distance. By using a megawatt of power with a 100 km or longer transmission antenna, the transmission and receiving range has been extended from the conventional 10 km to over 3000 km, which can realize electromagnetic detection of targets at a depth of 10 km underground within Chinese territory. But WEM requires intensive amounts of manpower, financial resources, and material resources to build a huge transmitting antenna. Regardless of whether construction is done during the early stage, or maintenance is performed during the later stages, it is extremely costly.
The MTEM was proposed by University of Edinburgh scholars [33] and has been patented by the United States [34]. This method that adopts grounded wire source transmission to acquire full waveform information of multiple underground coverages by an array can significantly improve the vertical and horizontal resolution and detection depth while using the same transmission source, with a maximum detection depth of up to 4 km. Compared with the conventional transient electromagnetism method, this method has the following significant characteristics: (1) Adopts a pseudo-random coding source as the transmission signals that can provide richer spectrum information and stronger anti-interference capability; (2) Adopts a multi-channel array to observe full waveform data and achieves multiple coverage observations; (3) Obtains earth impulse responses through receiving the deconvolution of receiving voltage and transmitting current. In addition, the MTEM can simultaneously collect voltage signals from regions both near and far from the source. The frequency components of the pseudo-random transmission sources are rich with a noticeable [35,36] suppression equivalence effect. However, this method requires moving the transmitting source and constructing a transmitting and receiving array [37].
The conventional working mode of the electrical source for the transient electromagnetic method is the long-offset transient electromagnetic method (LOTEM). It implements several kilometers of grounded wire to transmit switched-on bipolar square wave current underground to observe the electromagnetic field response at an offset range greater than three times the detection depth. As the grounded wire source can generate induced currents in both horizontal and vertical directions underground, it has a stronger discrimination ability for both low- and high-resistant underground targets so that it can play an important role in the field of crustal research, oil and gas exploration, geothermal investigation, and other areas at extreme depths [38]. Nevertheless, the larger the offset, the greater the construction quantity is, which leads to a higher requirement from the transmitter for power and performance, along with the factor of continuous waveform current, which increases the difficulty of data processing.
Recently, the short-offset transient electromagnetic method (SOTEM) [39] was developed to conduct precision detection for deep targets 1.5 km underground. It uses the electromagnetic field excited by a switched-off bipolar current to observe the pure quadratic field at an offset range of fewer than two times the detection depth. The received signal strength is strong, as the transmitting and receiving distance is short. The SOTEM method improves detection accuracy and construction efficiency to a certain extent. The current mainstream electromagnetic instruments, such as V8 and GDP32, are all available for SOTEM measurement, providing favorable conditions to popularize this method. The SOTEM method has developed rapidly, with a relatively mature system of methods having been formed in the forward modeling, apparent resistivity calculation, inversion interpretation, and construction technology [40,41], and is widely and successfully applied in the areas of metal ore and coal hydrogeology [42,43,44,45].
The power frequency magnetic field-based detection approach suggested in this study overcomes the limitations of the preceding technologies and does not necessitate a huge transmitting and receiving array. It detects magnetic anomaly signals by using the world’s alternating current (AC) transmission grid as the transmission source, and only requires an industrial frequency magnetic signal as the background field.
2.2. Magnetic Anomaly Signal Processing Methods
Several common magnetic anomaly signal processing methods will be introduced below:
- The high-order crossing (HOC) technique is a discrete signal detection methodology based on statistical signal characteristics and time series signal analysis theory. It is also a zero-crossing number-based spectrum analysis approach. It can discriminate between signals and is frequently used in non-destructive testing, facial recognition, and seismic signal detection. The ferromagnetic target signal’s HOC value differs from the noise signal’s HOC statistical features. As a result, the HOC approach may be utilized to discriminate between the target signal and the noise signal, making it an efficient magnetic anomaly signal identification method [46].
- Stochastic Resonance (SR) is a new method type that uses noise to enhance weak signal information. In 2022, this method was adopted by Wan to detect magnetic anomaly signals, and it produced great results [47]. The Stochastic Resonance Method distinguishes itself from other methods with two advantages: (a) ease of realization; and (b) satisfactory detection performance, that is, the output state can be switched when the magnetic anomaly signal is embedded in the noise detected.
- Independent fractions can be suppressed by using the sparsity of the wavelet transform matrix, thus achieving an effective signal extraction and demagnetizing method. Current wavelet transform approaches for magnetic anomaly detection mostly combine wavelet transform with neural networks [48], autoencoders [49], and autoregressive-integrated moving average models [50].
The power frequency magnetic field disturbance signal is characterized by a low signal-to-noise ratio, difficult identification, and unclear signal features; therefore, the signal extraction method based on deep learning is of great practical significance for the extraction and identification of power frequency disturbance signals. Deep learning recognition methods based on neural networks can extract the features of nonlinear or high-dimensional spatial data through nonlinear activation functions in neural networks without previous information. These methods can roughly be divided into two categories:
- Deep learning recognition based on feature parameters. Identification is made by using self-coding networks, the PCA algorithm, the Fisherface algorithm, wavelet transform, and other methods, and combining the BP neural network, Softmax, K-Nearest Neighbor, the deep self-coding network, and other classifiers [51].
- Manual feature extraction is not required by deep learning recognition based on signal data. The preprocessed data are directly sent to the neural network [52], and the classification and recognition of modulating signals are achieved through a self-organizing and self-learning mechanism of the network.
When dealing with a magnetic signal that is being interfered with by white noise, the orthogonal basis decomposition has greater advantages. This approach is less sensitive to the target magnetic moment and makes obtaining the target signal easier. The drawback is that the calculation is enormous and difficult to do in real time. However, because the noise in the magnetic signal is primarily random noise, it is frequently essential to whiten the noise first, such as differential elimination of common-mode noise of two magnetometers or the development of high-order whitening filters. Since the Orthonormal Basis Function (OBF) is more suitable for white noise, and noise in a power frequency environment is mostly random, noise whitening is necessary before the application of the OBF method, such as differential elimination of common mode noise for two magnetometers [53].
The HOC approach for magnetic anomaly identification has the advantage of requiring only over-zero counts without the requirement for spectral analysis, making it computationally simple and arithmetically efficient. However, HOC is only useful for signal processing with a low signal-to-noise ratio. The Stochastic Resonance Method uses noise to enhance abnormal signal information, thus improving the output signal-to-noise ratio of a nonlinear dynamic system. It does not require deterministic parameters of the signal and is applicable for random noise. But only one type of abnormal signal detection employs this approximate performance detection method. The wavelet transform approach reduces noise well, but it has trouble retrieving information from signals with high noise due to signal amplitude decay. The detected magnetic anomaly signal is usually composed of tens of thousands of copies of magnetic field noise. Numerous elements influence magnetic field noise, resulting in variance that is difficult to eradicate and lacks regularity. Although the deep learning-based method moderates the demand for manual processing, the currently used deep neural network is not as capable as expected in signal recognition in low signal-to-noise ratio conditions.
Therefore, considering the above defects of the currently used magnetic anomaly detection methods, the maximized retainment of magnetic anomaly signals and the removal of magnetic field noise will become the focus of future research. Currently, there are a large number of magnetic anomaly localization algorithms; however, most of them fail to properly detect weak signals. Therefore, it is necessary to improve the existing algorithms or develop innovative algorithms and put the improved or new magnetic anomaly detection technologies into practice.
In this paper, synchrosqueezed wavelet transform and extraction of time-frequency ridges calculated from the greedy algorithm are combined to extract target-induced magnetic anomaly disturbances. Compared with wavelet transform, this method produces a clearer time-frequency display of magnetic anomaly signals; it can effectively detect the presence of targets even with a low signal-to-noise ratio, which is impossible for minimum entropy filtering, deep learning, and higher-order crossings. Compared with the Orthogonal Basis Algorithm, it does not require multiple magnetometers to perform the difference and is less computationally intensive.
3. Methodology
In this paper, a scheme of power frequency Magnetic Anomaly Signal Detection (MASD) based on synchrosqueezed wavelet transform and time-frequency ridges is provided. The scheme uses an inductive magnetometer to collect the Power Frequency magnetic field signal and uses the simultaneous synchrosqueezed wavelet transform to convert the signal data into a time-frequency map, and finally uses a greedy algorithm to extract the maximum value of the time-frequency signal to form a time-frequency ridge to achieve target detection. Synchrosqueezed wavelet transform is a time-frequency analysis technique, which converts the rearrangement operator into wavelet transform, which is an algorithm that combines the benefits of the rearrangement algorithm with wavelet transform. The greedy technique can extract the perturbation signal caused by the magnetic anomaly signal in the external field environment with increased interference. We will present the rearrangement operator, synchrosqueezed wavelet transform, and how to extract the time-frequency ridges using the greedy technique in this part.
3.1. Time-Frequency Spectrum Rearrangement Algorithm
Time-frequency energy is seriously diffused near the real energy axis as with the Continuous Wavelet Transform (CWT) and Short-Time Fourier Transform (STFT) methods. As a result, an inaccurate understanding of the time-frequency energy signal is developed. The rearrangement algorithm rearranges and compresses the time spectrum energy of signals according to their energetic center of gravity, thus obtaining more intensive energy [54]. The rearrangement steps are as follows:
Step 1: The expression for calculating the rearrangement operator is:
where can be regarded as group delay and can be regarded as instantaneous frequency.
Step 2: After the rearrangement operator is obtained, rearrange the time spectrum energy, namely , which can be expressed by the following formula:
The original energy axis will get closer to the real energy axis through the Rearrangement Algorithm, which can better reflect the time-frequency characteristics of non-stationary signals. From Formula (4), it can be noted that the spectrum will lose its phase information and the reconstruction of the signal will fail after rearrangement, which is one of the significant defects of this method.
3.2. Synchrosqueezed Wavelet Transform
Daubechies [26] proposed a compromise method to cope with the failure of reconstruction through the Rearrangement Algorithm, that is, a Synchrosqueezing Algorithm that only squeezes along the frequency’s direction. It can be regarded as a special case of the Rearrangement Algorithm, which preserves the phase information while improving the time-frequency resolution, thus realizing signal reconstruction.
The synchrosqueezed wavelet transform assumes that the signal to be analyzed is multi-component. A multi-component signal is composed of a series of AM-FM signals, and its mathematical expression is shown in Formula (5) [55]:
where and can be regarded as instantaneous amplitude and instantaneous phase. When , , and are simultaneously established, the ideal time-frequency characterization of is shown in Formula (6):
If the mathematical formula of the signal is regarded as a single harmonic component with amplitude A, there are:
The following results can be produced based on continuous wavelet transform and the Plancherel Theorem:
where and are Fourier Transforms of the signal and wavelet function respectively. If satisfies , , the wavelet transform result should be concentrated on . However, the actual wavelet transform result expands from and the phenomena of instantaneous information ambiguity are produced. Therefore, when the instantaneous frequency will be:
The result of the operator is for the mathematical formula of a single harmonic signal , while it is for a weak modulation signal. The operator is the mapping operator of the synchrosqueezed wavelet transform.
When coordinate mapping is performed on the wavelet coefficients of the continuous wavelet transform, the wavelet coefficients are transformed from time-scale domain to time-frequency domain, that is, . In applications, and , synchrosqueezed wavelet transform in the discrete state can be expressed as follows [56]:
3.3. An Improved Greedy Algorithm for the Extraction of the Time-Frequency Ridge of Modulus Maxima
A penalty function is created by the algorithm to punish frequency jumps, where the specific penalty value is proportionate to the distance of the corresponding central frequency interval and then the local optimal energy ridge is identified for every moment through a continuous update. Let be the penalty value, be the time-frequency module at a certain point, and D be the distance from the frequency position obtained at the previous time point, and the possible value of the new value generated after the penalty is:
The process of acquiring the time-frequency ridge by the greedy algorithm is shown as follows:
Step 1: The value of the initial time is unchanged, the energy module of the synchrosqueezed wavelet transform is regarded as the time-frequency matrix , the vertical axis m of matrix is regarded as the frequency interval, and the horizontal axis n is regarded as the time step. Namely:
Step 2: The algorithm is started from the initial time of , that is, after being updated, the highest frequency, that is, is:
At the second moment, other values are updated as shown in Equation (13), and the value at the third moment is:
A cyclic update is applied. The new data in the last column replace those in the first column as the input of the data in the first column.
Step 3: After the cyclic update, a new matrix is finally generated, as shown in Formula (15):
Step 4: The strongest time-frequency ridge path is abstracted and the cycle restarts until an adequate number of time-frequency ridges are extracted.
4. Performance Analysis
4.1. Simulation Performance Analysis
In this paper, a moving target model with both target and 50 Hz background magnetic field was used and several points for observation were placed in the model for signal collection. The purpose was to verify the detectability of targets in the power frequency magnetic field and the superiority of synchrosqueezed wavelet transform to process power frequency magnetic anomaly signals.
4.1.1. Setting up a Simulation Model
In this paper, a moving target detection model was used under a 50 Hz geomagnetic field. For this model, a ferromagnetic target 5 m long, 1.9 m wide, and 1.4 m high was placed in the model. The relative permeability was 1000. A simulated power frequency background field was constructed, which had a similar intensity to the measured one as well. An observation point was placed 5 m away from the target CPA, as shown in Figure 1:
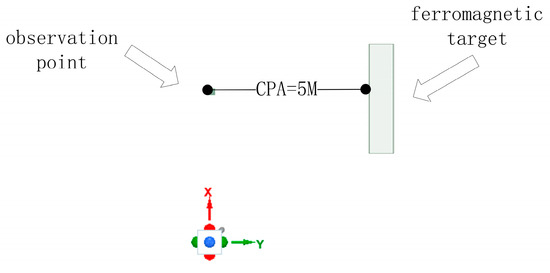
Figure 1.
Moving target detection model.
The target passed through the observation point at a speed of 5 km/h, resulting in the power frequency magnetic field disturbance signal as shown in Figure 2:
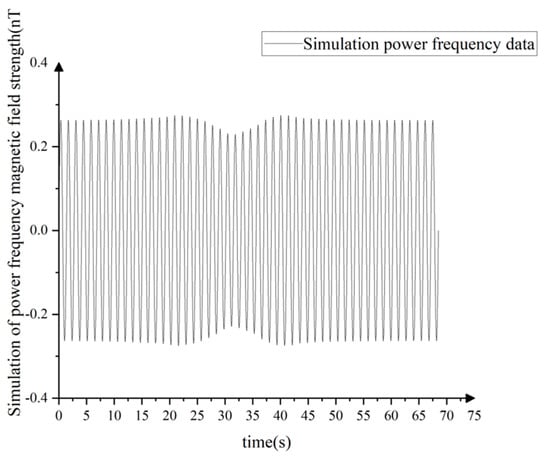
Figure 2.
Simulates the time−domain magnetic perturbation signal.
4.1.2. Extracting Time-Frequency Features from Simulation Signals
The disturbing signal was subjected to short-time Fourier transform, continuous wavelet transform, and synchrosqueezed wavelet transform, respectively, to extract power spectra. “Bump” wavelet was adopted by both wavelet methods, as shown in Figure 3:
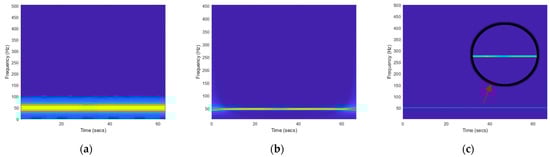
Figure 3.
The simulation data using STFT, CWT, and SSWT processing time-frequency diagram; (a–c) are STFT, CWT, and SSWT images.
From the generation of the simulation signal and the analysis of the above figure, it can be observed that the short-time Fourier transform and the continuous wavelet transform does not have good time-frequency resolution and cannot effectively display the change of the target signal in the time-resolved spectra while the synchrosqueezed wavelet transform can better concentrate the energy near the real energy axis, and the signal weakens significantly when the target passes through (that is, it turns from the yellow color of strong energy to the blue color of weak energy). The simulation signal also effectively proves the feasibility of the power frequency magnetic anomaly detection technology, that is, the magnetic field around the observation point will be affected by the movement of ferromagnetic targets.
Intending to obtain a quantitative and intuitive evaluation and comparison of the advantages of several different methods for time-frequency analysis, this paper denoises the simulated magnetic anomaly signals generated above and produces the Rayleigh quotient values corresponding to the three time-frequency analysis methods under different signal-to-noise ratios in Figure 3, as shown in Table 1:

Table 1.
Rayleigh entropy comparison of different time-frequency analysis methods under different noise conditions.
The smaller the Rayleigh entropy, the higher is the time-frequency aggregation. As shown in Table 1, the synchrosqueezed wavelet transform spectrum is significantly superior to the latter two in time-frequency resolution, and the synchrosqueezed wavelet transform that generates time-frequency has the smallest Rayleigh quotient.
Meanwhile, this paper compares the performance of four different mother wavelets in the synchrosqueezed wavelet transform: Gauss, Bump, Cmhat, and Morlet, and uses the calculation of the corresponding Rayleigh entropy values of different mother wavelets under different signal-to-noise conditions to judge the advantages and disadvantages of different wavelet bases, the results of which are shown in Table 2.
Table 2.
Comparison of Rayleigh entropy when SSWT is applied with different mother wavelets.
The table demonstrates that the synchrosqueezed wavelet transform method has better time-frequency resolution when using the “Morlet” and “Bump” mother wavelets. When “Morlet” and “Bump” are compared, Bump has a better time-frequency resolution. Therefore, this paper mainly uses the Bump wavelet as the mother wavelet function. In addition, the Bump wavelet has the best performance on the image, and we will put the image comparison between the Bump wavelet and Morlet wavelet in the measured data in Section 4.2.2.
The contours are extracted from three time-spectrum types at the same time to extract the disturbance signal’s features more effectively, as shown in Figure 4:
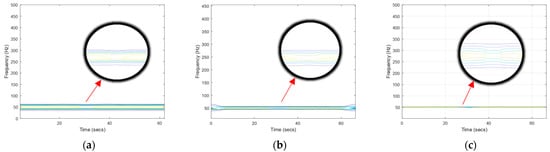
Figure 4.
Comparison of contour lines of STFT, CWT, and SSWT. (a–c) are time frequency contour plots of STFT, CWT and SSWT respectively.
As shown in the enlarged image in Figure 4, the Synchrosqueezing Transform more effectively preserves the features of the magnetic anomaly signal resulting from the target’s movement, and its contour distribution indicates a more profound change, which can better represent the target-induced disturbance signal.
4.1.3. Simulation Signal Analysis Conclusion
It can be concluded through the above simulation data results that the power frequency magnetic field can effectively detect the magnetic disturbance caused by the movement of ferromagnetic targets within the simulated conditions. Compared with other methods, the Synchrosqueezing Transform can also effectively extract the magnetic anomaly signals induced by the movement of ferromagnetic targets and retain the temporal frequency features of the magnetic anomaly signals. Therefore, it can be used as an effective method for magnetic anomaly signal detection.
4.2. Analysis of Measured Magnetic Target Signals
The data used in this paper were collected from the on-site monitoring results of a highway near Tangxun Lake in Wuhan City. This section has fewer vehicles, street lamps, and residential areas. It is identified as a complex noise environment by the detection. In this experiment, the target-induced disturbance was detected by an inductive magnetic sensor, and the appearance of the target (i.e., the vehicle) was calibrated by a fluxgate sensor’s geomagnetic measurements. The positions of the target and the magnetometer are shown in the schematic diagram, shown in Figure 5. The induction magnetometer for the measurement of the alternating magnetic field and the calibration for the fluxgate magnetometer were placed in parallel at 20 cm.
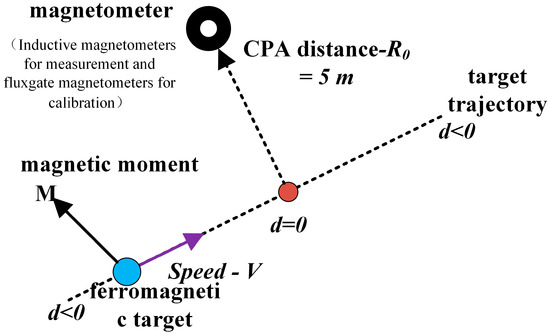
Figure 5.
Schematic diagram of relative position between sensor and target track.
The vehicle was traveling at a uniform speed and vertically passed the CPA point along the connecting line from the magnetometer to the CPA point, and the average passing speed of the target was 5 km/s.
The 50 Hz power frequency magnetic disturbance signal collected by the induction magnetometer used in this paper when the target (i.e., the vehicle) was passing the CPA point is shown in Figure 6:
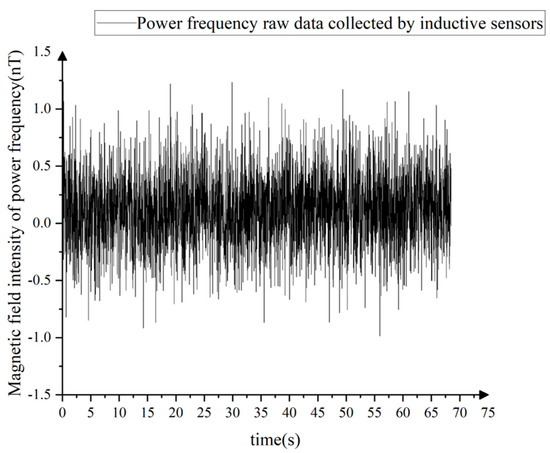
Figure 6.
50 Hz signal with target from 3−axis inductive sensor.
4.2.1. Extraction of the Temporal Frequency Information of the Original Signal
The short-time Fourier transform, continuous wavelet transform, and synchrosqueezed wavelet transform were adopted respectively to extract the time-frequency spectra of the measured data of the induction magnetometer. The results are shown in Figure 7:
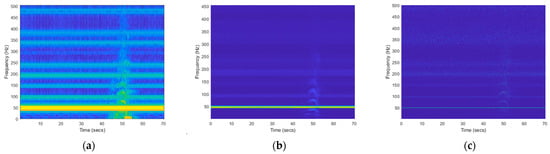
Figure 7.
Comparison of three different time-frequency maps; (a–c) are time-frequency diagrams for STFT, CWT, and SSWT.
They produced consistent results for the processing of simulation signals. The synchrosqueezed wavelet transform can better concentrate energy near the real energy axis in the processing of nonlinear and nonstationary signals without energy leakage. The SSWT spectra had a similar phenomenon to the simulation results, that was, the 50 Hz power frequency signal weakened at the point where the target appeared.
Two different mother wavelets ”Morlet”‘ and ”Bump“ are compared, as shown in Figure 8.
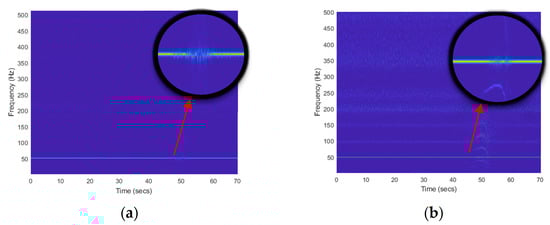
Figure 8.
Comparison of SSWT of mother wavelet “Morlet” and “Bump” where (a) is the “Morlet” mother wavelet and (b) is the “Bump” mother wavelet.
Obviously, the image of the Bump wavelet is clearer and better shows the variation of the measured signal.
The three types of time-frequency diagrams were enlarged to the same scale in the time-frequency domain when the target appeared (near 40–60 s, 30–70 Hz), as shown in Figure 9.
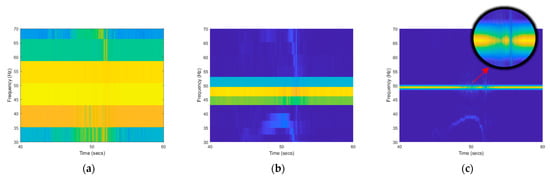
Figure 9.
(40–60 s, 30–70 Hz) resolution STFT, CWT, and SSWT images. (a–c) Time-frequency diagrams of STFT, CWT, and WSST are enlarged to clearly show the changes in the time-frequency diagram.
When the images were enlarged to 40–60 s and 30–70 Hz, it could be observed that the time-frequency resolutions of STFT, CWT, and SSWT differed significantly. Serious energy leakages were observed for STFT and CWT from 35 to 67 Hz and from 43 to 53 Hz, respectively, while only a little energy leakage was observed for SSWT from 49.6 to 50.7 Hz, which made the 50 Hz target magnetic anomaly signal stand out on the SSWT image.
4.2.2. Drawing the Time-Frequency Contour
The contours of short-time Fourier transform, continuous wavelet transform, and synchrosqueezed wavelet transform were drawn respectively, and the results are shown in Figure 10:
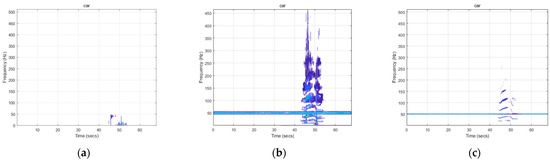
Figure 10.
Draw spectral contour lines for STFT, CWT, SSWT; (a–c) are spectral contour lines for SFFT, CWT, and SSWT.
From the abstracted contour, it can be observed that the energy distribution of the short-time Fourier transform in all frequency bands was strong as a result of serious energy leakage, and the contour lines gathered at the low-frequency band of the near geomagnetic field with high energy. The continuous wavelet transform was superior to Short-time Fourier Transform for better performance, and the former was more advantageous in the high-frequency domain; however, it was inferior in terms of energy leakage control, and the contour lines covered almost all bands. The synchrosqueezed wavelet transform was superior to both as no energy leakage was observed in the 50 Hz band, which significantly improved temporal frequency aggregation and developed a stronger anti-noise ability.
4.2.3. Extraction of Time-frequency Ridge of Synchrosqueezed Wavelet Transform
The time-frequency ridge of synchrosqueezed wavelet transform was abstracted and compared with the geomagnetic calibration signal measured at the same position, as shown in Figure 11:
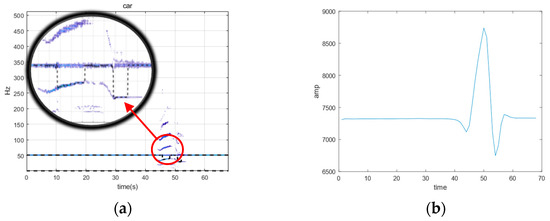
Figure 11.
Extracting wavelet energy ridge and geomagnetic calibration. Among them, (a) is the time-frequency ridge image extracted on the basis of Figure 10c, and (b) is the interference caused by the object measured by the fluxgate sensor in the geomagnetic environment. The change time of the two is consistent, which means that our scheme effectively detects the power frequency magnetic anomaly signal caused by the target.
It can be observed that the 50 Hz signal shook violently when the amplitude of the geomagnetic signal changed significantly and with the time-frequency ridge of the synchrosqueezed wavelet transform. The abstracted time-frequency ridge of the synchrosqueezed wavelet transform conformed to contour distribution. It can be proved that power frequency magnetic disturbance induced by the target movement could be effectively detected by this method.
4.3. Engineering Applications
The new power frequency Magnetic Anomaly Detection Technology proposed in this paper has a wide application potential. It mainly relies on the power frequency field generated by the worldwide 50/60 Hz power grid. It is characterized by low-frequency, strong energy, and cross-media propagation ability. The 50/60 Hz power frequency field signal was detected with the electric field sensors used by low-earth orbit satellites of different countries. The specific detection conditions are shown in Table 3.
Table 3.
Satellite power frequency detection in various countries.
In summary, the electric field data of the power frequency background field over the ocean can be detected by low-earth orbit satellites. Ground, water, and underwater targets generate power frequency amplitudes and phase disturbances that are stronger than the background field, and their features differ greatly from the background field. Therefore, it is feasible to detect targets by low-earth orbit satellites with power frequency electromagnetic waves.
The power frequency electromagnetic field signal spreads over a long distance, affects a wide range, and crosses media. It can be applied in the following major fields, namely detection of flight targets, land targets, marine targets, and unexploded ordnances, as well as mineral exploration, as shown in Figure 12:

Figure 12.
Schematic diagram of engineering application.
5. Discussion
In this paper, a moving target detection model under 50 Hz background is proposed, in which a ferromagnetic target with a CPA distance of 5 m is deployed. The intended speed is 5 Km/h. Its design, size, and material are comparable to those of a tiny passenger car. The simulation results illustrate the viability of power frequency magnetic detection technology and the usefulness of synchrosqueezed wavelet transform in information extraction, specifically in the following ways:
- In the time-frequency picture created by the SSWT technique, the target motion causes the intensity change of 50 Hz power frequency background field at the observation point, which is 5 m distant;
- In the case of SNR = 0 db, compared with continuous wavelet transform and short-time Fourier transform, the Rayleigh entropy of synchrosqueezed wavelet transform falls by 4.1886 and 4.3623 correspondingly.
We also took actual field trials and reproduced the simulated circumstances. The car passed the sensor at a speed of 5 km/h, and the CPA distance between the vehicle and the sensor was 5 m. Through trials, we proved that the approach can successfully identify the power frequency magnetic anomaly disturbance signal induced by the presence of the target. The phenomenon is that the extracted wavelet energy ridge anomaly is the same as the occurrence time of the target calibrated by the geomagnetic sensor, or in other words, the fluxgate sensor receiving the geomagnetic signal is deployed in the same position as the inductive magnetic sensor receiving the alternating magnetic signal.
Simulation and experimental results demonstrated the following findings:
- A magnetic field with a high power frequency can be observed.
- The target’s mobility can impact the power frequency magnetic field and be detected.
- The approach described in this research is more effective than the STFT and CWT methods in detecting the power frequency magnetic field.
- The Bump mother wavelet is more sensitive to magnetic anomalies than the Gauss, Cmhat, and Morlet mother waves.
The technique is projected to play its part in non-destructive testing, indoor positioning, target recognition, and other domains.
The technique still requires more air and underwater experimental verification and lacks further verification trials under extreme interference circumstances. This approach may also be integrated with the magnetic gradient anomaly model and target analysis method discussed in the introduction to produce a more effective target location and target recognition algorithm. However, as a fresh notion, it has a certain importance.
6. Conclusions
This research proposed a novel method for locating targets utilizing power-frequency magnetic fields. A power frequency magnetic anomaly signal processing technique based on synchrosqueezed wavelet transform and enhanced greedy algorithm to extract time-frequency ridge served as the framework for this method. This technique combines the synchrosqueezed wavelet transform’s benefit of high temporal frequency resolution with the greedy algorithm’s capacity to detect disturbance signals. As a result, it can effectively detect the signal and has the benefits of both the synchrosqueezed wavelet transform and the greedy method.
The approach suggested in this work has some research value because it is a novel magnetic anomaly-detecting method. Compared to WEM, MTEM SOTEM, and other electromagnetic detection methods, the proposed technique has the advantages of low cost and a simple construction by using a power frequency magnetic field as the emission source. Furthermore, the applications of this technology as an alternative to magnetotelluric detection methods may be possible, given the broad coverage of the power frequency magnetic field.
This method still has many unresolved issues, including a hazy mechanism for power frequency electromagnetic field cross-media transmission and unclear effects of target movement on power frequency magnetic signal detection. The next work plan research will concentrate on those mentioned above.
Author Contributions
Conceptualization, B.T.; investigation, X.L.; validation, J.J.; writing—original draft, S.W.; writing—review and editing, J.T. and N.X. All authors have read and agreed to the published version of the manuscript.
Funding
This work was supported by the Nanchang Key Laboratory of Internet of things information visualization technology. Grant No. 2020-NCZDSY-017.
Acknowledgments
The authors would like to thank the Editor-in-Chief, Editor and anonymous Reviewers for their valuable reviews.
Conflicts of Interest
The authors declare no conflict of interest.
References
- Zhao, Y.; Zhang, J.; Li, J.; Liu, S.; Miao, P.; Shi, Y.; Zhao, E. A Brief Review of Magnetic Anomaly Detection. Meas. Sci. Technol. 2021, 32, 042002. [Google Scholar] [CrossRef]
- Marshall, S.V. Vehicle Detection Using a Magnetic Field Sensor. IEEE Trans. Veh. Technol. 1978, 27, 65–68. [Google Scholar] [CrossRef]
- Chirgwin, C. Managing Land Mine and UXO Contamination in Exploration Projects. Lead. Edge 2005, 24, 376–377. [Google Scholar] [CrossRef]
- Zalevsky, Z.; Bregman, Y.; Salomonski, N.; Zafrir, H. Resolution Enhanced Magnetic Sensing System for Wide Coverage Real Time UXO Detection. J. Appl. Geophys. 2012, 84, 70–76. [Google Scholar] [CrossRef]
- Bello, R. Literature Review on Landmines and Detection Methods. Front. Sci. 2013, 1, 27–42. [Google Scholar]
- Hirota, M.; Furuse, T.; Ebana, K.; Kubo, H.; Tsushima, K.; Inaba, T.; Shima, A.; Fujinuma, M.; Tojyo, N. Magnetic Detection of a Surface Ship by an Airborne LTS SQUID MAD. IEEE Trans. Appiled Supercond. 2001, 11, 884–887. [Google Scholar] [CrossRef]
- Li, Y.; Sun, J.; Li, S.-L.; Leão-Santos, M. A Paradigm Shift in Magnetic Data Interpretation: Increased Value through Magnetization Inversions. Lead. Edge 2021, 40, 89–98. [Google Scholar] [CrossRef]
- Essa, K.S.; Mehanee, S.; Elhussein, M. Magnetic Data Profiles Interpretation for Mineralized Buried Structures Identification Applying the Variance Analysis Method. Pure Appl. Geophys. 2021, 178, 973–993. [Google Scholar] [CrossRef]
- Essa, K.S.; Diab, Z.E. Magnetic Data Interpretation for 2D Dikes by the Metaheuristic Bat Algorithm: Sustainable Development Cases. Sci. Rep. 2022, 12, 14206. [Google Scholar] [CrossRef]
- Nazlibilek, S.; Ege, Y.; Kalender, O. A Multi-Sensor Network for Direction Finding of Moving Ferromagnetic Objects inside Water by Magnetic Anomaly. Measurement 2009, 42, 1402–1416. [Google Scholar] [CrossRef]
- Zhdanov, M.S.; Keller, G.V. The Geoelectrical Methods in Geophysical Exploration. Methods Geochem. Geophys. 1994, 31, I–IX. [Google Scholar]
- Mehanee, S.; Golubev, N.; Zhdanov, M.S. Weighted Regularized Inversion of Magnetotelluric Data. In SEG Technical Program Expanded Abstracts 1998; Society of Exploration Geophysicists: Houston, TX, USA, 1998; pp. 481–484. [Google Scholar]
- Mehanee, S.; Zhdanov, M. Two-Dimensional Magnetotelluric Inversion of Blocky Geoelectrical Structures. J. Geophys. Res. Solid Earth 2002, 107, EPM 2-1–EPM 2-11. [Google Scholar] [CrossRef]
- Chang, J.; Yu, J.; Li, J.; Xue, G.; Malekian, R.; Su, B. Diffusion Law of Whole-Space Transient Electromagnetic Field Generated by the Underground Magnetic Source and Its Application. IEEE Access 2019, 7, 63415–63425. [Google Scholar] [CrossRef]
- Wang, Y.; NAI, L.; NIU, J. Experimental Study on High-Sensitivity Induction Magnetometer. Chin. J. Geophys. 2019, 10, 3760–3771. [Google Scholar]
- Yan, B.; Zhu, W.; Zhuang, X.; Liu, L.; Fang, G. Miniature Three-Axis Induction Magnetometer for Borehole Logging. IEEE Magn. Lett. 2019, 10, 8109404. [Google Scholar] [CrossRef]
- Ginzburg, B.; Frumkis, L.; Kaplan, B.Z.; Sheinker, A.; Salomonski, N. Investigation of Advanced Data Processing Technique in Magnetic Anomaly Detection Systems. Int. J. Smart Sens. Intell. Syst. 2008, 1, 110. [Google Scholar] [CrossRef]
- Ginzburg, B.; Sheinker, A.; Salomonski, N.; Kaplan, B.Z.; Frumkis, L. Application of Target-Based and Noise-Based Methods in Magnetic Anomaly Detection Systems. In Proceedings of the MARELEC-Marine Electromagnetics, Stockholm, Sweden, 7 July 2009; pp. 7–9. [Google Scholar]
- Wynn, W. Detection, Localization, and Characterization of Static Magnetic-Dipole Sources. In Detection and Identification of Visually Obscured Targets; Routledge: Oxfordshire, UK, 2019; pp. 337–374. ISBN 978-1-315-14108-4. [Google Scholar]
- Yoshii, T. Method for Detecting a Magnetic Source by Measuring the Magnetic Field Thereabout. U.S. Patent No. 4,309,659, 5 January 1982. [Google Scholar]
- Mori, K. Detection of magnetic anomaly signal by applying adjustable weight functions. IEEE Trans. Magn. 1990, 26, 1083–1087. [Google Scholar] [CrossRef]
- Mandrikova, O.; Solovjev, I.; Geppener, V.; Al-Kasasbeh, R.T.; Klionskiy, D. Analysis of the Earth’s Magnetic Field Variations on the Basis of a Wavelet-Based Approach. Digit. Signal Process. 2013, 23, 329–339. [Google Scholar] [CrossRef]
- Singh, A.; Singh, U.K. Continuous Wavelet Transform and Euler Deconvolution Method and Their Application to Magnetic FIeld Data of Jharia Coalfield, India. Geosci. Instrum. Methods Data Syst. 2017, 6, 53–69. [Google Scholar] [CrossRef]
- Zamudio-Ramirez, I.; Antonino-Daviu, J.A.; Osornio-Rios, R.A.; de Jesus Romero-Troncoso, R.; Razik, H. Detection of Winding Asymmetries in Wound-Rotor Induction Motors via Transient Analysis of the External Magnetic Field. IEEE Trans. Ind. Electron. 2020, 67, 5050–5059. [Google Scholar] [CrossRef]
- Zhong, Y.; Qin, S. Study on Unified Theoretical Basis of Hilbert-Huang Transform. Vib. Shock 2006, 25, 40–43. [Google Scholar]
- Daubechies, I. Synchrosqueezed Wavelet Transforms: An Empirical Mode Decomposition-like Tool. Appl. Comput. Harmon. Anal. 2011, 30, 243–261. [Google Scholar] [CrossRef]
- Thakur, G.; Brevdo, E.; Fučkar, N.S.; Wu, H.-T. The Synchrosqueezing Algorithm for Time-Varying Spectral Analysis: Robustness Properties and New Paleoclimate Applications. Signal Process. 2013, 93, 1079–1094. [Google Scholar] [CrossRef]
- Di, Q.Y.; Zhu, R.X.; Xue, G.Q. New Development of the Electromagnetic (EM) Methods for Deep Exploration. Chin. J. Geophys. 2019, 62, 2128–2138. [Google Scholar]
- Di, Q.Y.; Wang, G.J.; Wang, M.Y. Frequency Response Characteristics of Target Electric Property with Long Bip. Chin. J. Geophys. 2009, 50, 275–280. [Google Scholar]
- FU, C.M.; DI, Q.Y.; WANG, M.Y. Calculate Electromagnetic Fields in Stratified Medium with Layer-Matrix Method. Chin. J. Geophys. 2010, 53, 177–188. [Google Scholar]
- Li, D.Q.; Di, Q.Y.; Wang, M.Y. Study of Large Scale Large Power Control Source Electromagnetic with “Earth-Ionosphere” Mode. Chin. J. Geophys. 2010, 53, 411–420. [Google Scholar]
- Li, D.Q.; Di, Q.Y.; Wang, M.Y. One-Dimensional Electromagnetic Fields Forward Modeling for Earth-Ionospher. Chin. J. Geophys. 2011, 54, 2375–2388. [Google Scholar]
- David, A.W. Detection of Hydrocarbons and Their Movement in a Reservoir Using Time-Lapse Multichannel Transient ElectroMagnetic (MTEM) Data. Doctoral Dissertation, University of Edinburgh, Edinburgh, UK, 2004. [Google Scholar]
- Wright, D.A.; Ziolkowski, A.M. Detection of Subsurface Resistivity Contrasts with Application to Location of Fluids. U.S. Patent 20,040,232,917, 25 November 2004. [Google Scholar]
- Ziolkowski, A.; Hobbs, B.A.; Wright, D. Multitransient Electromagnetic Demonstration Survey in France. Geophysics 2007, 72, 197–209. [Google Scholar] [CrossRef]
- Wang, X.-X.; Di, Q.-Y.; Wang, M.-Y.; Deng, J.-Z. A Study on the Noise Immunity of Electromagnetic Methods Based on m Pseudo-Random Sequence. Chin. J. Geophys. Chin. 2016, 59, 1861–1874. [Google Scholar]
- Wang, X.-X.; Di, Q.-Y.; Deng, J.-Z.; Li, J.-P. The Full-Time Apparent Resistivity Definition of the Multi-Channel Transient Electromagnetic Method. Comput. Geosci. 2021, 153, 104770. [Google Scholar] [CrossRef]
- Skokan, C.K.; Andersen, H.T. Deep Long-Offset Transient Electromagnetic Surveys for Crustal Studies in the U.S.A. Phys. Earth Planet. Inter. 1991, 66, 39–50. [Google Scholar] [CrossRef]
- XUE, G.-Q.; CHEN, W.-Y.; ZHOU, N.-N.; LI, H. Short-Offset TEM Technique with a Grounded Wire Source for Deep Sounding. Chin. J. Geophys. Chin. 2013, 56, 255–261. [Google Scholar]
- Chen, W.-Y.; Xue, G.-Q.; Cui, J.-W.; Zhong, H.-S. Study on the Response and Optimal Observation Area for SOTEM. Chin. J. Geophys. Chin. 2016, 59, 739–748. [Google Scholar]
- Chen, W.-Y.; Xue, G.-Q.; Chen, K.; Zhong, H.-S. 1D OCCAM Inversion of SOTEM Data and Its Application to 3D Models. Chin. J. Geophys. Chin. 2017, 60, 3667–3676. [Google Scholar]
- Zhou, N.N.; Xue, G.Q.; Chen, W. Large-Depth Hydrogeological Detection in the North China-Type Coalfield through Short-Offset Grounded-Wire TEM. Environ. Earth Sci. Xue G Hou 2015, 74, 2393–2404. [Google Scholar] [CrossRef]
- Zhou, N.N.; Xue, G.; Li, H. A Comparison of Different-Mode Fields Generated from Grounded-Wire Source Based on the 1D Model. PURE Appl. Geophys. 2016, 173, 591–606. [Google Scholar] [CrossRef]
- Zhou, N.; Xue, G.; Hou, D.; Li, H.; Chen, W. Short-Offset Grounded-Wire TEM Method for Efficient Detection of Mined-out Areas in Vegetation-Covered Mountainous Coalfields. Explor. Geophys. 2016, 48, 374–382. [Google Scholar] [CrossRef]
- Zhou, N.; Xue, G.Q.; Hou, D.Y.; Lu, Y. An Investigation of the Effect of Source Geometry on Grounded-Wire TEM Surveying with Horizontal Electric Field. J. Environ. Eng. Geophys. 2018, 23, 143–151. [Google Scholar] [CrossRef]
- Sheinker, A.; Ginzburg, B.; Salomonski, N.; Dickstein, P.A.; Frumkis, L.; Kaplan, B.-Z. Magnetic Anomaly Detection Using High-Order Crossing Method. IEEE Trans. Geosci. Remote Sens. 2012, 50, 1095–1103. [Google Scholar] [CrossRef]
- Wan, C.; Pang, H.; Mou, S.; Li, H.; Pan, M.; Zhang, Q.; Yang, D. Magnetic Anomaly Detection Using a Parallel Stochastic Resonance System. IEEE Trans. Instrum. Meas. 2022, 71, 9502208. [Google Scholar] [CrossRef]
- Fan, L.; Hu, H.; Zhang, X.; Wang, H.; Kang, C. Magnetic Anomaly Detection Using One-Dimensional Convolutional Neural Network With Multi-Feature Fusion. IEEE Sens. J. 2022, 22, 11637–11643. [Google Scholar] [CrossRef]
- Mandrikova, O.; Mandrikova, B. Hybrid Method for Detecting Anomalies in Cosmic Ray Variations Using Neural Networks Autoencoder. Symmetry 2022, 14, 744. [Google Scholar] [CrossRef]
- Mandrikova, O.V.; Fetisova, N.V.; Polozov, Y.A. Method for Modeling of Ionospheric Parameters and Detection of Ionospheric Disturbances. Comput. Math. Math. Phys. 2021, 61, 1094–1105. [Google Scholar] [CrossRef]
- Sun, T.; Wang, X.; Wang, J.; Yang, X.; Meng, T.; Shuai, Y.; Chen, Y. Magnetic Anomaly Detection of Adjacent Parallel Pipelines Using Deep Learning Neural Networks. Comput. Geosci. 2022, 159, 104987. [Google Scholar] [CrossRef]
- WANG, J.; QIAN, Y.; HU, W. Generalized Likelihood Ratio Detector for Colocated OFDM-MIMO Radar. Radar Sci. Technol. 2019, 17, 299–304. [Google Scholar]
- Zhou, J.; Wang, C.; Peng, G.; Yan, H.; Zhang, Z.; Chen, Y. Magnetic Anomaly Detection via a Combination Approach of Minimum Entropy and Gradient Orthogonal Functions. ISA Trans. 2022, in press. [Google Scholar] [CrossRef]
- Tang, J.J.; Liang, H.; Zhu, Z.Q. Detection of Small Targets on Sea Surface Based on Time-Frequency Ridge of Rearranged Spectrum. Electron. Opt. Control 2021, 28, 53–57. [Google Scholar]
- Anvari, R.; Kahoo, A.R.; Mohammadi, M.; Khan, N.A.; Chen, Y. Seismic Random Noise Attenuation Using Sparse Low-Rank Estimation of the Signal in the Time–Frequency Domain. IEEE J. Sel. Top. Appl. Earth Obs. Remote Sens. 2019, 12, 1612–1618. [Google Scholar] [CrossRef]
- Ma, H.; Yan, J.; Li, Y. Low-Frequency Noise Suppression of Desert Seismic Data Based on Variational Mode Decomposition and Low-Rank Component Extraction. IEEE Geosci. Remote Sens. Lett. 2020, 17, 337–341. [Google Scholar] [CrossRef]


Publisher’s Note: MDPI stays neutral with regard to jurisdictional claims in published maps and institutional affiliations. |
© 2022 by the authors. Licensee MDPI, Basel, Switzerland. This article is an open access article distributed under the terms and conditions of the Creative Commons Attribution (CC BY) license (https://creativecommons.org/licenses/by/4.0/).