

Analyzing the Data Completeness of Patients’ Records Using a Random Variable Approach to Predict the Incompleteness of Electronic Health Records


Abstract
:1. Introduction
- 1
- Investigate the probability distributions that can be best suited for analyzing data incompleteness with the purpose of identifying the part of the dataset that is usually incomplete.
- 2
- Investigate the possibility of using deep learning networks to advance the previous objective.
- 1
- To detect the completeness of the dataset;
- 2
- To employ innovative data optimization approaches to find the cure for identifying algorithmic processes and appropriate analytical guidance for the validation of the use of goodness of fit statistics.
2. Background
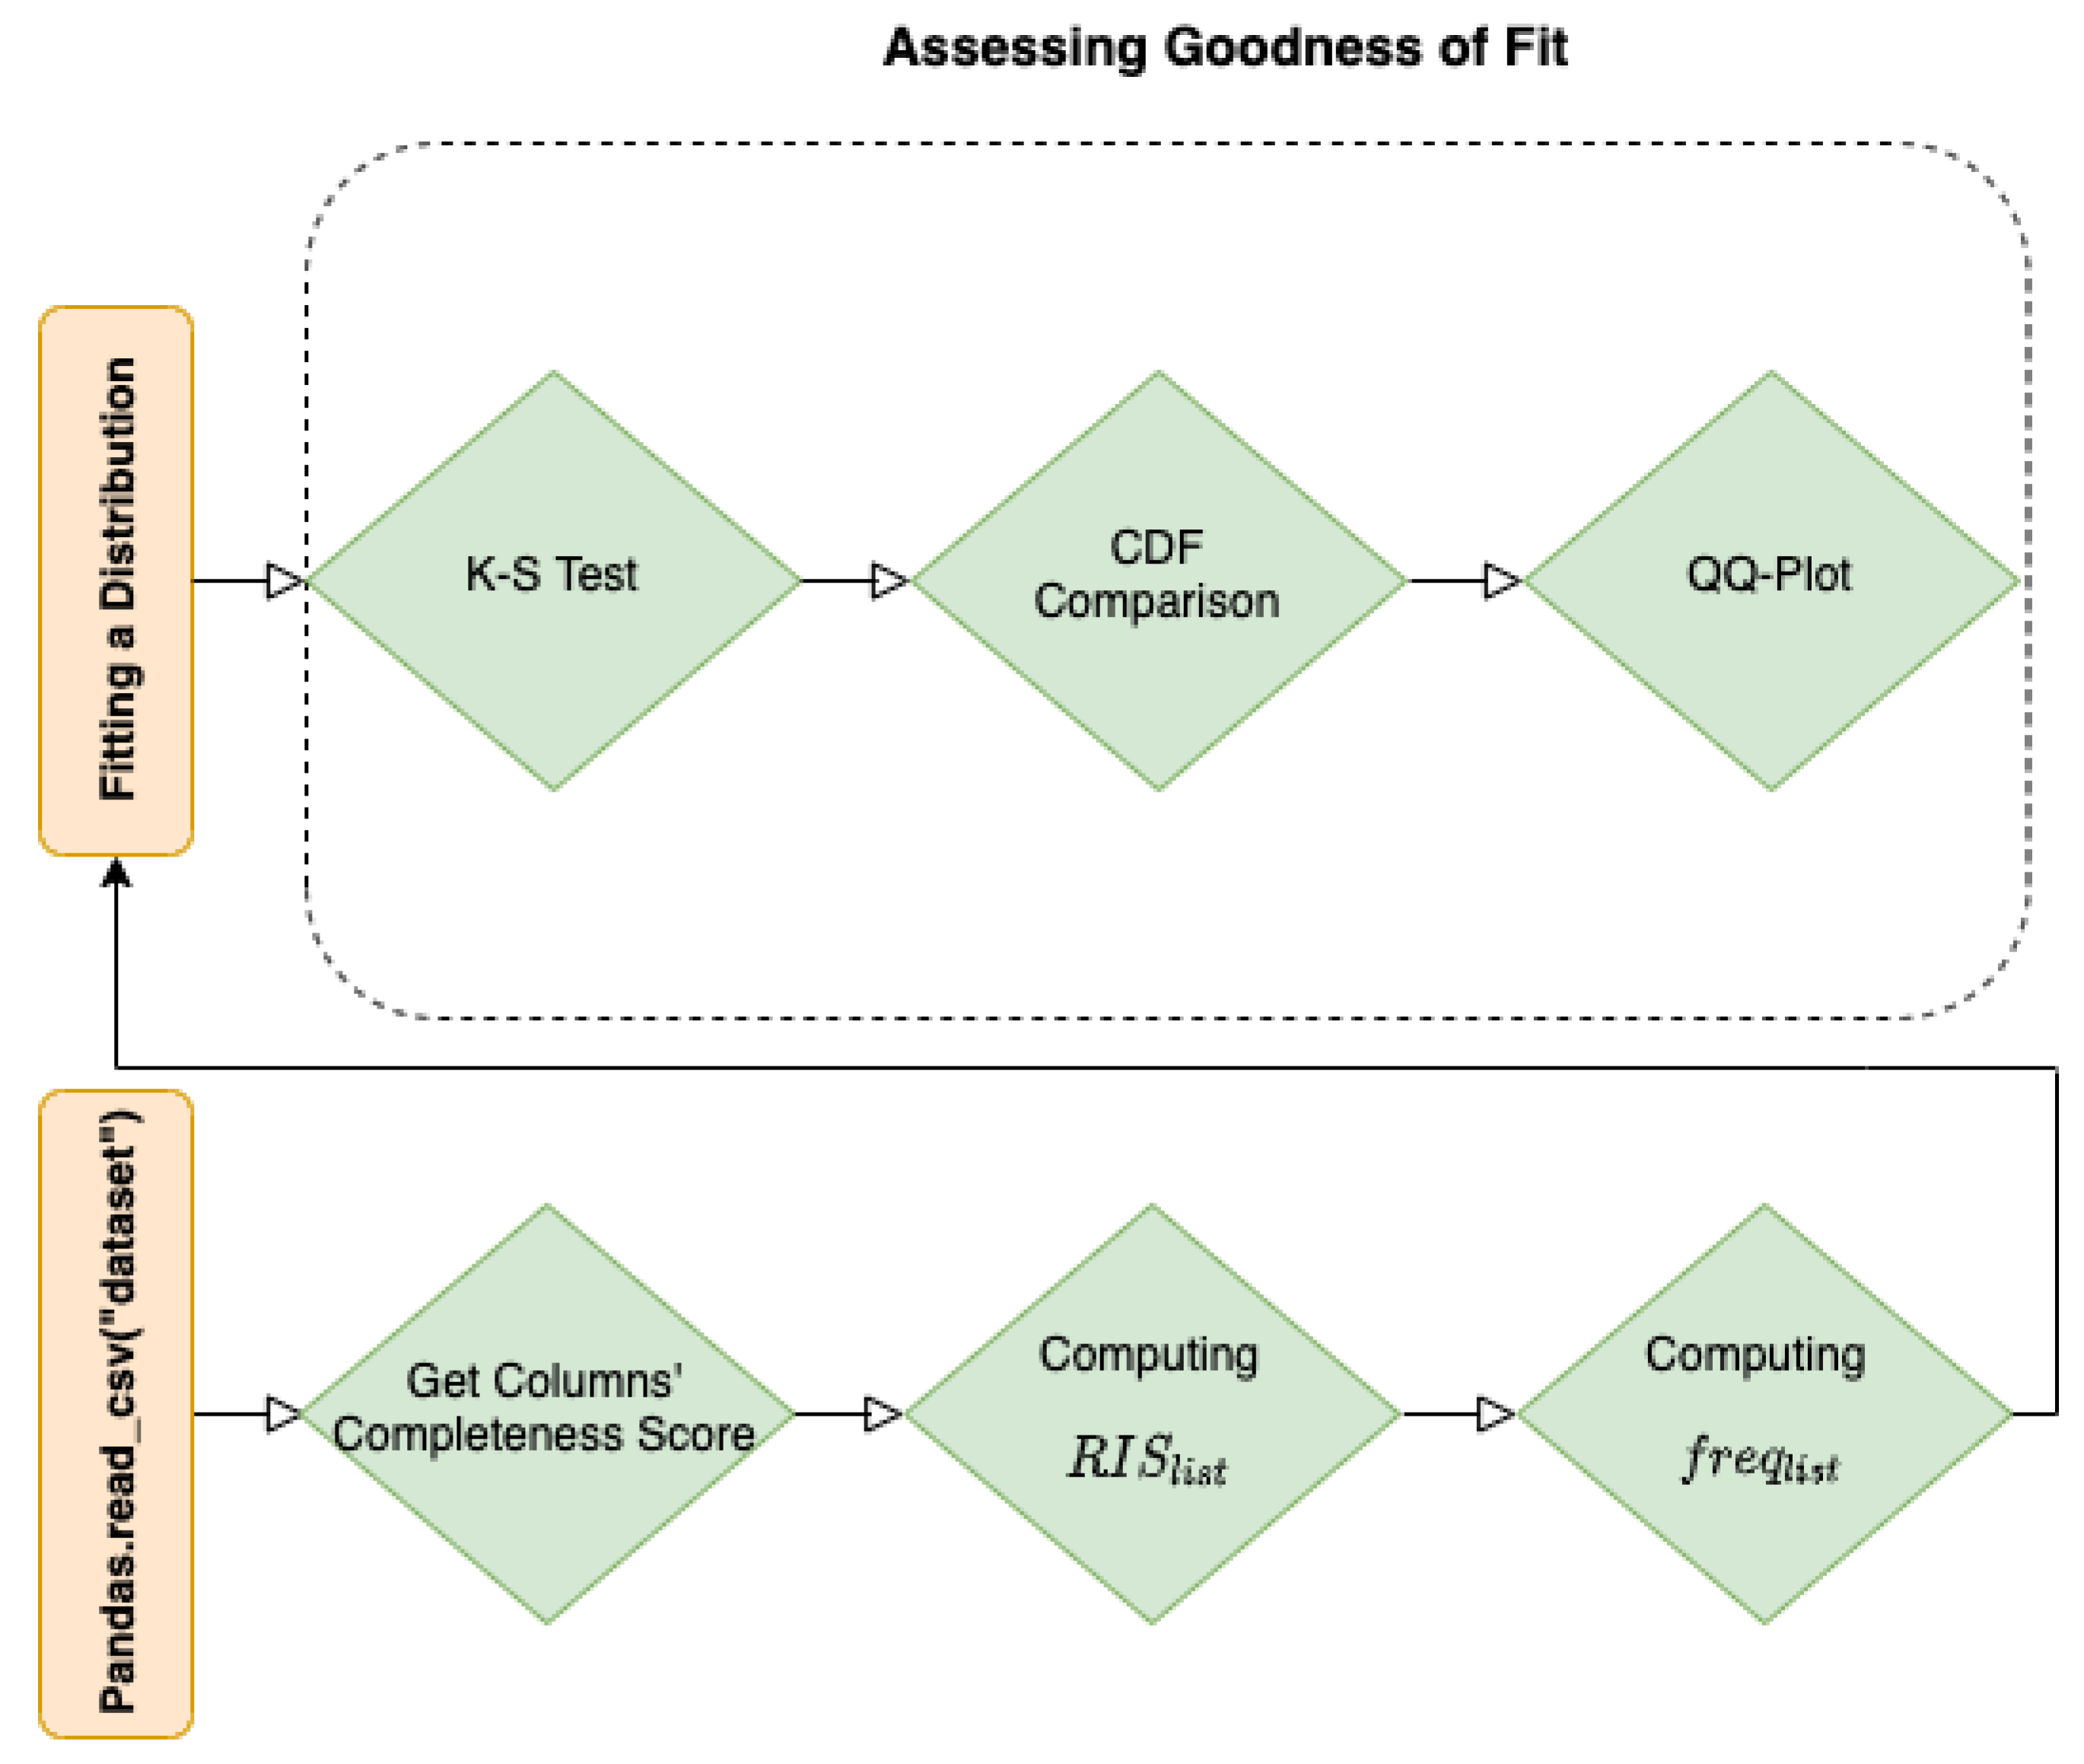
3. Methods
- : Binary Completeness Variable for the data field located in ith row and jth column (1 represents complete data field and 0 represents incomplete field);
- Record Completeness Score (): Where, is the completeness measure of column j and its value is between 0 and 1:where r is number of rowsnumber of columns (c) (Regularly, , since the first column always contains the header of each row).
- : defines the Record Incompleteness Score of column j or Incompleteness Ratio of column j:
| Algorithm 1: Plotting the histogram for the experimental dataset |
 |
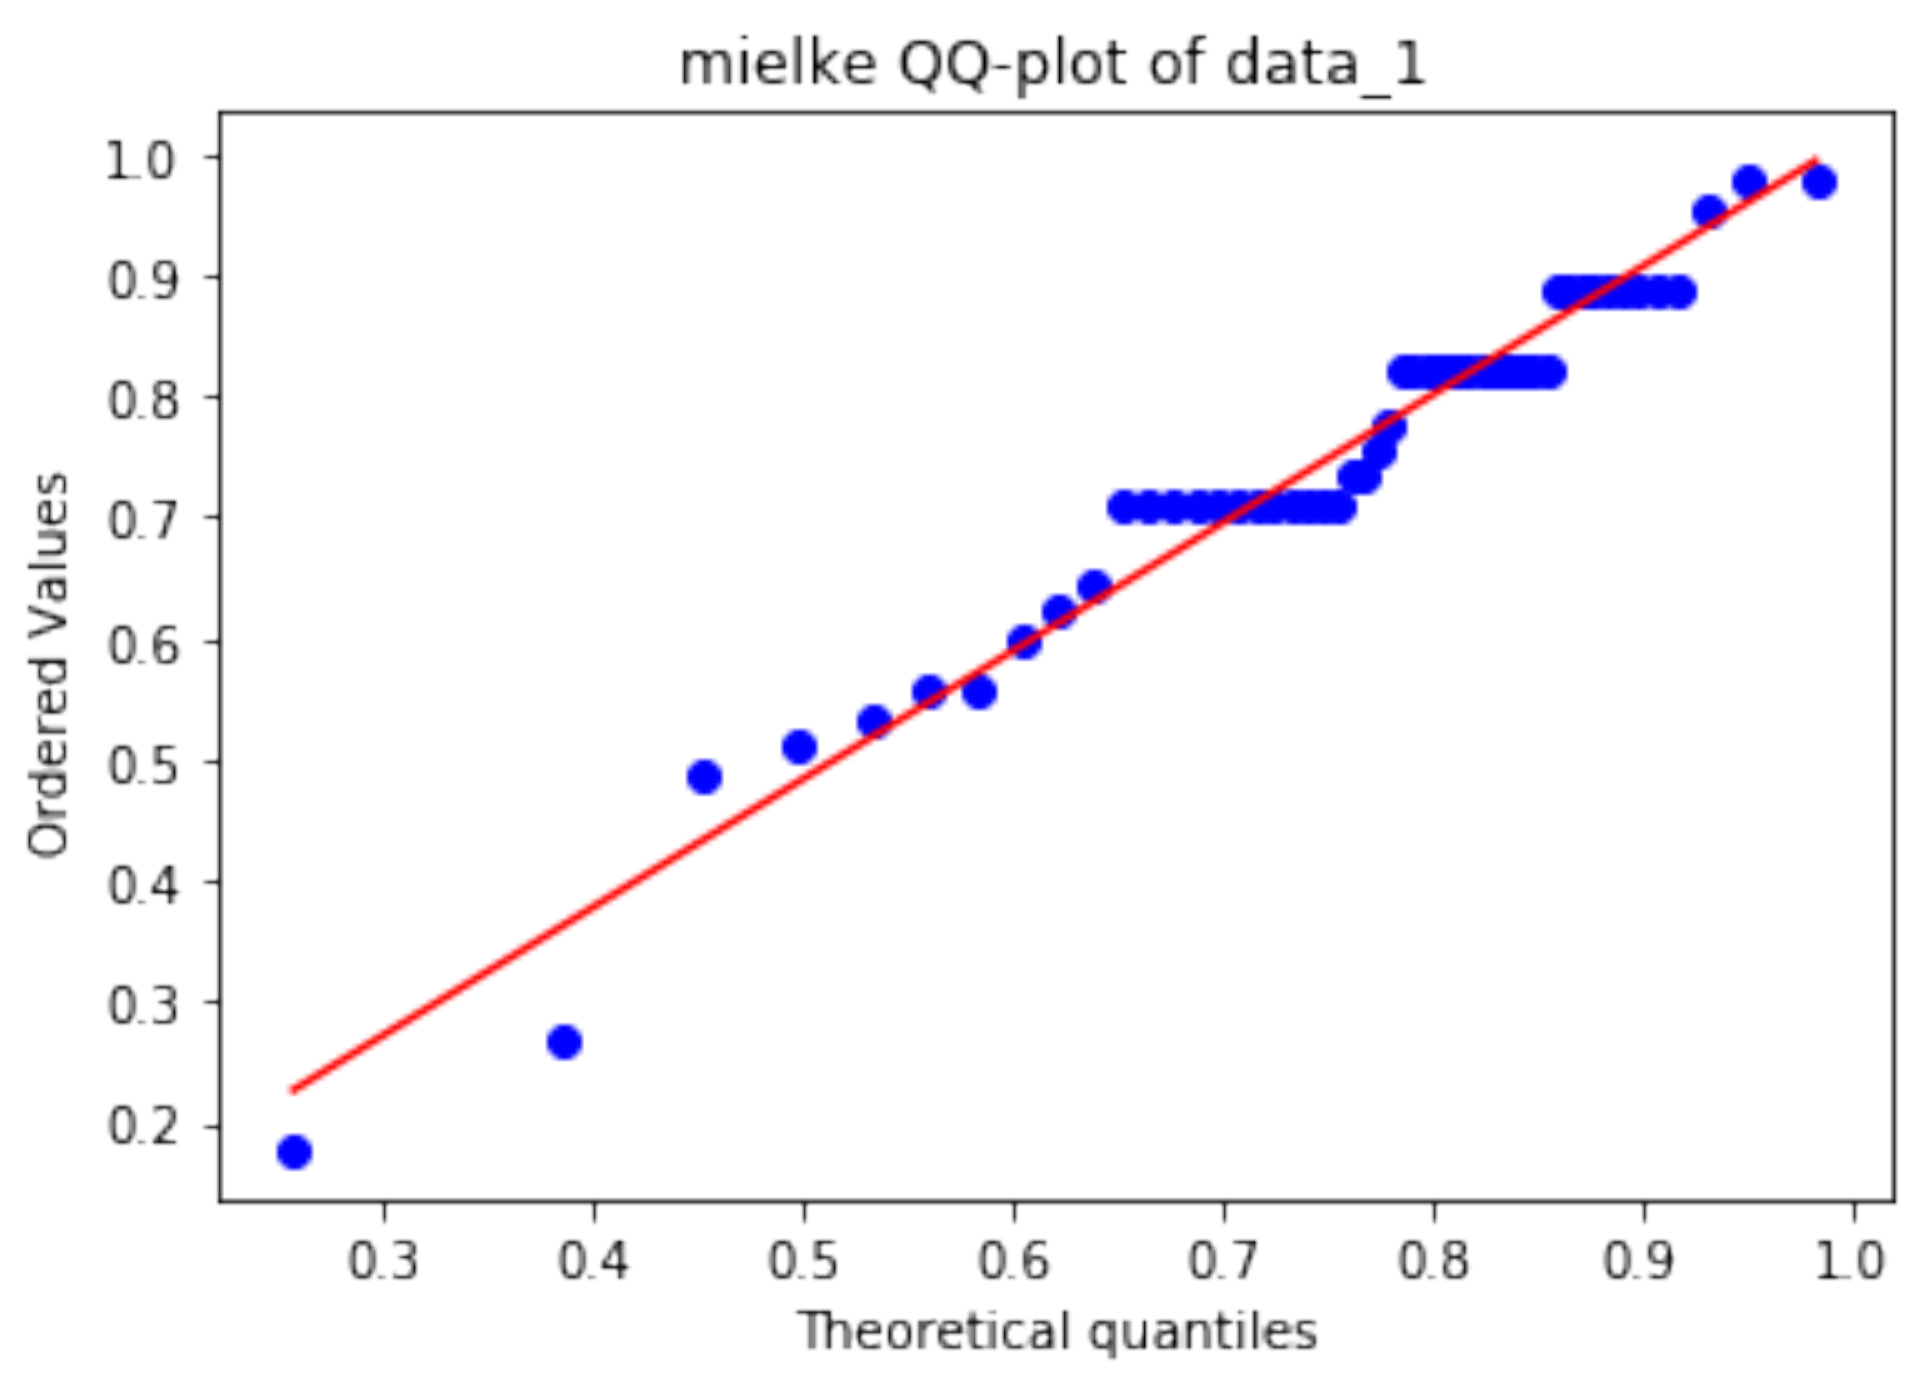
3.1. Kolomogorov–Smirnov Goodness of Fit Test
- The data which fit a specified distribution;
- The data which do not fit the specified distribution;
- Test Statistic :
3.2. Distribution Fitting
| Algorithm 2: Finding the best fit for the histogram |
 |
4. Experimentation and Results
- BCG Strains Dataset: Finding a cure for COVID-19 will be a long-term and difficult process, and research into new vaccines can take several years. Researchers have suggested that an old vaccine BCG can cause a boost to the immune system, and this could be the reason for the relatively low COVID-19-attributed death rates in some countries. A number of clinical trials with BCG have started already, but the results will not be available for many months. The studies of the BCG vaccine relationship to COVID-19 have used data from the BCG World Atlas project, which started nearly a decade ago. The Atlas is neither perfect nor complete, but it is the only available database of this kind. There are various BCG Strains and according to some studies they are not the same and the impact that the vaccine causes might vary. There is a recent hypothesis that COVID-19 mortality may depend on which strain has been used in a given country. The BCG Strains Dataset that we used for this study is a .csv file consisting of 46 rows and 52 columns.
- NNDSS Dataset: To protect Americans from serious diseases, the National Notifiable Diseases Surveillance System (NNDSS) helps public health control and prevent about 120 diseases. These diseases are important to monitor nationwide and include infectious diseases such as Zika and foodborne outbreaks such as E. coli. CDC receives these data through NNDSS which also supports the COVID-19 response. The NNDSS Dataset that we used for this study is a .csv file consisting of 1961 rows and 31 columns and provisional cases of notifiable diseases are displayed for the United States, U.S. territories, and Non-U.S. residents.
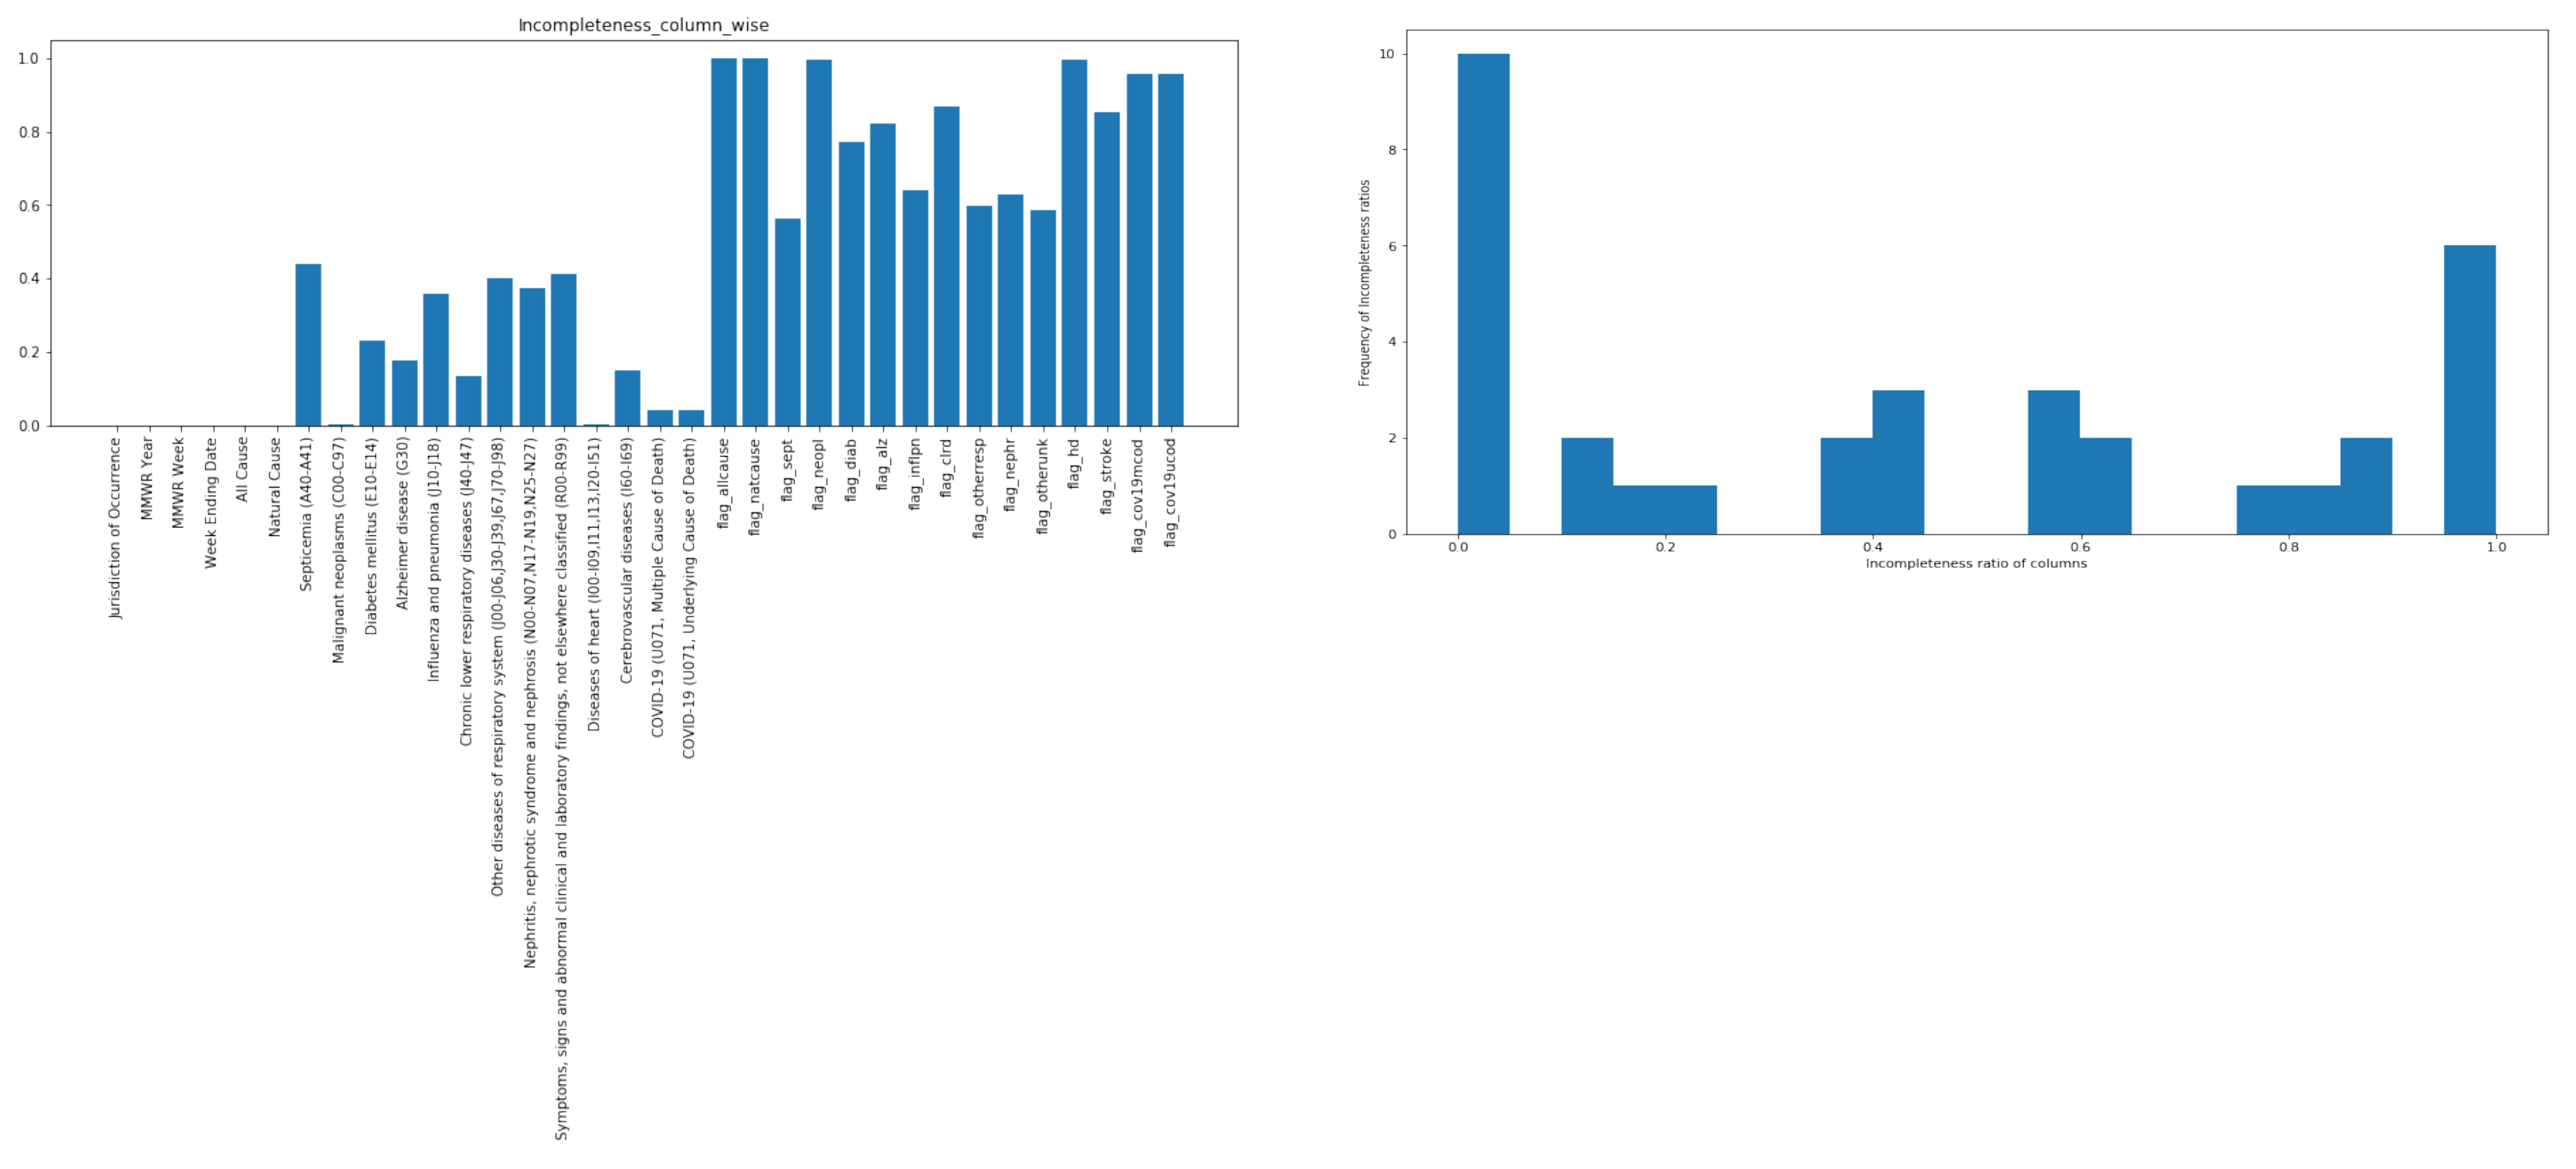
- Provisional Counts of Death Dataset: This dataset is also taken from CDC and is a .csv file consists of 4318 rows and 34 columns. The number of deaths reported in this table is the total number of deaths received and coded as of the date of analysis. Data for 2019 and 2020 are provisional and may be incomplete because of the lag in time between when the death occurred and when the death certificate is submitted to National Center for Health Statistics (NCHS).
4.1. BCG Strains Dataset
4.2. NNDSS Dataset
4.3. Provisional Counts of Death Dataset
5. Mixture Density Network
6. Discussion
6.1. Comparison with Other Related Work
6.2. Limitations
7. Conclusions
- development of new algorithms that use probability distributions to analyze data incompleteness.
- analysis of deep learning networks to measure data incompleteness.
Author Contributions
Funding
Institutional Review Board Statement
Informed Consent Statement
Data Availability Statement
Conflicts of Interest
References
- Nasir, A.; Gurupur, V.; Liu, X. A new paradigm to analyze data completeness of patient data. Appl. Clin. Inform. 2016, 7, 745–764. [Google Scholar] [CrossRef] [PubMed] [Green Version]
- Simon, H.A. The architecture of complexity. In Facets of Systems Science; Springer: Berlin/Heidelberg, Germany, 1991; pp. 457–476. [Google Scholar]
- Calvert, M.; Thwaites, R.; Kyte, D.; Devlin, N. Putting patient-reported outcomes on the ‘Big Data Road Map’. J. R. Soc. Med. 2015, 108, 299–303. [Google Scholar] [CrossRef] [PubMed] [Green Version]
- Estiri, H.; Klann, J.G.; Weiler, S.R.; Alema-Mensah, E.; Joseph Applegate, R.; Lozinski, G.; Patibandla, N.; Wei, K.; Adams, W.G.; Natter, M.D.; et al. A federated EHR network data completeness tracking system. J. Am. Med. Inform. Assoc. 2019, 26, 637–645. [Google Scholar] [CrossRef] [Green Version]
- Gurupur, V.P.; Shelleh, M. Machine Learning Analysis for Data Incompleteness (MADI): Analyzing the Data Completeness of Patient Records Using a Random Variable Approach to Predict the Incompleteness of Electronic Health Records. IEEE Access 2021, 9, 95994–96001. [Google Scholar] [CrossRef]
- Hempelmann, C.F.; Sakoglu, U.; Gurupur, V.P.; Jampana, S. An entropy-based evaluation method for knowledge bases of medical information systems. Expert Syst. Appl. 2016, 46, 262–273. [Google Scholar] [CrossRef]
- Cresswell, K.M.; Blandford, A.; Sheikh, A. Drawing on human factors engineering to evaluate the effectiveness of health information technology. J. R. Soc. Med. 2017, 110, 309–315. [Google Scholar] [CrossRef]
- Bar-Dayan, Y.; Saed, H.; Boaz, M.; Misch, Y.; Shahar, T.; Husiascky, I.; Blumenfeld, O. Using electronic health records to save money. J. Am. Med. Inform. Assoc. 2013, 20, e17–e20. [Google Scholar] [CrossRef] [Green Version]
- Sykes, T.A.; Venkatesh, V.; Rai, A. Explaining physicians’ use of EMR systems and performance in the shakedown phase. J. Am. Med. Inform. Assoc. 2011, 18, 125–130. [Google Scholar] [CrossRef] [Green Version]
- Lanham, H.J.; Leykum, L.K.; McDaniel, R.R., Jr. Same organization, same electronic health records (EHRs) system, different use: Exploring the linkage between practice member communication patterns and EHR use patterns in an ambulatory care setting. J. Am. Med. Inform. Assoc. 2012, 19, 382–391. [Google Scholar] [CrossRef] [Green Version]
- Lanham, H.J.; Sittig, D.F.; Leykum, L.K.; Parchman, M.L.; Pugh, J.A.; McDaniel, R.R. Understanding differences in electronic health record (EHR) use: Linking individual physicians’ perceptions of uncertainty and EHR use patterns in ambulatory care. J. Am. Med. Inform. Assoc. 2014, 21, 73–81. [Google Scholar] [CrossRef]
- Radenkovic, D.; Keogh, S.B.; Maruthappu, M. Data science in modern evidence-based medicine. J. R. Soc. Med. 2019, 112, 493–494. [Google Scholar] [CrossRef] [PubMed]
- Reddy, S.; Fox, J.; Purohit, M.P. Artificial intelligence-enabled healthcare delivery. J. R. Soc. Med. 2019, 112, 22–28. [Google Scholar] [CrossRef] [PubMed]
- Madden, J.M.; Lakoma, M.D.; Rusinak, D.; Lu, C.Y.; Soumerai, S.B. Missing clinical and behavioral health data in a large electronic health record (EHR) system. J. Am. Med. Inform. Assoc. 2016, 23, 1143–1149. [Google Scholar] [CrossRef] [PubMed] [Green Version]
- Matheny, M.E.; Miller, R.A.; Ikizler, T.A.; Waitman, L.R.; Denny, J.C.; Schildcrout, J.S.; Dittus, R.S.; Peterson, J.F. Development of inpatient risk stratification models of acute kidney injury for use in electronic health records. Med. Decis. Mak. 2010, 30, 639–650. [Google Scholar] [CrossRef] [Green Version]
- Sinnott, J.A.; Dai, W.; Liao, K.P.; Shaw, S.Y.; Ananthakrishnan, A.N.; Gainer, V.S.; Karlson, E.W.; Churchill, S.; Szolovits, P.; Murphy, S.; et al. Improving the power of genetic association tests with imperfect phenotype derived from electronic medical records. Hum. Genet. 2014, 133, 1369–1382. [Google Scholar] [CrossRef] [Green Version]
- Virtanen, P.; Gommers, R.; Oliphant, T.E.; Haberland, M.; Reddy, T.; Cournapeau, D.; Burovski, E.; Peterson, P.; Weckesser, W.; Bright, J.; et al. SciPy 1.0: Fundamental algorithms for scientific computing in Python. Nat. Methods 2020, 17, 261–272. [Google Scholar] [CrossRef] [Green Version]
- Nunez-Iglesias, J.; Van Der Walt, S.; Dashnow, H. Elegant SciPy: The Art of Scientific Python; O’Reilly Media, Inc.: Sebastopol, CA, USA, 2017. [Google Scholar]
- Grzegorzewski, P. The Kolmogorov–Smirnov goodness-of-fit test for interval-valued data. In The Mathematics of the Uncertain; Springer: Berlin/Heidelberg, Germany, 2018; pp. 615–627. [Google Scholar]
- McKinney, W. pandas: A foundational Python library for data analysis and statistics. Python High Perform. Sci. Comput. 2011, 14, 1–9. [Google Scholar]
- Available online: https://www.statisticshowto.com/kolmogorov-smirnov-test/ (accessed on 15 September 2022).
- Darling, D.A. The kolmogorov-smirnov, cramer-von mises tests. Ann. Math. Stat. 1957, 28, 823–838. [Google Scholar] [CrossRef]
- Justel, A.; Peña, D.; Zamar, R. A multivariate Kolmogorov-Smirnov test of goodness of fit. Stat. Probab. Lett. 1997, 35, 251–259. [Google Scholar] [CrossRef] [Green Version]
- Castro, R. The Empirical Distribution Function and the Histogram; Lecture Notes, 2WS17-Advanced Statistics; Department of Mathematics, Eindhoven University of Technology: Eindhoven, The Netherlands, 2015; Volume 4. [Google Scholar]
- Park, K.I.; Park, M. Fundamentals of Probability and Stochastic Processes with Applications to Communications; Springer: Berlin/Heidelberg, Germany, 2018. [Google Scholar]
- Available online: https://www.itl.nist.gov/div898/handbook/eda/section3/eda35g.htm (accessed on 15 September 2022).
- Okeniyi, J.O.; Okeniyi, E.T.; Atayero, A. Implementation of data normality testing as a Microsoft Excel® library function by Kolmogorov–Smirnov goodness-of-fit statistics. Proc. Vis. 2020, 2561–2578. [Google Scholar]
- Arsalan. Available online: https://medium.com/@amirarsalan.rajabi/distribution-fitting-with-python-scipy-bb70a42c0aed (accessed on 15 September 2022).
- Wilk, M.B.; Gnanadesikan, R. Probability plotting methods for the analysis for the analysis of data. Biometrika 1968, 55, 1–17. [Google Scholar] [CrossRef] [PubMed]
- Zychlinski, S. Available online: https://blog.taboola.com/predicting-probability-distributions/ (accessed on 15 September 2022).
- Bishop, C.M. Mixture Density Networks. 1994. Available online: https://publications.aston.ac.uk/373/1/NCRG_94_004.pdf (accessed on 15 September 2022).
- Hyndman, R.J.; Yao, Q. Nonparametric estimation and symmetry tests for conditional density functions. J. NonParametr. Stat. 2002, 14, 259–278. [Google Scholar] [CrossRef]
- Holden, C.; Thiamwong, L.; Martin, D.; Mathieson, K.M.; Nehrenz, G.M. The electronic health record system and hospital length of stay in patients admitted with hip fracture. Am. J. Res. Nurs. 2015, 1, 1–5. [Google Scholar]
- Yu, B.; He, Z.; Xing, A.; Lustria, M.L.A. An informatics framework to assess consumer health language complexity differences: Proof-of-concept study. J. Med. Internet Res. 2020, 22, e16795. [Google Scholar] [CrossRef] [PubMed]
- Penny, W.; Frost, D. Neural networks in clinical medicine. Med. Decis. Mak. 1996, 16, 386–398. [Google Scholar] [CrossRef] [PubMed] [Green Version]


| Distribution | Statistics | p-Value |
|---|---|---|
| mielke | 0.138 | 0.246 |
| burr | 0.139 | 0.244 |
| genlogistic | 0.139 | 0.243 |
| Distribution | Statistics | p-Value |
|---|---|---|
| logistic | 0.168 | 0.306 |
| hypsecant | 0.184 | 0.214 |
| nct | 0.185 | 0.208 |
| Distribution | Statistics | p-Value |
|---|---|---|
| beta | 0.120 | 0.691 |
| logistic | 0.137 | 0.505 |
| hypsecant | 0.141 | 0.463 |
| Variables | Values |
|---|---|
| Learning rate | 0.0003 |
| Number of Layers | 3 |
| Number of Epochs | 500 |
| Number of Output Nodes | 2 |
Publisher’s Note: MDPI stays neutral with regard to jurisdictional claims in published maps and institutional affiliations. |
© 2022 by the authors. Licensee MDPI, Basel, Switzerland. This article is an open access article distributed under the terms and conditions of the Creative Commons Attribution (CC BY) license (https://creativecommons.org/licenses/by/4.0/).
Share and Cite
Gurupur, V.P.; Abedin, P.; Hooshmand, S.; Shelleh, M. Analyzing the Data Completeness of Patients’ Records Using a Random Variable Approach to Predict the Incompleteness of Electronic Health Records. Appl. Sci. 2022, 12, 10746. https://doi.org/10.3390/app122110746
Gurupur VP, Abedin P, Hooshmand S, Shelleh M. Analyzing the Data Completeness of Patients’ Records Using a Random Variable Approach to Predict the Incompleteness of Electronic Health Records. Applied Sciences. 2022; 12(21):10746. https://doi.org/10.3390/app122110746
Chicago/Turabian StyleGurupur, Varadraj P., Paniz Abedin, Sahar Hooshmand, and Muhammed Shelleh. 2022. "Analyzing the Data Completeness of Patients’ Records Using a Random Variable Approach to Predict the Incompleteness of Electronic Health Records" Applied Sciences 12, no. 21: 10746. https://doi.org/10.3390/app122110746
APA StyleGurupur, V. P., Abedin, P., Hooshmand, S., & Shelleh, M. (2022). Analyzing the Data Completeness of Patients’ Records Using a Random Variable Approach to Predict the Incompleteness of Electronic Health Records. Applied Sciences, 12(21), 10746. https://doi.org/10.3390/app122110746