Figure 1.
Layout of sound measuring points in HEAD Acoustics artificial head.
Figure 1.
Layout of sound measuring points in HEAD Acoustics artificial head.
Figure 2.
Distribution of subjective evaluation results of sound quality in the sample vehicle when accelerating.
Figure 2.
Distribution of subjective evaluation results of sound quality in the sample vehicle when accelerating.
Figure 3.
FFT spectrum of sound in the vehicle of the sample vehicle during accelerated driving.
Figure 3.
FFT spectrum of sound in the vehicle of the sample vehicle during accelerated driving.
Figure 4.
Comparison of the sound spectrum in the vehicle under accelerated driving conditions.
Figure 4.
Comparison of the sound spectrum in the vehicle under accelerated driving conditions.
Figure 5.
Acoustic time-domain signal in an FV accelerating.
Figure 5.
Acoustic time-domain signal in an FV accelerating.
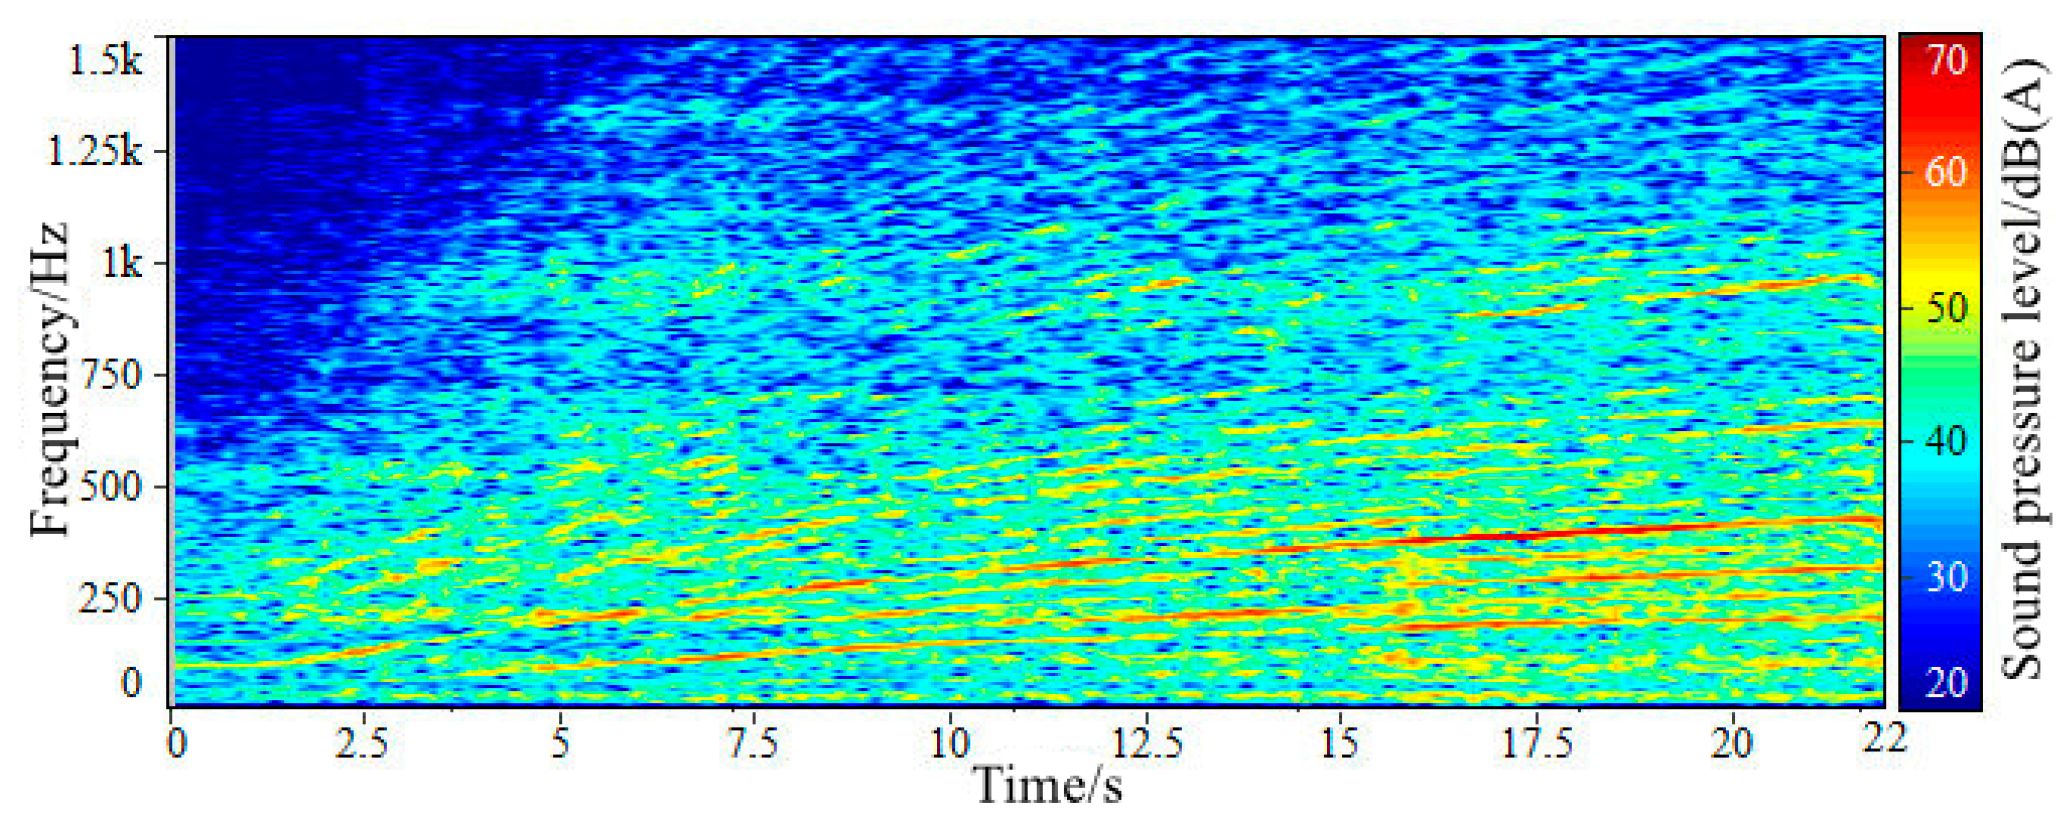
Figure 6.
Sound spectrum inside an FV accelerating.
Figure 6.
Sound spectrum inside an FV accelerating.
Figure 7.
Synthesized time-domain signal of in-vehicle sound when accelerating.
Figure 7.
Synthesized time-domain signal of in-vehicle sound when accelerating.
Figure 8.
Synthesized sound spectrum of accelerating vehicle.
Figure 8.
Synthesized sound spectrum of accelerating vehicle.
Figure 9.
Design plan of in-vehicle sound at different speeds.
Figure 9.
Design plan of in-vehicle sound at different speeds.
Figure 10.
Distribution of subjective evaluation results of the plan.
Figure 10.
Distribution of subjective evaluation results of the plan.
Figure 11.
Comparison of sound and noise results in the FV under constant speed driving conditions.
Figure 11.
Comparison of sound and noise results in the FV under constant speed driving conditions.
Figure 12.
The variation curve of the difference between the engine order sound and the background sound of the FV driving at a constant speed.
Figure 12.
The variation curve of the difference between the engine order sound and the background sound of the FV driving at a constant speed.
Figure 13.
Comparison of the results of the total sound value of the EV driving at a constant speed.
Figure 13.
Comparison of the results of the total sound value of the EV driving at a constant speed.
Figure 14.
Total value of sound inside EV and sound amplitude target of ASGS.
Figure 14.
Total value of sound inside EV and sound amplitude target of ASGS.
Figure 15.
Comparison of the sound spectrum in the vehicle before and after the extraction of engine order components.
Figure 15.
Comparison of the sound spectrum in the vehicle before and after the extraction of engine order components.
Figure 16.
Summary of variation trend of engine order sound amplitude in all working conditions.
Figure 16.
Summary of variation trend of engine order sound amplitude in all working conditions.
Figure 17.
The trend of the order sound amplitude of the in-vehicle engine varies with the accelerator pedal opening.
Figure 17.
The trend of the order sound amplitude of the in-vehicle engine varies with the accelerator pedal opening.
Figure 18.
Trend of in-vehicle engine order sound amplitude changes with engine output power load ratio.
Figure 18.
Trend of in-vehicle engine order sound amplitude changes with engine output power load ratio.
Figure 19.
Change curve of in-vehicle engine order sound amplitude gain with engine output power load ratio.
Figure 19.
Change curve of in-vehicle engine order sound amplitude gain with engine output power load ratio.
Figure 20.
Time history curve of test signal at 60% accelerator pedal opening.
Figure 20.
Time history curve of test signal at 60% accelerator pedal opening.
Figure 21.
The curve of motor output power with motor speed under different accelerator pedal openings.
Figure 21.
The curve of motor output power with motor speed under different accelerator pedal openings.
Figure 22.
The curve of the motor output power with the accelerator pedal opening under different motor speeds.
Figure 22.
The curve of the motor output power with the accelerator pedal opening under different motor speeds.
Figure 23.
Control curve of sound amplitude gain with accelerator pedal opening.
Figure 23.
Control curve of sound amplitude gain with accelerator pedal opening.
Figure 24.
Control curve of sound amplitude gain with vehicle speed.
Figure 24.
Control curve of sound amplitude gain with vehicle speed.
Figure 25.
Schematic diagram of active sound control system in the vehicle.
Figure 25.
Schematic diagram of active sound control system in the vehicle.
Figure 26.
Physical picture of active sound controller in vehicle.
Figure 26.
Physical picture of active sound controller in vehicle.
Figure 27.
Flowchart of ASGS program.
Figure 27.
Flowchart of ASGS program.
Figure 28.
Layout of mid-low frequency speakers.
Figure 28.
Layout of mid-low frequency speakers.
Figure 29.
Layout of full frequency speakers.
Figure 29.
Layout of full frequency speakers.
Figure 30.
Layout of high-frequency speakers.
Figure 30.
Layout of high-frequency speakers.
Figure 31.
Schematic diagram of the in-vehicle ASGS based on the original audio system speaker of an EV.
Figure 31.
Schematic diagram of the in-vehicle ASGS based on the original audio system speaker of an EV.
Figure 32.
Time-domain signal of high-fidelity speaker sound test.
Figure 32.
Time-domain signal of high-fidelity speaker sound test.
Figure 33.
FFT spectrum of high-fidelity speaker test.
Figure 33.
FFT spectrum of high-fidelity speaker test.
Figure 34.
FFT spectrum of the original white noise signal.
Figure 34.
FFT spectrum of the original white noise signal.
Figure 35.
Field in-vehicle test attempt.
Figure 35.
Field in-vehicle test attempt.
Figure 36.
Comparison of the calculation results of sound pressure level in the vehicle driving at a constant speed.
Figure 36.
Comparison of the calculation results of sound pressure level in the vehicle driving at a constant speed.
Figure 37.
Comparison of the calculation results of the sound loudness in the vehicle driving at a constant speed.
Figure 37.
Comparison of the calculation results of the sound loudness in the vehicle driving at a constant speed.
Figure 38.
Comparison of the calculation results of sound sharpness in the vehicle driving at a constant speed.
Figure 38.
Comparison of the calculation results of sound sharpness in the vehicle driving at a constant speed.
Figure 39.
Comparison of the calculation results of the sound roughness in the vehicle driving at a constant speed.
Figure 39.
Comparison of the calculation results of the sound roughness in the vehicle driving at a constant speed.
Figure 40.
Sound quality distribution of three sample vehicles under uniform driving conditions.
Figure 40.
Sound quality distribution of three sample vehicles under uniform driving conditions.
Table 1.
The abbreviations.
Table 1.
The abbreviations.
| Abbreviations | Full Name |
|---|
| EV | Electric Vehicle |
| FV | Fuel Vehicle |
| ASGS | Active Sound Generation System |
| PEV | Pure Electric Vehicle |
Table 2.
Subjective evaluation team personnel information.
Table 2.
Subjective evaluation team personnel information.
| Evaluator | Gender | Age | Professional | Working |
|---|
| A | male | 35 | NVH subjective evaluation | 11 |
| B | male | 30 | NVH subjective evaluation | 6 |
| C | Female | 34 | Sound quality research | 9 |
| D | male | 32 | NVH subjective evaluation | 7 |
| E | male | 34 | Sound quality research | 10 |
| F | male | 40 | Performance development | 14 |
| G | male | 38 | Vehicle NVH performance development | 11 |
| H | male | 35 | NVH subjective evaluation | 9 |
Table 3.
Grade division of subjective evaluation of sound quality perception.
Table 3.
Grade division of subjective evaluation of sound quality perception.
| Evaluation Score | Subjective Perception | Satisfaction |
|---|
| 1 | Can’t accept | No sound quality |
| 2 |
| 3 | Very poor |
| 4 |
| 5 | Needs improvement | Sound quality, but still needs improvement |
| 6 | Acceptable | The sound quality is basically satisfactory |
| 7 | Good |
| 8 | Pretty good | Obvious sound quality |
| 9 | Very good | Very strong sound quality |
| 10 | Great |
Table 4.
Basic information of test sample vehicle.
Table 4.
Basic information of test sample vehicle.
| Sample Number | Vehicle Type | Number of Engine Cylinders | Capacity |
|---|
| 1# | Class C SUV | V8 naturally aspirated | 5.7 L |
| 2# | Class C SUV | V8 naturally aspirated | 5.0 L |
| 3# | Class B sedan | I4 turbo | 2.0 L |
| 4# | Class A MPV | I4 turbo | 1.5 L |
| 5# | Class C sedan | V6 naturally aspirated | 3.0 L |
| 6# | Class C sedan | I4 turbo | 2.0 L |
| 7# | Class A electric SUV | — | — |
| 8# | Class C sedan | I4 turbo | 2.0 L |
| 9# | Class B sedan | I4 turbo | 2.0 L |
| 10# | Class B SUV | I4 turbo | 2.0 L |
| 11# | Class C sedan | I4 turbo | 2.0 L |
| 12# | Class B SUV | V6 naturally aspirated | 3.0 L |
| 13# | Class A coupe | I4 turbo | 2.0 L |
| 14# | Class A EV | — | — |
Table 5.
Evaluation results of the sound samples in the accelerating vehicle.
Table 5.
Evaluation results of the sound samples in the accelerating vehicle.
| Sample Number | Subjective Evaluation Score of Comfort | Subjective Evaluation Score of Dynamic |
|---|
| 1# | 7.5 | 8.0 |
| 2# | 8.2 | 7.0 |
| 3# | 6.0 | 6.2 |
| 4# | 7.0 | 7.0 |
| 5# | 8.5 | 7.0 |
| 6# | 7.4 | 7.7 |
| 7# | 5.8 | 5.8 |
| 8# | 7.5 | 7.5 |
| 9# | 7.2 | 6.8 |
| 10# | 7.0 | 6.9 |
| 11# | 8.0 | 6.8 |
| 12# | 7.0 | 8.5 |
| 13# | 7.0 | 7.2 |
| 14# | 6.3 | 5.8 |
Table 6.
Comparison of key parameters and indicators of common window functions.
Table 6.
Comparison of key parameters and indicators of common window functions.
| Window Function | Main Lobe Width (rad) | Side Lobe Peak (dB) | Stopband Minimum Attenuation (dB) |
|---|
| Rectangular window | 4π/N | −13 | 21 |
| Hanning window | 8π/N | −31 | 44 |
| Hamming window | 8π/N | −41 | 53 |
| Blackman window | 12π/N | −57 | 74 |
| Kaiser window | Adjustable | Adjustable | Adjustable |
Table 7.
Eight typical Kaiser window functions with values.
Table 7.
Eight typical Kaiser window functions with values.
| Main Lobe Width (rad) | Bandpass Maximum Ripple | Stopband Minimum Attenuation (dB) |
|---|
| 2.120 | 3.00π/N | ±0.27 | 30 |
| 2.384 | 4.46π/N | ±0.0864 | 40 |
| 4.538 | 5.86π/N | ±0.0274 | 50 |
| 5.568 | 7.24π/N | ±0.00868 | 60 |
| 6.764 | 8.64π/N | ±0.00275 | 70 |
| 7.865 | 10.0π/N | ±0.000868 | 80 |
| 8.960 | 11.4π/N | ±0.000275 | 90 |
| 10.056 | 10.8π/N | ±0.000087 | 100 |
Table 8.
Test results of in-vehicle sound of the target FV at constant speed.
Table 8.
Test results of in-vehicle sound of the target FV at constant speed.
| Engine Speed (rpm) | 1000 | 2000 | 3000 | 4000 | 5000 | 6000 |
|---|
| Corresponding speed (km/h) | 13.0 | 36.5 | 57.9 | 78.9 | 99.6 | 121.0 |
| Total sound in vehicle/dB (A) | 49.6 | 57.1 | 59.7 | 64.3 | 68.6 | 70.0 |
| Engine order sound in vehicle/dB (A) | 42.7 | 50.9 | 54.1 | 59.4 | 64.4 | 66.4 |
| Background sound in vehicle/dB (A) | 48.6 | 55.9 | 58.3 | 62.6 | 66.5 | 67.5 |
| Difference between engine order sound and background sound/dB (A) | −5.9 | −5.0 | −4.2 | −3.2 | −2.1 | −1.1 |
Table 9.
Test results of in-vehicle sound of EVs driving at a constant speed.
Table 9.
Test results of in-vehicle sound of EVs driving at a constant speed.
| Virtual Engine Speed (rpm) | 1000 | 2000 | 3000 | 4000 | 5000 | 6000 |
|---|
| Speed (km/h) | 5.7 | 28.6 | 51.4 | 74.3 | 97.1 | 120.0 |
| Total sound in vehicle/dB (A) | 44.0 | 55.6 | 61.5 | 62.6 | 65.2 | 68.0 |
Table 10.
The total sound value of the EV driving at a constant speed and the target setting of the sound amplitude of the ASGS.
Table 10.
The total sound value of the EV driving at a constant speed and the target setting of the sound amplitude of the ASGS.
| Virtual Engine Speed (rpm) | 1000 | 2000 | 3000 | 4000 | 5000 | 6000 |
|---|
| Speed (km/h) | 5.7 | 28.6 | 51.4 | 74.3 | 97.1 | 120.0 |
| Total sound target in vehicle/dB (A) | 45.0 | 56.8 | 62.9 | 64.3 | 67.3 | 70.5 |
| Target of ASGS/dB (A) | 38.1 | 50.6 | 57.3 | 59.4 | 63.1 | 66.9 |
| Original total sound in vehicle/dB (A) | 44.0 | 55.6 | 61.5 | 62.6 | 65.2 | 68.0 |
Table 11.
Calculation of sound amplitude gain coefficient.
Table 11.
Calculation of sound amplitude gain coefficient.
| Engine Speed (rpm) | | |
|---|
| 3000 | 8.1 | 8.5 |
| 4000 | 8.5 |
| 5000 | 8.8 |
| 6000 | 8.8 |
Table 12.
Calculation results of sound pressure level in the vehicle traveling at a constant speed.
Table 12.
Calculation results of sound pressure level in the vehicle traveling at a constant speed.
| Virtual Engine Speed (rpm) | 1000 | 2000 | 3000 | 4000 | 5000 | 6000 |
|---|
| Speed (km/h) | 5.7 | 28.6 | 51.4 | 74.3 | 97.1 | 120.0 |
| System works normally/dB (A) | 44.9 | 58.3 | 63.4 | 63.5 | 66.8 | 70.3 |
| System not working/dB (A) | 44.0 | 55.6 | 61.5 | 62.6 | 65.2 | 68.0 |
| Total sound target in vehicle/dB (A) | 45.0 | 56.8 | 62.9 | 64.3 | 67.3 | 70.5 |
Table 13.
Calculation results of sound loudness in the vehicle traveling at a constant speed.
Table 13.
Calculation results of sound loudness in the vehicle traveling at a constant speed.
| Virtual Engine Speed (rpm) | 1000 | 2000 | 3000 | 4000 | 5000 | 6000 |
|---|
| Speed (km/h) | 5.7 | 28.6 | 51.4 | 74.3 | 97.1 | 120.0 |
| System works normally/sone | 4.3 | 18.3 | 22.8 | 24.6 | 26.6 | 28.5 |
| System not working/sone | 4.2 | 10.0 | 13.2 | 15.3 | 18.7 | 21.1 |
Table 14.
Calculation results of sound sharpness in the vehicle traveling at a constant speed.
Table 14.
Calculation results of sound sharpness in the vehicle traveling at a constant speed.
| Virtual Engine Speed (rpm) | 1000 | 2000 | 3000 | 4000 | 5000 | 6000 |
|---|
| Speed (km/h) | 5.7 | 28.6 | 51.4 | 74.3 | 97.1 | 120.0 |
| System works normally/acum | 0.67 | 0.76 | 0.83 | 1.02 | 1.05 | 1.13 |
| System not working/acum | 0.68 | 1.28 | 1.13 | 1.09 | 1.17 | 1.32 |
Table 15.
Calculation results of sound roughness in the vehicle traveling at a constant speed.
Table 15.
Calculation results of sound roughness in the vehicle traveling at a constant speed.
| Virtual Engine Speed (rpm) | 1000 | 2000 | 3000 | 4000 | 5000 | 6000 |
|---|
| Speed (km/h) | 5.7 | 28.6 | 51.4 | 74.3 | 97.1 | 120.0 |
| System works normally/asper | 0.54 | 0.68 | 1.05 | 1.55 | 1.83 | 1.72 |
| System not working/asper | 0.52 | 0.50 | 1.00 | 1.23 | 2.09 | 1.86 |
Table 16.
Subjective evaluation score record of real vehicle at constant speed.
Table 16.
Subjective evaluation score record of real vehicle at constant speed.
| Evaluate Sample Vehicle and Condition | Subjective Evaluation Score of Comfort | Subjective Evaluation Score of Dynamic |
|---|
| PEV original state | 6.0 | 6.0 |
| PEV, ASGS work normally | 6.5 | 6.2 |
| A coupe-type FV | 7.5 | 6.8 |


