

Robust Simulation of Cyber-Physical Systems for Environmental Monitoring on Construction Sites


Abstract
:1. Introduction
2. Literature Review
2.1. Applicability of CPS
2.2. System Robustness
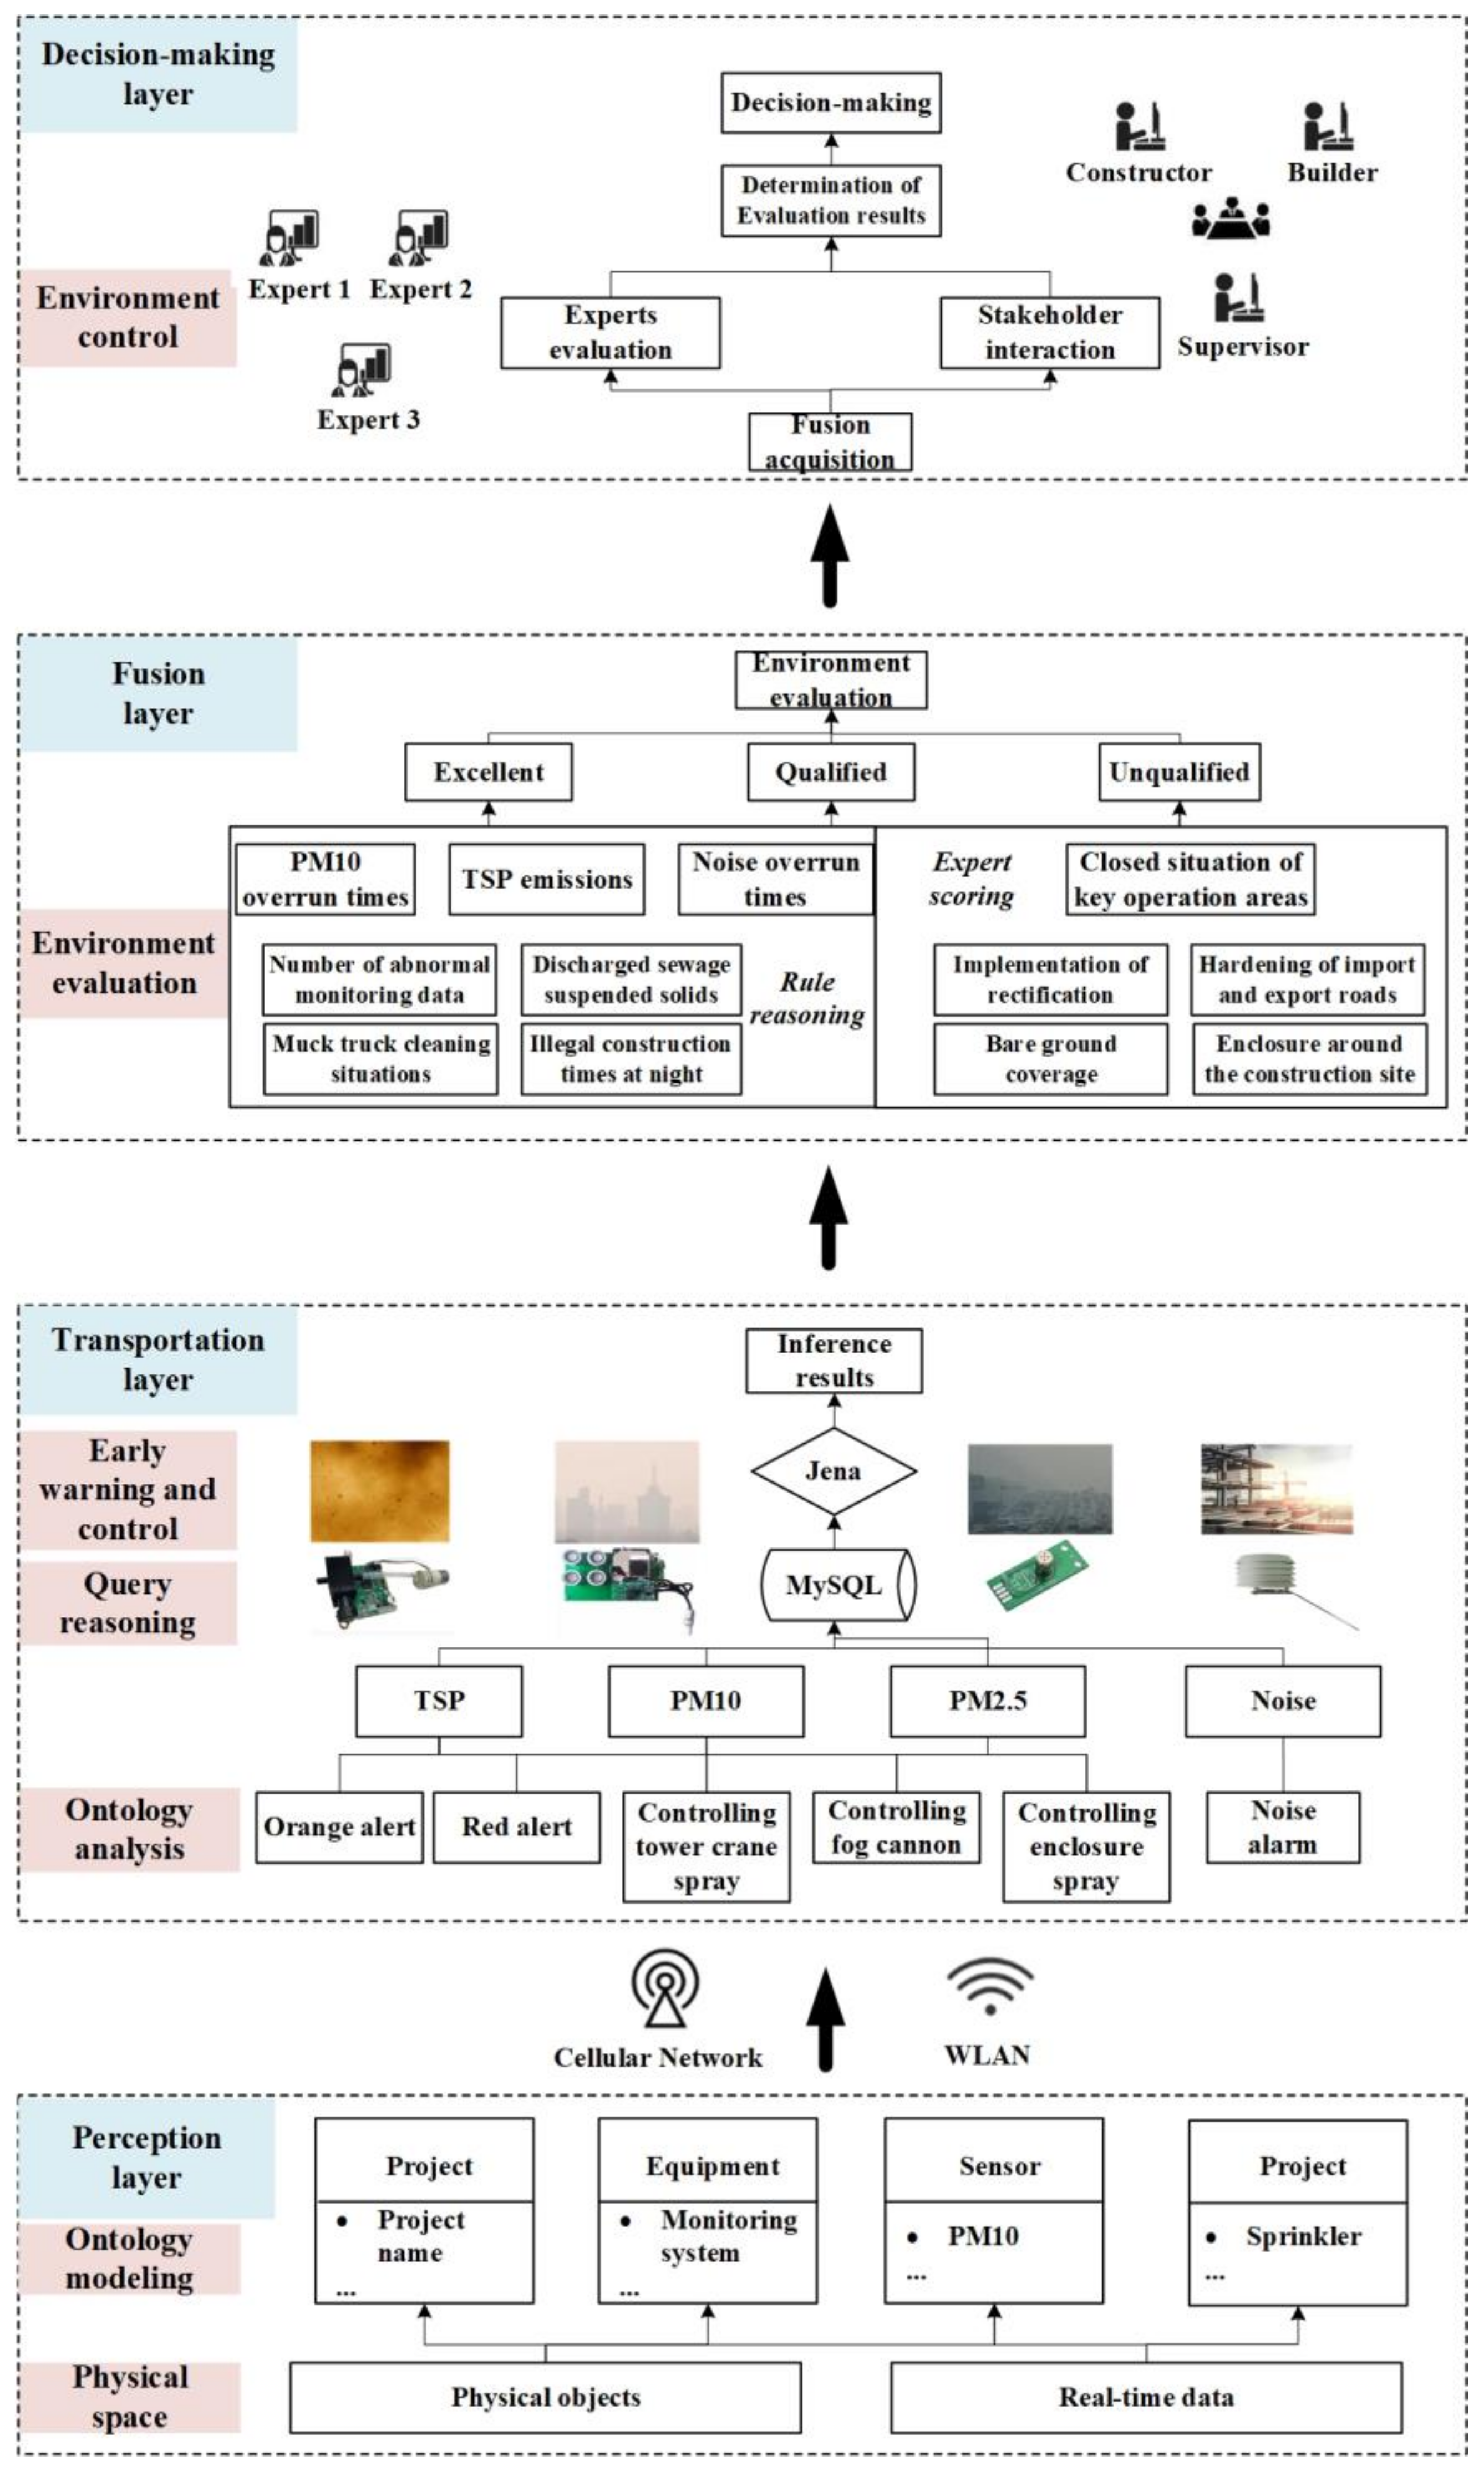
3. Research Framework
4. E-CPS Modeling and Uncertainty-Factor Identification
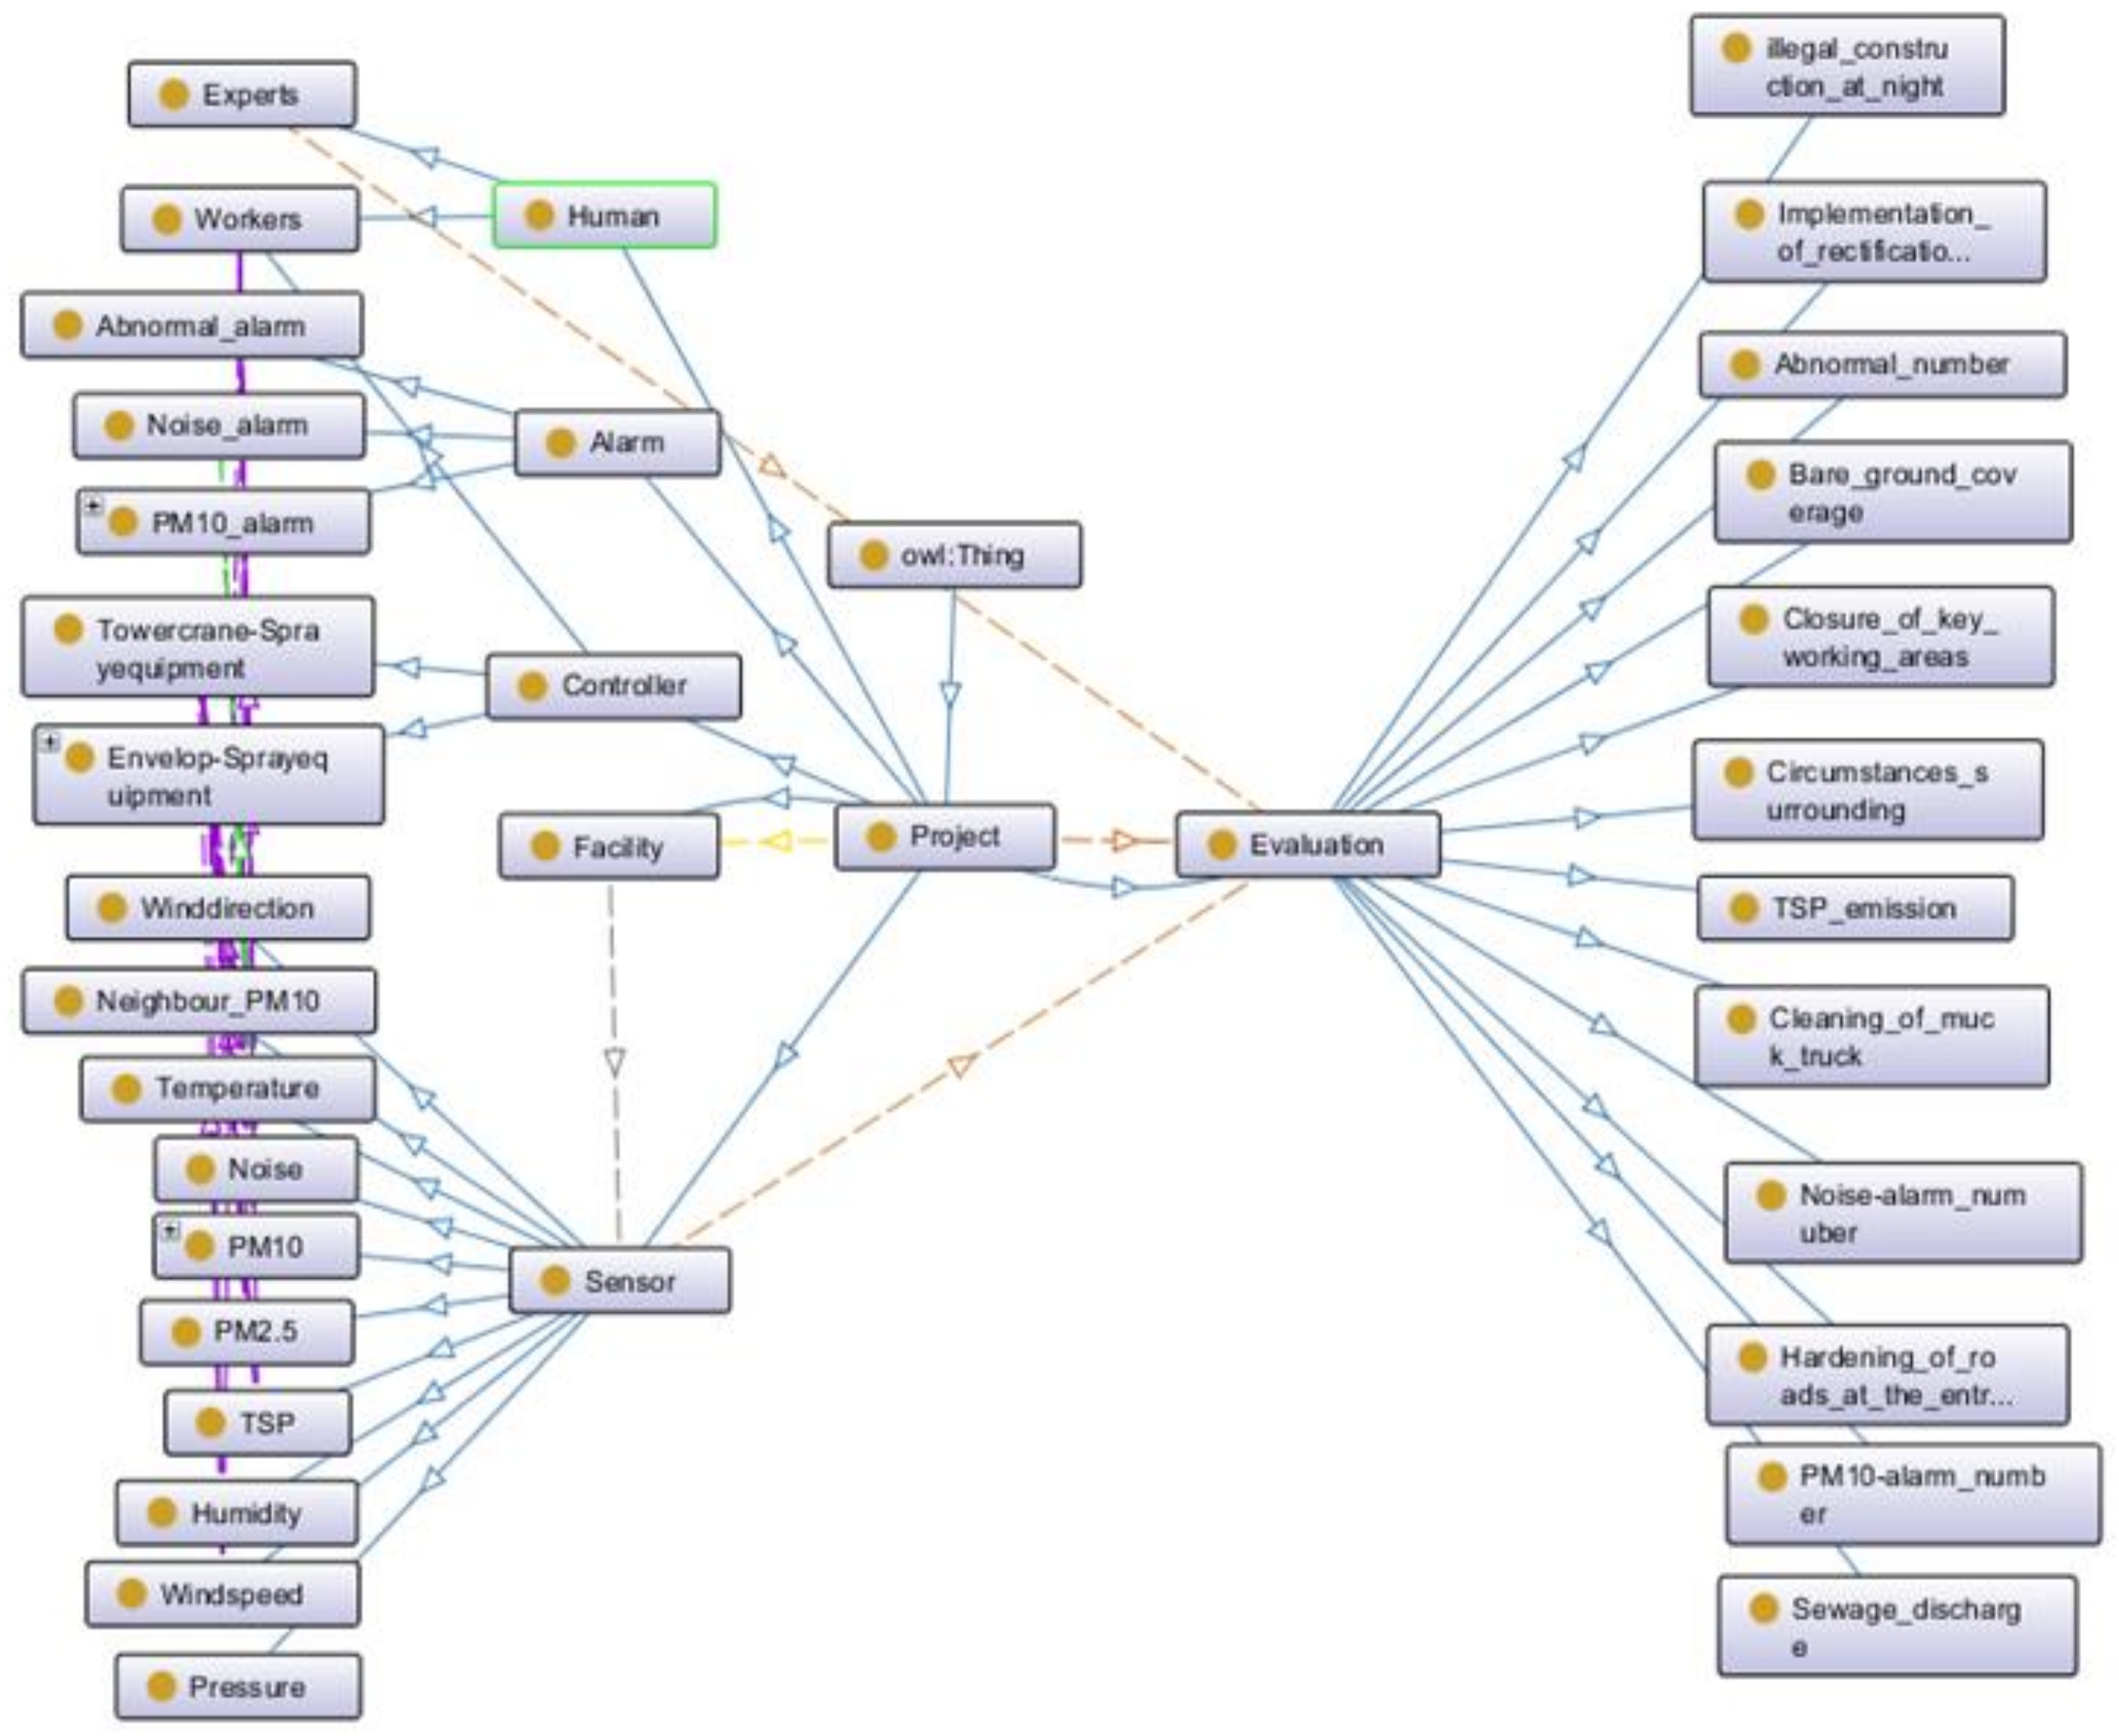
4.1. Development of the E-CPS Model Based on Ontology
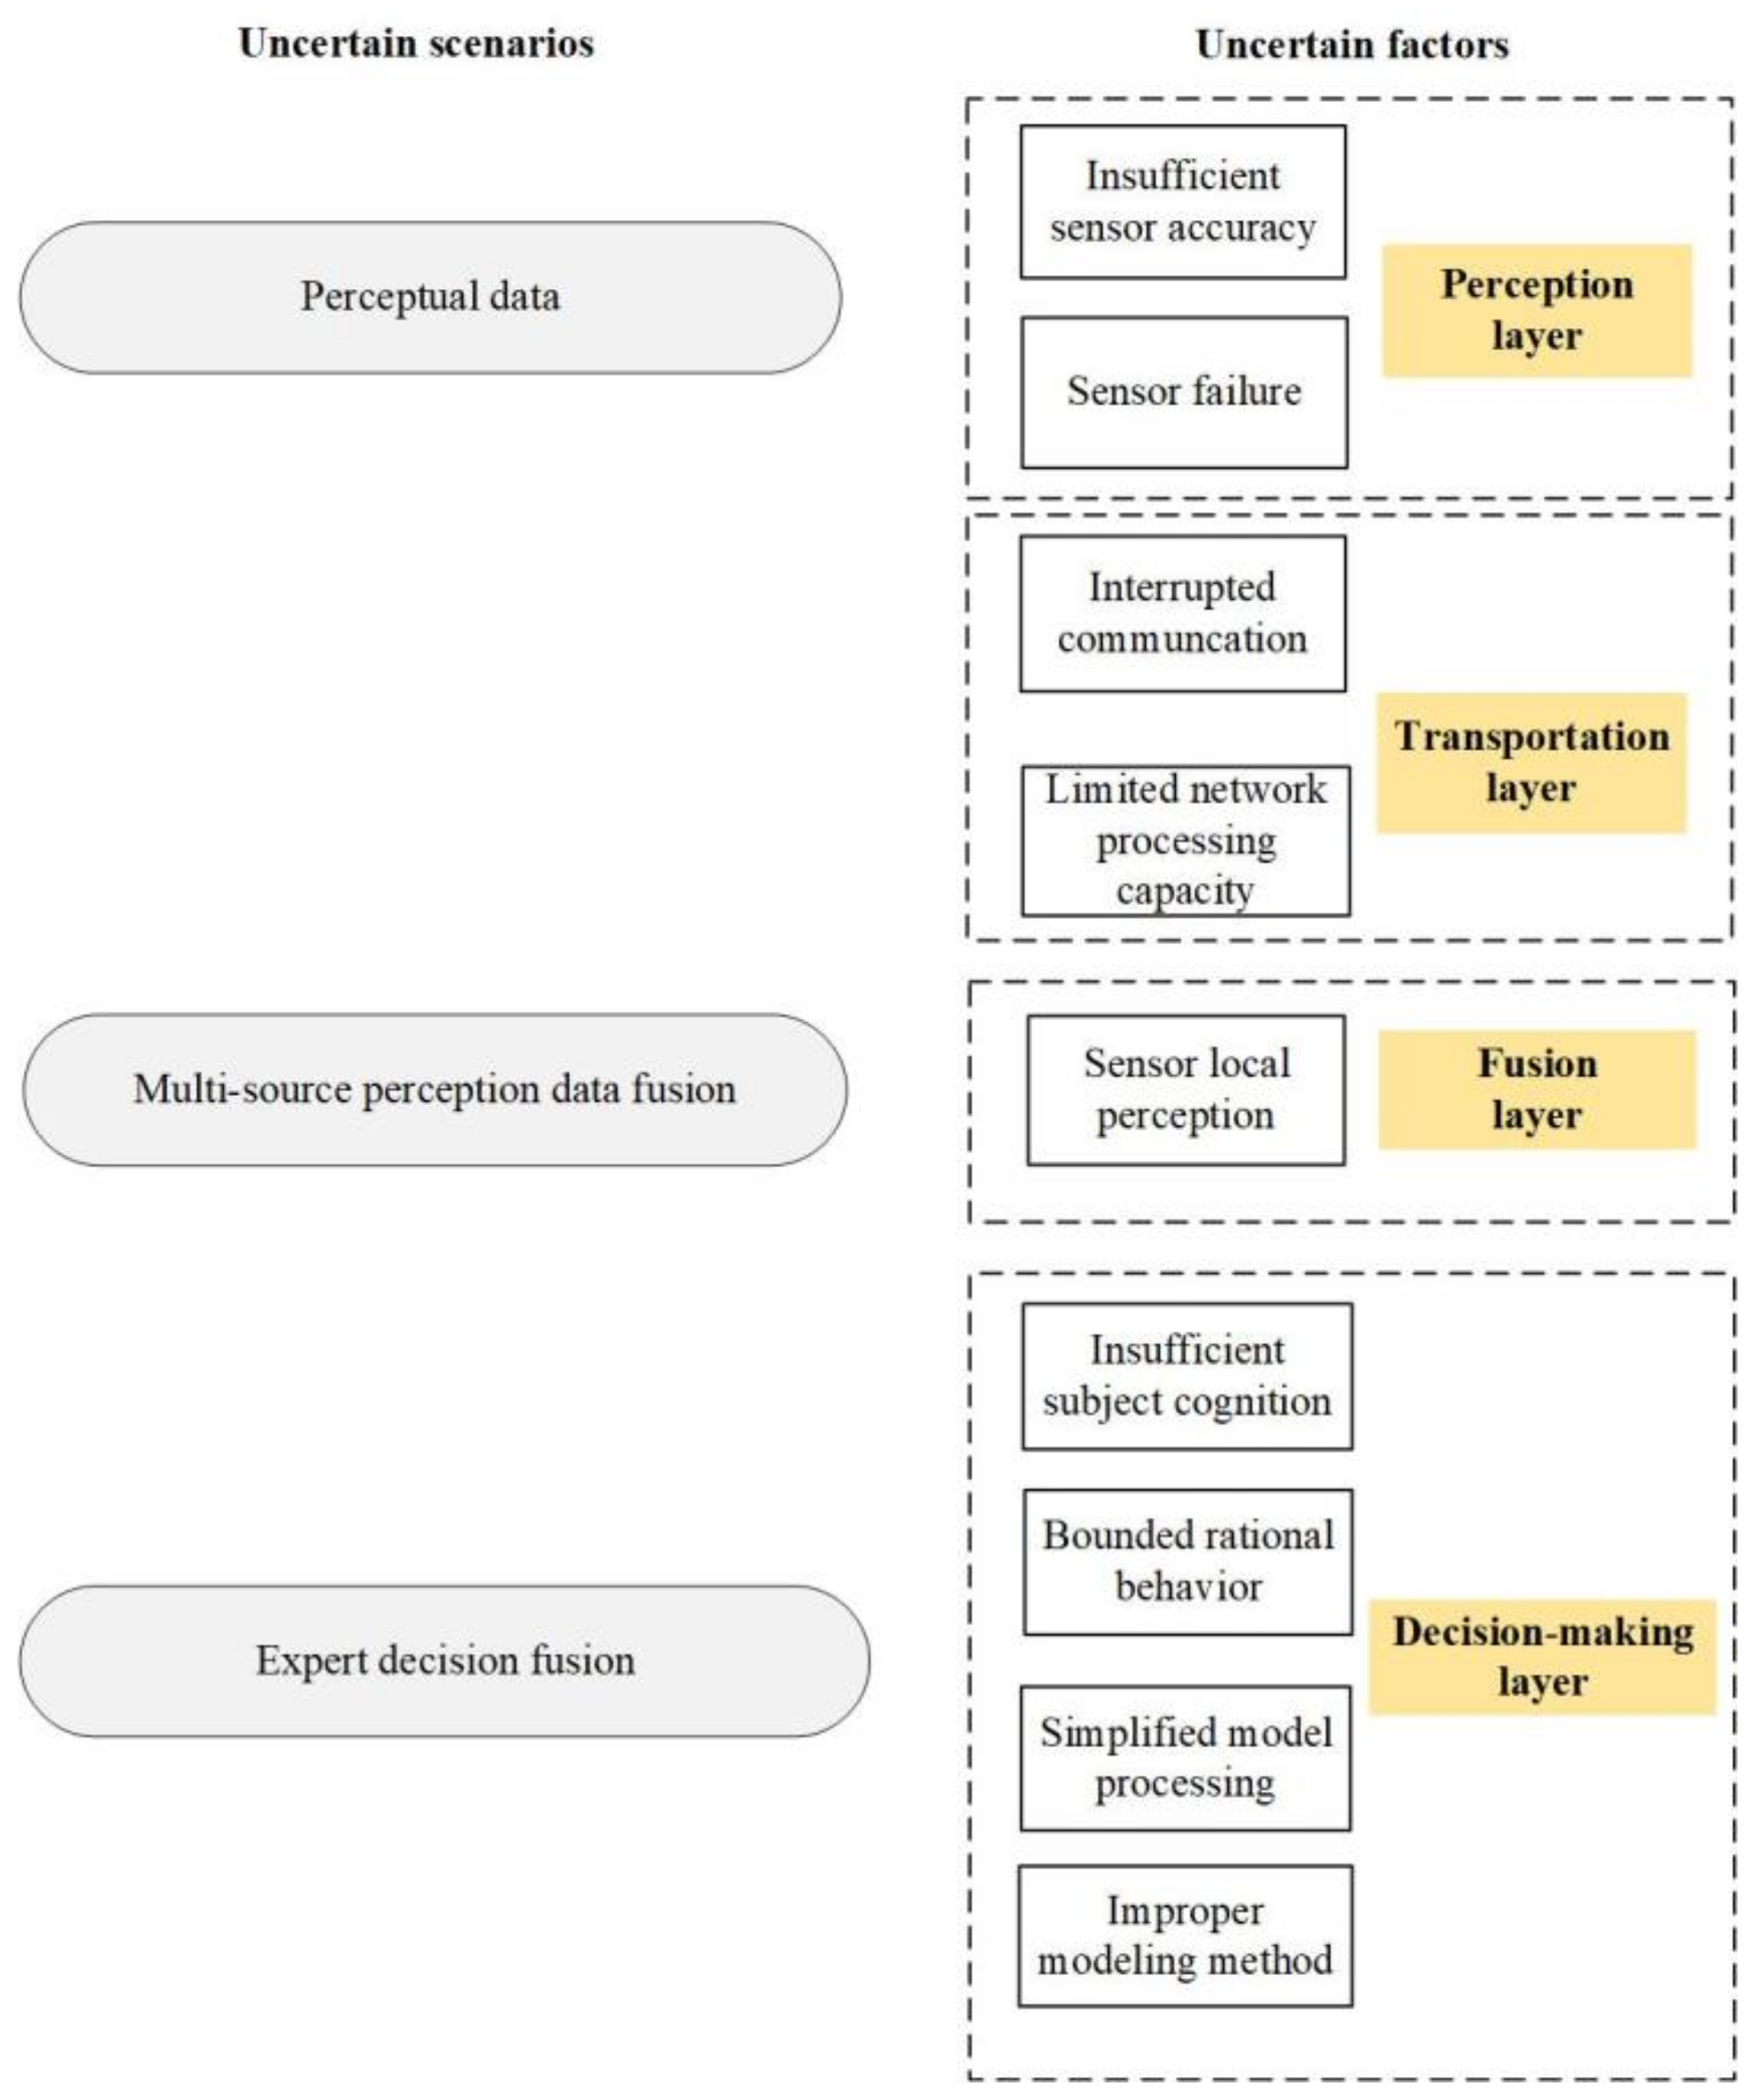
4.2. Creation of Uncertain Scenarios
5. Uncertainty Detection and Processing
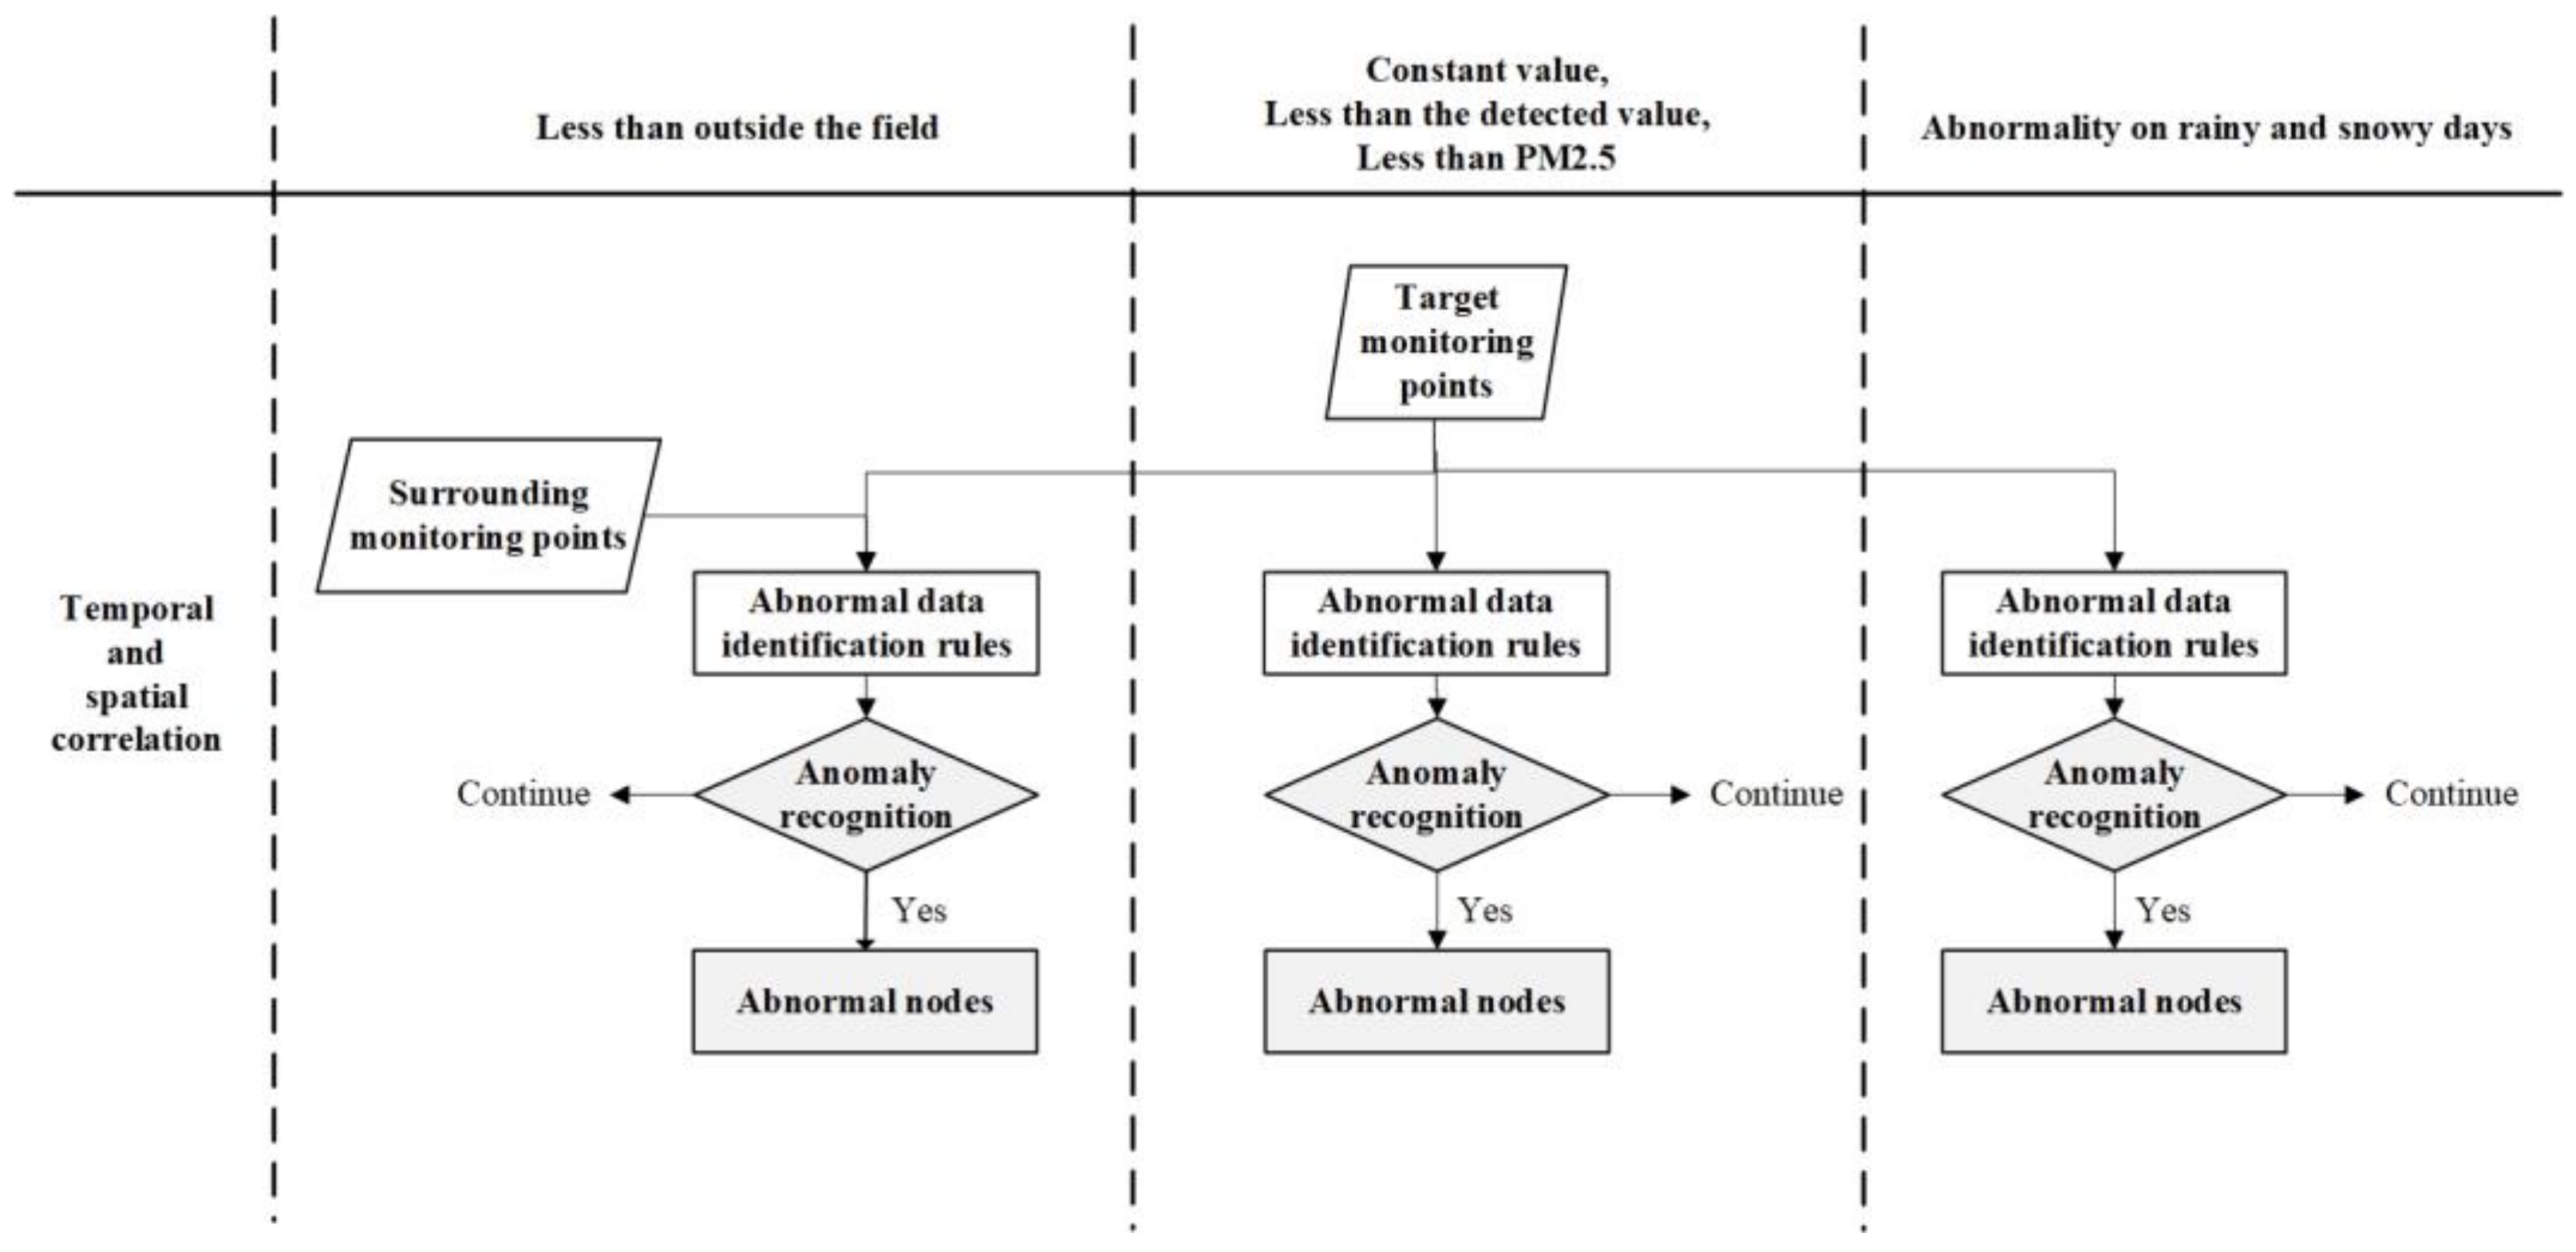
5.1. Abnormality Detection and Processing of Monitoring Data
5.2. Conflict Detection and Processing of Monitoring Data
5.3. Conflict Detection and Processing of Evaluation Decision
6. Results and Discussion
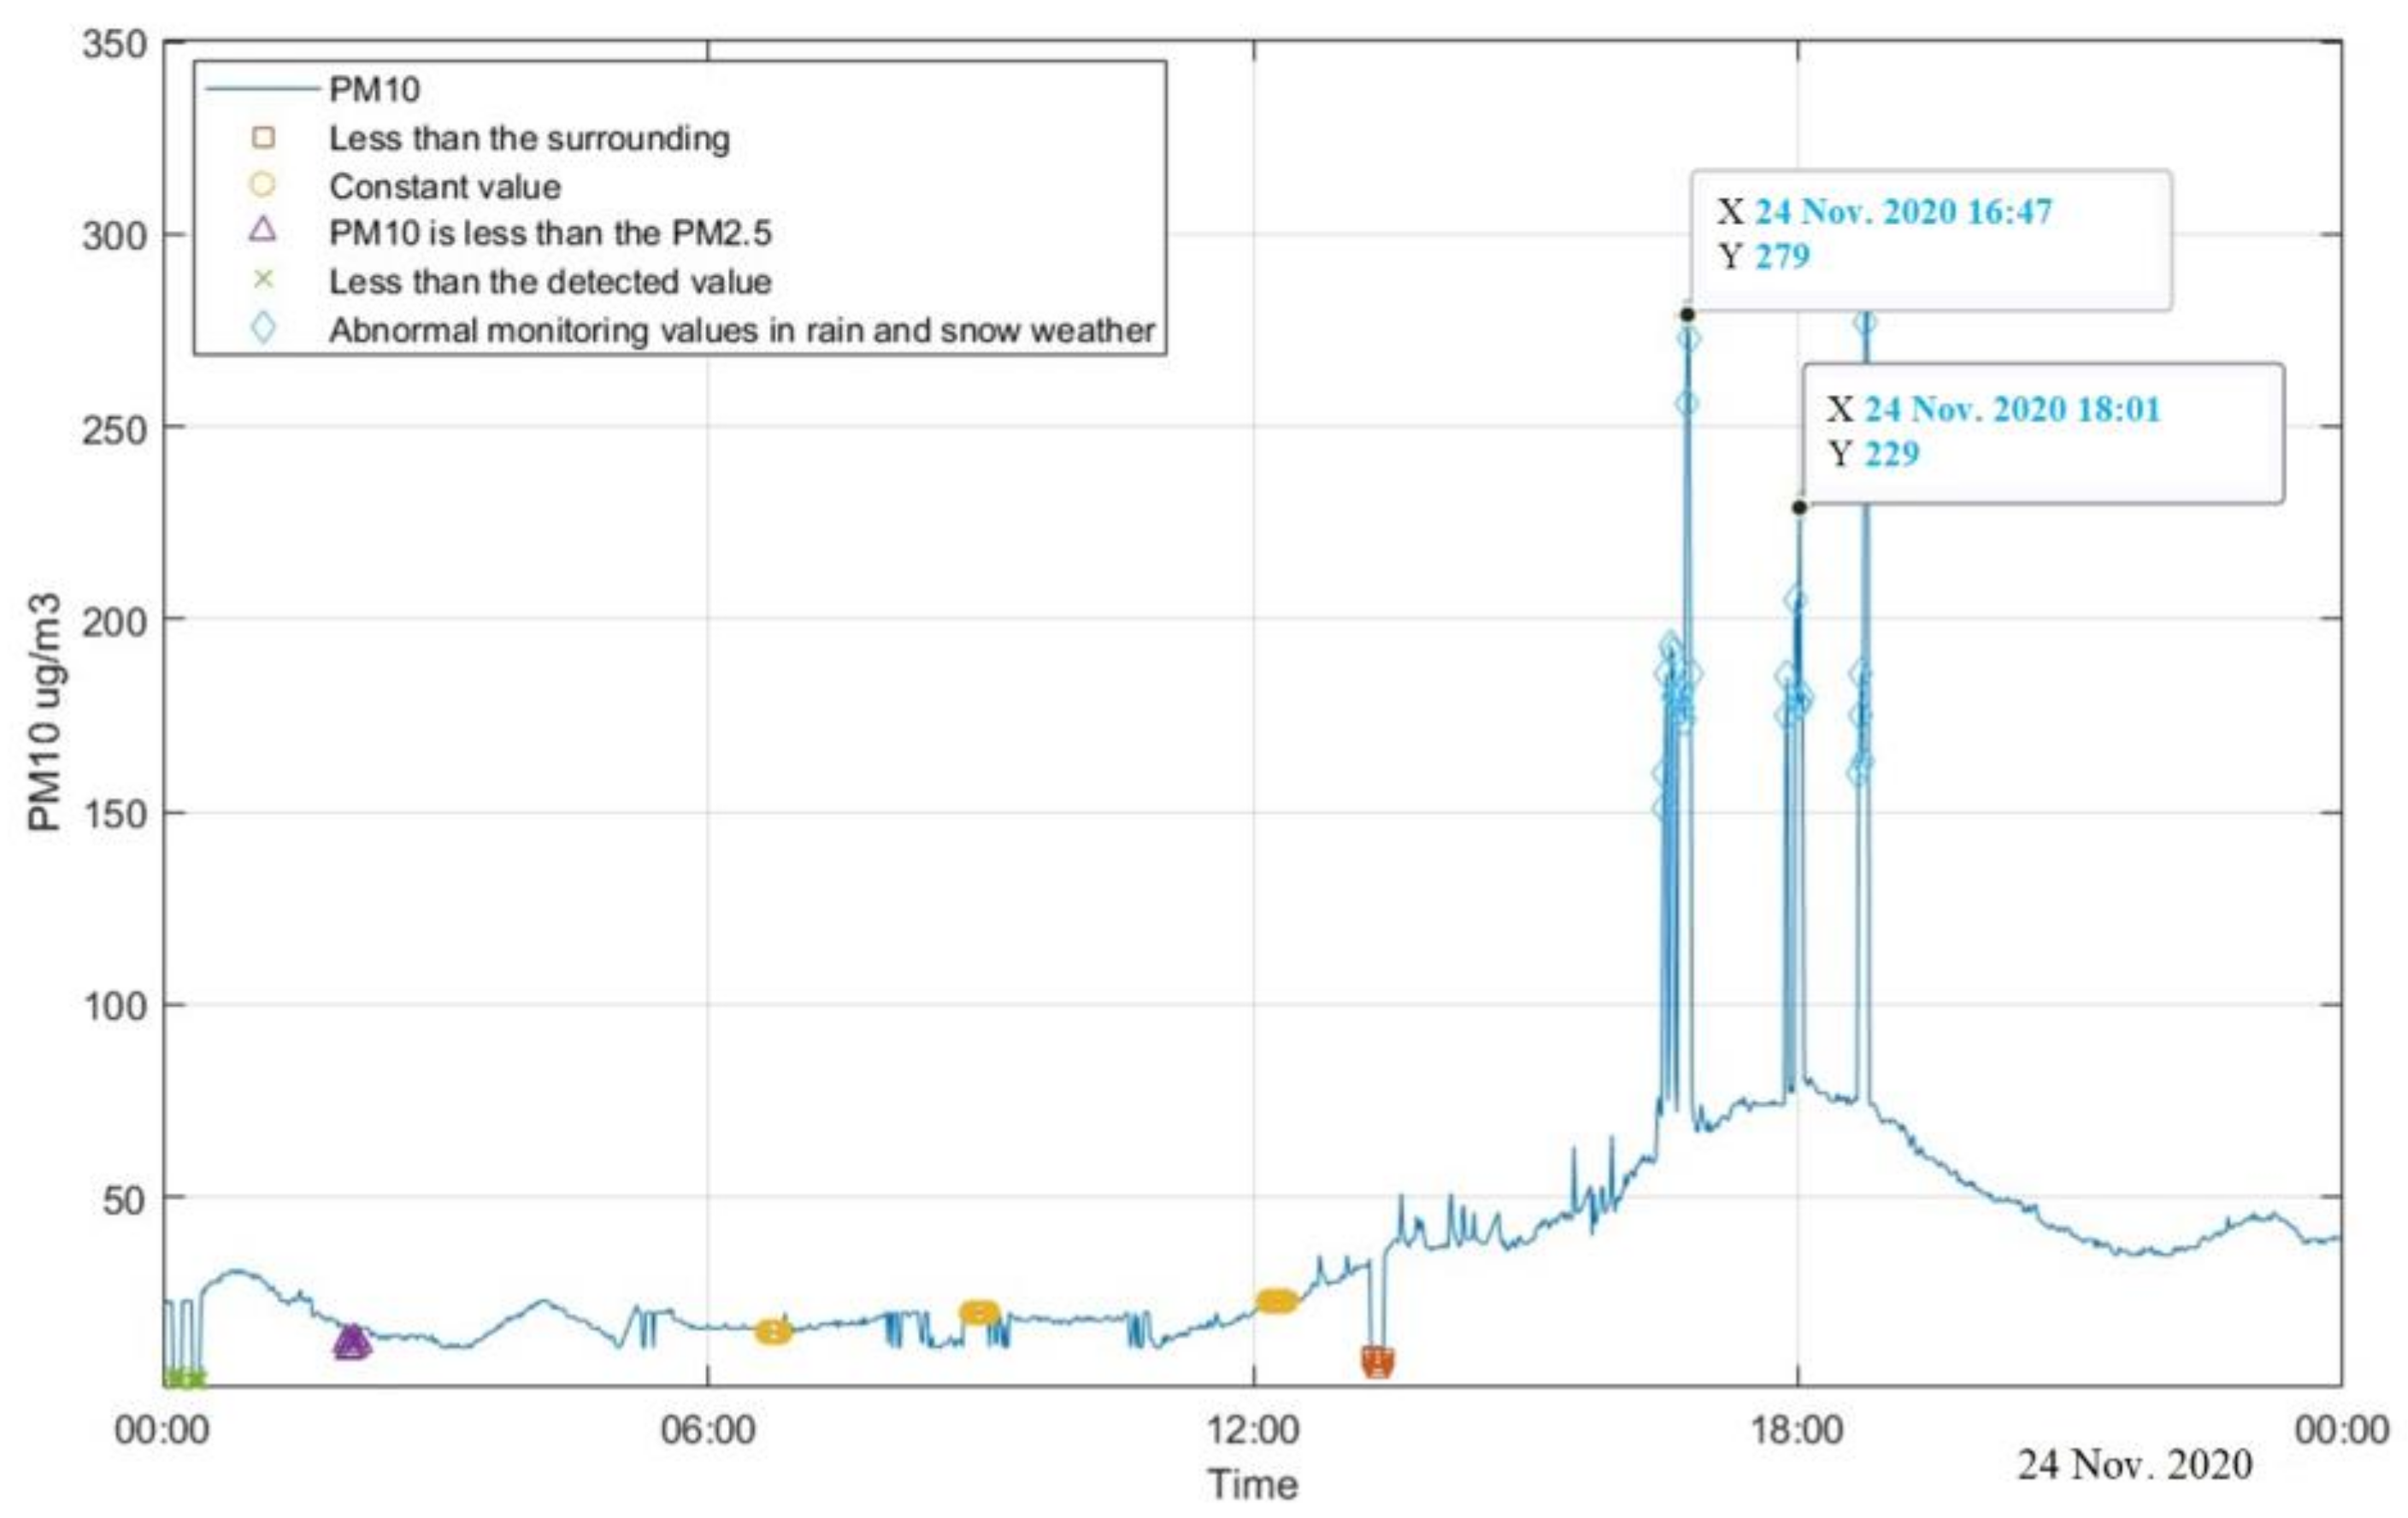
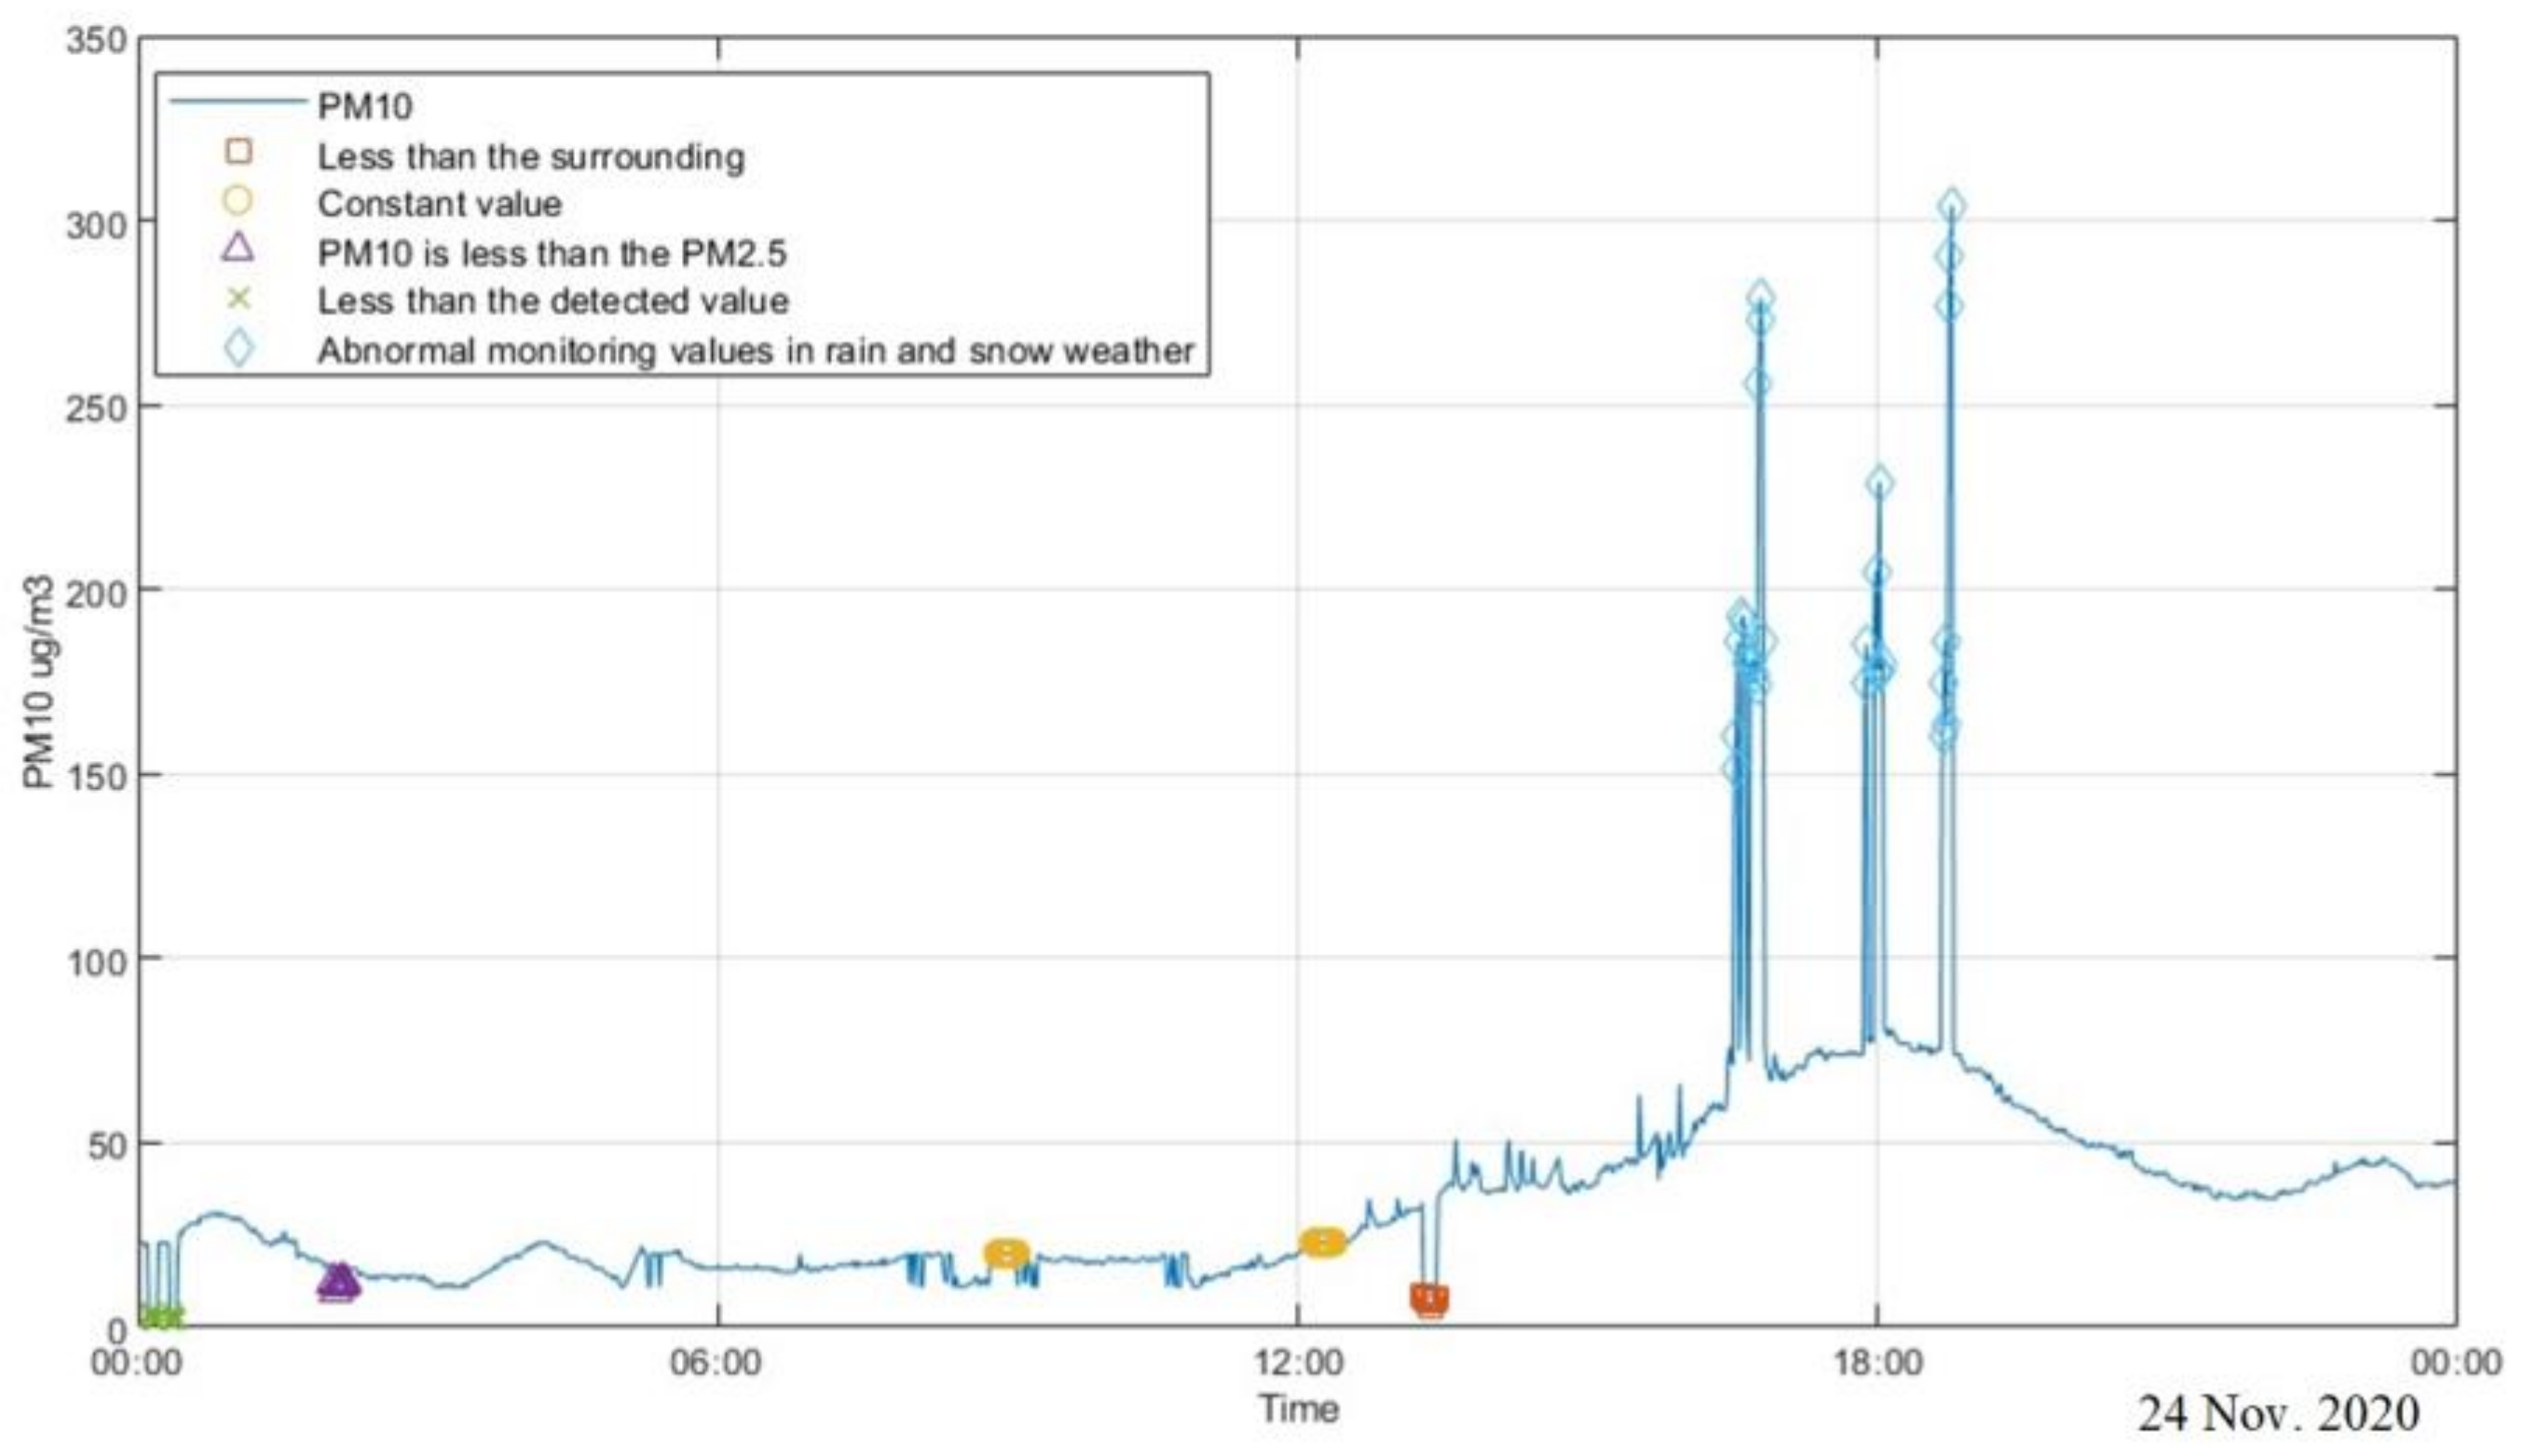
6.1. Anomaly Recognition
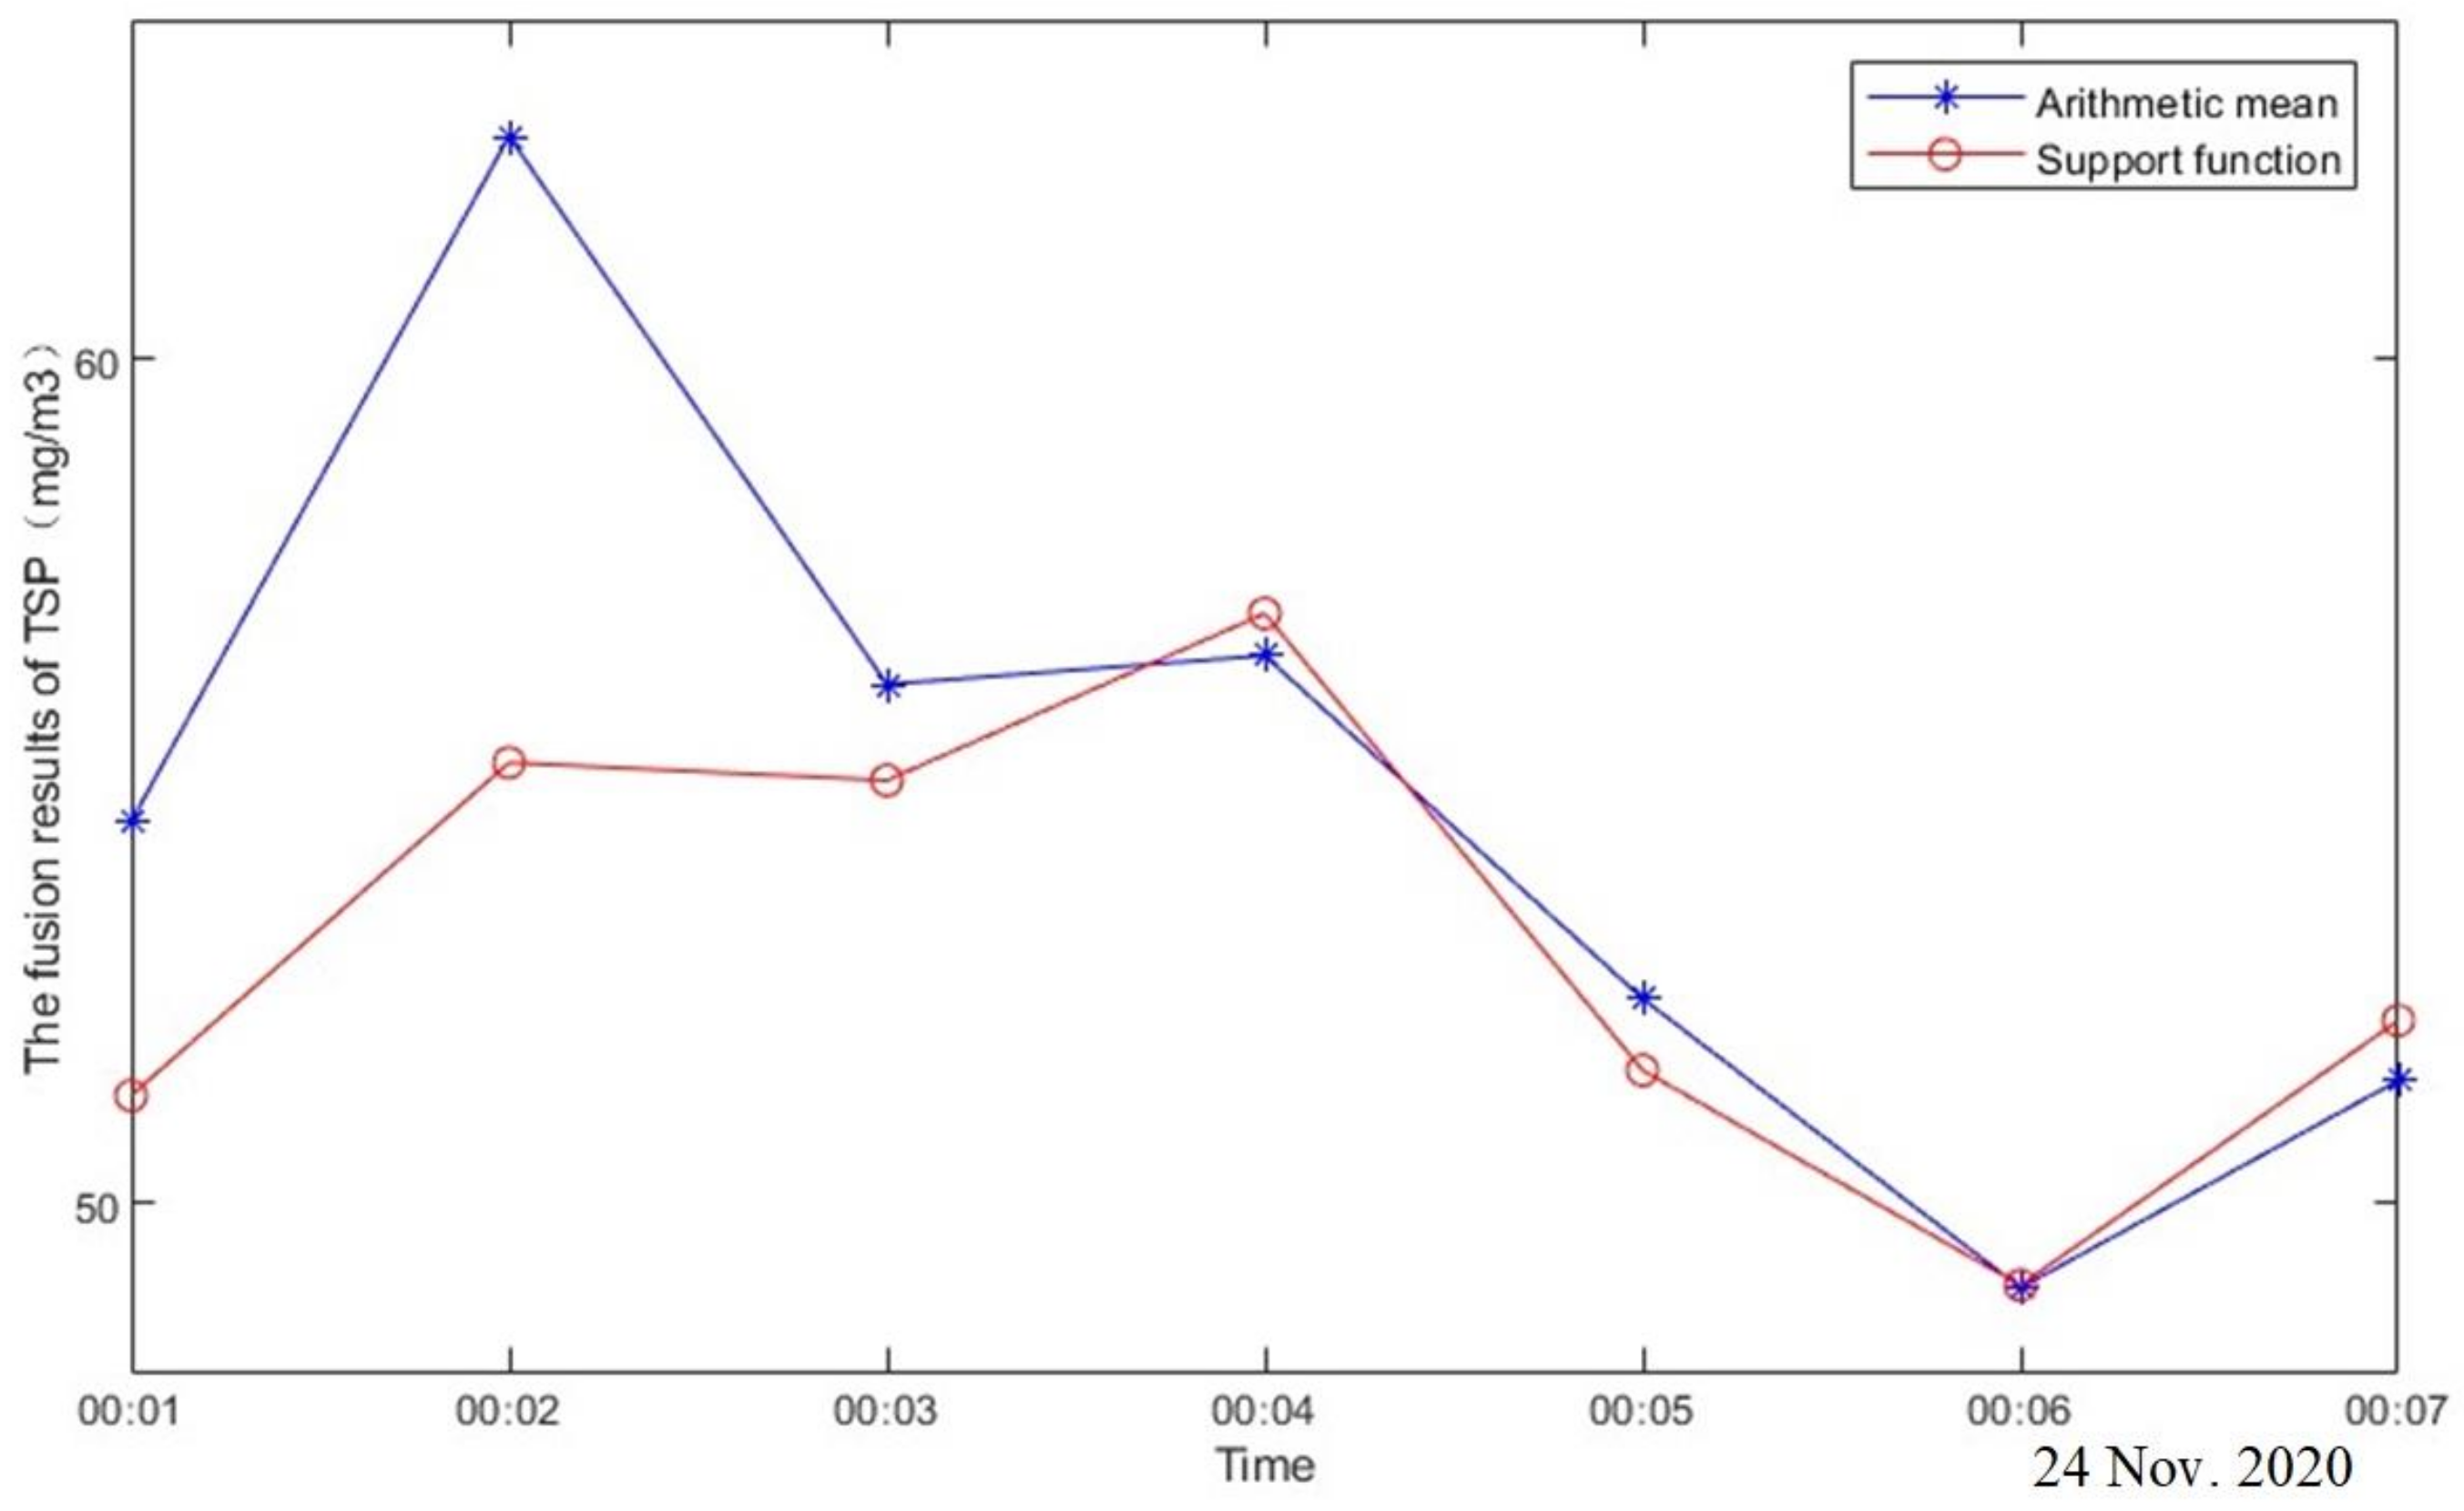
6.2. Sensory Data Fusion
6.3. Expert Score Fusion
6.4. Limitations of the Study
7. Conclusions
Author Contributions
Funding
Institutional Review Board Statement
Informed Consent Statement
Data Availability Statement
Conflicts of Interest
Abbreviations
| CPS | Cyber-physical system |
| E-CPS | Environmental-monitoring cyber-physical system |
| WSN | Wireless sensor network |
| GPS | Global positioning system |
| BIM | Building information-modeling |
| I–P–O | Inputs–processes–outputs |
| TSP | Total suspended particulate |
| PM2.5 | Fine particles with a diameter of 2.5 μm or less |
| PM10 | Inhalable coarse particles with a diameter of 10 μm or less |
| D-S evidence theory | Dempster–Shafer evidence theory |
References
- Zhang, M.; Liu, X.; Ding, Y. Assessing the influence of urban transportation infrastructure construction on haze pollution in China: A case study of Beijing-Tianjin-Hebei region. Environ. Impact Assess. Rev. 2021, 87, 106547. [Google Scholar] [CrossRef]
- Salamone, F.; Danza, L.; Meroni, I.; Pollastro, M.C. A low-cost environmental monitoring system: How to prevent systematic errors in the design phase through the combined use of additive manufacturing and thermographic techniques. Sensors 2017, 17, 828. [Google Scholar] [CrossRef] [PubMed] [Green Version]
- Lai, Z.B.; Huang, Q.L.; Zhang, Y.; Wang, Y.L. Monitoring system for green construction based on wireless sensor network. Build. Energy Effic. 2015, 43, 122–125. [Google Scholar]
- De, S.; Chakraborty, B. An energy-efficient wireless sensor network construction algorithm for air quality condition detection system. Comput. Electr. Eng. 2021, 91, 107064. [Google Scholar] [CrossRef]
- Jang, W.S.; Healy, W.M.; Skibniewski, M.J. Wireless sensor networks as part of a web-based building environmental monitoring system. Automat. Constr. 2008, 17, 729–736. [Google Scholar] [CrossRef]
- Bradley, J.; Atkins, M. Optimization and control of cyber-physical vehicle systems. Sensors 2015, 15, 23020–23049. [Google Scholar] [CrossRef] [Green Version]
- Wu, Z.; Xu, Y.; Yang, Y.; Zhang, C.; Zhu, X.; Ji, Y. Towards a semantic web of things: A hybrid semantic annotation, extraction, and reasoning framework for cyber-physical system. Sensors 2017, 17, 403. [Google Scholar] [CrossRef]
- Nazerdeylami, A.; Majidi, B.; Movaghar, A. Autonomous litter surveying and human activity monitoring for governance intelligence in coastal eco-cyber-physical systems. Ocean. Coast. Manag. 2021, 200, 105478. [Google Scholar] [CrossRef]
- Liu, G.; Yang, H.; Fu, Y.; Mao, C. Cyber-physical system-based real-time monitoring and visualization of greenhouse gas emissions of prefabricated construction. J. Clean. Prod. 2019, 246, 119059. [Google Scholar] [CrossRef]
- Golparvar-Fard, M.; Bohn, J.; Teizer, J.; Saverse, S.; Peña-Mora, F. Evaluation of image-based modeling and laser scanning accuracy for emerging automated performance monitoring techniques. Automat. Constr. 2011, 20, 1143–1155. [Google Scholar] [CrossRef]
- Roberts, C.; Scaglione, A.; Jamei, M.; Gentz, R. Learning behavior of distribution system discrete control devices for cyber-physical security. IEEE Trans. Smart Grid 2019, 11, 749–761. [Google Scholar] [CrossRef]
- Davison, D.E.; Kabamba, P.T.; Meerkov, S.M. Robustness with respect to disturbance model uncertainty: Theory and application to autopilot performance analysis. Math. Probl. Eng. 2000, 6, 267–304. [Google Scholar] [CrossRef] [Green Version]
- Seo, A.; Jeong, J.; Kim, Y. Cyber physical systems for user reliability measurements in a sharing economy environment. Sensors 2017, 17, 1868. [Google Scholar] [CrossRef] [PubMed] [Green Version]
- Li, T.; Ren, H.; Huang, M. Mechanism robustness design based on uncertainty effect resulted from error of profile and position of kinematic pairs. Chin. J. Mech. Eng. 2004, 17, 119–123. [Google Scholar] [CrossRef]
- Suri, R.; Otto, K. Manufacturing system robustness through integrated modeling. J. Mech. Des. 2001, 123, 630–636. [Google Scholar] [CrossRef]
- Wang, L.; Hwang, J.H.; Juang, C.H.; Atamturktur, S. Reliability-based design of rock slopes-a new perspective on design robustness. Eng. Geol. 2013, 154, 56–63. [Google Scholar] [CrossRef]
- Li, Z.; Yuan, M.; Hu, M.; Wang, Y.; Xia, B. Evaluation of ecological security and influencing factors analysis based on robustness analysis and the BP-DEMALTE model: A case study of the Pearl River Delta urban agglomeration. Ecol. Indic. 2019, 101, 595–602. [Google Scholar] [CrossRef]
- Freitas, L.A.; Magnani, F.S.; Hornsby, E.M. Robustness of electricity and chilled water supply systems subject to change technical and economic. IEEE Lat. Am. Trans. 2017, 15, 908–915. [Google Scholar] [CrossRef]
- Demestichas, K.; Adamopoulou, E.; Asthenopoulos, V.; Kosmides, P. Robust and cost-efficient experimental design for technical tests of information and communication technology-based solutions in the automotive sector. IET Intell. Transp. Syst. 2017, 11, 368–378. [Google Scholar] [CrossRef]
- Yang, B. Construction of logistics financial security risk ontology model based on risk association and machine learning. Saf. Sci. 2019, 123, 104437. [Google Scholar] [CrossRef]
- Vanommeslaeghe, Y.; Denil, J.; Viaene, J.D.; Ceulemans, D.; Derammelaere, S.; Meulenaere, P.D. Ontological reasoning in the design space exploration of advanced cyber–physical systems. Microprocess. Microsyst. 2021, 85, 104151. [Google Scholar] [CrossRef]
- Yuan, X.; Anumba, C.J.; Parfitt, M.K. Cyber-physical systems for temporary structure monitoring. Automat. Constr. 2016, 66, 1–14. [Google Scholar] [CrossRef]
- Akanmu, A.; Olayiwola, J.; Ogunseiju, O.; McFeeters, D. Cyber-physical postural training system for construction workers. Automat. Constr. 2020, 117, 103272. [Google Scholar] [CrossRef]
- Bonci, A.; Carbonari, A.; Cucchiarelli, A.; Messi, L.; Pirani, M.; Vaccarini, M. A cyber-physical system approach for building efficiency monitoring. Automat. Constr. 2019, 102, 68–85. [Google Scholar] [CrossRef]
- Amuthadevi, C.; Sathya Priya, J.; Madhusudhanan, B. Validation of multicast routing in cyber physical systems monitoring air quality. Cluster Comput. 2019, 22, 3917–3923. [Google Scholar] [CrossRef]
- Ding, K.; Zhang, Y.; Chan, F.; Zhang, C.; Fu, H. A cyber-physical production monitoring service system for energy-aware collaborative production monitoring in a smart shop floor. J. Clean. Prod. 2021, 297, 126599. [Google Scholar] [CrossRef]
- Zografopoulos, I.; Ospina, J.; Liu, X.; Konstantinou, C. Cyber-Physical Energy Systems Security: Threat Modeling, Risk Assessment, Resources, Metrics, and Case Studies. IEEE Access 2021, 9, 29775–29818. [Google Scholar] [CrossRef]
- Zhang, C.; Wang, H. Robustness of the active rotary inertia driver system for structural swing vibration control subjected to multi-type hazard excitations. Appl. Sci. 2019, 9, 4391. [Google Scholar] [CrossRef] [Green Version]
- Wang, P.; Zhang, Z.; Huang, Q.; Lee, J. Approach to enhance the robustness on PMU-based power system dynamic equivalent modeling. IEEE Trans. Ind. Appl. 2020, 56, 1116–1123. [Google Scholar] [CrossRef]
- Yang, C.; Chen, J. Robust design for a multi-echelon regional construction and demolition waste reverse logistics network based on decision Maker’s conservative attitude. J. Clean. Prod. 2020, 273, 122909. [Google Scholar] [CrossRef]
- Fawcett, S.E.; Osterhaus, P. Information sharing and supply chain performance: The role of connectivity and willingness. Supply Chain Manag. 2007, 12, 358–368. [Google Scholar] [CrossRef]
- Ngai, E.W.T.; Cheng, T.C.E.; Ho, S.S.M. Critical success factors of web-based supply-chain management systems: An exploratory study. Prod. Plan. Control. 2004, 15, 622. [Google Scholar] [CrossRef] [Green Version]
- Lee, J.; Lee, S. Robust CNN Compression Framework for Security-Sensitive Embedded Systems. Appl. Sci. 2021, 11, 1093. [Google Scholar] [CrossRef]
- Almasabi, S.; Mitra, J.A. Fault-tolerance based approach to optimal PMU placement. IEEE Trans. Smart Grid 2019, 10, 6070–6079. [Google Scholar] [CrossRef]
- Hu, T.; Bertolotti, I.C.; Navet, N.; Havet, L. Automated Fault Tolerance Augmentation in Model-Driven Engineering for CPS. Comput. Stand. Inter. 2020, 70, 103424. [Google Scholar] [CrossRef] [Green Version]
- McPhail, C.; Maier, H.R.; Westra, S.; van der Linden, L.; Kwakkel, J.H. Guidance framework and software for understanding and achieving system robustness. Environ. Model. Softw. 2021, 142, 105059. [Google Scholar] [CrossRef]
- Jiang, C.; Zhou, D.; Gao, F. Robust fault detection and isolation for uncertain linear retarded systems. Asian J. Control 2006, 8, 141–152. [Google Scholar] [CrossRef]
- Shao, J.; Buldyrev, S.V.; Havlin, S.; Stanley, H.E. Cascade of failures in coupled network systems with multiple support-dependence relations. Phys. Rev. E 2011, 83 Pt 2, 036116. [Google Scholar] [CrossRef] [Green Version]
- Fang, W.; Ma, L.; Love, P.; Luo, H.; Ding, L.; Zhou, A. Knowledge graph for identifying hazards on construction sites: Integrating computer vision with ontology. Auto. Constr. 2020, 119, 103310. [Google Scholar] [CrossRef]
- Xing, X.; Zhong, B.; Luo, H.; Li, H.; Wu, H. Ontology for safety risk identification in metro construction. Comput. Ind. 2019, 109, 14–30. [Google Scholar] [CrossRef]
- Li, B.; Schultz, C.; Teizer, J.; Golovina, O.; Melzner, J. Towards a unifying domain model of construction safety, health and well-being: Safecondm. Adv. Eng. Inform. 2022, 51, 101487. [Google Scholar] [CrossRef]
- Petnga, L.; Austin, M. An ontological framework for knowledge modeling and decision support in cyber-physical systems. Adv. Eng. Inform. 2016, 30, 77. [Google Scholar] [CrossRef] [Green Version]
- Wang, M. Ontology-based modelling of lifecycle underground utility information to support operation and maintenance. Automat. Constr. 2021, 132, 103933. [Google Scholar] [CrossRef]
- Chuang, T.Y.; Perng, N.H.; Han, J.Y. Pavement performance monitoring and anomaly recognition based on crowdsourcing spatiotemporal data. Automat. Constr. 2019, 106, 102882.11. [Google Scholar] [CrossRef]
- Yager, R.R. The power average operator. IEEE Trans. Syst. Man. Cybern. A 2001, 31, 724–731. [Google Scholar] [CrossRef]
- Jiao, Z.; Xiong, W.; Zhang, L.; Xu, B. Multi-sensor data fusion method based on belief degree and its applications. J. Southeast Univ. 2008, 38, 253–257. [Google Scholar]
- Chen, L.; Rao, S. A modified dempster-shafer theory for multicriteria optimization. Eng. Optimiz. 1998, 30, 177–201. [Google Scholar] [CrossRef]
- Deng, Y.; Shi, W.K.; Zhu, Z.F. Combining belief functions based on distance of evidence. Decis. Support Syst. 2004, 38, 489–493. [Google Scholar]
- Ma, M.; An, J. Combination of evidence with different weighting factors a novel probabilistic-based dissimilarity measure approach. J. Sens. 2015, 2015, 1–9. [Google Scholar] [CrossRef] [Green Version]
- Zhong, B.; Gan, C.; Luo, H.; Xing, X. Ontology-based framework for building environmental monitoring and compliance checking under BIM environment. Build. Environ. 2018, 141, 127–142. [Google Scholar] [CrossRef]
- Guo, Q.; Zhang, M. Semantic information integration and question answering based on pervasive agent ontology. Expert Syst. Appl. 2009, 36, 10068–10077. [Google Scholar] [CrossRef]
- Guerlain, C.; Renault, S.; Ferrero, F.; Faye, S. Decision support systems for smarter and sustainable logistics of construction sites. Sustainability 2019, 11, 2762. [Google Scholar] [CrossRef] [Green Version]
- Zhang, Y.; Xiao, Z.; Li, P.; Tang, X.; Ou, G. Conservative sensor error modeling using a modified paired overbound method and its application in satellite-based augmentation systems. Sensors 2019, 19, 2826. [Google Scholar] [CrossRef] [PubMed]
- Trilles, S.; Belmonte, Ò.; Schade, S.; Huerta, J. A domain-independent methodology to analyze IOT data streams in real-time. a proof of concept implementation for anomaly detection from environmental data. Int. J. Digit. Earth 2017, 10, 103–120. [Google Scholar] [CrossRef] [Green Version]
- Heredia, G.; Ollero, A. Detection of Sensor Faults in Small Helicopter UAVs Using Observer/Kalman Filter Identification. Math. Probl. Eng. 2011, 2011, 174618. [Google Scholar] [CrossRef] [Green Version]
- Hawkins, D.M.; Bradu, D.; Kass, G.V. Location of Several Outliers in Multiple Regression Data Using Elemental sets. Technometrics 1983, 3, 197–208. [Google Scholar] [CrossRef]
- Harrison, R.M.; Deacon, A.R.; Jones, M.R. Sources and processes affecting concentrations of PM10 and PM2.5 particulate matter in Birmingham (U.K.). Atmos. Environ. 1997, 31, 4103–4117. [Google Scholar] [CrossRef]
- Xiao, F. An improved method for combining conflicting evidences based on the similarity measure and belief function entropy. Int. J. Fuzzy Syst. 2018, 20, 1256–1266. [Google Scholar] [CrossRef]
- Zhao, K.; Li, L.; Chen, Z.; Sun, R.; Yuan, G.; Li, J. A survey: Optimization and applications of evidence fusion algorithm based on Dempster–Shafer theory. Appl. Soft. Comput. 2022, 124, 109075. [Google Scholar] [CrossRef]
- Murphy, C.K. Combining belief functions when evidence conflicts. Decis. Support Syst. 2000, 29, 1–9. [Google Scholar] [CrossRef]


| Author | Research Methods | Theme |
|---|---|---|
| Liu et al. [9] | CPS + WSN + GPS + BIM | Monitoring greenhouses gas emissions of prefabricated buildings |
| Nazerdeylami et al. [8] | CPS + deep learning | Monitoring litter surveying and prediction of human littering activities in the coastal area |
| Amuthadevi et al. [25] | CPS + WSN | Monitoring risk of air pollutant in urban areas |
| Ding et al. [26] | CPS + IoT + cloud-edge orchestration | Monitoring production-status service and energy consumption in the shopfloor |
| Zografopoulos et al. [27] | CPS + simulation modeling | Evaluating the system’s performance under adverse scenarios |
| Step | Task Definition | Primary Content |
|---|---|---|
| 1 | To establish the ontology model | The ontology model contains five basic elements—human, machine, matter, events, and time—as well as the interaction between the elements. |
| 2 | To establish the rule base | According to the actual needs of construction site environmental management, a number of rule statements can be created in the rule base to analyze the physical space based on industrial standards and expert experiences. |
| 3 | To establish the database | The database is utilized to store historical data and real-time data. The data are derived from sensors and video surveillance in physical space, which reflect the environmental information. |
| 4 | To establish the inference engine | The established inference rules, ontology models, and databases can be connected to the inference engine. |
| No. | Indicator | Description | Source |
|---|---|---|---|
| 1 | PM10 overrun times | Times of PM10 exceed the limit per month | PM10 sensor |
| 2 | TSP emissions | Difference between the monthly average concentration of TSP and the urban background value (mg/m3) | TSP sensor |
| 3 | Noise overrun times | Times of the monthly noise exceed the limit | Noise sensor |
| 4 | Illegal construction times at night | Times of night construction violations without approval | Noise sensor |
| 5 | Discharged sewage suspended solids content | The content of suspended solids in the sewage discharged from the construction site | Water quality monitoring sensor |
| 6 | Muck truck cleaning situations | Whether departing vehicles are flushed as required | Vehicle flushing capture system |
| 7 | Number of abnormal monitoring data | The number of abnormal monitoring data per month | Information platform |
| 8 | Hardening of import and export roads | The main roads and sites on the construction site are hardened as required | Video Surveillance |
| 9 | Enclosure around the construction site | Enclosure measures shall be taken around the construction site, and the front door and the vicinity of the enclosure shall be cleaned in time | Video Surveillance |
| 10 | Bare ground coverage | The bare ground and mounds of the construction site shall be covered, solidified, or greened, as required | Video Surveillance |
| 11 | Closed situation of key operation areas | The outer scaffolding is enclosed by dense mesh nets, metal safety nets | Video Surveillance |
| 12 | Implementation of rectification | Whether to deal with warning information promptly; after heavy air pollution and extreme weather warning information, stop production and limit production and response measures according to the corresponding warning level | Information platform |
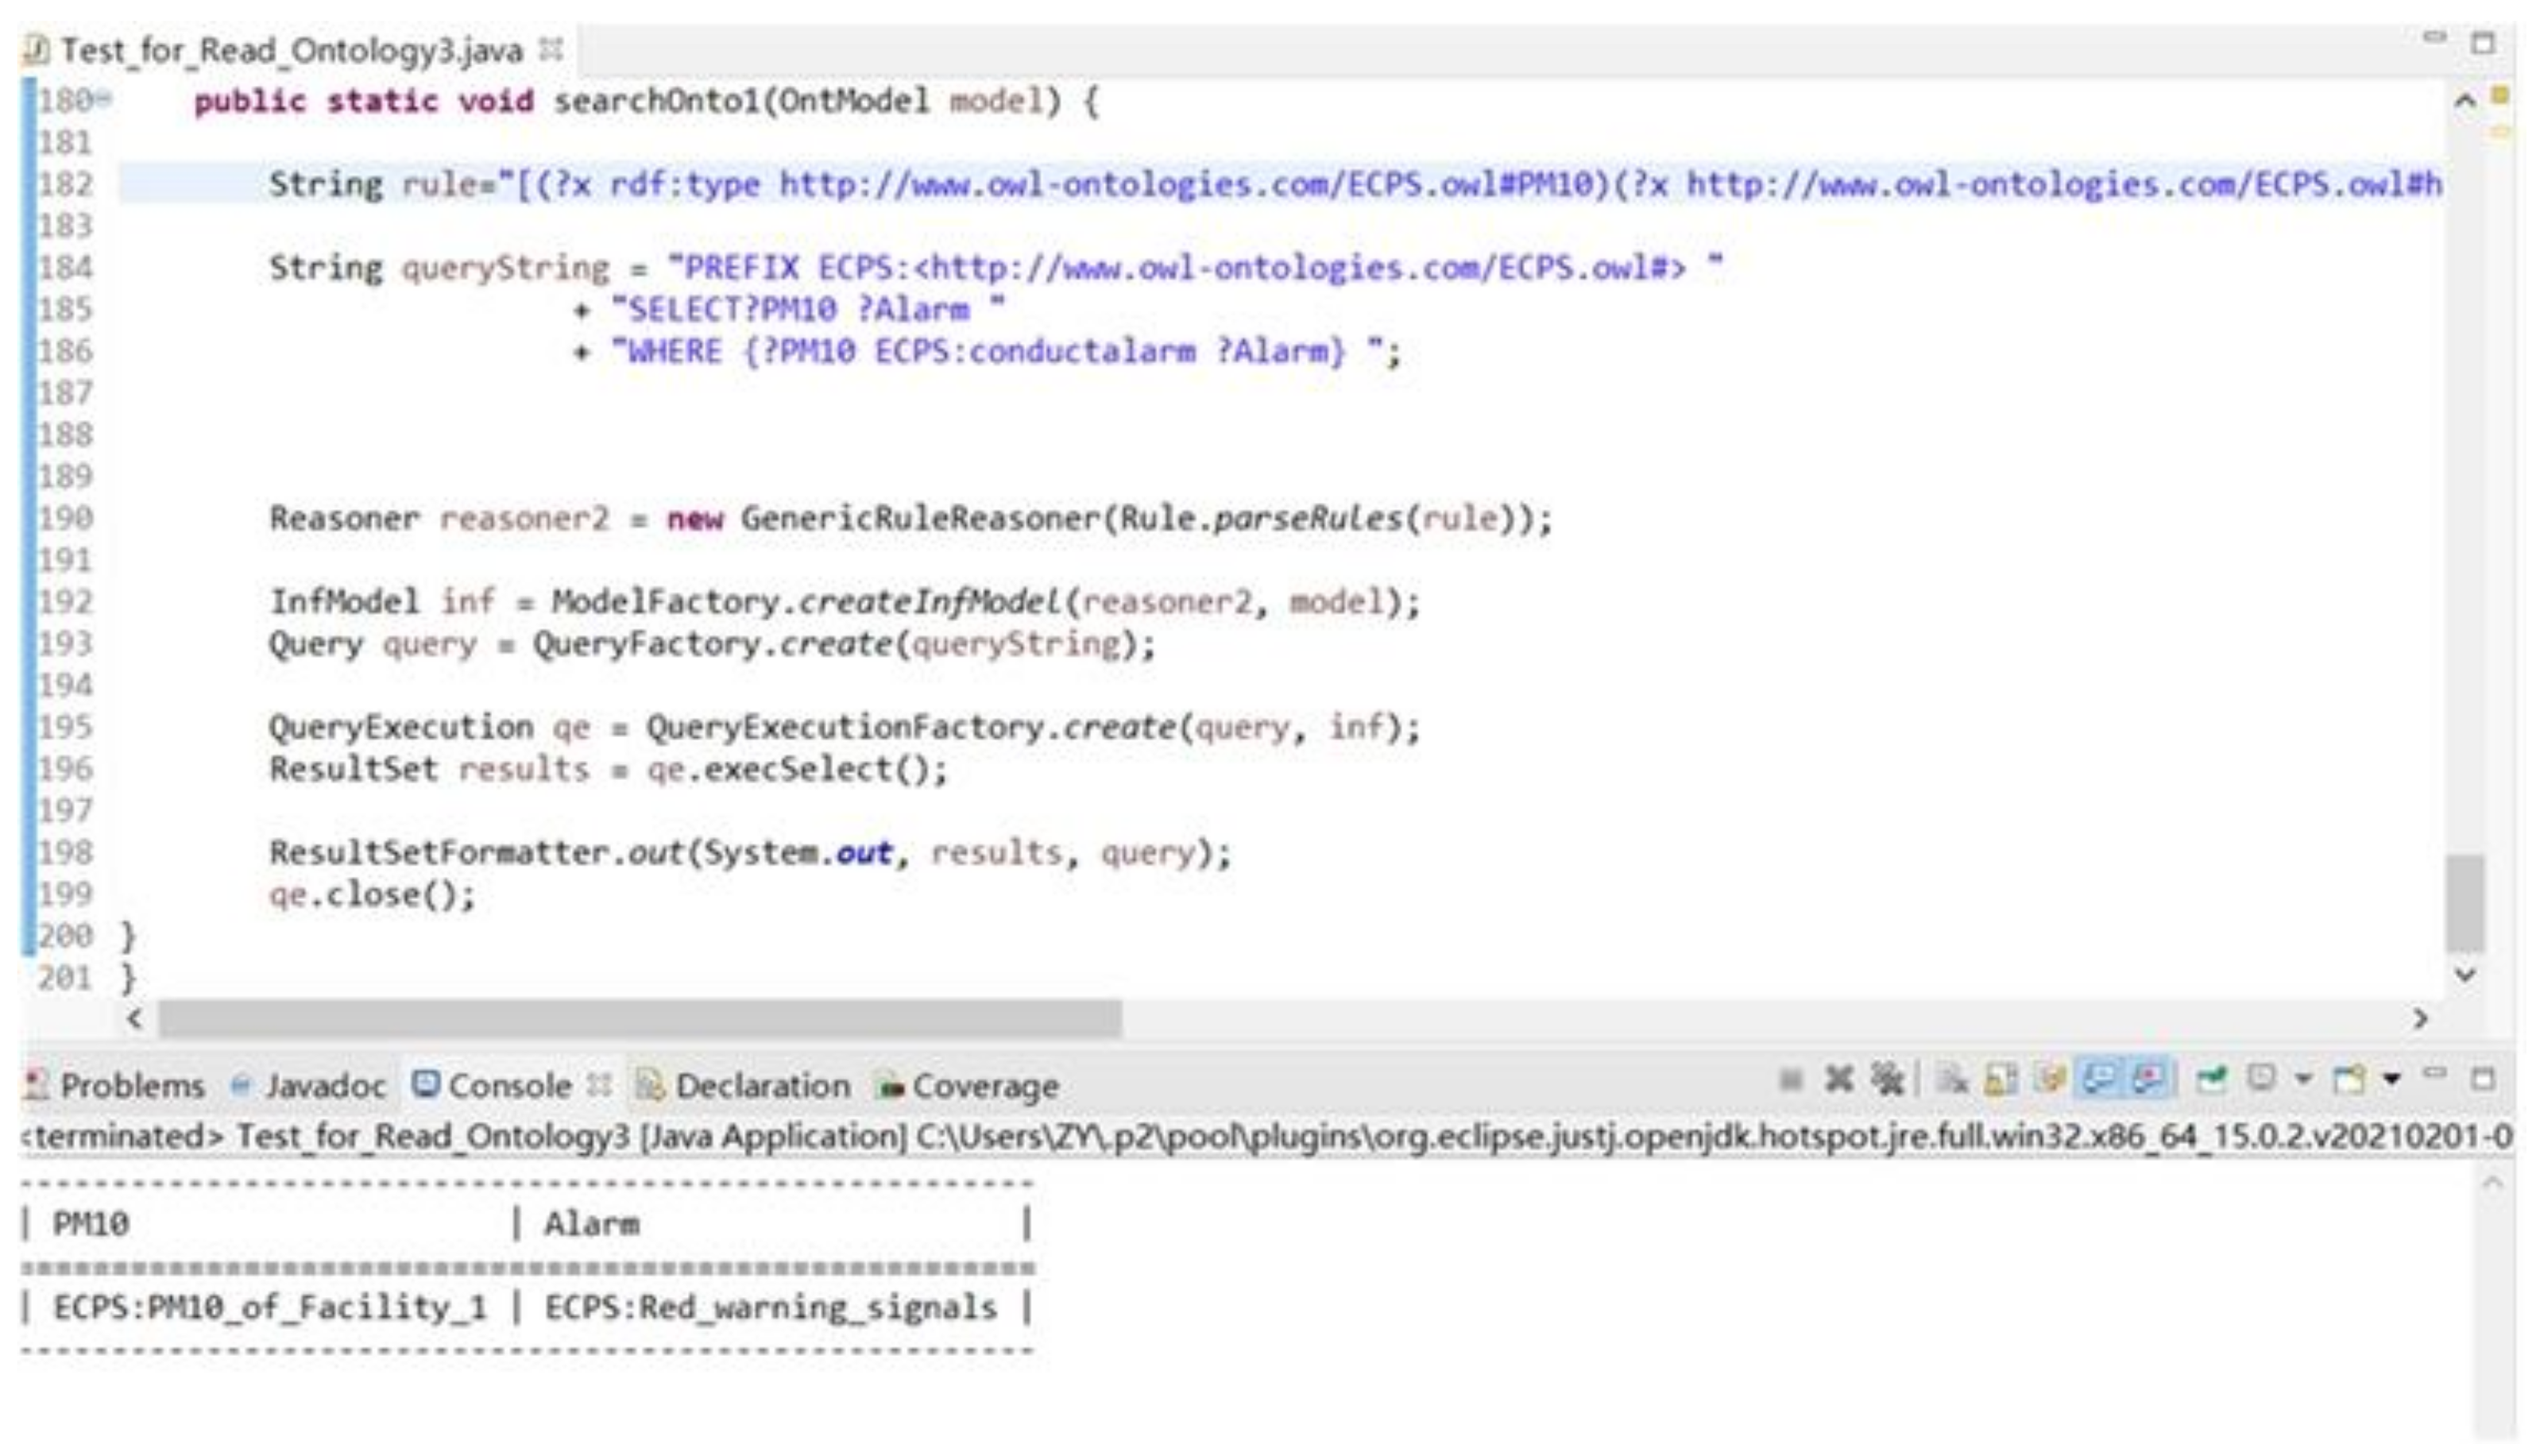
| Rule | Jena Rules | Early Warning |
|---|---|---|
| Rule 1 | [(?x rdf:type http://www.owl-ontologies.com/E-CPS.owl#PM10 (accessed on 24 August 2022))(?x http://www.owl-ontologies.com/E-CPS.owl#hasvalue (accessed on 24 August 2022) ?y) + “greaterThan(?y,150 )” + “->(?x http://www.owl-ontologies.com/E-CPS.owl#conductalarm http://www.owl-ontologies.com/E-CPS.owl#Red_warning_signals) (accessed on 24 August 2022)] | A red alert is issued when the PM10 monitoring value is greater than 150 ug/m3. |
| Rule 2 | [(?x rdf:type http://www.owl-ontologies.com/E-CPS.owl#Noise (accessed on 24 August 2022))(?x http://www.owl-ontologies.com/E-CPS.owl#hasvalue (accessed on 24 August 2022) ?y)” + “greaterThan(?y,70)” + ”->(?x http://www.owl-ontologies.com/E-CPS.owl#conductalarm http://www.owl-ontologies.com/E-CPS.owl#Noise_alarm) (accessed on 24 August 2022)] | Noise warning is issued when the noise value is greater than 70 dB. |
| Rule 3 | [(?x rdf:type http://www.owl-ontologies.com/E-CPS.owl#PM10 (accessed on 24 August 2022))(?x http://www.owl-ontologies.com/E-CPS.owl#hasvalue (accessed on 24 August 2022) ?y) + “greaterThan(?y,150)” + “->(?x http://www.owl-ontologies.com/E-CPS.owl#hascontroller http://www.owl-ontologies.com/E-CPS.owl#Open-Envelop-Sprayequipment) (accessed on 24 August 2022)] | The enclosure spraying is open and dust reduction measures are taken when PM10 monitoring value is greater than 150 ug/m3. |
| Rule 4 | [(?x rdf:type http://www.owl-ontologies.com/E-CPS.owl#PM10_alarm_number (accessed on 24 August 2022))(?x http://www.owl-ontologies.com/E-CPS.owl#Performance_of_indicators (accessed on 24 August 2022) ?y) + “greaterThan(?y,1)” + “->(?x http://www.owl-ontologies.com/E-CPS.owl#Evaluation http://www.owl-ontologies.com/E-CPS.owl#unqualified) (accessed on 24 August 2022)] | The evaluation result of this indicator is unqualified when the number of PM10 warnings is greater than 1. |
| Equation | Parameter | Results |
|---|---|---|
| Equation (6) | ||
| Equation (7) | ||
| Equation (8) | ||
| Equation (9) | ||
| Equation (10) | ||
| Equation (11) | ||
| Equation (12) | . |
| Excellent | Qualified | Unqualified | |
|---|---|---|---|
| D-S evidence theory | 0 | 1 | 0 |
| Improved D-S evidence theory (Expert 1, Expert 2) | 0.4880 | 0.0241 | 0.4880 |
| Expert 3 | 0.9 | 0.1 | 0 |
| Improved D-S evidence theory (Expert 1, Expert 2, and Expert 3) | 0.9983 | 0.0016 | 0.001 |
| Excellent | Qualified | Unqualified | |
|---|---|---|---|
| Expert 1 | 0 | 0.9 | 0.1 |
| Expert 2 | 0.6 | 0.4 | 0 |
| Expert 3 | 0.75 | 0.25 | 0 |
| Expert 3′ | 0.8 | 0.2 | 0 |
| Improved D-S evidence theory | 0.9983 | 0.0016 | 0.001 |
| Excellent | Qualified | Unqualified | ||
|---|---|---|---|---|
| D-S evidence theory | m123 | 0 | 1 | 0 |
| m123′ | 0 | 1 | 0 | |
| Murphy | m123 | 0.397 | 0.602 | 0.01 |
| m123′ | 0.551 | 0.449 | 0 | |
| Improved D-S evidence theory | m123 | 0.8544 | 0.1456 | 0 |
| m123′ | 0.8837 | 0.1152 | 0 |
Publisher’s Note: MDPI stays neutral with regard to jurisdictional claims in published maps and institutional affiliations. |
© 2022 by the authors. Licensee MDPI, Basel, Switzerland. This article is an open access article distributed under the terms and conditions of the Creative Commons Attribution (CC BY) license (https://creativecommons.org/licenses/by/4.0/).
Share and Cite
Xu, Z.; Wang, X.; Niu, Y.; Zhang, H. Robust Simulation of Cyber-Physical Systems for Environmental Monitoring on Construction Sites. Appl. Sci. 2022, 12, 10822. https://doi.org/10.3390/app122110822
Xu Z, Wang X, Niu Y, Zhang H. Robust Simulation of Cyber-Physical Systems for Environmental Monitoring on Construction Sites. Applied Sciences. 2022; 12(21):10822. https://doi.org/10.3390/app122110822
Chicago/Turabian StyleXu, Zhao, Xiang Wang, Yumin Niu, and Hua Zhang. 2022. "Robust Simulation of Cyber-Physical Systems for Environmental Monitoring on Construction Sites" Applied Sciences 12, no. 21: 10822. https://doi.org/10.3390/app122110822
APA StyleXu, Z., Wang, X., Niu, Y., & Zhang, H. (2022). Robust Simulation of Cyber-Physical Systems for Environmental Monitoring on Construction Sites. Applied Sciences, 12(21), 10822. https://doi.org/10.3390/app122110822