Article

Mapping Mountain Landforms and Its Dynamics: Study Cases in Tropical Environments

by
Néstor Campos
1,*,
Adolfo Quesada-Román
2 and
Sebastián Granados-Bolaños
2,3
1
Laboratorio de Teledetección Ambiental (TeleAmb), Departamento de Ciencias Geográficas, Facultad de Ciencias Naturales y Exactas, Universidad de Playa Ancha, Avda. Leopoldo Carvallo 270, Playa Ancha, Valparaíso 2360002, Chile
2
Escuela de Geografía, Universidad de Costa Rica, San José 2060, Costa Rica
3
Department of Geosciences, University of Padova, Via Gradenigo 6, 35131 Padova, Italy
*
Author to whom correspondence should be addressed.
Appl. Sci. 2022, 12(21), 10843; https://doi.org/10.3390/app122110843
Submission received: 30 July 2022 / Revised: 27 September 2022 / Accepted: 24 October 2022 / Published: 26 October 2022
(This article belongs to the Special Issue Geographic Visualization: Evaluation and Monitoring of Geohazards)

Abstract

:
High mountain areas are critical for water security and natural hazard dynamics, as well as glacier and ecosystem conservation in a warming world. We present a brief account of the methodological steps for geomorphological mapping in mountain areas, including the required scale, the legends, technology, and software. We analyze the best imagery sources and their combination with fieldwork and geographical information systems (GIS), in performing accurate cartography. In addition, we present two case studies in which we apply several methods described previously. Firstly, we carried out a classical and digital geomorphological mapping of Cerro Chirripó (Talamanca Range). Secondly, we studied the Reserva Biológica Alberto Manuel Brenes (Central Volcanic Range), where we used UAVs to map high-resolution fluvial geomorphology. This methodological framework is suitable for future geomorphological surveys in mountain areas worldwide. Moreover, the case studies can give ideas on the application of these approaches to different mountainous environments.

1. Introduction

Cartography has become an essential instrument for scientific research. In a broad sense, cartography includes any activity in which the representation and use of maps has a basic interest, encompassing a group of techniques that reduces the spatial characteristics of a large area to expose it in the form of a map and to be observable [1] Geomorphological maps are an important factor in the prevention of natural risks such as floods, landslides, subsidence, volcanic and coastal hazards, among many others. In addition, geomorphological mapping is key to representing the distribution of landforms and the processes relating to their geomorphic environments. These maps are critical for studies related to the cryosphere, as well as for volcanic and structural terrains, providing constant new knowledge of its processes and changing dynamics.
There are several methodological procedures for geomorphological mapping. However, high mountain environments usually have a greater variety of geological formations, landforms, and soils. Moreover, many of these areas are inaccessible or difficult to access for fieldwork purposes. According to Verstappen [2], the more complex the terrain, the larger the variety of colors and symbols needed for its mapping. Thus, there is a probability that the chosen legend does not have enough elements to represent all the features of the study area. Therefore, more symbology elements are needed in many cases.
Topographic data calculation is key for several geomorphic applications, especially landform monitoring and evolution [3]. To monitor these landforms, structure from motion (SfM) is a photogrammetric approach that has become popular over recent years. SfM is a low-cost technique of 3D reconstruction of landforms, it automatically solves, by using iterative calculation algorithms, the problems of camera placing and scene arrangement, using common features in multiple overlapping images. Moreover, despite the fact that the automatic geomorphic determination has increased in the last years [4,5], there is a continuous need to classify, delineate and check in the field the obtained morphologies according to their genesis, dynamics, evolution, and age [6,7]. However, it is challenging to obtain remote sensing images with the same sensor type and spatial resolution [8].
During the last decade, the proliferation of unmanned aerial vehicles (UAVs), also called unoccupied aerial vehicles or remotely piloted aircraft systems (RPAS) [9], has resulted in the production of high-quality aerial imaging and high-precision digital elevation models (DEM). UAV are remotely controlled vehicles such as fixed-wing planes, helicopters, or multi-rotor platforms [10,11]. All this, together with the wide availability of high quality satellite images, has facilitated the observation and the monitoring of mountain landforms. Moreover, remotely-sensed data resolution is elemental in modern glacial settings. Spatial resolutions proportionate the landform size that can be mapped, and the research scope [12].
The treatment of UAV images may be accomplished with structure from motion (SfM) photogrammetry techniques, with any available software. Multitemporal UAV imagery will enable the measurement of the current state of potential landforms or the monitoring of them within short timescales (e.g., [13,14,15,16,17,18,19,20,21,22,23,24], among many others). To work with all these data, GIS software packages offer several tools for visualizing, manipulating and analyzing large amounts of remote sensing-and geomorphological data (e.g., [12,25,26,27]). These techniques can be applied to a wide range of studies, such as geomorphological, (e.g., [28,29,30,31]), and glaciological, (e.g., [32,33,34,35,36]).
There are a great diversity of landforms in high mountain areas, which are the result of intense processes related to deglaciation [30,37]. We hypothesize that a mountain geomorphology mapping protocol is a key tool in a warming-world scenario. The increasing exposure of mountain area inhabitants, plus geomorphic and climatic continuous changes, are sufficient justification for this review. The first aim of this work is to give a set of suggestions to mapping high mountain areas, and to provide resources to monitor high mountain landforms and processes. These methodological frameworks can be applied to other mountainous contexts around the world, in order to produce geomorphological maps for territorial planning, land use, tourism, and conservation purposes. The second aim of this work is to apply several of the methods described in two tropical areas of Costa Rica. The selected areas are in Cerro Chirripó (Talamanca Range,) and the Reserva Biológica Alberto Manuel Brenes (Central Volcanic Range).

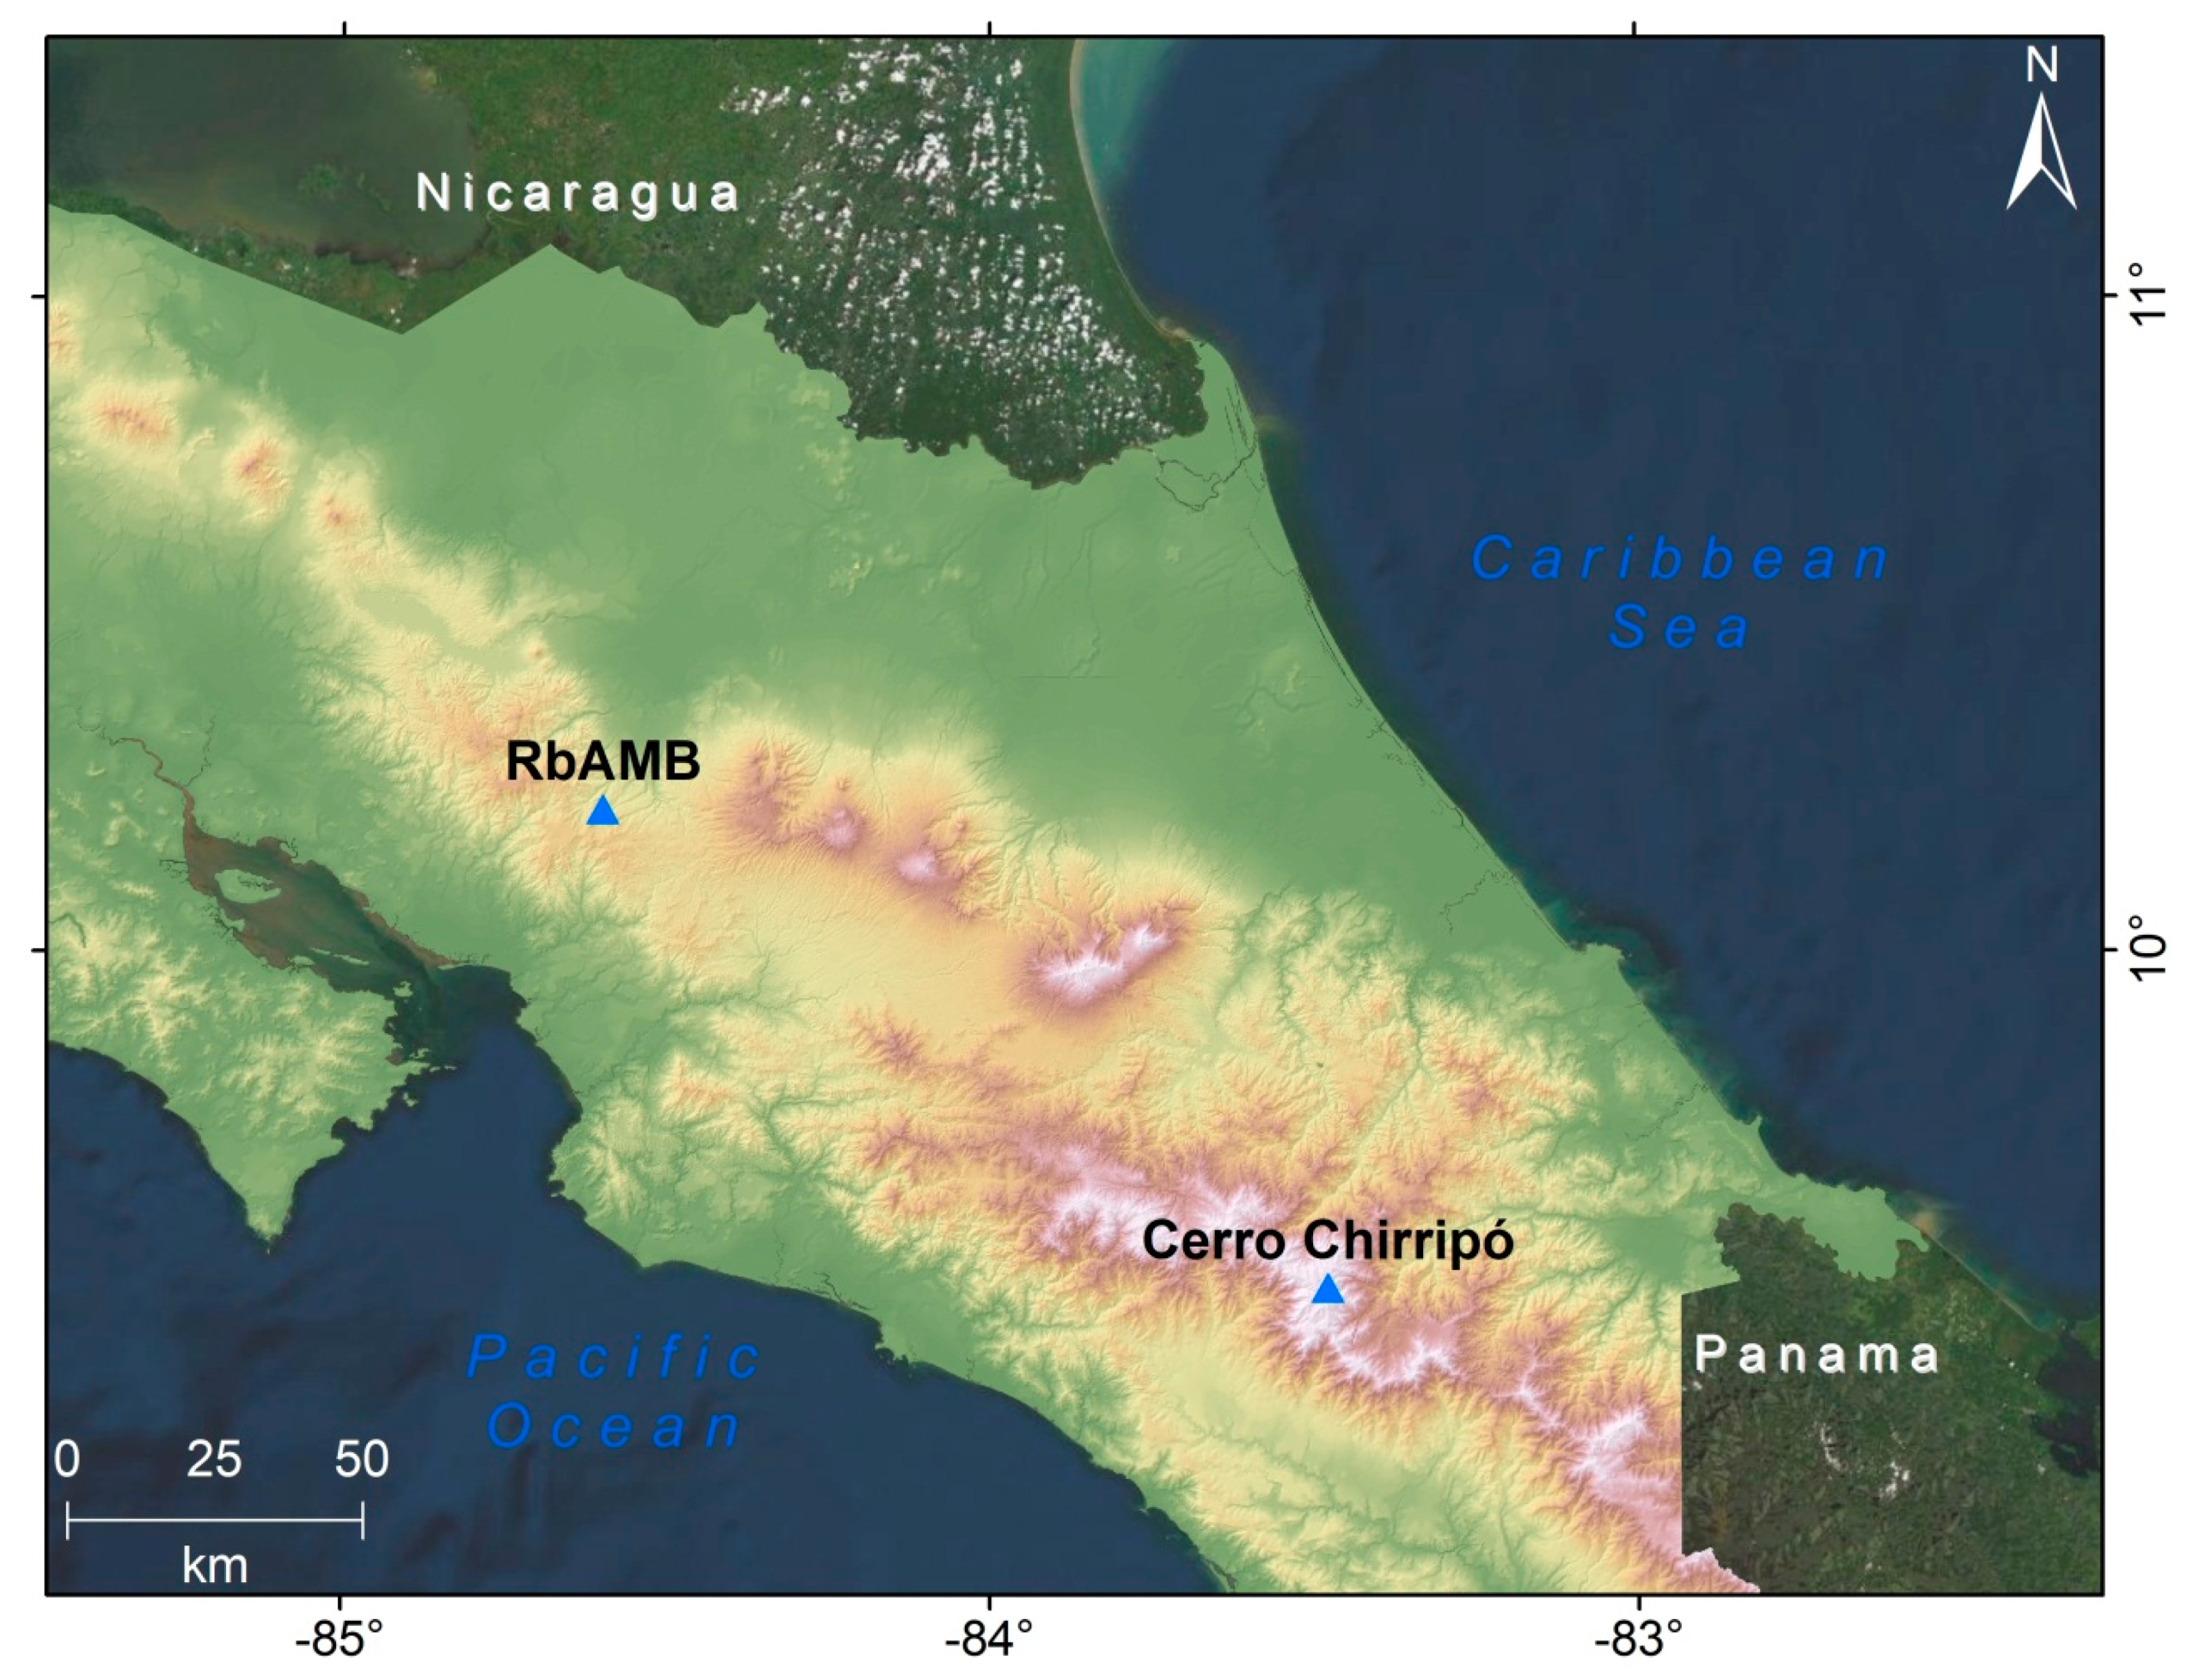
2. Application Test Sites

2.1. Cerro Chirripó

The highest summits of Costa Rica are key to understanding glacial landscape dynamics during the Last Glacial Maximum (LGM) in a tropical environment, the best example of the páramo ecosystem in Central America, as well as understanding its hydrological, climatological and soil aspects. The Talamanca Mountain Range is the site of most of the Costa Rican páramos (>90% of the total area covered by the biome), and the range is composed of Tertiary sediments with a thickness of probably several kilometers, intercalated with Tertiary volcanic and plutonic rocks ([38,39,40,41]; among others). According to Kappelle and Horn [42], the Talamanca Mountain Range is considered an uplifted, inactive segment of the Central American magmatic arc, composed of intrusive batholiths and plutonic stocks of quartz- diorites and monzonites with subordinate granites and gabbros. Cerro de la Muerte (formally known as the Buenavista Massif), with a maximum altitude of 3491 m.a.s.l., is a massif located on the northwestern part of the Talamanca Mountain Range. Moreover, Cerro Chirripó (3820 m.a,s.l.) is located in the central part of the mountain range, and comprises the most preserved paleoglacial landscapes of the LGM in Central America (Figure 1).

2.2. Reserva Biológica Alberto Manuel Brenes (RbAMB)

The biological reserve Alberto Manuel Brenes (RbAMB) is a pristine protected area located in the north basin of Costa Rica. This protected area of tropical forest flows into the San Lorencito basin, a steep, volcanic and dynamic tributary of the San Carlos River network basin. The San Lorencito catchment is a small (3.12 km2) pristine area that has been monitored since 2015 for fluvial geomorphology observations and tropical isotopic hydrology analysis [43,44,45]. The geology of the catchment is mainly composed of Pleistocene andesitic and basaltic rocks. The geomorphology is characterized by deeply incised V-form valleys and highly dynamic streams with cascade and step-pool channel morphology. The main channel of the San Lorencito stream has a length of 3.2 km and a mean river slope of 20.5° [45]. The elevation ranges from 870 m.a.s.l to 1470 m.a.s.l. The precipitation average is 2800 mm per year, while the maximum elevation of the catchment is 1470 m.a.s.l. and the minimum 870 m.a.s.l.

3. Procedures, Material and Methods

In this section, some of the most widely used procedures for mapping and monitoring landforms are presented. Firstly, we present several steps to carry out geomorphological mapping, focusing on the legend of the map. Secondly, we provide some indications to monitor the mapped landforms.

3.1. Mapping Procedures

In the mapping process, it is important to follow a careful methodology, otherwise time will be wasted retaking steps endlessly. We can divide the whole cartography process into three: pre-mapping, fieldwork, and post-mapping [46]. The first step is to choose the study area, and, depending on its extension and the desired detail, we will have to choose a suitable scale. Moreover, depending on the characteristics of the area or individual preferences, we will have to choose a legend that represents properly the geomorphic genetic groups, and the erosional/depositional landforms.
Ideally, the process of a cartographic map has to be accompanied by several fieldwork campaigns, before, during, and after the mapping process. As the access to some high mountain areas is complicated and expensive, the support of aerial imagery is essential. Preferably, geomorphological maps should be first completed as a draft, using satellite, aerial or even UAV imagery. The better the resolution of the images, the more quality the final map will have. There are available satellite imagery covers around the world. The most used satellite images for cartography in high mountain areas are those from the Landsat−8 (an American Earth observation satellite launched by USGS (United States Geological Survey) and NASA (National Aeronautics and Space Administration), Sentinel−1 and Sentinel−2 (launched by ESA—the European Space Agency—for the Copernicus Program). In addition, some countries have a national plan of aerial flights that offers high quality aerial images, usually provided by national agencies. During recent decades, radar, LiDAR, and UAV technology have growth in technology and accessibility, as well as cost, which significantly improves the imagery options. The second phase is fieldwork, which is composed of campaigns and is key to checking and corroborating the features drawn on the map. Later, in the office, previously detected features that can be corrected or that represent new ones that were discovered during the fieldwork, are reviewed. Finally, when the map is finished, another fieldwork campaign carries out the last checks, and makes corrections if necessary.

3.1.1. Scale

Depending on the required detail of the map, a specific scale for the cartography will be needed. According to Dumistrashko and Scholz [47] and Peña et al. [48], the denomination of geomorphological maps depends on the scale, starting from small scale (from 1:30,000,000 and smaller to 1:5,000,000/1:1,000,000), medium scale (from 1:1,000,000 to 1:500,000/1:100,000) and large scale (from 1:100,000 to 1:10,000 and bigger). The mapping process will depend on the scale used, a large-scale map being more detailed than a small-scale map, and consequently, more symbols will be needed in the legend.

3.1.2. Legend

The legend is one of the most important parts of a map, because it allows the identification of the geomorphological characteristics of the study area. The legend for a geomorphological map of a high mountain environment usually needs more symbols than for other areas [49]. One of the most used legends since the 1960s is the ITC Geomorphological System [50]. More recently, at the end of the 1980s a well-extended legend was the one from the Institute of Geography of the University of Lausanne (IGUL). The symbology and legend were designed by Schoeneich [51] at the end of the 1980s, and is used by many European legend schemes; it was created for a 1:10,000 scale, but it can be used on scales from 1:5000 to 25,000 [52]. As usual, in a geomorphological legend, there are standard categories for the geomorphic groups, such as gravitational, structural, weathering, fluvial, volcanic, glacial, periglacial, lacustrine landforms, and hydrography (Figure 2). Depending on the map, the legend will vary, according to the represented elements and the map theme. Some maps represent the landforms by using small variations of the most used legends, others create their own symbols or even maintain the original traces of the cartography (if it has been drawn by hand), thus giving the map a more artistic effect (Figure 3).

3.1.3. Software

There is a wide variety of software packages for preparing, digitalizing, editing and presenting digital cartography. The most used are ESRI ArcGIS in its ArcMap environment, Quantum GIS, and Adobe Illustrator/Photoshop for editing. Several legends provide layers of predefined symbols for some software packages, such as ArcGIS (i.e., IUGS or ICS for geology maps and IGUL legend for geomorphological maps). Once GIS and field mapping were merged, the analysis of complex geomorphological systems improved [25,30].

3.2. Monitoring Landforms

3.2.1. Solutions Based on UAVs

To monitor changes in landform surfaces, several approaches can be used. One of the most important procedures for monitoring landforms is the SfM. According to Micheletti et al. [3], conventional photogrammetric methods need the 3D position and position of the camera, or the 3-D position of ground control points to enable scene triangulation and reconstruction. SfM photogrammetry diverges from conventional photogrammetric methods, by setting internal automatic camera geometry, orientation and position, without a predefined set of ground control, evident points at known three-dimensional positions [53]. The SfM approach unravels the camera position and scene geometry instantaneously, using a highly redundant bundle correction for corresponding elements in several overlapping, offset images [3]. To apply this methodology, the use of UAVs is very common, due to the reduced costs and the possibility of covering large areas with high-precision outputs.

3.2.2. Solutions Based Entirely on Feature Tracking Software

There are several solutions to monitoring landforms based entirely on software image processing, such as CIAS, Co-Registration of Optically Sensed Images and Correlation (COSI-Corr) and image georectification and feature tracking toolbox (ImGRAFT), among many others. The photogrammetry software CIAS correlation image analysis [54,55] is used to derive the terrain feature displacement between two multi-temporal orthophotos, and is based on the normalized cross-correlation.
The COSI-Corr method was created at the California Institute of Technology (USA) for precise geometrical processing of optical satellite and aerial imagery [56]. It permits an automatic and accurate ortho-rectification and co-registration of satellite or aerial images [57]. The precise ortho-rectification process depends on the automatic generation of accurate GCPs, which are created from the correction of the viewing geometry of the detecting platform allowing accurate images with ortho-rectification and co-registration [57]. The horizontal ground movements are obtained from the subpixel correlation of the ortho-rectified images. The ImGRAFT method is a toolbox for georectification and feature tracking [58], and is a complete, yet adaptable, opensource package developed in MATLAB. This toolbox addresses and combines georectification and feature-tracking processes. Although ImGRAFT was primarily focused on terrestrial oblique images, several authors have used it with satellite imagery, with good results (e.g., [59,60]). There are also other methods which do not use automatic calculations, such as theodolite techniques, differential GPS and TLS (terrestrial laser scanner). These methodologies provide high accuracy, but their main drawback is the low automation of the method and the time required for its application.

3.3. Material and Methods

3.3.1. Classical and Digital Geomorphological Mapping

A geomorphic map is regularly achieved with a threefold approach, with a pre-mapping aerial photo interpretation, pursued by fieldwork, and finally a GIS post-mapping [12,61]. In this case, we depicted the paleoglacial geomorphic environments of the top summits of Costa Rica, which were molded during the LGM. Through pre-mapping, the geomorphological map was made using 1:25,000 scale aerial photographs of 2005 [62]. We georeferenced and treated the airborne imagery, to achieve the geomorphic mapping. The fieldwork was essential to confirm and review the data obtained in the previous pre-mapping aerial photo interpretation.
This approach permits the mapping of the various erosional and depositional glacial landforms [50], and digitally presents the final cartographic output [7]. The fieldwork was conducted during three fieldwork campaigns during 2016 and 2018, to confirm the morphology dynamics and boundaries using an initial morphogenetic chart. Throughout the post-mapping phase, the legend and the color election for each landform were genetically chosen [25], and the map was edited using ArcGIS 10.5.

3.3.2. UAV Parameters, Imagery Acquisition, Photogrammetric Processing, and Outputs

We present results regarding the use of UAVs in fluvial geomorphology, giving new insights into tropical river behavior, with a spatial high-resolution component. We used a low-cost UAV commercial model to map and monitor changes in this challenging environment, as traditional remote-sensing sources cannot give quality topographic information and imagery due to (i) vegetation coverage, and (ii) cloudiness.
The river reach was surveyed with a UAV platform (DJI Phantom 4 V.2) carrying a RGB camera of 1” CMOS 20M effective pixel resolution. The UAV was used for automated photogrammetric flights. The flight missions were programmed with an Android mobile application, DroneDeploy. Within the app, the flight velocity, extension, altitude, and front-side overlap (<80%) were programmed according to the environmental conditions. Since the surveyed sites are mountainous, the flight parameters were adapted to dense vegetation and high atmospheric humidity conditions, meaning low-altitude flights (>100 m from the takeoff site), and low velocity (>10 km/s) for the safety of the aircraft. Planning and executing the photogrammetric flight took under 20 min. Thirty-seven images were taken at 70 m flight altitude from the takeoff site. The flights surveyed 2.5 hectares. The photogrammetric processing produced an orthomosaic with a resolution of 2.6 cm/pixel and a DSM with a resolution of 10.6 cm/pixel. Two flights were performed with the same flight parameters. The first observation was executed on 14 August 2017 and the second on 21 September 2017.
To map the high-resolution fluvial geomorphology and change detection, the digital imagery obtained from the automated flight routes was centered on developing 3D surface models (DSM), elevation models (DEM), and 2D photogrammetric orthomosaics, using the structure from motion algorithm [63]. The method uses a set of covered images to produce densified point clouds to generate the elevation products [64]. The digital imagery was processed on the software Agisoft Photoscan 1.4.0. The SfM is based on a sequential step that assembles the images. Firstly, digital camera adjustments and ground control points (GCPs) were calibrated in the initial steps. Imagery arrangement of the images derives a scarce cloud that derives from the corresponding point process. The ground control points were surveyed with a Trimble R8s GNSS receiver and an Android mobile device during each flight mission in the same location. The locations were marked with spray paint, and corresponded to large boulders and nearby trees located in the survey area. Afterwards, the dense point cloud was created from the scarce cloud. Later, the densified point cloud was classified into separate points relating to ground, vegetation, or other structures.
The DSM, DEM and orthomosaic were used to map the fluvial geomorphology of the river reach. The photointerpretation of the digital outputs allowed the accurate delineation of the fluvial geomorphological features and the calculation of the morphological and morphometric data. Comparing both photogrammetric flights and using a Maximum Likelihood Classification on ArcMap 10.7 allowed the detection of accurate changes in the river, such as boulder transport, accretion, erosion, tree falling and turbulence changes within the channel [65]. Using the classification method proposed by Buffington and Montgomery [66], and Rinaldi et al. [67], channel morphology was analyzed for this single-thread, straight reach.

4. Results

4.1. Glacial Geomorphology Mapping and Analysis

Classical geomorphology represents a time-consuming technique which limits its use for scientific application/knowledge and art. On the one hand, classical geomorphology using aerial photogrammetry gives a closer glance and a detailed drawing of the different landforms and their dynamics (Figure 4). On the other hand, some details of these cartographic details, which depend highly on cartographer experience and drawing quality, are missing, due to the low flexibility of the digital cartographic tools (Figure 5). Nonetheless, digital geomorphological mapping definitely democratizes landform cartography performed by geomorphology specialists worldwide, due to the homogenization of its techniques.
Cerro Chirripó is a paleoglacial volcano-plutonic-shaped mountain with sharp and convex arêtes [68]. This summit symbolizes the top point in Costa Rica (c in Figure 4 and Figure 5; 3820 m.a.s.l.). It shows erosive morphologies produced by glacial dynamics. Other volcano-plutonic-formed mountainous landforms where sharp arêtes dominate their summits, alternate with volcanic hillslopes shaped by glacial dynamics, along with conserved glacial cirques and valleys near the summits [69].
There are also different sequences of glacial lakes entrenched in large till deposits because of the glacier advances throughout the LGM (b in Figure 4 and Figure 5). A series of lateral moraines are preserved in the national park defining the LGM expansion (a in Figure 4 and Figure 5; [6]). Other summits are encircled by volcanic slopes shaped by periglacial dynamics and strongly degraded glacial cirques. Periglacial dynamics such as nivation, frost action, frozen ground, weathering, and mass movement have shaped them (d in Figure 4 and Figure 5). At present, there are not any alpine glaciers, but some landforms remain, and they are protected by a national park [70].

4.2. High-Resolution Fluvial Geomorphology of a Humid Tropical and Pristine Reach

UAV surveying was used to map the fluvial geomorphology of a river reach within the San Lorencito catchment. The reach has a length of 280 m and a slope of 3.27°. This reach is near the main biological station used for hydrometric monitoring of rainfall and streamflow. The channel is characterized by an intercalation of straight single-thread step-pool and cascade-channel morphology. The step-pool repeating sequences are located within the mid-reach area, composed mainly of a jammed accumulation of boulders. The steps can easily be identified, with an increase of turbulence and abrupt elevation change within the channel. Meanwhile, the cascades, characterized by a chaotic arrangement of boulders, can be found on both extremes of the surveyed area. Slope is an important factor when delineating these step-pool/cascade areas; the first round is between 3–7.5% and cascade sections are higher than 7.5%. The elevation profile shown in Figure 6 clearly shows the slope and elevation changes in the reach, allowing the identification of a cascade morphology on the extremes of the survey and a step-pool within the middle section.
The elevation profile derived from the DEM also allowed the detection and then accumulation of sediment within the channel. Two small alluvial fans with an area ranging between 357 m2 and 125 m2 were identified. These small fans would be undetectable by satellite imagery, but the UAV allowed the detection of these small fans formed by hillslope tributaries. These two alluvial fans cause a slight elevation disruption in the channel, forming a step and leading to increased turbulence.
Another important aspect of the survey was the capability of estimating particle size of the boulders, ranging from an average diameter of 1–2 m to a maximum of 4.7 m. The survey also allowed the mapping of a fluvial island located downstream of the reach. This island has an oval morphology and an estimated area of 184 m2. The island causes a multi-thread small section, caused by the bifurcation of the stream.
We present a low-cost method for accurate monitoring of river dynamics. Figure 6 shows in a red rectangle (B), a monitored area for high-resolution channel changes. Slight sediment accumulation and transport dynamics were observed between the two observations. During these two observations, slight changes occurred in the channel; these modifications vary from boulder transport to sand-gravel accretion.
Figure 7 shows the change in the elevation profile during the monitoring period. The slight elevation variations are evidence of the transport of boulders. The elevation changes ranged from 40 cm to 63 cm. The survey was also capable of detecting a tree fall that exposed fine particle sediments (gravel-sand). This tree was located on the fluvial island described in Figure 6. The turbulence variations are related to a reorganization of the alluvium. An increase in boulders was observed during observation (B). This caused increased turbulence in the channel on the east side (downstream).

5. Discussion

5.1. Paleoglacial Morphology Mapping

The combination of GIS and field mapping permitted the performance of a map of paleoglacial morphologies of the high mountains of Costa Rica. Various authors have explored glaciated landscapes over 3000 m in Costa Rica since the XIX century [71]. In addition, geomorphological mappings were made with diverse scales and techniques, and served different purposes. Lachniet and Seltzer [72] studied the Late Quaternary glacial phases using fieldwork and airborne imagery analysis. They reconstructed an ice cap of 35 km2 in Chirripó National Park, and smaller glaciers on Cerro Kamuk, around Cerro de la Muerte, and probably other mountaintops over 3200 m. In addition, in the Chirripó area Li et al. [73] mapped glacial landforms of the massif by combining Google Earth high-resolution imagery, a 30 m Shuttle Radar Topography Mission (SRTM) digital elevation model (DEM), and field inspections to map 22.1 km2. Orvis and Horn [74] mapped landforms which indicated evidence of past glacial extent, to interpret moraine complexes and reconstructed glacier surfaces. Cunningham et al. [75] presented a study of the glacial constraint of tropical mountain height, and performed an LGM dating of Chirripó. Finally, Potter et al. [76] mapped glacial lakes, till deposits, moraines and horns in the nearby Cerro Chirripó, and dated a major glacial event which occurred in this area from ∼25 ka, roughly synchronic with the worldwide LGM.
The presented geomorphological map shows the glacially modeled areas of the top summits of Costa Rica during the LGM. As in other studies (e.g., [77,78]), the combination of field mapping, remote sensing and GIS technologies in the present study has been demonstrated to be a useful technique to carry out a geomorphological map of a high mountain area. Despite previous studies of the glacial morphologies of Cerro Chirripó, there was no detailed scale mapping of glacial and/or periglacial features, as shown in Quesada-Román et al. [68]. The classical geomorphology techniques provide a detailed analysis of the erosional and depositional morphologies. These approaches allow us to understand the LGM dynamics in the tropical highlands of Costa Rica, and can also provide the basis for different type of studies, i.e., geographical [73], ecological [79,80], hydrological [81,82,83], climatological [72,76], and geoheritage [70].

5.2. Downscaling Fluvial Geomorphology in Challenging Environments

The Use of low-cost UAV technology can allow the acquisition of large volumes of high-resolution data in a short time for the fluvial geomorphology analysis of reaches. In this case, the RbAMB has pristine primary forest coverage, which makes it impossible for satellite and airborne sensors to acquire quality elevation data and imagery [84]. Drones can be exceedingly useful in acquiring data for fluvial geomorphological purposes, while they give high-resolution elevation data and imagery that can be used for multiple purposes, such as channel morphology classification, river dynamics and surface processes analysis, hazard assessment, riverine vegetation analysis, morphometrics, hydraulic modelling and further purposes related to geosciences [11,31,85,86]. In mountainous steep river systems, especially relating to the humid tropics, remote sensing of rivers can be challenging, due to environmental conditions related to vegetation and cloudiness [87]. We presented in this research paper a low-cost alternative for mounting the mapping of streams and rivers with these characteristics, considering the rapid deployment ability of the technology and the quality of the data, which allows to perceive high-resolution changes in the channel. As mentioned by Granados-Bolaños et al. [11], UAV technology is rapidly evolving and becoming more accessible to geoscientists, and in the future decade will increasingly become a more utilized tool in geomorphology analysis; due also to its low-cost characteristics, it makes an excellent alternative for developing countries for surveying geomorphological features. When comparing UAV-derived photogrammetric products with other surveying methods such as piloted airborne missions, satellite imagery and, topographical stations, there is a clear difference in terms of the benefits related to spatial resolution of the elevation data. High-resolution terrain and surface models are key inputs when quantifying fluvial morphodynamic changes, especially in narrow streams such as the San Lorencito River [88] Regarding the acquisition of RGB imagery, satellite remote sensors do not provide quality data for analyzing the morphodynamic changes in this environment, due to (1) dense vegetation coverage, and (2) high cloudiness. The experimental observations performed with the UAV proved to be a strong asset for analyzing the fluvial processes.

5.3. Mountain Geomorphological Mapping Future Implications

Geomorphological maps are useful for planning and natural resources management, providing basic information of landscape biophysical and human uses [89]. Modern geomorphological maps are valuable resources for environmental applications such as landscape studies, due to their flexibility in using new technologies [90]. Hence, the use of classic geomorphology cartography supported by technologies such as GIS, aerial photos, automatic morphologies determination (i.e., geomorphons), topographic surveys, satellite images, LiDAR, and drones, will be the key to the future in a science that is the basis for environmental studies, natural risks, geoheritage, and land-use planning in mountain landscapes.

6. Conclusions

We presented a set of procedures for conducting geomorphological mapping in high mountain areas and the monitoring of the studied landforms, by combining field mapping and the use of GIS techniques. These areas are usually inaccessible for fieldwork, and the variety of the landforms is greater than in other areas. The proposed methodologies allowed the performance of better mapping of high mountain areas worldwide. We applied some of these procedures to develop a glacial geomorphology mapping of the highest summits of Costa Rica at Cerro Chirripó. In addition, we conducted a study and geomorphological mapping of a fluvial area of the Reserva Biológica Alberto Manuel Brenes, using UAV technologies. We agree with other authors that geomorphological maps are the baseline information for soil assessments, natural hazards mapping, and geoheritage evaluations, as well as for landscape and land-use planning. We also conclude that low-cost UAV surveying is a robust source of information for fluvial geomorphology analysis of reaches, especially in challenging environments such as humid tropical rainforests, where spaceborne and airborne sensors have great difficulty acquiring information regarding the river conditions. The UAV surveying and photogrammetric processing gives a clear example of how this type of technology can be deployed for geomorphological mapping of steep mountain river reaches.

Author Contributions

Conceptualization, N.C.; Data curation, S.G.-B.; Formal analysis, N.C. and S.G.-B.; Investigation, N.C. and A.Q.-R.; Methodology, S.G.-B.; Resources, A.Q.-R.; Supervision, N.C.; Validation, A.Q.-R.; Writing—original draft, N.C.; Writing—review & editing, N.C., A.Q.-R. and S.G.-B. All authors have read and agreed to the published version of the manuscript.

Funding

This research received no external funding.

Informed Consent Statement

Not applicable.

Conflicts of Interest

The authors declare no conflict of interest.

References

  1. Robinson, A.H.; Morrison, J.L.; Muehrcke, P.C.; Kimerling, A.J.; Guptill, S.C. Elements of Cartography; John Wiley and Sons Inc.: New York, NY, USA, 1995; 688p. [Google Scholar]
  2. Verstappen, H.T. Old and New Trends in Geomorphological and Landform Mapping. Dev. Earth Surf. Processes 2011, 15, 13–38. [Google Scholar] [CrossRef]
  3. Micheletti, N.; Chandler, J.H.; Lane, S.N. Structure from motion (SfM) photogrammetry. Chapter 2, Section 2.2. In Geomor-phological Techniques; Cook, S.J., Clarke, L.E., Nield, J.M., Eds.; Online edition; British Society for Geomorphology: London, UK, 2015; 12p. [Google Scholar]
  4. Jasiewicz, J.; Stepinski, T.F. Geomorphons—A pattern recognition approach to classification and mapping of landforms. Geomorphology 2013, 182, 147–156. [Google Scholar] [CrossRef]
  5. Giaccone, E.; Oriani, F.; Tonini, M.; Lambiel, C.; Mariéthoz, G. Using data-driven algorithms for semi-automated geomorphological mapping. Stoch. Hydrol. Hydraul. 2021, 36, 2115–2131. [Google Scholar] [CrossRef] [PubMed]
  6. Quesada-Román, A.; Castro-Chacón, J.P.; Boraschi, S.F. Geomorphology, land use, and environmental impacts in a densely populated urban catchment of Costa Rica. J. S. Am. Earth Sci. 2021, 112, 103560. [Google Scholar] [CrossRef]
  7. Bishop, M.P.; James, L.A.; Shroder, J.F.; Walsh, S.J. Geospatial technologies and digital geomorphological mapping: Concepts, issues and research. Geomorphology 2012, 137, 5–26. [Google Scholar] [CrossRef]
  8. Fan, R.; Hou, B.; Liu, J.; Yang, J.; Hong, Z. Registration of Multiresolution Remote Sensing Images Based on L2-Siamese Model. IEEE J. Sel. Top. Appl. Earth Obs. Remote Sens. 2020, 14, 237–248. [Google Scholar] [CrossRef]
  9. Hyun, C.-U.; Park, M.; Lee, W.Y. Remotely Piloted Aircraft System (RPAS)-Based Wildlife Detection: A Review and Case Studies in Maritime Antarctica. Animals 2020, 10, 2387. [Google Scholar] [CrossRef]
  10. Jordan, B.R. A bird’s-eye view of geology: The use of micro drones/UAVs in geologic fieldwork and education. GSA Today 2015, 25, 50–52. [Google Scholar] [CrossRef]
  11. Granados-Bolaños, S.; Quesada-Román, A.; Alvarado, G.E. Low-cost UAV applications in dynamic tropical volcanic landforms. J. Volcanol. Geotherm. Res. 2020, 410, 107143. [Google Scholar] [CrossRef]
  12. Chandler, B.M.P.; Lovell, H.; Boston, C.M.; Lukas, S.; Barr, I.D.; Benediktsson, Í.Ö.; Benn, D.I.; Clark, C.D.; Darvill, C.M.; Evans, D.J.A.; et al. Glacial geomorphological mapping: A review of approaches and frameworks for best practice. Earth-Sci. Rev. 2018, 185, 806–846. [Google Scholar] [CrossRef]
  13. Lucieer, A.; De Jong, S.M.; Turner, D. Mapping landslide displacements using Structure from Motion (SfM) and image correlation of multi-temporal UAV photography. Prog. Phys. Geogr. Earth Environ. 2013, 38, 97–116. [Google Scholar] [CrossRef]
  14. Ryan, J.C.; Hubbard, A.L.; Todd, J.; Carr, J.R.; Box, J.E.; Christoffersen, P.; Holt, T.O.; Scaioni, M.; Barazzetti, L.; Corti, M.; et al. Integration of Terrestrial and UAV Photogrammetry for The Assessment of Collapse Risk in Alpine Glaciers. ISPRS Int. Arch. Photogramm. Remote Sens. Spat. Inf. Sci 2018, XLII-3/W4, 445–452. [Google Scholar]
  15. Su, T.-C.; Chou, H.-T. Application of Multispectral Sensors Carried on Unmanned Aerial Vehicle (UAV) to Trophic State Mapping of Small Reservoirs: A Case Study of Tain-Pu Reservoir in Kinmen, Taiwan. Remote Sens. 2015, 7, 10078–10097. [Google Scholar] [CrossRef] [Green Version]
  16. Westoby, M.J.; Dunning, S.A.; Woodward, J.; Hein, A.S.; Marrero, S.M.; Winter, K.; Sugden, D.E. Sedimentological characterization of Antarctic moraines using UAVs and Structure-from-Motion photogrammetry. J. Glaciol. 2015, 61, 1088–1102. [Google Scholar] [CrossRef] [Green Version]
  17. Bernard, É; Friedt, J.M.; Tolle, F.; Griselin, M.; Marlin, C.; Prokop, A. Investigating snowpack volumes and icing dynamics in the moraine of an Arctic catchment using UAV photogrammetry. Photogramm. Rec. 2017, 32, 497–512. [Google Scholar] [CrossRef] [Green Version]
  18. Ely, J.C.; Graham, C.; Barr, I.D.; Rea, B.R.; Spagnolo, M.; Evans, J. Using UAV acquired photography and structure from motion techniques for studying glacier landforms: Application to the glacial flutes at Isfallsglaciären. Earth Surf. Processes Landf. 2017, 42, 877–888. [Google Scholar] [CrossRef] [Green Version]
  19. Fugazza, D.; Scaioni, M.; Corti, M.; D’Agata, C.; Azzoni, R.S.; Cernuschi, M.; Smiraglia, C.; Diolaiuti, G.A. Combination of UAV and terrestrial photogrammetry to assess rapid glacier evolution and map glacier hazards. Nat. Hazards Earth Syst. Sci. 2018, 18, 1055–1071. [Google Scholar] [CrossRef] [Green Version]
  20. Luo, L.; Ma, W.; Zhao, W.; Zhuang, Y.; Zhang, Z.; Zhang, M.; Ma, D.; Zhou, Q. UAV-based spatiotemporal thermal patterns of permafrost slopes along the Qinghai–Tibet Engineering Corridor. Landslides 2018, 15, 2161–2172. [Google Scholar] [CrossRef]
  21. Rossini, M.; Di Mauro, B.; Garzonio, R.; Baccolo, G.; Cavallini, G.; Mattavelli, M.; De Amicis, M.; Colombo, R. Rapid melting dynamics of an alpine glacier with repeated UAV photogrammetry. Geomorphology 2018, 304, 159–172. [Google Scholar] [CrossRef]
  22. Scaioni, M.; Crippa, J.; Corti, M.; Barazzetti, L.; Fugazza, D.; Azzoni, R.; Cernuschi, M.; Diolaiuti, G.A. Technical aspects related to the application of sfm photogrammetry in high mountain. ISPRS Int. Arch. Photogramm. Remote Sens. Spat. Inf. Sci. 2018, XLII-2, 1029–1036. [Google Scholar] [CrossRef] [Green Version]
  23. Chudley, T.R.; Christoffersen, P.; Doyle, S.H.; Abellan, A.; Snooke, N. High-accuracy UAV photogrammetry of ice sheet dynamics with no ground control. Cryosphere 2019, 13, 955–968. [Google Scholar] [CrossRef]
  24. Kyriou, A.; Nikolakopoulos, K.; Koukouvelas, I. How Image Acquisition Geometry of UAV Campaigns Affects the Derived Products and Their Accuracy in Areas with Complex Geomorphology. ISPRS Int. J. Geo-Infor. 2021, 10, 408. [Google Scholar] [CrossRef]
  25. Gustavsson, M.; Kolstrup, E.; Seijmonsbergen, A.C. A new symbol-and-GIS based detailed geomorphological mapping system: Renewal of a scientific discipline for understanding landscape development. Geomorphology 2006, 77, 90–111. [Google Scholar] [CrossRef] [Green Version]
  26. Gustavsson, M.; Seijmonsbergen, A.C.; Kolstrup, E. Structure and contents of a new geomorphological GIS database linked to a geomorphological map—With an example from Liden, central Sweden. Geomorphology 2008, 95, 335–349. [Google Scholar] [CrossRef] [Green Version]
  27. Napieralski, J.; Harbor, J.; Li, Y. Glacial geomorphology and geographic information systems. Earth-Science Rev. 2007, 85, 1–22. [Google Scholar] [CrossRef]
  28. Schoeneich, P.; Reynard, E.; Pierrehumbert, G. Geomorphological mapping in the Swiss Alps and Prealps. In Hochge-birgskartographie Silvretta’98. Wiener Schriften zur Geographie und Kartographie; Kriz, K., Ed.; Institut für Geographie der Universität Wien: Vienna, Austria, 1998; pp. 145–153. [Google Scholar]
  29. Otto, J.-C.; Smith, M.J. Section 2.6: Geomorphological mapping. In Geomorphological Techniques (Online Edition); Clarke, L., Ed.; British Society for Geomorphology: London, UK, 2013; ISSN 2047-0371. [Google Scholar]
  30. Campos, N.; Tanarro, L.M.; Palacios, D. Geomorphology of glaciated gorges in a granitic massif (Gredos range, central Spain). J. Maps 2018, 14, 321–329. [Google Scholar] [CrossRef]
  31. Koukouvelas, I.Κ.; Nikolakopoulos, K.G.; Zygouri, V.; Kyriou, A. Post-seismic monitoring of cliff mass wasting using an unmanned aerial vehicle and field data at Egremni, Lefkada Island, Greece. Geomorphology 2020, 367, 107306. [Google Scholar] [CrossRef]
  32. Pedraza, J.; Carrasco, R.M.; Domínguez-Villar, D.; Villa, J. Late Pleistocene glacial evolutionary stages in the Gredos Mountains (Iberian Central System). Quat. Int. 2013, 302, 88–100. [Google Scholar] [CrossRef]
  33. Carrasco, R.M.; Pedraza, J.; Domínguez-Villar, D.; Willenbring, J.K.; Villa, J. Sequence and chronology of the Cuerpo de Hombre paleoglacier (Iberian Central System) during the last glacial cycle. Quat. Sci. Rev. 2015, 129, 163–177. [Google Scholar] [CrossRef]
  34. Campos, N. Equilibrium Line Altitude Fluctuation on the South West Slope of Nevado Coropuna Since The Last Glacial Maximum (Cordillera Ampato, Perú). Pirineos 2015, 170, e015. [Google Scholar] [CrossRef] [Green Version]
  35. Pearce, D.M.; Ely, J.C.; Barr, I.D.; Boston, C.M. Glacier Reconstruction. In Geomorphological Techniques; British Society for Geomorphology: London, UK, 2017; p. 16. [Google Scholar]
  36. Campos, N.; Tanarro, L.M.; Palacios, D.; Zamorano, J.J. Slow dynamics in debris-covered and rock glaciers in Hofsdalur, Tröllaskagi Peninsula (northern Iceland). Geomorphology 2019, 342, 61–77. [Google Scholar] [CrossRef]
  37. Lambiel, C.; Maillard, B.; Kummert, M.; Reynard, E. Geomorphology of the Hérens valley (Swiss Alps). J. Maps 2015, 12, 160–172. [Google Scholar] [CrossRef] [Green Version]
  38. Weyl, R. Geology of Central America; Gebrüder Borntraeger: Berlin, Germany, 1980; 371p. [Google Scholar]
  39. Ballman, P. Eine Geologische Travese des Ostteils der Cordillero de Talamanca, Costa Rica (Mittelamerika); N. Jb. Geol.Palaont.Mh.: Stuttgart, Germany, 1976; pp. 502–512. [Google Scholar]
  40. Seyfried, H.; Astorga, A.; Calvo, C. Sequence stratigraphy of deep and shallow water deposits from an evolving Island Arc: The upper cretaceous and tertiary of Southern Central America. Facies 1987, 17, 203–214. [Google Scholar] [CrossRef]
  41. Wunsch, O.; Calvo, G.; Willscher, B.; Seyfried, H. Geologie der Alpinen Zone des Chirripó- Massives (Cordillera de Talamanca, Costa Rica, Mittelamerika). Profil 1999, 16, 193–210. [Google Scholar]
  42. Kappelle, M.; Horn, S.P. The Paramo ecosystem of Costa Rica’s highlands. In Costa Rican Ecosystems; Kappelle, M., Ed.; The University of Chicago Press: Chicago, IL, USA, 2016; pp. 492–523. [Google Scholar]
  43. Solano-Rivera, V.; Geris, J.; Granados-Bolaños, S.; Brenes-Cambronero, L.; Artavia-Rodríguez, G.; Sánchez-Murillo, R.; Birkel, C. Exploring extreme rainfall impacts on flow and turbidity dynamics in a steep, pristine and tropical volcanic catchment. Catena 2019, 182, 104118. [Google Scholar] [CrossRef]
  44. Birkel, C.; Correa, A.; Martinez-Martinez, M.; Granados-Bolaños, S.; Venegas-Cordero, N.; Gutiérrez-García, K.; Blanco-Ramírez, S.; Quesada-Mora, R.; Solano-Rivera, V.; Mussio-Mora, J.; et al. Headwaters drive streamflow and lowland tracer export in a large-scale humid tropical catchment. Hydrol. Process. 2020, 34, 3824–3841. [Google Scholar] [CrossRef]
  45. Birkel, C.; Barahona, A.C.; Duvert, C.; Bolaños, S.G.; Palma, A.C.; Quesada, A.M.D.; Murillo, R.S.; Biester, H. End member and Bayesian mixing models consistently indicate near-surface flowpath dominance in a pristine humid tropical rainforest. Hydrol. Process. 2021, 35, e14153. [Google Scholar] [CrossRef]
  46. Otto, J.C.; Prasicek, G.; Blöthe, J.; Schrott, L. GIS Applications in geomorphology. In Comprehensive Geographic Information Systems; Elsevier: Amsterdam, The Netherlands, 2018; pp. 81–111. [Google Scholar]
  47. Dumitrashko, N.V.; Scholz, E. Classification of geomorphological maps according to scale. In Guide to Medium-Scale Geomorphological Mapping; Demek, J., Embleton, C., Eds.; Czechoslovak Academy of Sciences: Prague, Czech Republic, 1978; p. 40. [Google Scholar]
  48. Peña, J.; Pellicer, F.; Chueca, J.; Julián, A. Leyenda para mapas geomorfológicos a escalas 1:25.000/1:50.000; Peña, J.L., Ed.; Cartografía Geomorfológica Básica y Aplicada: Logroño, Spain, 1997. [Google Scholar]
  49. Campos, N. Methodological procedures for glacier modeling and the calculation of the Equilibrium Line Altitude. Revista de Geografía Norte Grande 2020, 76, 321–350. [Google Scholar] [CrossRef]
  50. Verstappen, H.T.; Zuidam, R.V.; Meijerink, A.M.J.; Nossin, J.J. The ITC System of Geomorphologic Survey: A Basis for the Evaluation of Natural Resources and Hazards; ITC: Enschede, The Netherlands, 1991; p. 89. [Google Scholar]
  51. Schoeneich, P. Comparaison des systèmes de légendes français, allemand et Suisse. Principes de la légende IGUL. In Cartographie géomorphologiques, cartographie des risques; Schoeneich, P., Reynard, E., Eds.; Institut de Géographie, Travaux et Recherches: Lausanne, Switzerland, 1993; pp. 15–24. [Google Scholar]
  52. Reynard, E. Comparaison de Cartes géomorphologiques à Différentes échelles: Le cas de la vallée de la Morge. Cartographie Géomorpho-logique-Cartographie Des Risques; Institut de Géographie Lausanne: Travaux et recherches, 1993; Volume 9, pp. 25–30. [Google Scholar]
  53. Westoby, M.; Brasington, J.; Glasser, N.F.; Hambrey, M.J.; Reynolds, J.M. ‘Structure-from-Motion’ photogrammetry: A low-cost, effective tool for geoscience applications. Geomorphology 2012, 179, 300–314. [Google Scholar] [CrossRef] [Green Version]
  54. Vollmer, M. Kriechender alpiner Permafrost: Digitale photogrammetrische Bewegungsmessung. Ph.D. Thesis, Department of Geography, University of Zurich, Zürich, Switzerland, 1999. [Google Scholar]
  55. Kääb, A.; Vollmer, M. Surface geometry, thickness changes and flow fields on creeping mountain permafrost: Automatic ex-traction by digital image analysis. Permafr. Periglac. Processes 2000, 11, 315–326. [Google Scholar] [CrossRef]
  56. Leprince, S.; Ayoub, F.; Avouac, J. Earth Surface Monitoring with COSI-Corr, Techniques and Applications. AGU Fall Meeting Abstracts. 2009. Available online: https://ui.adsabs.harvard.edu/abs/2009AGUFMIN43D1171L (accessed on 3 August 2022).
  57. Leprince, S.; Ayoub, F.; Klinger, Y.; Avouac, J.-P. Co-Registration of Optically Sensed Images and Correlation (COSI-Corr): An operational methodology for ground deformation measurements. In Proceedings of the 2007 IEEE International Geoscience and Remote Sensing Symposium, Barcelona, Spain, 23–28 July 2007; pp. 1943–1946. [Google Scholar]
  58. Messerli, A.; Grinsted, A. Image georectification and feature tracking toolbox: ImGRAFT. Geosci. Instrumentation, Methods Data Syst. 2015, 4, 23–34. [Google Scholar] [CrossRef] [Green Version]
  59. Messerli, A.; Karlsson, N.B.; Grinsted, A. Brief Communication: 2014 velocity and flux for five major Greenland outlet glaciers using ImGRAFT and Landsat-8. Cryosphere Discuss. 2014, 8, 6235–6250. [Google Scholar] [CrossRef]
  60. Solgaard, A.M.; Messerli, A.; Schellenberger, T.; Hvidberg, C.S.; Grinsted, A.; Jackson, M.; Zwinger, T.; Karlsson, N.B.; Dahl-Jensen, D. Basal conditions at Engabreen, Norway, inferred from surface measurements and inverse modelling. J. Glaciol. 2018, 64, 555–567. [Google Scholar] [CrossRef] [Green Version]
  61. Smith, M.J.; Griffiths, J.S.; Paron, P. Geomorphological mapping: Methods and applications. Dev. Earth Surf. Processes 2011, 15, 589–593. [Google Scholar] [CrossRef]
  62. CARTA-Costa Rica Airborne Research and Technology Applications. Aerial Photographs Scale 1:25,000 of Costa Rica; NASA (USA); Costa Rica Government: Washington, DC, USA, 2005.
  63. James, M.R.; Chandler, J.H.; Eltner, A.; Fraser, C.; Miller, P.E.; Mills, J.; Noble, T.; Robson, S.; Lane, S.N. Guidelines on the use of structure-from-motion photogrammetry in geomorphic research. Earth Surf. Process. Landforms 2019, 44, 2081–2084. [Google Scholar] [CrossRef]
  64. Fonstad, M.A.; Dietrich, J.T.; Courville, B.C.; Jensen, J.L.; Carbonneau, P.E. Topographic structure from motion: A new development in photogrammetric measurement. Earth Surf. Process. Landforms 2012, 38, 421–430. [Google Scholar] [CrossRef] [Green Version]
  65. Carbonneau, P.E.; Dugdale, S.J.; Breckon, T.P.; Dietrich, J.T.; Fonstad, M.A.; Miyamoto, H.; Woodget, A.S. Adopting deep learning methods for airborne RGB fluvial scene classification. Remote Sens. Environ. 2020, 251, 112107. [Google Scholar] [CrossRef]
  66. Buffington, J.; Montgomery, D. Geomorphic classification of rivers. In Treatise on Geomorphology; Fluvial Geomorphology; Shroder, J., Wohl, E., Eds.; Academic Press: San Diego, CA, USA, 2013; Volume 9, pp. 730–767. [Google Scholar] [CrossRef]
  67. Rinaldi, M.; Gurnell, A.M.; del Tánago, M.G.; Bussettini, M.; Hendriks, D. Classification of river morphology and hydrology to support management and restoration. Aquat. Sci. 2015, 78, 17–33. [Google Scholar] [CrossRef]
  68. Quesada-Román, A.; Ballesteros-Cánovas, J.A.; Stoffel, M.; Zamorano-Orozco, J.J. Glacial geomorphology of the Chirripó National Park, Costa Rica. J. Maps 2019, 15, 538–545. [Google Scholar] [CrossRef] [Green Version]
  69. Quesada-Román, A.; Zamorano-Orozco, J.J. Geomorphology of the Upper General River Basin, Costa Rica. J. Maps 2018, 15, 94–100. [Google Scholar] [CrossRef] [Green Version]
  70. Quesada-Román, A.; Pérez-Umaña, D. Tropical Paleoglacial Geoheritage Inventory for Geotourism Management of Chirripó National Park, Costa Rica. Geoheritage 2020, 12, 1–13. [Google Scholar] [CrossRef]
  71. Quesada-Román, A. Peligros geomorfológicos: Inundaciones y procesos de ladera en la cuenca alta del río General (Pérez Zeledón), Costa Rica. Tesis de Maestría en Geografía con énfasis en Geografía Ambiental, Posgrado en Geografía. Universidad Nacional Autónoma de México, Mexico City, Mexico, 2016; 157p. [Google Scholar]
  72. Lachniet, M.; Seltzer, G. Late Quaternary glaciation of Costa Rica. Geol. Soc. Am. Bull. 2002, 114, 547–558. [Google Scholar] [CrossRef]
  73. Li, Y.; Tieche, T.; Horn, S.; Li, Y.; Chen, R.; Orvis, K. Mapping glacial landforms on the Chirripó massif, Costa Rica, based on Google Earth, a digital elevation model, and field observations. Revista Geológica de América Central 2019, 60, 109–121. [Google Scholar] [CrossRef]
  74. Orvis, K.H.; Horn, S.P. Quaternary Glaciers and Climate on Cerro Chirripó, Costa Rica. Quat. Res. 2000, 54, 24–37. [Google Scholar] [CrossRef]
  75. Cunningham, M.T.; Stark, C.P.; Kaplan, M.R.; Schaefer, J.M. Glacial limitation of tropical mountain height. Earth Surf. Dyn. 2019, 7, 147–169. [Google Scholar] [CrossRef] [Green Version]
  76. Potter, R.; Li, Y.; Horn, S.P.; Orvis, K.H. Cosmogenic Cl-36 surface exposure dating of late Quaternary glacial events in the Cordillera de Talamanca, Costa Rica. Quat. Res. 2019, 92, 216–231. [Google Scholar] [CrossRef]
  77. Quesada-Román, A.; Campos, N.; Alcalá-Reygosa, J.; Granados-Bolaños, S. Equilibrium-line altitude and temperature reconstructions during the Last Glacial Maximum in Chirripó National Park, Costa Rica. J. S. Am. Earth Sci. 2020, 100, 102576. [Google Scholar] [CrossRef]
  78. Quesada-Román, A.; Campos, N.; Granados-Bolaños, S. Tropical glacier reconstructions during the Last Glacial Maximum in Costa Rica. Rev. Mex. Cienc. Geol. 2021, 38, 55–64. [Google Scholar] [CrossRef]
  79. Horn, S. Timing of deglaciation in the Cordillera de Talamanca, Costa Rica. Clim. Res. 1990, 1, 81–83. [Google Scholar] [CrossRef]
  80. Veas-Ayala, N.; Quesada-Román, A.; Hidalgo, H.G.; Alfaro, E.J. Humedales del Parque Nacional Chirripó, Costa Rica: Características, relaciones geomorfológicas y escenarios de cambio climático. Rev. Biol. Trop. 2018, 66, 1436–1448. [Google Scholar] [CrossRef]
  81. Esquivel-Hernández, G.; Sánchez-Murillo, R.; Quesada-Román, A.; Mosquera, G.M.; Birkel, C.; Boll, J. Insight into the stable isotopic composition of glacial lakes in a tropical alpine ecosystem: Chirripó, Costa Rica. Hydrol. Process. 2018, 32, 3588–3603. [Google Scholar] [CrossRef]
  82. Esquivel-Hernández, G.; Mosquera, G.M.; Sánchez-Murillo, R.; Quesada-Román, A.; Birkel, C.; Crespo, P.; Célleri, R.; Windhorst, D.; Breuer, L.; Boll, J. Moisture transport and seasonal variations in the stable isotopic composition of rainfall in Central American and Andean Páramo during El Niño conditions (2015–2016). Hydrol. Process. 2019. [Google Scholar] [CrossRef]
  83. Esquivel-Hernández, G.; Sánchez-Murillo, R.; Vargas-Salazar, E. Chirripó hydrological research site: Advancing stable isotope hydrology in the Central American Páramo. Hydrol. Process. 2021, 35, e14181. [Google Scholar] [CrossRef]
  84. Woo, H.; Cho, S.; Jung, G.; Park, J. Precision forestry using remote sensing techniques: Opportunities and limitations of remote sensing application in forestry. Korean J. Remote Sens. 2019, 35, 1067–1082. [Google Scholar] [CrossRef]
  85. Langhammer, J.; Lendzioch, T.; Miřijovský, J.; Hartvich, F. UAV-Based Optical Granulometry as Tool for Detecting Changes in Structure of Flood Depositions. Remote Sens. 2017, 9, 240. [Google Scholar] [CrossRef] [Green Version]
  86. Loli, M.; Mitoulis, S.A.; Tsatsis, A.; Manousakis, J.; Kourkoulis, R.; Zekkos, D. Flood characterization based on forensic analysis of bridge collapse using UAV reconnaissance and CFD simulations. Sci. Total Environ. 2022, 822. [Google Scholar] [CrossRef]
  87. Hilker, T.; Lyapustin, A.I.; Tucker, C.J.; Sellers, P.J.; Hall, F.G.; Wang, Y. Remote sensing of tropical ecosystems: Atmospheric correction and cloud masking matter. Remote Sens. Environ. 2012, 127, 370–384. [Google Scholar] [CrossRef] [Green Version]
  88. Rusnák, M.; Sládek, J.; Kidová, A.; Lehotský, M. Template for high-resolution river landscape mapping using UAV technology. Measurement 2018, 115, 139–151. [Google Scholar] [CrossRef]
  89. Castillo-Rodríguez, M.; López-Blanco, J.; Muñoz-Salinas, E. A geomorphologic GIS-multivariate analysis approach to delineate environmental units, a case study of La Malinche volcano (central México). Appl. Geogr. 2010, 30, 629–638. [Google Scholar] [CrossRef]
  90. Seijmonsbergen, A.C. The Modern Geomorphological Map. In Treatise on Geomorphology; Elsevier: Amsterdam, The Netherlands, 2013; pp. 35–52. [Google Scholar] [CrossRef]
Figure 1. Location map of the study sites: Cerro Chirripó in south-east Costa Rica in the Talamanca Range and RbAMB (Reserva Biológica Alberto Manuel Brenes) in the north-west of the country in the Central Volcanic Range.
Applsci 12 10843 g001
Figure 2. Part of a geomorphological map (left) of La Covacha massif (Iberian Central System) from Campos et al. [30], with a scale 1:10,000. The legend (right) is a combination of those from the IGUL [51] and Peña et al. [48].
Applsci 12 10843 g002
Figure 3. Part of a Geomorphological map of Hofsjökull debris-covered glacier (Tröllaskagi Peninsula, Iceland) from Campos et al. [36] (Adapted with permission from Elsevier). This map was created by combining traditional cartography and Geographical Information System techniques, preserving the ‘hand drawn’ elements and distinguishing the geomorphological units of the glacier area.
Applsci 12 10843 g003
Figure 4. Classical glacial geomorphology of the Cerro Chirripó in Costa Rica. (a) Lateral moraine, (b) till deposits, (c) arêtes, (d) periglacial dynamics. More details and locations can be seen in Quesada-Román et al. [68] and Quesada-Román and Zamorano [69].
Applsci 12 10843 g004
Figure 5. Digital glacial geomorphology of Costa Rica’s top summits, which were glacially modeled during the LGM. (a) Lateral moraine, (b) till deposits, (c) arêtes, (d) periglacial dynamics. More details and locations can be seen in Quesada-Román et al. [68] and Quesada-Román and Zamorano [69].
Applsci 12 10843 g005
Figure 6. High-resolution fluvial geomorphology of a reach of the San Lorencito River. (A) Location of the survey site: the purple dot indicates the change detection location within the San Lorencito catchment, performed by the UAV surveying. (B) Geomorphological mapping of a river reach: the survey shows with accuracy the elevation and slope changes within the channel, allowing the identification of step-pool sections and cascades. The purple rectangle indicates the change detection within the San Lorencito river reach.
Applsci 12 10843 g006
Figure 7. Monitoring high-resolution changes in the San Lorencito River. The analysis of both surveys allowed the detection of slight and detailed channel changes; the elevation profile shows how several boulders have been transported during the observation period. (A) first observation 14 8 2017 and (B) second observation 21 September 2017.
Applsci 12 10843 g007
Publisher’s Note: MDPI stays neutral with regard to jurisdictional claims in published maps and institutional affiliations.

