Article

Estimation of Physicochemical Parameters and Vertical Migration of Atmospheric Radionuclides in a Raised Peat Bog in the Arctic Zone of Russia

N. Laverov Federal Centre for Integrated Arctic Research of Ural Branch of the Russian Academy of Sciences, 109 Severnoj Dviny Emb., 163000 Arkhangelsk, Russia
*
Author to whom correspondence should be addressed.
Appl. Sci. 2022, 12(21), 10870; https://doi.org/10.3390/app122110870
Submission received: 7 October 2022 / Revised: 21 October 2022 / Accepted: 22 October 2022 / Published: 26 October 2022
(This article belongs to the Section Earth Sciences)

Abstract

:
The article presents the results of a study of activity levels and features of the vertical distribution of 210Pb, 137Cs, 234U, 238U and their relationship with the physicochemical parameters of peat deposits. Analysis of the data showed that the vertical distribution of 137Cs and 210Pb was related to the content of water-soluble salts, the water saturation of the deposit, and the values of Eh (oxidation–reduction potential) and rH (relative humidity), which indicates a complex geochemical barrier at a depth of 20 cm in the peat core. The 210Pb dating of the peat core, carried out according to the CF model using the Monte Carlo method (to improve the dating accuracy), showed that the above horizon corresponded to 1963, which is consistent with the data of the 137Cs reference horizon and in terms of several physicochemical parameters (in particular, ash content) also corresponds to the age of 1963, which confirms the correctness and adequacy of the chosen peat core dating model. The peak of anthropogenic radionuclides in peat deposits correlates with a particular major event in the history of radioactive fallout, the Partial Nuclear Test Ban Treaty of 1963, providing a benchmark for geochronological research. The obtained results of the linear accumulation rate, the mass accumulation rate of the peat deposit, and the value of the atmospheric flux of 210Pb are congruent with the data on the peatlands of Northern Europe and the data obtained by earlier analysts of the Subarctic region of European Russia.

1. Introduction

Raised (ombrotrophic) peatlands, due to their predominant atmospheric feeding, are unique ecological archives, the study of which provides valuable information for understanding past ecological and climatic events [1,2,3,4]. The latter is especially important in connection with the growing interest in global climate change [5,6]. In addition to palaeoecological and paleoclimatic information, peatlands contain data on anthropogenic pollutant loads associated with the accumulation of a wide range of atmospheric pollutants, such as heavy metals and various organic pollutants [7,8,9]. With the beginning of the atomic era on the planet, peatlands also began to accumulate technogenic radionuclides and isotopes emitted into the atmosphere as a result of nuclear weapons tests and radiation accidents [10,11,12]. The study of radionuclides of atmospheric fallout in peatlands is, in addition to being a marker of the level of radiation impact on terrestrial ecosystems, the most important tool for understanding the chronology of peat, the development and productivity of a peat deposit over time, the studying of climate change, etc. [13,14,15]. The peatlands of Northern Europe are a repository of about 30% of the world’s soil carbon, so a correct understanding of the functioning and evolution of peat bog ecosystems, which are currently subject to destabilization due to technogenic pressure and global warming, is extremely important in assessing the redistribution of organic carbon fluxes in rivers and oceans [16,17,18]. The main radionuclide of atmospheric fallout used as an isotope marker in the study of peatlands is 137Cs [19,20,21,22,23]. It has a relatively long half-life of ~30 years, the highest activity among technogenic radionuclides and, subsequently, the highest dose load on biota and radiological hazard [24,25]. However, due to the relatively high bioavailability of 137Cs for marsh vegetation, 137Cs continuously moves towards the growing shoots of sphagnum moss, where it accumulates [14,26,27]. In this regard, the restoration of the exact chronology of peat using only 137Cs can be difficult [28]. The natural radionuclide 210Pb, which is continuously produced in the atmosphere during the radioactive decay of 222Rn, which is part of the 238U chain, is often used as an independent parallel geochronometer when studying the accumulation of peat deposits to verify data on artificial radionuclides [29,30,31]. It is assumed that the rate of 210Pb supply to the peatland surface is relatively constant, and the migration ability of 210Pb along the peat profile is very limited due to its chemical characteristics [29,32]. In this regard, in a peat deposit, as a rule, an exponential decrease in 210Pb activity down the profile is observed, which makes it possible, despite temporary fluctuations in the sedimentation rate, to obtain a fairly accurate and continuous chronological sequence of peat [33,34]. However, in recent years, some studies have noted that in some cases there is a deviation from the exponential decrease in 210Pb activity down the peat profile with activity peaks at different depths, which can lead to significant errors in estimating the age and rate of peat accumulation [21,35]. A possible reason for the increase in the rate of migration of 210Pb is the change in the physicochemical parameters of the peat deposit, which depend on the specific natural and climatic conditions of the area [36]. It is evident that seasonal variations in the geochemical parameters of peat deposits under the conditions of the Subarctic regions of Europe can be more significant than in the southern regions. A wider range of seasonal fluctuations in temperature, groundwater level (hydrological regime), redox and acid–base regimes, and the manifestation of cryogenic processes can significantly change the vertical distribution of 210Pb over the peat section. Therefore, it is extremely important, in addition to studying the activity levels and the vertical distribution of atmospheric radionuclides, to also evaluate the complex physicochemical parameters of peat deposits that affect the mobility and migration of isotopes. It should also be noted that even though peat bog ecosystems are the main biocenoses of the Subarctic region of European Russia [37], occupying vast areas, studies of radionuclides in peatlands of these territories are limited. Therefore, it is important to eliminate the lack of knowledge in the field of peatland radioecology for the region. Previously, the authors conducted research in this region [38]. This work is a natural continuation of the earlier studies.
This study, through the example of a peat section selected in the territory of the Arkhangelsk Region within the Ilassky peat massif, which is typical of the Subarctic region of European Russia, set two main tasks: i) to determine the activity levels and features of the vertical distribution of several radionuclides of atmospheric fallout, ii) to study the physicochemical parameters of the peat deposit to assess their impact on the migration of radionuclides in the conditions of the Subarctic region of European Russia. Among the radionuclides of atmospheric fallout, the following considerations were made: 137Cs as the most common technogenic radionuclide in nature have the greatest radiological impact on biota; 210Pb as potentially the least mobile radionuclide in a peat deposit, which makes it possible to reconstruct the chronology of peat; uranium isotopes 234U and 238U, as the most common among naturally occurring isotopes. Among the physicochemical parameters of peat, the contents of CO32−, ash components, organics, water-soluble salts, pH values of water and salt extracts, the degree of oxidation of organic matter, moisture saturation, and the contents of elements N, C, H and O were studied.

2. Materials and Methods

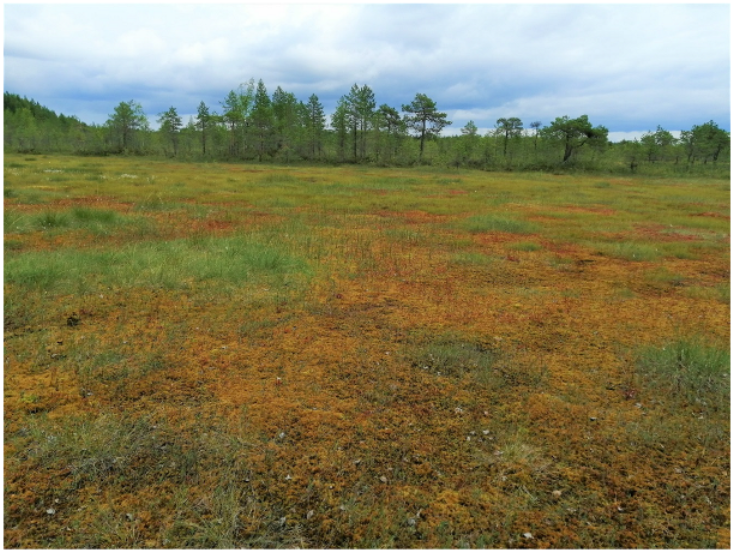
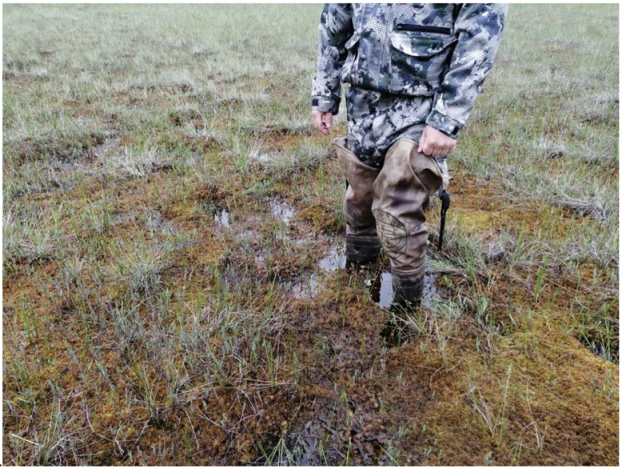
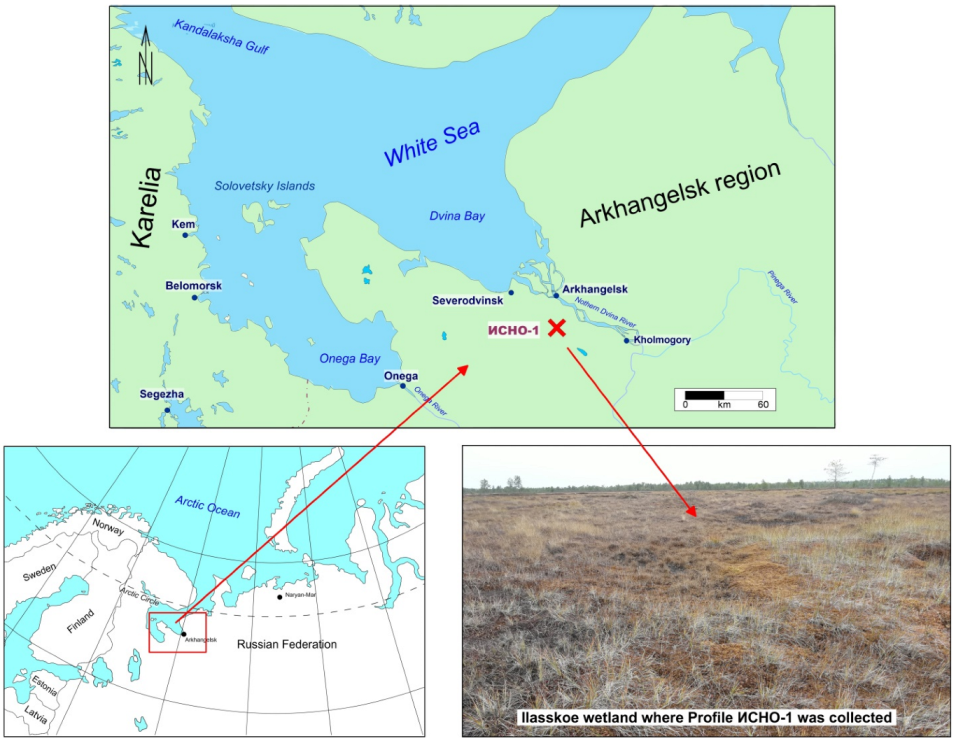
2.1. Study Area and Sample Collection

The selection of the ISNO-1 peat core (64°18′55.3′′ N 40°41′15.6′′ E) was carried out on 12 August 2020 within the large Ilassky bog massif, which is a typical representative of the raised bogs of the northern taiga (Belomorsky type), occupying more than 90% of the total area of the bogs in the Subarctic region of European Russia [39].
The Ilassky bog massif is located ~20 km south of the city of Arkhangelsk. The layout of the sampling site and photos of the bog surface are shown in Figure 1 (Appendix B).
The area belongs to the White Sea basin. Geomorphologically, the territory is represented by a water-glacier accumulative relief type with lacustrine-glacial plains. The relief of the territory was formed during several epochs of the Quaternary glaciation, the last of which ended about 11.7 thousand years ago. Peat formation began immediately after the disappearance of ice. The glacial deposits underlying peat bogs have a variegated lithological composition—sands, loams, pebbles, and sandy loams.
The climate is transitional from temperate maritime to subarctic. The average annual rainfall is 600–700 mm per year. Winter is long and cold, the number of days with snow cover is from 180 to 190 days, and the snow depth reaches 60 cm. Summer is cool and short with a frost-free period of 90 to 100 days [40].
The vegetation cover of the sampling area of the ISNO-1 peat profile makes it possible to identify this bog facies as a carpet facies without a pronounced microrelief. There is no tree layer in the study area. The herbaceous-shrub layer is composed mainly of vaginal cottongrass (Eriophorum vaginatum), marsh scheuchzeria (Scheuchzeria palustris), and common boletus (Andromeda polifolia). The moss-lichen layer is composed of several species of sphagnum mosses (Sphagnum majus, Sphagnum cuspidatum, Sphagnum balticum, Sphagnum medium) (Appendix B, Figure A1 and Figure A2).
The peat deposit at the sampling site of the ISNO-1 column has a thickness of 2.2 m. The deposit is homogeneous in botanical composition—it is composed of sphagnum mosses with a small admixture of cottongrass throughout the peat profile with an increase in its share in the bottom layer. The extent of degradation estimated in the field varies between 5–20% with increasing depth. The underlying rocks are moraine of light mechanical composition (sand, sandy loam). The groundwater level during the entire research season was at the level of 0–5 cm. Before taking a peat core in the field, measurements of the Eh of the peat deposit were carried out with depth gradation (Appendix B, Figure A3).
A peat core with undisturbed layering up to a depth of 49 cm was extracted using a PVC pipe. After delivery to the laboratory, the peat column was divided into layers of 2 cm, except for the uppermost layer of 0–3 cm, and prepared (drying, grinding) for further analytical procedures. A brief description of methods for determining the activity of radionuclides and physicochemical parameters is presented below.

2.2. Study of Physicochemical Parameters of Peat Samples

2.2.1. Determination of Active and Exchangeable Acidity

The assessment of the active and exchangeable acidity of peat was carried out according to GOST 11623-89 [41] (GOST is a State standard of the Russian Federation, here and further in the text) by potentiometric measurement of the pH value in an aqueous and potassium chloride peat suspension, respectively. Suspensions were prepared as follows. To a peat sample weighing 3 g, 75 mL of boiled distilled water (or a potassium chloride solution with a concentration of 1 mol/l and pH 5.5–6.0) was added and kept for 5 h with occasional stirring until complete wetting. After a specified time, pH was measured in the resulting suspensions on an Expert 001-3 liquid analyzer (Ekoniks, Russia) using an ESK-10603 combined glass electrode.

2.2.2. Determination of Water-Soluble Salts Content

The extraction of water-soluble salts from peat was carried out with distilled water at a hydromodulus of 1:25 according to GOST 28423-85 [42]. To a sample of peat weighing 3 g, 75 mL of distilled water was added and kept for 5 h with occasional stirring until complete wetting. After settling the suspension, the determination of the electrical conductivity and the content of water-soluble salts in water extracts was carried out on an ANION 4100 liquid analyzer (Infraspak-Analit, Russia) using a DKV-1 conductometric sensor.

2.2.3. Determination of the Mass Fraction of Organic Matter and Carbonates

A sample of peat weighing 2–3 g was weighed on an analytical balance (𝑚𝑠𝑎𝑚𝑝𝑙𝑒) and placed in a quartz crucible, previously brought to constant weight by calcination in a muffle furnace at 900 °C. Next, the crucible with the peat sample was sequentially calcined at 525 °C and 900 °C to a constant mass, which was fixed by weighing on an analytical balance. Calculation of LOI, % and CO32−, % was carried out according to the formulas:
L O I = m 525 m 900 · 100 m a . d . m .
where 𝑚525—mass of the crucible with the sample after calcination at 525 °C;
𝑚900—mass of the crucible with the sample after calcination at 900 °C;
𝑚𝑎.𝑑.𝑚.– the mass of an absolutely dry sample, calculated by the formula:
m a . d . m . = m s a m p l e · ( 100 W ) 100
where W—moisture content of the bottom sediment sample in %, determined according to GOST 28268-89 [43].
C O 3 2 = L O I 1.36
where LOI—ignition loss in %;
1.36—conversion factor.
Conversion   factor = M W   ( C O 3 2 ) M W   ( C O 2 ) = 60.01   g / mol   44.01   g / mol   = 1.36
Determination of the mass fraction of organic matter in peat samples was carried out by the gravimetric method according to GOST 26213-91 [44]. For this, the ash content in peat was preliminarily estimated according to GOST 27784-88 [45]. The mass fraction of organic (X) substances in % was calculated by the formula:
X = ( 100 m )
where 𝑚—mass fraction of ash content %.

2.2.4. Assessment of the Degree of Decomposition, Natural Moisture Content and Bulk Density of Peat

Determination of the degree of decomposition was carried out in samples with natural moisture and undisturbed structure by microscopy in transmitted light in 5 repetitions for each layer under study (0–10, 10–20 cm, etc.). The degree of decomposition was determined by the area occupied by decomposed particles in aqueous peat preparations on a glass slide. Plant remains were identified [46].
The natural moisture content was determined gravimetrically from the mass loss of samples with natural moisture during their drying in an oven at 105 °C.
The bulk density of peat was estimated by the gravimetric method for air-dry samples with a fractional composition of 0.5–2 mm. The determination was carried out by measuring the volume of samples using a graduated cylinder, followed by fixing their mass on technical scales in 5 replicates for each sample.

2.2.5. In Situ Determination of the Oxidation–Reduction Potential and pH of the Peat Profile

Determination of the oxidation–reduction potential (ORP) with gradation according to the depth of the peat deposit was carried out in the field using the method of direct potentiometry [47,48] on an EXPERT-001 universal liquid analyzer (Ekoniks, Russia) using the original probes developed by the authors based on the combined platinum redox electrode ERP-105 for measuring redox potential in liquid and heterogeneous media [42]. This method makes it possible to estimate the value of Eh directly in the deposit to a depth of 1 m, without extracting peat samples, which excludes the influence of atmospheric oxygen. Field determinations of pH were carried out using an ESK-10603 combined electrode in peat water squeezed out of peat, which was extracted using a P 04.09 stainless steel peat sampler (EIJKELKAMP, Amsterdam, the Netherlands) with appropriate (0–10, 10–20 cm, etc.) reservoir horizons. In parallel with the ORP measurement, the temperature of the peat deposit layer was recorded using a temperature probe made based on a TDS-3 metal temperature sensor. All measurements were carried out in triplicate. The recalculation of the obtained ORP results to standard conditions (t = 25 °C and pH = 4.0) was carried out according to formulas (1, 2) [48]:
Eh = E + 1970.76 ∗ (t25)
where E—measured ORP value, mV;
197—correction for a silver chloride saturated half-electrode to bring the reading to a normal hydrogen electrode at t = 25 °C, mV;
t—peat temperature at the time of measurement, °C;
Eh4 = Eh + 56.2(pH − 4)
Thus, redox potentials in the results section mean Eh4 unless explicitly stated otherwise.

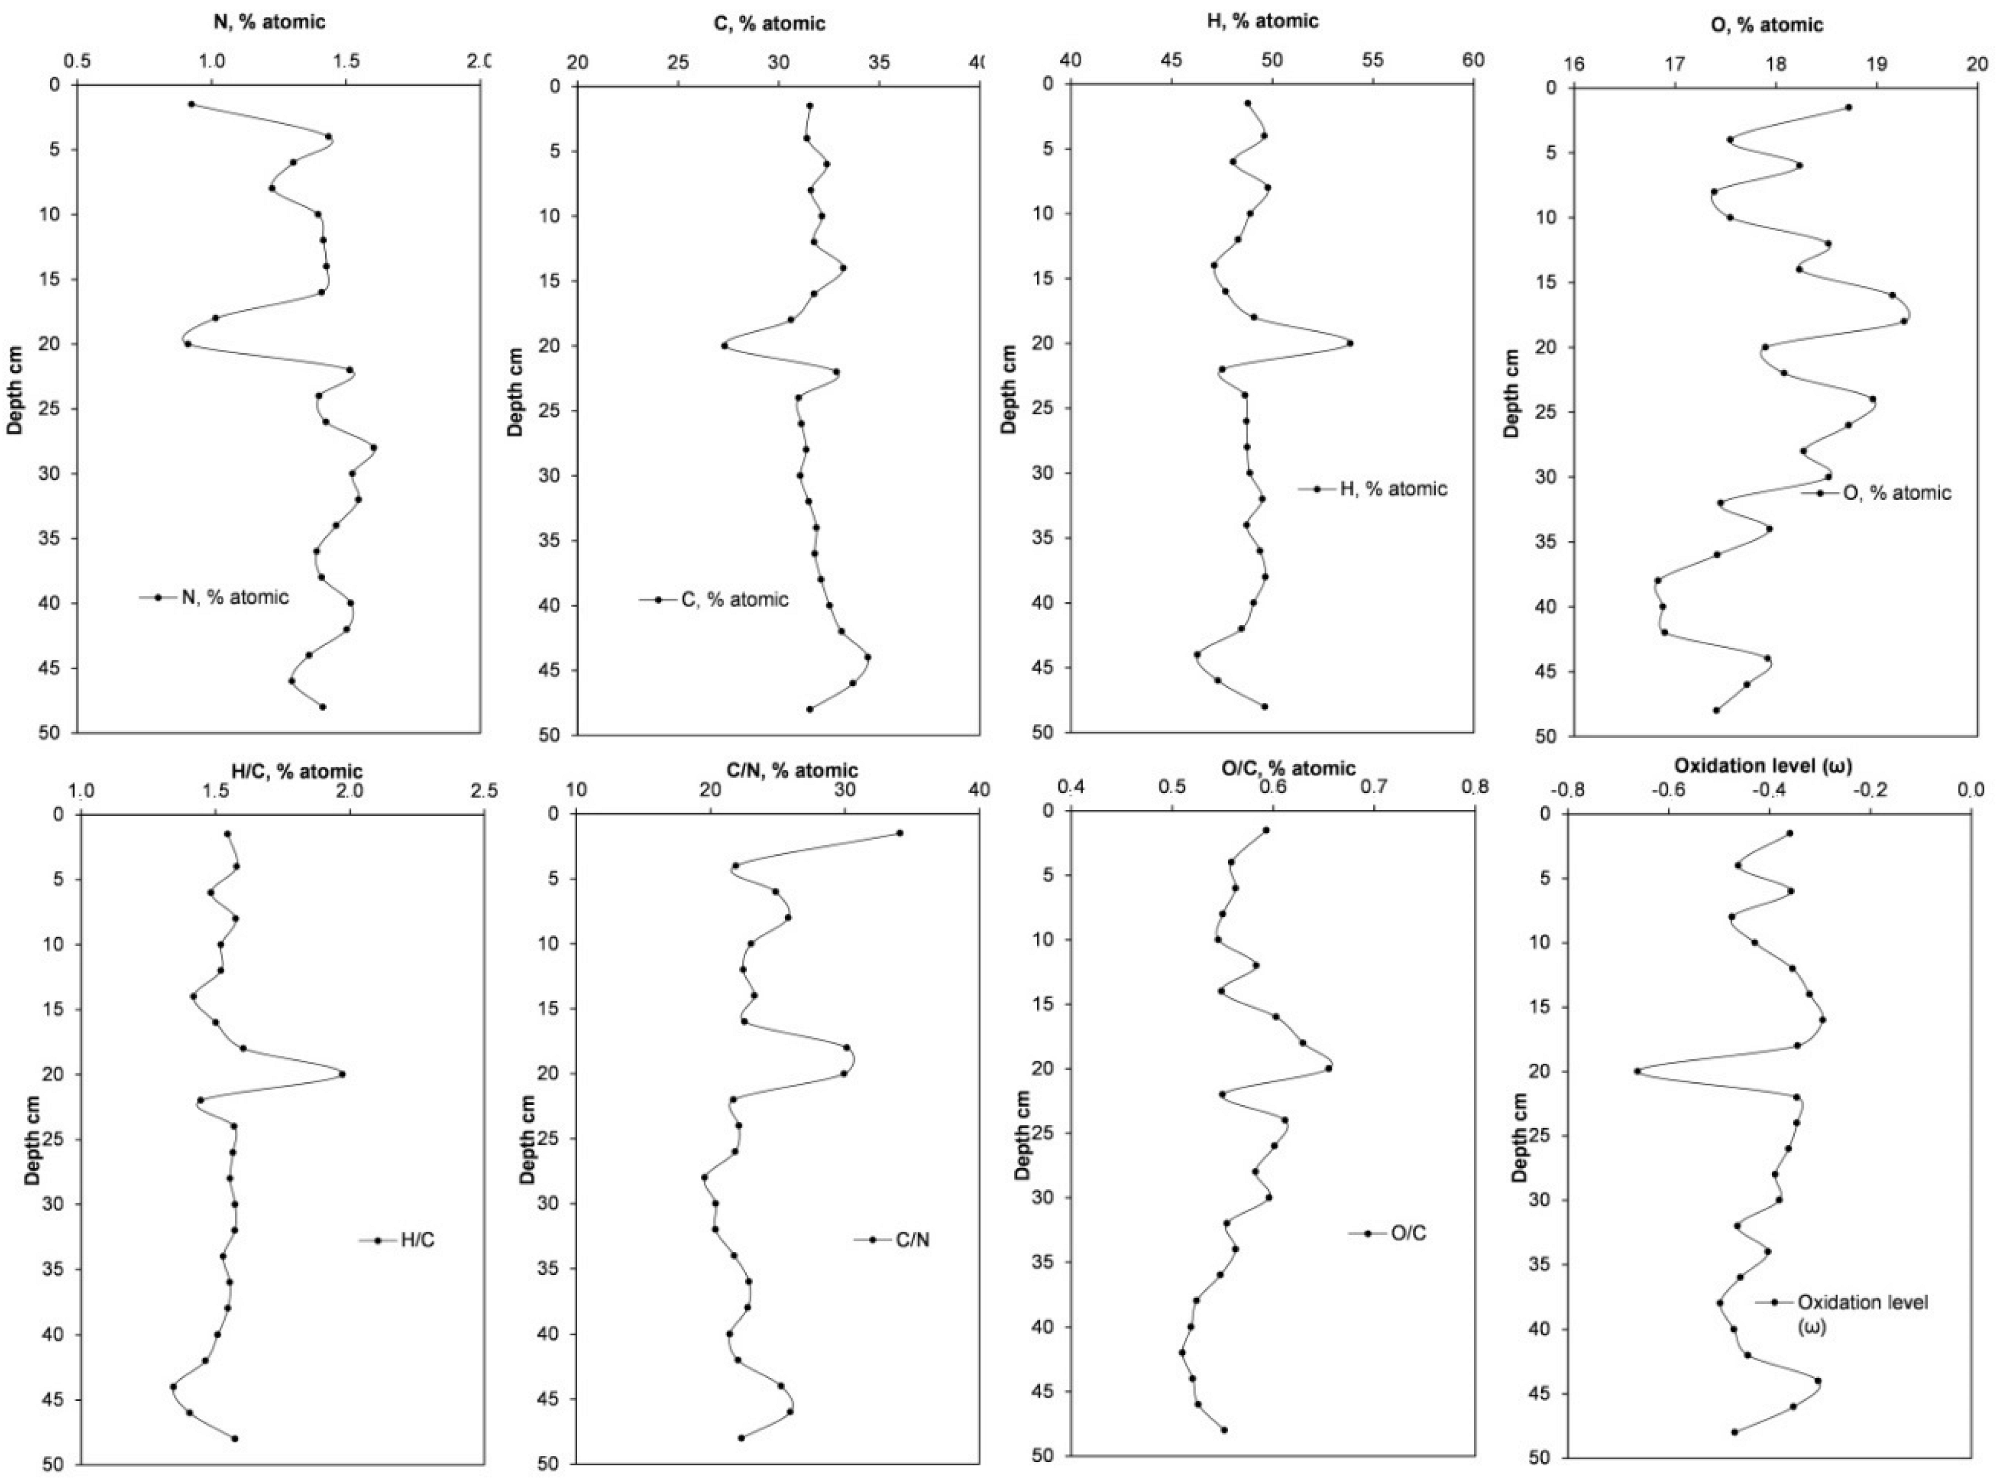
2.2.6. Determination of C, H, N and O in the Peat Profile

The content of C, H and N in three repeated subsamples was determined using a EuroEA 3000 CHN elemental composition analyzer (Eurovector, S.p.A.). The oxygen content was determined as the difference between the total mass and the sum of other elements. Then, the degree of oxidation (ω) of peat organic matter was calculated according to [49] using the formula:
ω = (2O − H)/C
where C, H and O—atomic percentages of these elements. The higher the value of the oxidation state (ω), the more stable the organic matter is to atmospheric oxygen.

2.3. Gamma Spectrometry Measurements

The 137Cs radionuclide was determined using a CANBERRA Packard (USA) low-background gamma-ray spectrometer with a GX2018 coaxial semiconductor detector based on a Ge(Li) crystal and Genie-2000 software. The resolution of the gamma spectrometer along the 1.33 MeV (60Co) line is 1.75 keV, and the relative efficiency is 22.4%.
The energy calibration of the detector, as well as the calculation of the detection efficiency, were carried out using volumetric measures of activity for special purposes (OMASN) in the geometry of a flat vessel with a volume of 0.1 litres of different densities (quartz sand, ion-exchange resin of the KU-2-8 type, sawdust) with a set of radionuclides 241Am, 109Cd, 88Y, 137Cs, 152Eu. The metrological characteristics of the indicated OMASN according to the calibration results meet the requirements for working standards of the 2nd category (uncertainty at k = 2 is not more than 4%). A flat vessel with a volume of 0.1 litres was chosen as the measurement geometry. The sample was measured for at least 18,000 s.
The specific activity of the 137Cs radionuclide was determined from the gamma radiation line 661.66 with a quantum yield of 89.90%, which belongs to its daughter radionuclide, 137mBa [50].
The minimum measurable activities at exposure t = 18,000 s for the geometry of a flat vessel with a volume of 0.1 litres for the GX2018 detector were 0.1 Bq for 137Cs.
The measurement uncertainty was no more than 10% (depending on the value of the specific activity of the radionuclide in the sample).

2.4. Determination of 210Pb and U Isotopes

To determine 210Pb, a sample of peat weighing 5 g was decomposed by heating HNO3 and H2O2. After decomposition, HCl (1:2) was leached by boiling for 1 h. The leachate was filtered through a blue-ribbon filter; the filter was washed with hot HCl (1:4). Then, the residue together with the filter was leached with HCl (1:2) and H2O2 by boiling for 30 min. The solution was then filtered, and the filter was washed as above. HClO4 was added to the combined filtrate and evaporated to wet salts, which were further dissolved by boiling in concentrated HCl and decolourised with ascorbic acid. Isolation of 210Po and 210Bi isotopes from a solution was carried out by electrochemical deposition on a steel disk, which was boiled for 2 h. The resulting counting sample was measured 10 h after its preparation for the decay of the daughter alpha and beta emitters (218Po, 214Po, 216Po, 212Po; 210Bi and 210Bi) on the Abelia alpha-beta radiometer [51,52].
To determine 234U and 238U, a sample of peat weighing 5 g was ashed in a muffle furnace at a temperature of 600 °C. After incineration, a tracer of 1 cm3 of a solution of the RIK-232 radioisotope tracer containing 232U was added to the sample. Then, the sample was decomposed with concentrated acids 1:4 HClO4 and HF while heating. Radiochemical purification of uranium from 210Po, 226Ra, and 230Th co-precipitated with it was carried out by extraction with tributyl phosphate from 7M HNO3 [53]. Further, purified uranium isotopes were deposited on steel disks by the electrolytic method for 30 min at a constant current of 2 A. The preparations obtained were measured on alpha spectrometers with semiconductor silicon detectors Progress and Multirad-AS (NPP Doza, Russia).

2.5. 210Pb Dating of the Peat Core

For 210Pb dating, the authors applied the constant flux (CF) model using the Monte Carlo simulation method. This model is better known by its second name, the constant rate of supply CRS model [54]. For the CF (CRS) model, the fundamental hypothesis is that the flux of 210Pbex to the sediment surface is constant and does not depend on the rate of accumulation of the dry mass of peat [55].
For this model, the authors followed the calculation procedure recommended by [55] and applied the practical calculation method [56], paying particular attention to dependent variable issues when estimating errors. Due to the complex distribution of 210Pb across the peat section, associated with a non-exponential decrease in 210Pb activity, the authors followed the additionally described fitting method for the data set [35].

3. Results and Discussion

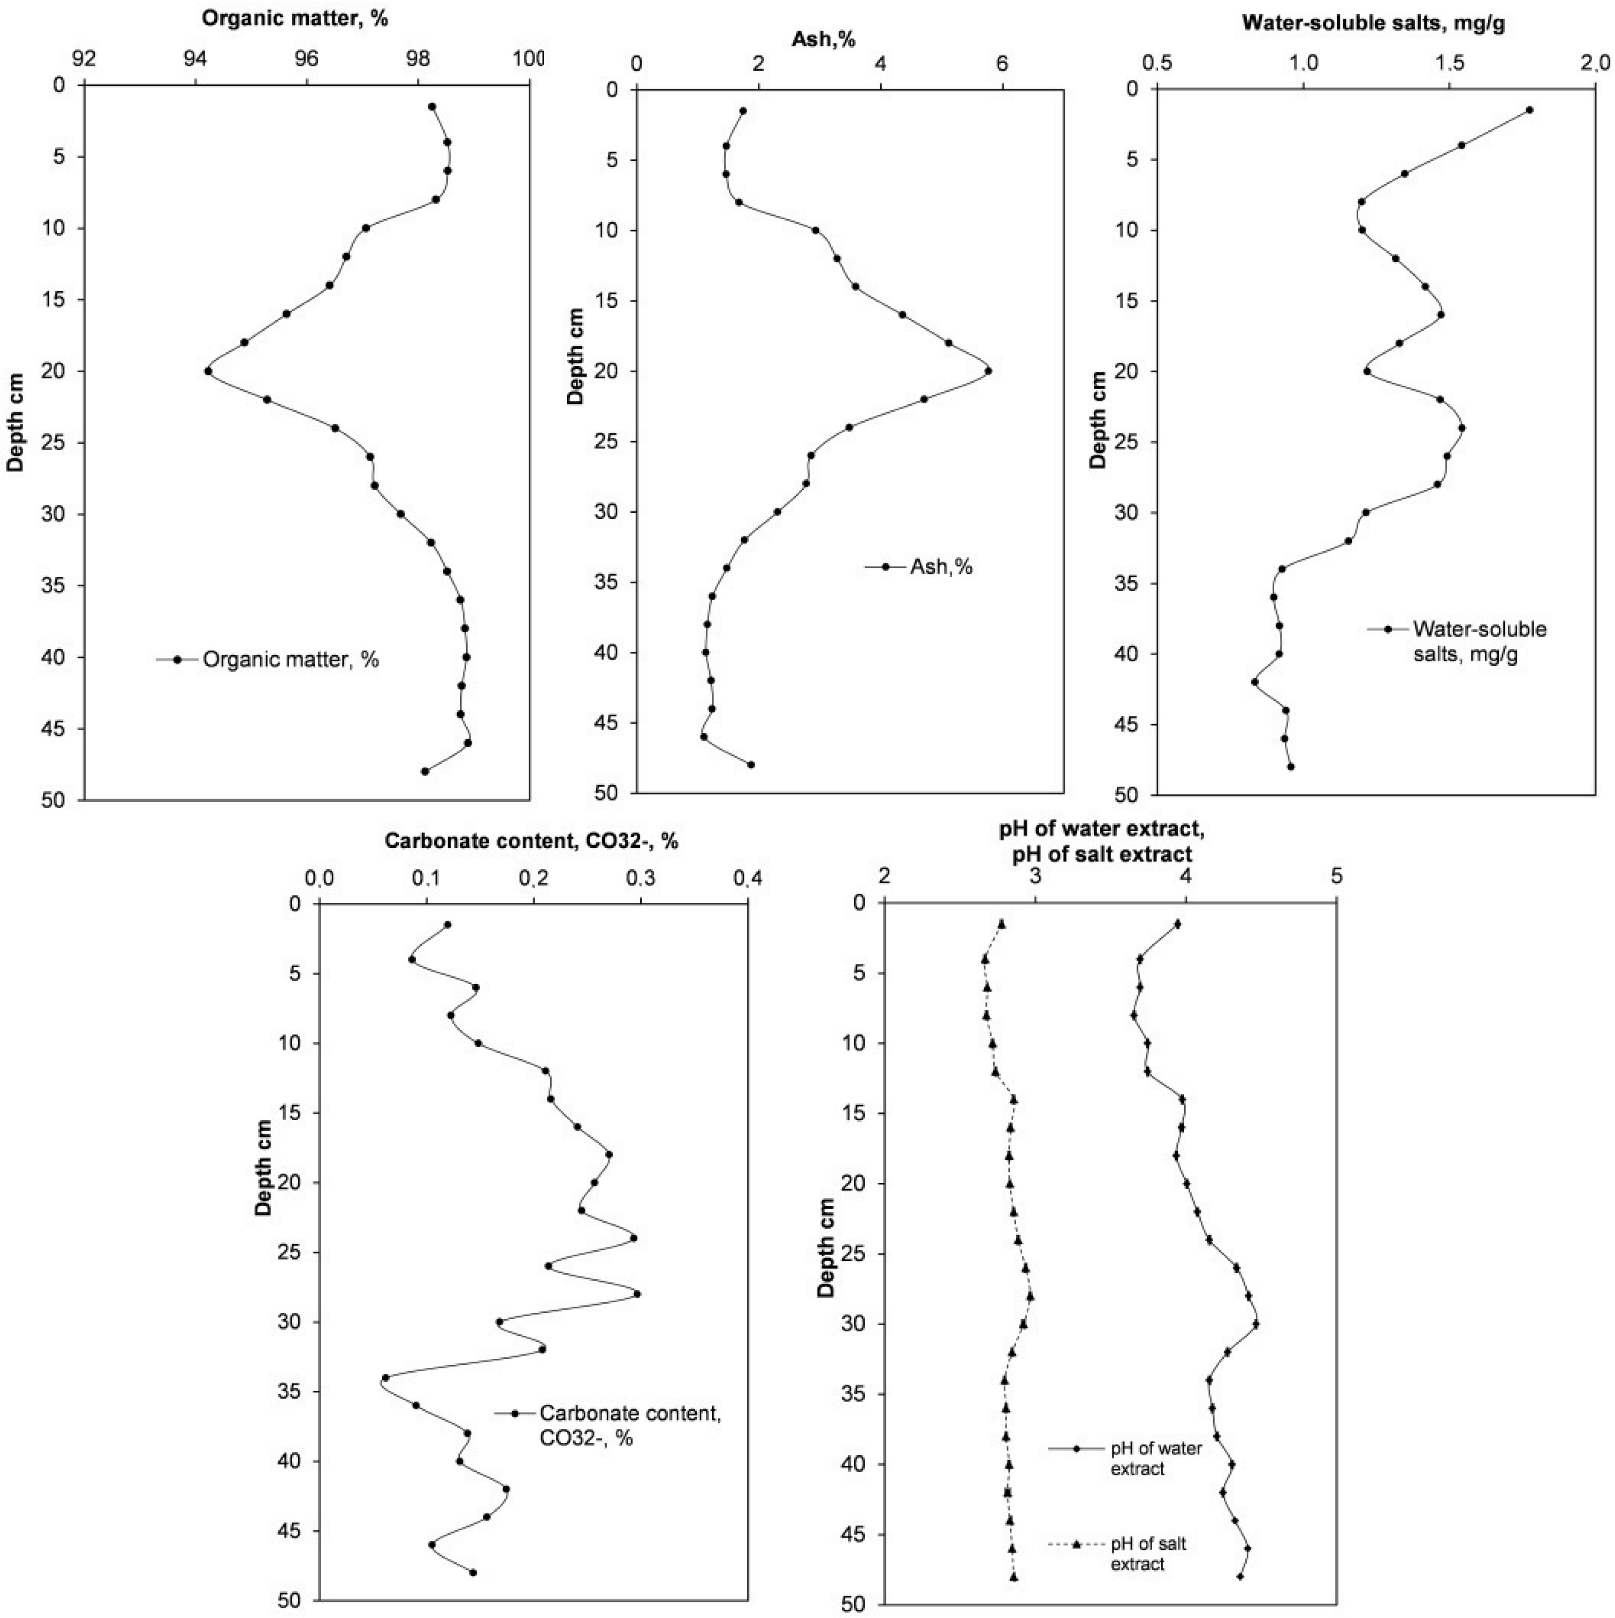
3.1. Physicochemical Characteristics of the Peat Profile

The values of active acidity in the studied peat profile vary from 3.66 to 4.47, while the exchangeable acidity is in a more acidic pH range, 2.67–2.97. According to the data obtained, the studied peat can be attributed to the strongly acidic group, since the pH values are below 4.5. The acidity of peat is due to the presence of free acids, in particular acetic, formic, oxalic, lactic, and other acids [47]. In the vertical distribution of active and exchangeable acidity, a slight decrease with depth is observed.
The content of carbonates in the peat of the studied section is insignificant and is in the range of 0.06–0.30%. The graph of the vertical distribution of carbonate concentration shows a non-monotonic increase in CO32− up to a depth of 25 cm, followed by a gradual decrease.
The value of the ash content index for the studied peat profile is in the range of 1.10–5.77%. The obtained values make it possible to classify the peat deposit as a low-ash type, since the ash content, in general, does not exceed 6%. In the vertical distribution in the 19–21 cm horizon, there is a maximum content of ash components, which is probably due to the leaching of ash components from the surface layers of peat and their concentration in this layer. Anthropogenic impact, manifested in the past, can also be the reason for the jump in the ash content. Below a depth of 19–21 cm, there is a tendency for a nonmonotonic decrease in concentrations when moving to deeper layers of the profiles, which is associated with the atmospheric type of feeding of the bog. According to several studies, peat ash consists of 98–99% oxides of silicon, aluminium, iron, calcium, magnesium, sodium, phosphorus, and sulphur [47]. The reverse indicator of ash content, the proportion of organic matter, increases from a depth of 19–21 cm and is at a level of more than 90%, which indicates a low degree of decomposition of high-moor peat [57].
The content of water-soluble salts is in the range of 0.84–1.78 mg/g. The maximum concentration of salts is observed in the uppermost layer of peat. Below the section, there are several peaks in the content of water-soluble salts at depths of 15–17 cm and 23–25 cm.
The results obtained make it possible to attribute the studied peat to the acidic facies of oligotrophic peat soils [58]. According to the obtained experimental results, the studied part of the profile of the peat deposit is composed mainly of sphagnum peat. The structurally sensitive parameters of peat—the degree of decomposition (R) and bulk density (Table 1) gradually increase with depth and are in the ranges of 0–7% and 0.075–0.109 g/cm3 undisturbed state [59,60]. The natural moisture content is in the range of 15–24 g/g and decreases with depth, which is partly due to the gradual compaction of the porous structure of peat when moving from the surface, deep into the deposit. The dynamics of changes in the Eh4 and rH values (Table 1) along the depth of the studied part of the peat profile (acrotelm and upper part of the cathotelm) indicate the presence of a contrasting redox regime, in which moderately oxidising conditions are gradually replaced by an intense reduction in oxidising conditions. This is due to the peculiarities of the aeration of the deposit and the level of swamp water fluctuations, which during the sampling period (spring-autumn period 2021) was in the range of −25–0 cm. See more Appendix A, Table A1.
The relative content of the main elements in the organic matter of peat was 0.9–1.6 (N); 27.3–34.4 (C); 46.3–53.9 (H); 16.8–19.3 (O) atomic %, which is generally typical for the biomass of bog vegetation and peat with a low degree of decomposition (Figure 2).
The H/C value is in the range 1.3–2.0, which indicates a clear predominance of aliphatic structures in the organic part of peat (H/C > 1) [61]. The value of the H/C parameter does not change monotonously with depth in the studied part of the deposit, which indicates a slight increase in the proportion of aromatic fragments in organic matter along the vertical profile of the deposit. At the same time, a pronounced peak of the H/C ratio is observed at a depth of 20 cm, which indicates a high content of the aliphatic component with the organic matter of this horizon, probably associated with the supply of low molecular weight organic acids by leaching from the overlying stratum.
The C/N ratio is 20–34, which is also typical for moss-type peat [62]. The degree of oxidation of organic matter (ω) is in the range of −0.66–−0.29 and also varies non-linearly along the depth of the profile, which is apparently associated with the occurrence of multidirectional redox processes, vertical transfer of organic matter in deposits, and dynamics of swamp water level fluctuations. At the same time, the minimum value of this indicator falls on the horizon of 20 cm, which is also distinguished in the section by significant fluctuations in the parameters of ash content, the content and composition of organic matter (Figure 3). The maximum ash content for the 20 cm horizon can be due to both the washing out of the mineral part from the overlying horizons and the anthropogenic dust content of the atmosphere during the formation of the peat deposit. See more Appendix A, Table A3.

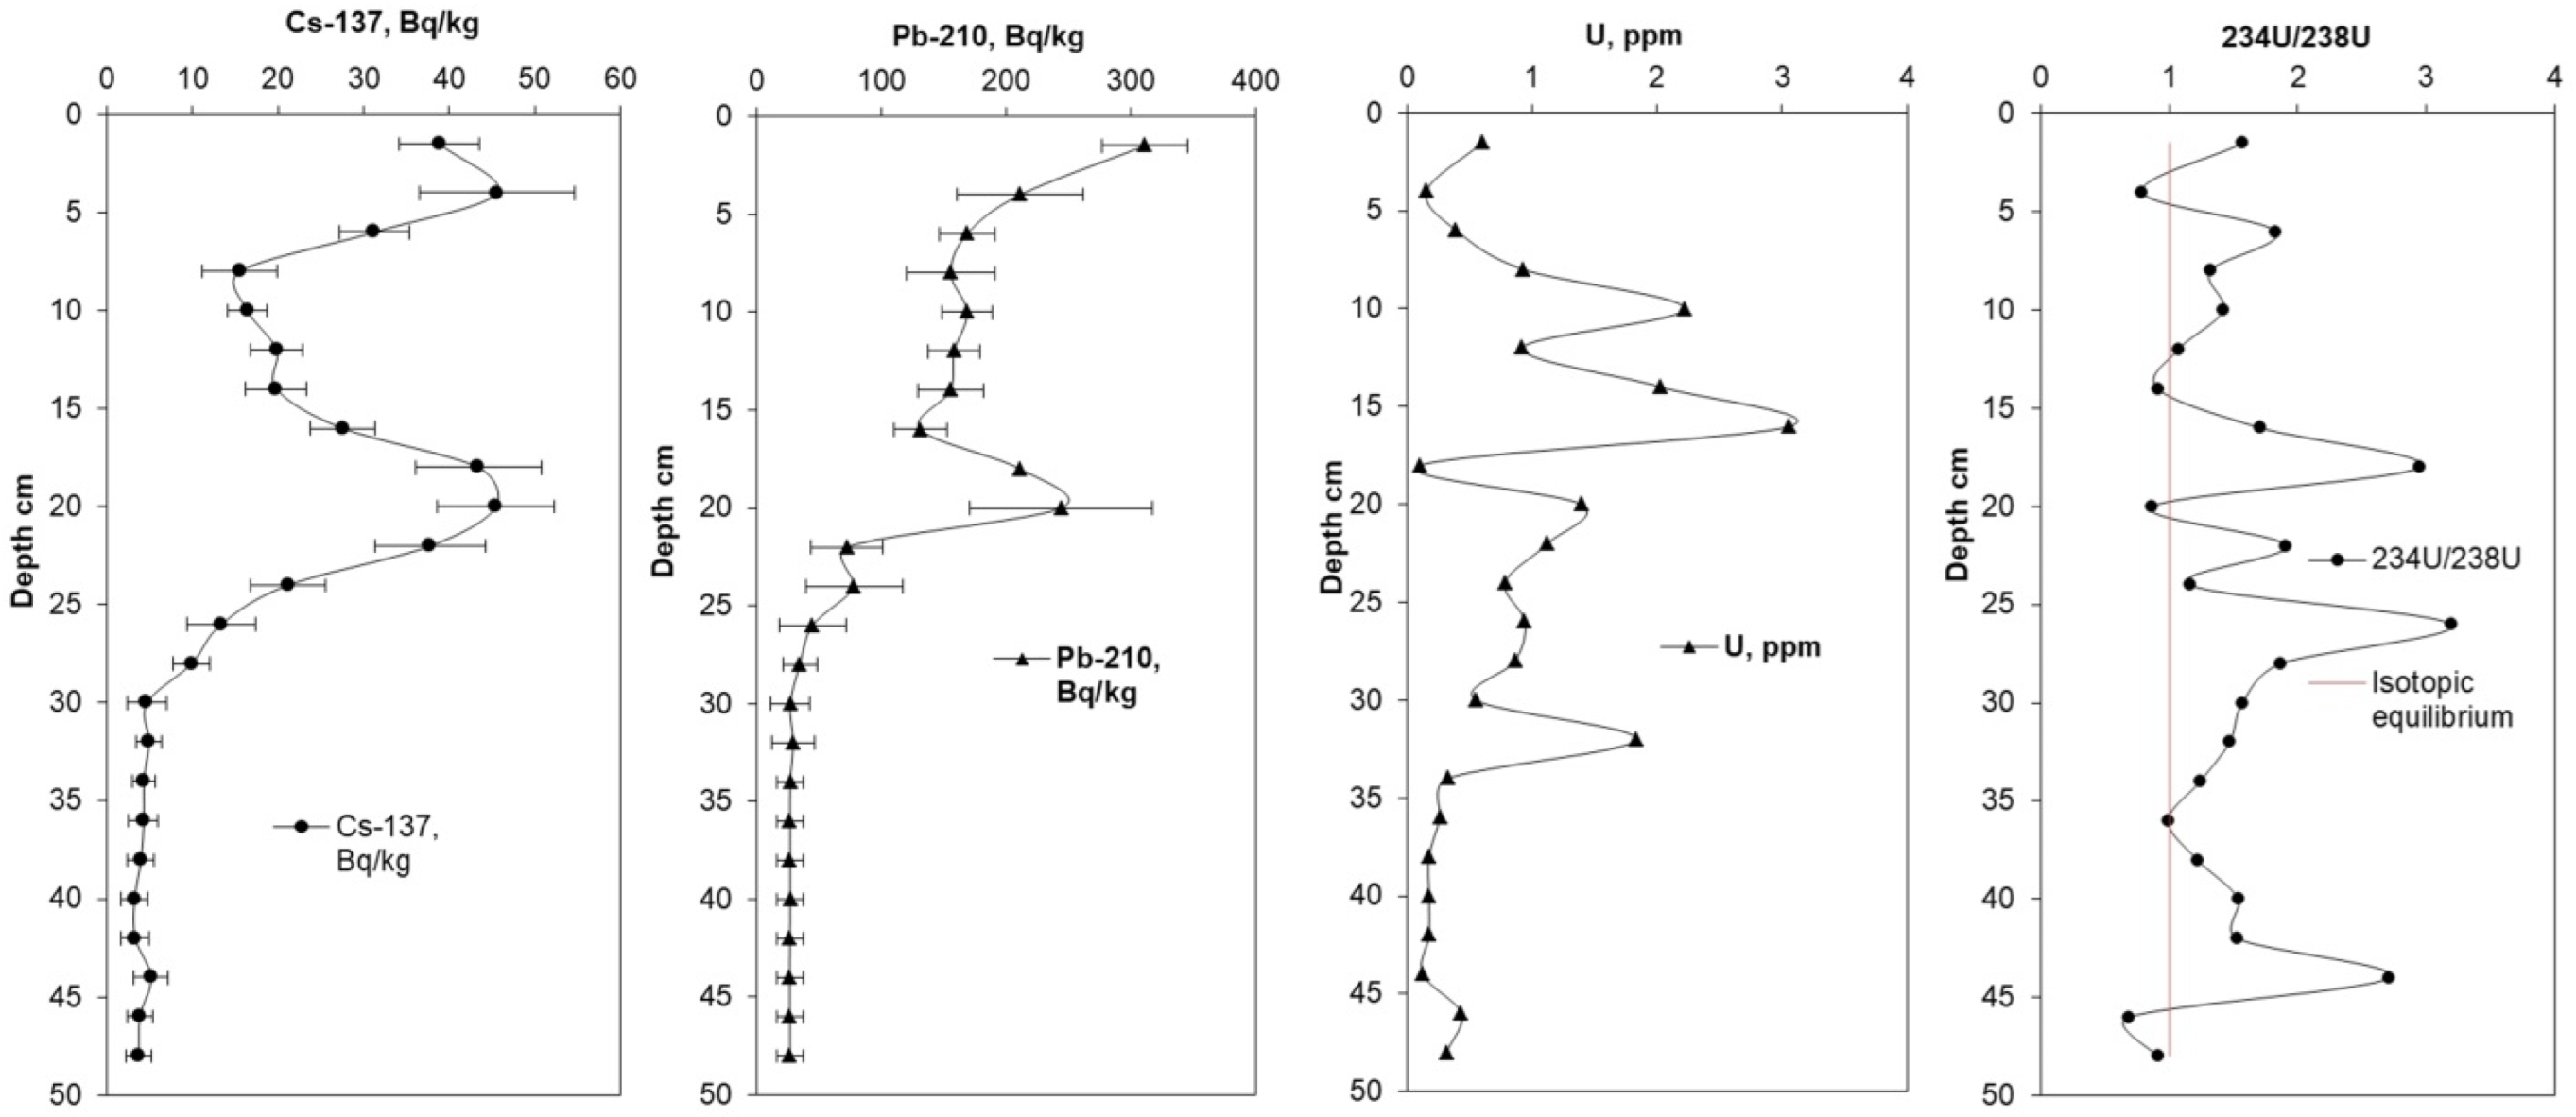
3.2. Vertical Distribution of Radionuclides in the Peat Profile

The activity of 137Cs in the studied ISNO-1 peat profile varies from 3.2 to 45.6 Bq·kg−1. (Figure 4). According to the vertical distribution graph, two pronounced peaks of 137Cs activity are noted: the first peak with an activity of 45.5 Bq·kg−1 is at a depth of 19–21 cm, and the second peak with an activity of 45.6 Bq·kg−1 is at a depth of 3–5 cm. This distribution of 137Cs is typical of raised bogs, where the maximum of 137Cs activity is characteristic of the upper part of the peat profile [14,26,28]. This is partly due to the chemical affinity between Cs and K, which are actively transported together up the peat section by plant roots [5]. Another reason for the high mobility of 137Cs in high-moor peatlands is indicated by the lack of suitable mineral particles for 137Cs adsorption [12,13,24,33].
However, in the considered case, in addition to the peak of 137Cs activity in the upper part of the profile, comparable activity is observed at a depth of 19–21 cm (45.6 Bq·kg−1 in the upper part of the profile and 45.5 Bq·kg−1 at a depth of 19–21 cm, respectively). A similar pattern of changes in caesium activity and ash content with depth (Figure 3) is probably associated with the mechanisms of caesium input with atmospheric fallout since caesium-137 and ash enter peat with atmospheric fallout [21]. However, for the uppermost layers (up to 14 cm), there are different trends in 137Cs and ash changes, which are associated with the high mobility and bioavailability of 137Cs in an acidic environment for peat sphagnum vegetation. As can be seen from the 137Cs distribution plot, the maximum depth of caesium uptake by vegetation is 14 cm for the studied profile, since below at a depth of 20 cm, one can observe a peak of activity that exceeds the maximum upper readings in value and is probably due to global fallout. Probably, for plots with a different leaching regime and a type of vegetation with a more powerful root system, for example, sedges, shrubs, and woody vegetation, a different distribution of 137Cs will be observed.
The activity of 210Pb in the studied peat profile varies from 26.2 to 310.8 Bq·kg−1. The maximum activity of 210Pb (310.8 Bq·kg−1) falls on the uppermost horizon, which is a natural phenomenon given that the only way 210Pb enters the peatland is atmospheric fallout. Below the horizon of 35–37 cm, the activity of 210Pb ceases to change and amounts to ~26 Bq·kg−1 in all underlying horizons. Obviously, below the horizon of 35–37 cm, there is practically no excess atmospheric lead, and the observed activity of 210Pb in these horizons is maintained due to the decay of 226Ra. However, the near exponential decrease in 210Pb in the upper part of the peat profile is interrupted by the activity peak at the 19–21 cm horizon, which is 243.9 Bq·kg−1. Taking into account the average rate of formation of peat deposits in the Subarctic region of European Russia [63] and the relatively constant flux of lead from the atmosphere at a depth of 19–21 cm, the activity of 210Pb should be at least 2–2.5 times less than on the surface of the peat section. The presence in the section of the horizon (19–21 cm) with 210Pb activity close to the level of the current 210Pb influx from the atmosphere indicates the downward migration of this radionuclide down the peat profile. It should be noted that the peak of 210Pb activity in the 19–21 cm horizon also coincides with the peak of 137Cs activity and the maximum ash content, which could be associated with global atmospheric fallout in 1963. At present, the 19–21 cm horizon can be considered as a complex geochemical barrier of the redox, sulphide, and sorption type [64], the conditions of which contribute to the retention of technogenic 137Cs and the accumulation of 210Pb washed out from the overlying horizons, which serves as some difficulty in dating a peat deposit using non-equilibrium 210Pb. The leaching of 210Pb from the upper layers is probably associated with atmospheric precipitation [65]. Migration of 210Pb down the peat profile occurs in the colloidal form in the form of complexes with humic acids (fulvic and humic acids) and in ionic form [66]. In general, this process is also typical for other types of soils with an acidic environment [67]. Migration of 137Cs down the section occurs only in the ionic form, and 137Cs binding is almost completely provided by the ion exchange mechanism [66].
The content of U in the peat profile varies from 0.10 to 3.06 mg/kg, with an average value of 0.83 mg/kg, which is generally typical for peat soils in the humid zone of the North [68]. The pattern of U distribution along the peat profile differs significantly from the distribution of 137Cs and 210Pb activities. The relationship of U with the studied physicochemical parameters is not clearly expressed. Such a distribution of U with depth is most likely due to the dynamics of historical inputs, with atmospheric fallout, to the surface of the deposit and extremely low mobility of uranium along the peat profile. Although some researchers [69] note that the strength of uranium fixation increases with a decrease in Ph in the salt extract and with a decrease in carbonates in peat soil. An assessment of the relationship between the activities of radionuclides and the physicochemical parameters of the studied peat section is presented in the “Statistical Analysis” section. See more Appendix A, Table A2.

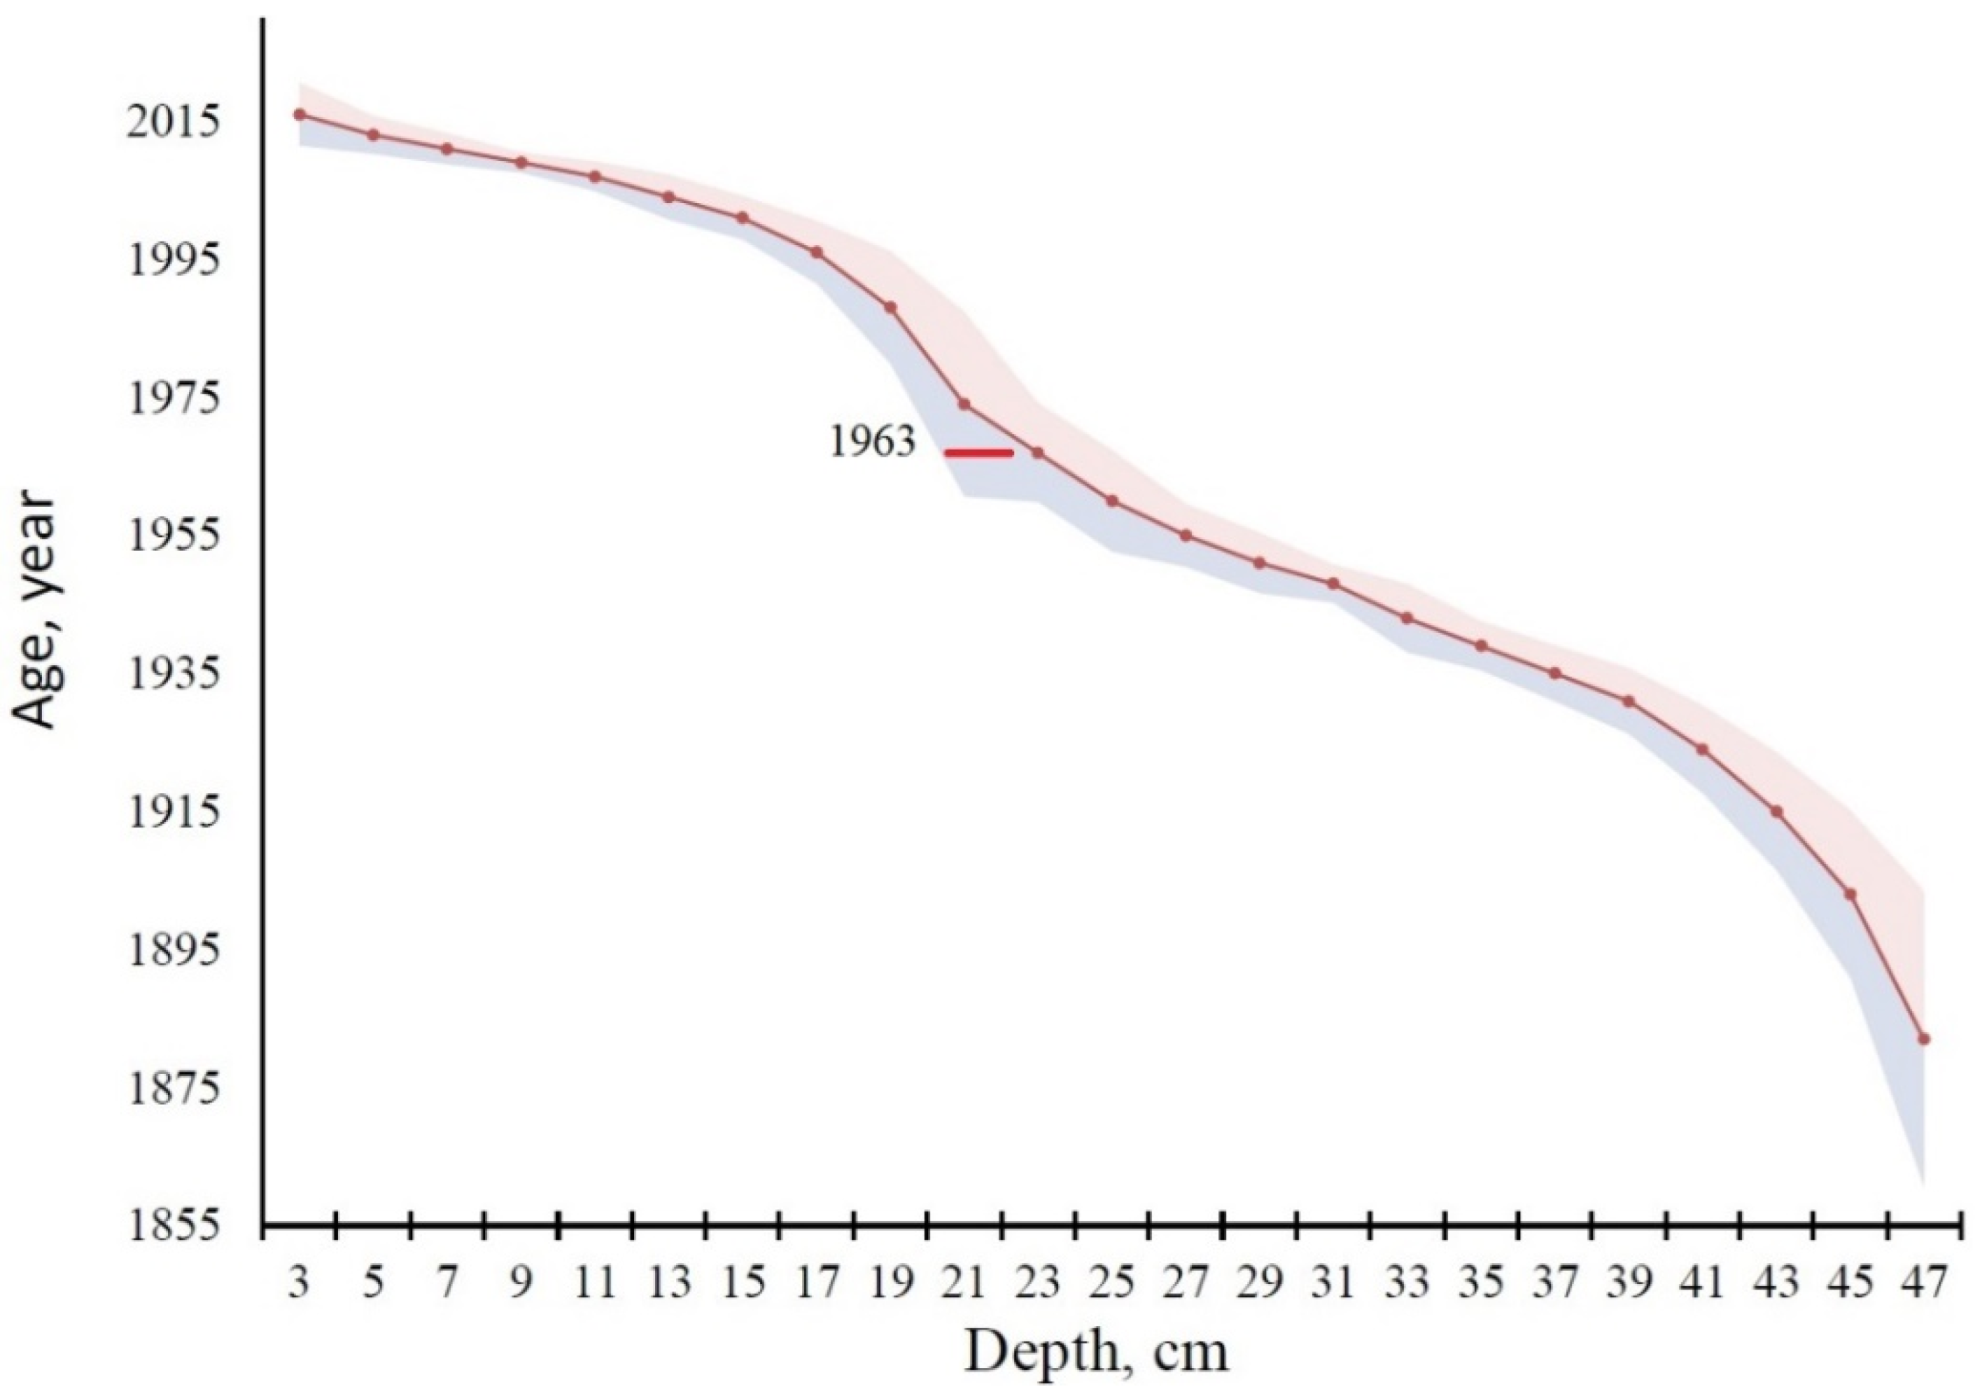
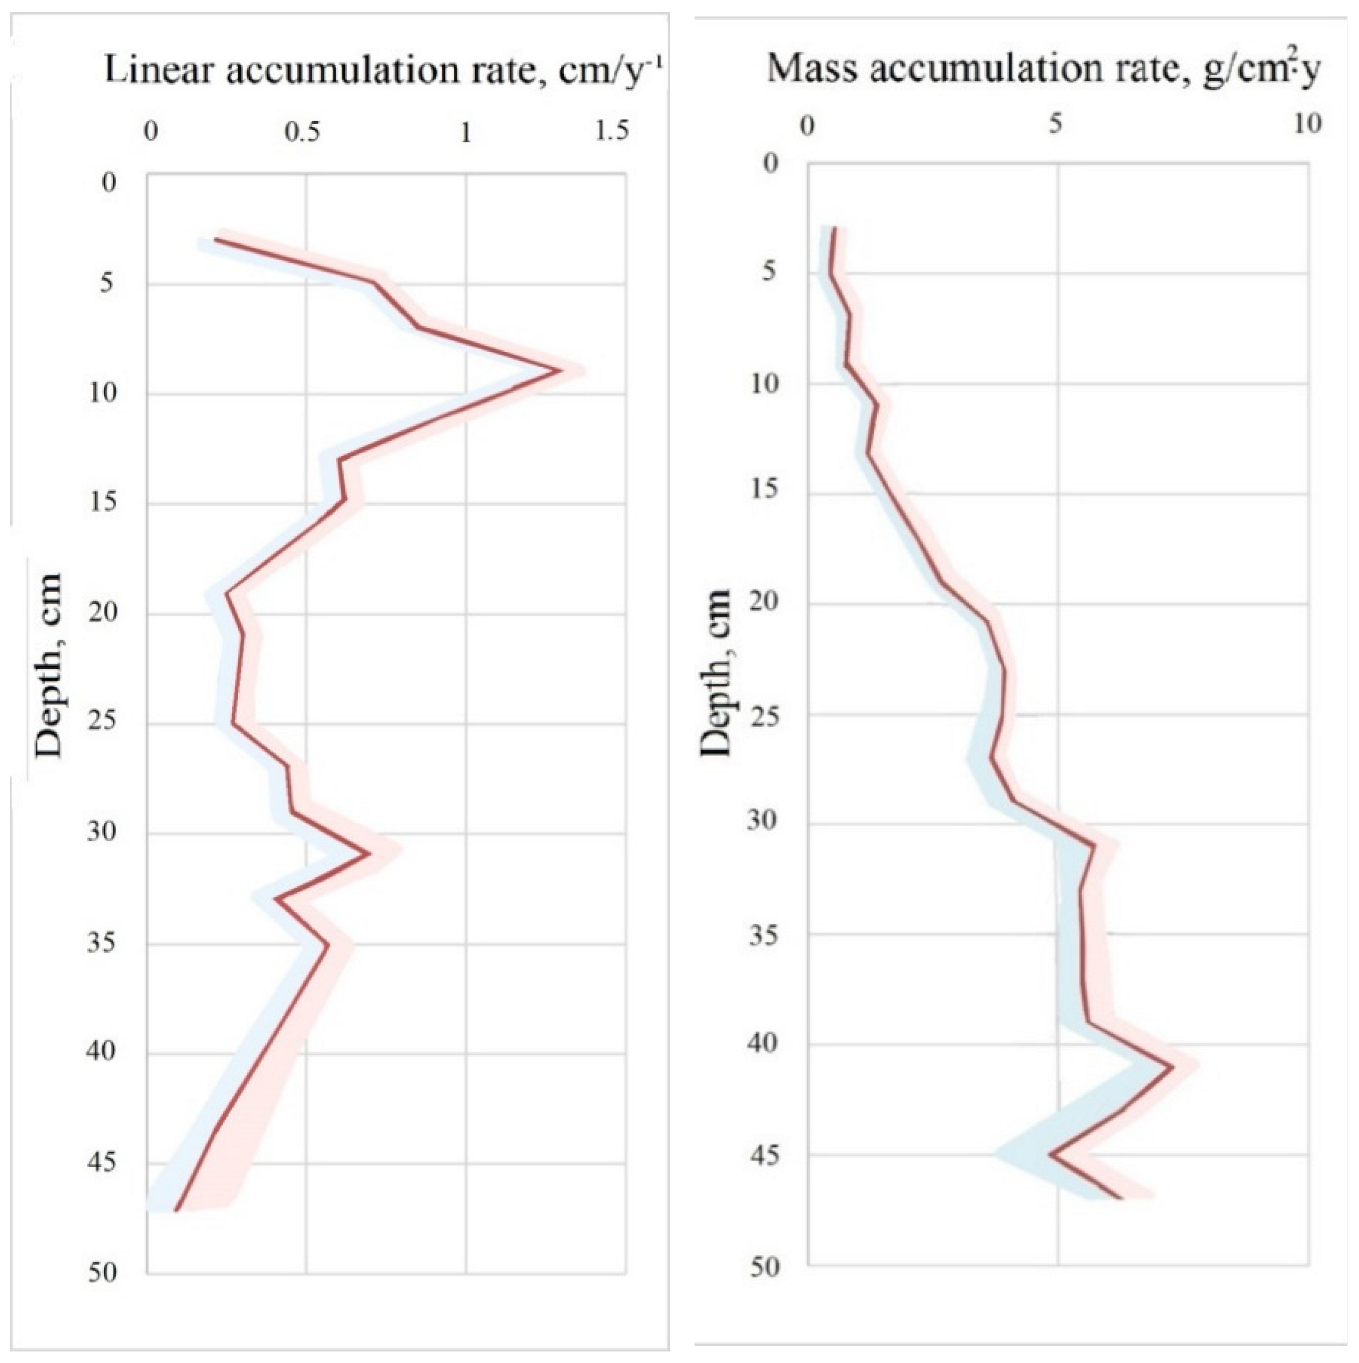
3.3. Peat Chronology and Accumulation Rate

Due to the fact that the distribution of 210Pb over the studied section has a non-exponential character, due to the migration of some part of 210Pb down the section, the authors used a triple approximation to the linear regression method for the entire data set ln (210Pbuns) depending on the mass of each layer [35,55]. Calculation of dating errors was performed by Monte Carlo simulation [56]. The results of dating the ISNO-1 peat profile are shown in Figure 5. The results showed that the 19–21 cm horizon, identified by the peak of 137Cs activity and several other physicochemical parameters (in particular, ash content), corresponded to the age of 1963, which confirms the correctness and adequacy of the chosen peat core dating model. Typically, peaks in anthropogenic radionuclides in peat deposits correlate with specific major events in the history of radioactive fallout, such as the Partial Nuclear Test Ban Treaty of 1963 and the Chernobyl accident, providing a benchmark for geochronological studies [14,34,70]. However, due to its high migration and bioavailability in peat deposits, 137Cs does not always mark radiation events in the section [12,24]. However, in the considered case, the physicochemical conditions of the peat profile contributed to the retention at a depth of 19–21 cm of part of the 137Cs that entered the surface of the peat as a result of the global fallout in 1963. The retention of 137Cs in the horizon, which marks global atmospheric fallout, is also facilitated by vegetation at the ISNO-1 core sampling site, the root system of which limits the assimilation of 137Cs to a depth of 14 cm.
The results of calculating the linear rate of accumulation s and the rate of accumulation of mass r in the studied peat deposit are shown in Figure 6. The s values varied from 0.09 ± 0.02 to 1.3 ± 0.05 cm/yr and averaged 0.48 ± 0.08 cm/yr. The peat mass accumulation rate r ranged from 0.43 ± 0.01 to 7.2 ± 0.02 g/cm2 year. The average value of r was 3.615 ± 0.005 g/cm2 yr. The data on the linear rate of peat accumulation corresponds to the previously obtained data for the Subarctic region of European Russia [38].
The vertical distribution of the linear accumulation rate s decreases with depth, while the distribution of the mass accumulation rate r increases. Such distribution is natural since the peat deposit is compacted with depth. The linear norms of peat accumulation are congruent with the data [35].
Based on 210Pb dating, the 210Pb atmospheric flux was estimated as 69.13 ± 10 Bq·m−2·yr, which is congruent with the data on peatlands in Northern Europe [71] and the authors’ earlier data on the Subarctic region of European Russia [38].

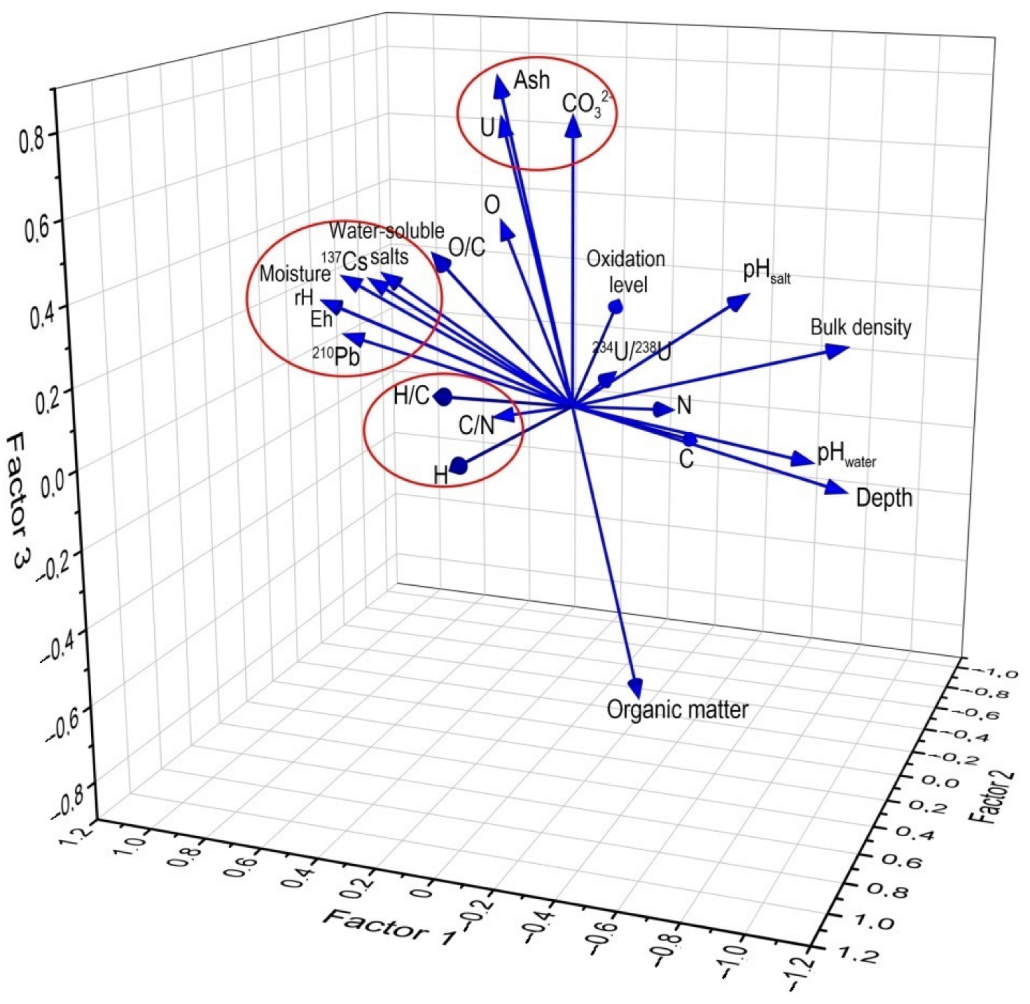
3.4. Statistical Analysis

To study the features of the accumulation of atmospheric fallout radionuclides in the peat section, factor analysis was performed, which made it possible to reveal the structure of relationships between the studied peat components. The results of the factor analysis for the ISNO-1 peat profile are presented in Table 2 and Figure 7. Quantitatively, the dataset is split into five factors that account for 91.26% of the cumulative variance. In the first factor with a dispersion of 43.35% for high loads, 137Cs, 210Pb, the content of water-soluble salts, moisture saturation, Eh, and rH are all prominent. The correlation of 137Cs with the content of water-soluble salts and moisture saturation is due to the presence of 137Cs mainly in the ionic form [66]. The correlation of 210Pb with water-soluble salts is explained by the presence of lead in the solution mainly in the chelate form in the form of complexes with fulvic acids [67]. Therefore, in the considered case, both 210Pb and 137Cs are associated with a greater extent with water-soluble salts, and not with the ash content of peat. Separation in the first factor of the Eh (rH) parameter most likely indicates that redox conditions affect the sorption (mobility) of 137Cs in peat due to changes in the state of collectors: compounds of iron, manganese, sulphur and organic substances [72].
In the second factor with a dispersion of 18.50% of the total sample for positive loads, the parameters of the elemental component of the organic matter of peat are isolated, which is generally a natural fact associated with the transformation of organic matter from the peat deposit [73].
The third factor explains 16.87% of the variance of the total sample with high factor loadings on the contents of U, carbonates, and ash components. The correlation of U with these physicochemical parameters is probably because the main part of uranium enters the peat deposit together with atmospheric dust particles and aerosols [74].
The fourth factor with a dispersion of 8% for positive loads includes the 234U/238U uranium isotope ratio, the pH of the salt extract, the content of water-soluble salts, and the elemental parameters O (O/C). The separation of these parameters into one factor is probably due to the peculiarities of the influence of these physicochemical parameters on the isotopic fractionation of 234U and 238U [75], which requires additional research.
The fifth factor explains 4.55% of the variance of the total sample with positive loads on 210Pb and the C/N parameter. This indicates that some part of 210Pb in peat is in the form of complexes with humic acids, as mentioned above.
Despite the high role of organic matter in the accumulation of radionuclides noted by some authors [13,76], the factor analysis data indicate that organic matter is not included in any factor and does not control the accumulation of radionuclides in the peat ISNO-1 profile. This is because this study evaluated the total organic matter without dividing it into group components that are carriers of radionuclides (bitumen, humic acids, hardly hydrolysable and easily hydrolysable compounds, and lignin) [77].

4. Conclusions

On example of a peat section collected in the territory of the Arkhangelsk Region within the Ilassky peat massif, which is typical of the European Subarctic of Russia we studied the activity levels and features of the vertical distribution of several atmospheric fallout radionuclides and physicochemical parameters of the peat bog.
Among the radionuclides of atmospheric fallout, the following isotopes were studied: 137Cs, 210Pb, 234U and 238U. Among the physicochemical parameters of peat, the following components were studied: contents of CO32−, ash, organics, water-soluble salts, pH values of water and salt extracts, the degree of oxidation of organic matter, moisture saturation, and contents of N, C, H and O. In total, more than 400 determinations of various physicochemical parameters and radionuclides were performed in samples of peat core.
The following conclusions can be drawn from the results of the conducted research.
The investigated part of the profile of the peat deposit is composed mainly of sphagnum peat. The physicochemical parameters of the studied peat deposit are in the ranges typical for undisturbed high-moor peatlands of the Subarctic region of European Russia. Variations in physicochemical parameters with the depth of the deposit are apparently associated with the occurrence of multidirectional redox processes, the vertical transfer of organic matter in the deposit, and the dynamics of swamp water level fluctuations. It has been established that the horizon is distinguished in the section at a depth of 20 cm, characterized by significant fluctuations in the parameters of the degree of oxidation, ash content, the content and composition of organic matter. The formation of this horizon can be due to both the washing out of the mineral part from the overlying horizons and the anthropogenic dust content of the atmosphere during the formation of the peat deposit.
The depth distribution of 137Cs reveals two prominent activity maxima, in the upper part of the profile and at a depth of 20 cm, due to the peculiarities of vertical migration and the dynamics of caesium supply with atmospheric fallout.
For the distribution of lead-210, a non-exponential decrease in activity with depth was revealed with the formation of an activity peak at a depth of 20 cm, in which the activity of 210Pb is close to the values on the surface of the deposit and coincides with the maximum activity of caesium and the content of ash elements. In this regard, this horizon can be considered a complex geochemical barrier of the redox, sulphide and sorption type, the conditions of which contribute to the retention of technogenic 137Cs and the accumulation of 210Pb washed out from the overlying horizons. The distribution of uranium with depth, most likely, is mainly due to the dynamics of historical inputs with atmospheric fallout to the surface of the deposit and with extremely low mobility of uranium along the profile.
Factor analysis showed that the distribution of 137Cs and 210Pb was associated with the content of water-soluble salts, water saturation of the deposit and the value of Eh (rH) because 137Cs is found in peat mainly in the ionic form, and 210Pb in the form of complexes with humic acids.
The results of dating the peat profile with the CF model showed that the 19–21 cm horizon, identified by the peak of 137Cs activity and several other physicochemical parameters (in particular, ash content), corresponds to the age of 1965 years; with the additional use of the Monte Carlo method, the age was 1962, which confirms the correctness and adequacy of the chosen peat core dating model. The use of the CF dating model together with the Monte Carlo method provides the best congruency with the reference horizon for 137Cs (taking into account the error).
The results obtained make it possible to expand the understanding of the migration processes of atmospheric fallout radionuclides in the peatlands of the European Subarctic, which can serve as a basis for maintaining a stable ecological situation during the development and use of the resource potential of peat-bog ecosystems. Based on the results obtained, the next step in development of this research may be to obtain new data on the migration of radionuclides in other landscape and climatic zones of the European Subarctic of Russia and near objects of potential radiation hazard (nuclear fleet bases and sites of underground nuclear explosions).

Author Contributions

Conceptualization, E.Y. and A.O.; methodology, E.Y., A.O. and A.K.; software, E.Y.; validation, E.Y., A.O., A.K. and S.Z.; formal analysis, E.Y.; investigation, S.Z.; resources, E.Y. and A.O.; data curation, E.Y.; writing—original draft preparation, E.Y., A.O., K.A and S.Z.; writing—review and editing, E.Y., A.K.; visualization, E.Y.; supervision, E.Y.; project administration, E.Y.; funding acquisition, E.Y. All authors have read and agreed to the published version of the manuscript.

Funding

The study of the physicochemical parameters of peat and of 137Cs and U radionuclides was funded of the scientific project of the Russian science foundation 22-27-20085. The study of 210Pb was carried out under the Grant of the President of the Russian Federation for young scientists MK-4298.2022.1.5.

Institutional Review Board Statement

Not applicable.

Informed Consent Statement

Not applicable.

Data Availability Statement

Not applicable.

Conflicts of Interest

The authors declare no conflict of interest.

Appendix A

Table A1. The physicochemical parameters of the peat profile.
Layer
(cm)
LOI (%)Carbonate Content
(CO32− %)
Ash
(%)
pH of Water ExtractpH of Salt ExtractWater-Soluble Salts (mg/g)Organic Matter (%)
0–30.09 ± 0.0180.12 ± 0.0241.753.95 ± 0.0052.78 ± 0.0051.7898.25 ± 0.005
3–50.06 ± 0.0030.09 ± 0.0041.473.70 ± 0.0052.67 ± 0.0051.5498.53 ± 0.035
5–70.11 ± 0.0540.15 ± 0.0741.463.70 ± 0.0052.68 ± 0.0051.3598.53 ± 0.067
7–90.09 ± 0.0290.12 ± 0.0391.683.66 ± 0.0052.68 ± 0.0051.2098.32 ± 0.012
9–110.11 ± 0.0450.15 ± 0.0612.943.75 ± 0.0052.72 ± 0.0051.2097.06 ± 0.029
11–130.16 ± 0.0100.21 ± 0.0133.293.75 ± 0.0052.74 ± 0.0051.3296.71 ± 0.039
13–150.16 ± 0.0200.22 ± 0.0283.593.98 ± 0.0052.86 ± 0.0051.4296.41 ± 0.008
15–170.18 ± 0.0150.24 ± 0.0204.363.97 ± 0.0102.84 ± 0.0051.4795.64 ± 0.028
17–190.20 ± 0.0040.27 ± 0.0015.123.94 ± 0.0052.83 ± 0.0051.3394.88 ± 0.135
19–210.19 ± 0.0100.26 ± 0.0145.774.01 ± 0.0052.83 ± 0.0051.2294.23 ± 0.251
21–230.18 ± 0.0040.24 ± 0.0064.724.08 ± 0.0052.86 ± 0.0051.4795.28 ± 0.247
23–250.22 ± 0.0150.29 ± 0.0203.494.16 ± 0.0052.89 ± 0.0051.5496.51 ± 0.115
25–270.16 ± 0.0260.21 ± 0.0362.864.34 ± 0.0052.94 ± 0.0051.4997.14 ± 0.061
27–290.22 ± 0.0410.30 ± 0.0562.784.42 ± 0.0052.97 ± 0.0051.4697.22 ± 0.023
29–310.12 ± 0.0150.17 ± 0.0212.314.47 ± 0.0052.92 ± 0.0101.2297.69 ± 0.001
31–330.15 ± 0.0080.21 ± 0.0101.774.28 ± 0.0052.85 ± 0.0051.1698.23 ± 0.001
33–350.05 ± 0.0230.06 ± 0.0311.484.16 ± 0.0052.80 ± 0.0050.9398.52 ± 0.020
35–370.07 ± 0.0290.09 ± 0.0391.244.18 ± 0.0052.81 ± 0.0050.9098.76 ± 0.004
37–390.10 ± 0.0190.14 ± 0.0251.164.21 ± 0.0052.81 ± 0.0050.9298.84 ± 0.020
39–410.10 ± 0.0130.13 ± 0.0171.134.31 ± 0.0052.83 ± 0.0050.9298.87 ± 0.011
41–430.13 ± 0.0230.17 ± 0.0231.224.25 ± 0.0052.82 ± 0.0150.8498.78 ± 0.017
43–450.11 ± 0.0080.16 ± 0.0111.244.33 ± 0.0052.83 ± 0.0100.9498.76 ± 0.019
45–470.08 ± 0.0170.11 ± 0.0231.104.41 ± 0.0102.85 ± 0.0050.9498.90 ± 0.013
47–500.11 ± 0.0130.14 ± 0.0181.884.36 ± 0.0102.86 ± 0.0050.9698.12 ± 0.010
Table A2. Activity concentrations of radionuclides (Bq·kg−1) of the peat profile.
Layer
(cm)
137Cs
(Bq·kg−1)
210Pb
(Bq·kg−1)
234U
(Bq·kg−1)
238U
(Bq·kg−1)
U
(ppm)
234U/238U
0–338.8 ± 4.66310.76 ± 34.181.29 ± 0.800.82 ± 0.590.60 ± 0.0101.57 ± 0.10
3–545.6 ± 9.11211.16 ± 50.680.17 ± 0.060.21 ± 0.070.15 ± 0.1000.79 ± 0.07
5–731.2 ± 4.06168.39 ± 21.890.98 ± 0.360.54 ± 0.170.39 ± 0.0701.83 ± 0.11
7–915.5 ± 4.35155.36 ± 35.731.69 ± 0.531.28 ± 0.380.93 ± 0.0101.32 ± 0.06
9–1116.4 ± 2.30168.49 ± 20.224.29 ± 2.513.03 ± 2.052.22 ± 0.0901.42 ± 0.08
11–1319.8 ± 2.97158.02 ± 20.541.34 ± 0.461.26 ± 0.370.92 ± 0.0201.07 ± 0.05
13–1519.8 ± 3.56155.02 ± 26.352.52 ± 0.872.76 ± 0.722.03 ± 0.0100.91 ± 0.08
15–1727.5 ± 3.85131.06 ± 20.977.12 ± 2.774.17 ± 1.273.06 ± 0.0601.71 ± 0.09
17–1943.4 ± 7.38180.80 ± 20.320.42 ± 0.250.14 ± 0.050.10 ± 0.0202.95 ± 0.08
19–2145.5 ± 6.82243.94 ± 73.181.62 ± 0.551.85 ± 0.491.39 ± 0.0200.87 ± 0.06
21–2337.8 ± 6.4272.21 ± 28.882.95 ± 0.901.55 ± 0.491.12 ± 0.0501.91 ± 0.09
23–2521.1 ± 4.4477.90 ± 38.951.25 ± 0.401.08 ± 0.350.78 ± 0.0201.16 ± 0.34
25–2713.3 ± 4.0044.42 ± 26.654.10 ± 1.251.29 ± 0.370.94 ± 0.0103.19 ± 0.07
27–299.9 ± 2.1734.35 ± 13.742.22 ± 0.751.19 ± 0.430.86 ± 0.0201.87 ± 0.09
29–314.6 ± 2.3226.55 ± 15.931.19 ± 0.380.76 ± 0.280.55 ± 0.0101.57 ± 0.16
31–334.9 ± 1.4628.80 ± 17.283.69 ± 1.092.50 ± 0.881.83 ± 0.0101.47 ± 0.09
33–354.3 ± 1.2926.52 ± 10.610.54 ± 0.290.44 ± 0.260.32 ± 0.0031.24 ± 0.11
35–374.3 ± 1.7126.34 ± 10.530.35 ± 0.130.36 ± 0.090.26 ± 0.0100.99 ± 0.10
37–394.0 ± 1.5826.41 ± 10.570.28 ± 0.090.23 ± 0.080.17 ± 0.0031.22 ± 0.11
39–413.2 ± 1.6026.50 ± 10.600.35 ± 0.210.23 ± 0.160.17 ± 0.0021.54 ± 0.09
41–433.3 ± 1.6426.30 ± 10.520.36 ± 0.200.24 ± 0.140.17 ± 0.0101.53 ± 0.05
43–455.1 ± 2.0526.19 ± 10.470.44 ± 0.240.16 ± 0.140.12 ± 0.0202.71 ± 0.12
45–473.8 ± 1.5326.24 ± 10.490.41 ± 0.140.58 ± 0.190.43 ± 0.0600.69 ± 0.04
47–503.7 ± 1.5026.32 ± 10.530.38 ± 0.120.42 ± 0.160.31 ± 0.0200.91 ± 0.08
Table A3. Change in the elemental composition of peat by depth.
Layer
(cm)
Elemental Composition of Organic Matter of Peat
(% Atomic)
H/CC/NOxidation Level
(ω)
NCHO
0–30.93 ± 0.1131.57 ± 0.4848.79 ± 0.8918.721.5534.1−0.36
3–51.44 ± 0.1431.41 ± 0.0349.60 ± 0.6017.551.5821.9−0.46
5–71.30 ± 0.0432.41 ± 0.0148.06 ± 0.9718.231.4824.9−0.36
7–91.23 ± 0.0331.61 ± 0.0649.78 ± 0.3017.391.5725.8−0.47
9–111.40 ± 0.0232.16 ± 0.0548.90 ± 0.5017.551.5223.0−0.43
11–131.42 ± 0.0131.76 ± 0.0648.30 ± 0.2118.521.5222.4−0.35
13–151.43 ± 0.0333.22 ± 0.1447.12 ± 0.5918.231.4223.3−0.32
15–171.41 ± 0.1631.77 ± 0.0247.67 ± 0.4219.161.5022.5−0.29
17–191.02 ± 0.0630.62 ± 0.0149.10 ± 4.2119.271.6030.2−0.34
19–210.91 ± 0.0527.32 ± 0.7953.87 ± 1.7917.901.9729.9−0.66
21–231.51 ± 0.0132.88 ± 0.0547.53 ± 0.4318.081.4521.7−0.35
23–251.40 ± 0.0130.99 ± 0.1848.64 ± 1.7218.961.5722.1−0.35
25–271.43 ± 0.0531.13 ± 0.2548.72 ± 0.2818.721.5621.8−0.36
27–291.60 ± 0.0231.38 ± 0.1348.75 ± 0.0618.271.5519.6−0.39
29–311.52 ± 0.0331.08 ± 0.0648.88 ± 0.8018.521.5720.4−0.38
31–331.55 ± 0.0131.50 ± 0.1249.50 ± 1.4317.451.5720.4−0.46
33–351.46 ± 0.0631.88 ± 0.0248.72 ± 0.7817.941.5321.8−0.40
35–371.39 ± 0.0531.80 ± 0.0849.39 ± 0.2817.421.5522.9−0.46
37–391.41 ± 0.1232.11 ± 0.2649.65 ± 0.2916.831.5522.8−0.50
39–411.52 ± 0.1032.54 ± 0.1549.07 ± 0.4116.881.5121.4−0.47
41–431.50 ± 0.0133.13 ± 0.0348.47 ± 0.3616.901.4622.0−0.44
43–451.36 ± 0.0934.43 ± 0.2346.28 ± 1.6417.921.3425.3−0.30
45–471.30 ± 0.0533.69 ± 0.0347.30 ± 0.6817.711.4025.9−0.35
47–501.41 ± 0.1731.55 ± 0.4649.62 ± 0.3617.411.5722.3−0.47

Appendix B

Figure A1. The Ilassky peat bog massif view in summer (Arkhangelsk Region, Russia).
Applsci 12 10870 g0a1
Figure A2. The Ilassky peat bog massif view in autumn (Arkhangelsk Region, Russia).
Applsci 12 10870 g0a2
Figure A3. The peat bog is characterized by strong watering, which is typical on the peatlands of European Subarctic of Russia.
Applsci 12 10870 g0a3

References

  1. Bindler, R.; Klaminder, J. Reply to comment by William Shotyk on “Does within-bog spatial variability of mercury and lead constrain reconstructions of absolute deposition rates from single peat records? The example of Store Mosse, Sweden”. Glob. Biogeochem. Cycles 2006, 20, GB2005. [Google Scholar] [CrossRef]
  2. van der Linden, M.; Barke, J.; Vickery, E.; Charman, D.; van Geel, B. Late Holocene human impact and climate change recorded in a North Swedish peat deposit. Palaeogeogr. Palaeoclim. Palaeoecol. 2008, 258, 1–27. [Google Scholar] [CrossRef]
  3. Le Roux, G.; Marshall, W.A. Constructing recent peat accumulation chronologies using atmospheric fall-out radionuclides. Mires Peat 2011, 7, 1–14. [Google Scholar]
  4. Ndiaye, A.; Bentaleb, I.; Favier, C.; Fourel, F.; Sebag, D.; Fall, M.; Giresse, P.; Diouf, B. Reconstruction of the holocene climate and environmental changes of Niayes peat bog in northern coast of Senegal (NW Africa) based on stable isotopes and charcoals analysis. Quat. Sci. Rev. 2022, 289, 107609. [Google Scholar] [CrossRef]
  5. Li, H.-C.; Wang, J.; Sun, J.-J.; Chou, C.-Y.; Xia, Y.-Y.; Zhao, H.-Y.; Yang, Q.-N.; Kashyap, S. Study of Jinchuan Mire in NE China I: AMS 14C, 210Pb and 137Cs dating on peat cores. Quat. Int. 2019, 528, 9–17. [Google Scholar] [CrossRef]
  6. Sun, A.; Yang, Y.; Wu, H.; Ran, M. Climate change on the northeastern Tibetan Plateau during the past~600 years inferred from peat pollen records. Rev. Palaeobot. Palynol. 2020, 276, 104194. [Google Scholar] [CrossRef]
  7. De Vleeschouwer, F.; Gérard, L.; Goormaghtigh, C.; Mattielli, N.; Le Roux, G.; Fagel, N. Atmospheric lead and heavy metal pollution records from a Belgian peat bog spanning the last two millenia: Human impact on a regional to global scale. Sci. Total Environ. 2007, 377, 282–295. [Google Scholar] [CrossRef] [Green Version]
  8. Ul’Yanovskii, N.V.; Lakhmanov, D.E.; Pikovskoi, I.I.; Falev, D.I.; Popov, M.S.; Kozhevnikov, A.Y.; Kosyakov, D.S. Migration and transformation of 1,1-dimethylhydrazine in peat bog soil of rocket stage fall site in Russian North. Sci. Total Environ. 2020, 726, 138483. [Google Scholar] [CrossRef]
  9. Magiera, T.; Szuszkiewicz, M.M.; Michczyński, A.; Chróst, L.; Szuszkiewicz, M. Peat bogs as archives of local ore mining and smelting activities over the centuries: A case study of Miasteczko Śląskie (Upper Silesia, Poland). CATENA 2021, 198, 105063. [Google Scholar] [CrossRef]
  10. Gwynn, J.P.; Dowdall, M.; Lind, B. The Radiological Environment of Svalbard; Strålevern Rapport 2004:2; Norwegian Radiation Protection Authority: Østerås, Norway, 2004; p. 55. [Google Scholar]
  11. Dowdall, M.; Gwynn, J.P.; Moran, C.; Davids, C.; O’Dea, J.; Lind, B. Organic soil as a radionuclide sink in a High Arctic environment. J. Radioanal. Nucl. Chem. 2005, 266, 217–223. [Google Scholar] [CrossRef]
  12. Fialkiewicz-Koziel, B.; Kolaczek, P.; Piotrowska, N.; Michczynski, A.; Lokas, E.; Wachniew, P.; Woszczyk, M.; Sensula, B. High-Resolution Age-Depth Model of a Peat Bog in Poland as an Important Basis for Paleoenvironmental Studies. Radiocarbon 2014, 56, 109–125. [Google Scholar] [CrossRef]
  13. Lokas, E.; Bartminski, P.; Wachniew, P.; Mietelski, J.W.; Kawiak, T.; Srodon, J. Sources and pathways of artificial radionuclides to soils at a High Arctic site. Environ. Sci. Pollut. Res. 2014, 21, 12479–12493. [Google Scholar] [CrossRef] [PubMed] [Green Version]
  14. Mroz, T.; Lokas, E.; Kocurek, J.; Gasiorek, M. Atmospheric fallout radionuclides in peatland from Southern Poland. J. Environ. Radioact. 2017, 175–176, 25–33. [Google Scholar] [CrossRef]
  15. Zhao, X.; Hou, X.; Zhang, D.; Yang, Y.; Huang, Z.; Liu, Q. Records of iodine isotopes (129I, 127I) in the Barkol peat bog from northwest China and their sources, transport and preservation. Chemosphere 2021, 279, 130531. [Google Scholar] [CrossRef]
  16. Strack, M. (Ed.) Peatlands and Climate Change; IPS, International Peat Society: Quebec, QC, Canada, 2008. [Google Scholar]
  17. Freeman, C.; Fenner, N.; Ostle, N.; Kang, H.; Dowrick, D.J.; Reynolds, B.; Lock, M.A.; Sleep, D.; Hughes, S.; Hudson, J. Export of dissolved organic carbon from peatlands under elevated carbon dioxide levels. Nature 2004, 430, 195–198. [Google Scholar] [CrossRef] [PubMed]
  18. Antala, M.; Juszczak, R.; van der Tol, C.; Rastogi, A. Impact of climate change-induced alterations in peatland vegetation phenology and composition on carbon balance. Sci. Total Environ. 2022, 827, 154294. [Google Scholar] [CrossRef]
  19. Kudelsky, A.; Smith, J.; Ovsiannikova, S.; Hilton, J. Mobility of Chernobyl-derived 137Cs in a peatbog system within the catchment of the Pripyat River, Belarus. Sci. Total Environ. 1996, 188, 101–113. [Google Scholar] [CrossRef] [Green Version]
  20. Tositti, L.; Mingozzi, M.; Sandrini, S.; Forlani, L.; Buoso, M.; De Poli, M.; Ceccato, D.; Zafiropoulos, D. A multitracer study of peat profiles from Tunguska, Siberia. Glob. Planet. Chang. 2006, 53, 278–289. [Google Scholar] [CrossRef]
  21. Parry, L.E.; Charman, D.J.; Blake, W.H. Comparative dating of recent peat deposits using natural and anthropogenic fallout radionuclides and Spheroidal Carbonaceous Particles (SCPs) at a local and landscape scale. Quat. Geochronol. 2013, 15, 11–19. [Google Scholar] [CrossRef] [Green Version]
  22. Begy, R.; Kovacs, T.; Veres, D.; Simon, H. Atmospheric flux, transport and mass balance of 210Pb and 137Cs radiotracers in different regions of Romania. Appl. Radiat. Isot. 2016, 111, 31–39. [Google Scholar] [CrossRef]
  23. Martinsson, J.; Pédehontaa-Hiaa, G.; Malmborg, V.; Madsen, D.; Rääf, C. Experimental wildfire induced mobility of radiocesium in a boreal forest environment. Sci. Total Environ. 2021, 792, 148310. [Google Scholar] [CrossRef] [PubMed]
  24. Mihalik, J.; Bartuskova, M.; Holgye, Z.; Jezkova, T.; Henych, O. Fractionation of 137Cs and Pu in natural peatland. J. Environ. Radioact. 2014, 134, 14–20. [Google Scholar] [CrossRef] [PubMed]
  25. Hoshino, Y.; Komatsuzaki, M. Vertical distribution of radiocesium affects soil-to-crop transfer coefficient in various tillage systems after the Fukushima Daiichi Nuclear Power Plant accident. Soil Tillage Res. 2018, 178, 179–188. [Google Scholar] [CrossRef]
  26. Orlov, O.O.; Irklienko, S.P.; Turko, V.M. The 137Cs content in biogeocenosis components of mesooligotrophic bogs of Ukrainian Polessie and the role of sphagous cover in redistribution of potassium and 137Cs streams in their ecosystems. In Problemy Ekologii Lesov I Lesoplozovania Na Ukrainskom Polessie; Volyn: Zhytomir, Ukraine, 1999. (In Ukraine) [Google Scholar]
  27. Mietelski, J.W.; Kubica, B.; Gaca, P.; Tomankiewicz, E.; Błażej, S.; Tuleja-Krysa, M.; Stobiński, M. 238Pu, 239+240Pu, 241Am, 90Sr and 137Cs in mountains soil samples from the Tatra National Park (Poland). J. Radioanal. Nucl. Chem. 2007, 275, 523–533. [Google Scholar] [CrossRef]
  28. Rosen, K.; Vinichuk, M.; Johanson, K. 137Cs in a raised bog in central Sweden. J. Environ. Radioact. 2009, 100, 534–539. [Google Scholar] [CrossRef]
  29. Appleby, P. Three decades of dating recent sediments by fallout radionuclides: A review. Holocene 2008, 18, 83–93. [Google Scholar] [CrossRef]
  30. Piotrowska, N.; De Vleeschouwer, F.; Sikorski, J.; Pawlyta, J.; Fagel, N.; Le Roux, G.; Pazdur, A. Intercomparison of radiocarbon bomb pulse and 210Pb age models. A study in a peat bog core from North Poland. Nucl. Instrum. Methods Phys. Res. Sect. B Beam Interact. Mater. At. 2010, 268, 1163–1166. [Google Scholar] [CrossRef] [Green Version]
  31. Fialkiewicz-Koziel, B.; Lokas, E.; Galka, M.; Kolaczek, P.; De Vleeschouwer, F.; Le Roux, G.; Smieja-Krol, B. Influence of transboundary transport of trace elements on mountain peat geochemistry (Sudetes, Central Europe). Quat. Sci. Rev. 2020, 230, 106162. [Google Scholar] [CrossRef]
  32. Vile, M.A.; Wieder, R.K.; Novák, M. Mobility of Pb in Sphagnum-derived peat. Biogeochemistry 1999, 45, 35–52. [Google Scholar] [CrossRef]
  33. MacKenzie, A.; Farmer, J.; Sugden, C. Isotopic evidence of the relative retention and mobility of lead and radiocaesium in Scottish ombrotrophic peats. Sci. Total Environ. 1997, 203, 115–127. [Google Scholar] [CrossRef]
  34. Ali, A.A.; Ghaleb, B.; Garneau, M.; Asnong, H.; Loisel, J. Recent peat accumulation rates in minerotrophic peatlands of the Bay James region, Eastern Canada, inferred by 210Pb and 137Cs radiometric techniques. Appl. Radiat. Isot. 2008, 66, 1350–1358. [Google Scholar] [CrossRef] [PubMed]
  35. Cwanek, A.; Lokas, E.; Edward, A.D.M.; Mazei, Y.; Gaca, P.; Milton, J.A. Temporal variability of Pu signatures in a 210Pb-dated Sphagnum peat profile from the Northern Ural, Russian Federation. Chemosphere 2021, 281, 130962. [Google Scholar] [CrossRef] [PubMed]
  36. Shotyk, W.; Kempter, H.; Krachler, M.; Zaccone, C. Stable (206Pb, 207Pb, 208Pb) and radioactive (210Pb) lead isotopes in 1year of growth of Sphagnum moss from four ombrotrophic bogs in southern Germany: Geochemical significance and environmental implications. Geochim. Cosmochim. Acta 2015, 163, 101–125. [Google Scholar] [CrossRef]
  37. Selyanina, S.B.; Parfyonova, L.N.; Trufanova, M.V.; Bogolicyn, K.G.; Mal’ceva, E.V.; Bogdanov, M.V.; YArygina, O.N. Extraction of Bitumen from High-Moor Peat; Bulletin of NArFU; Series Chemistry; Publisher of NArFU: Arkhangelsk, Russia, 2013; pp. 43–50. [Google Scholar]
  38. Yakovlev, E.; Spirov, R.; Druzhinin, S.; Ocheretenko, A.; Druzhinina, A.; Mishchenko, E.; Zhukovskaya, E. Atmospheric fallout of radionuclides in peat bogs in the Western Segment of the Russian Arctic. Environ. Sci. Pollut. Res. 2021, 28, 25460–25478. [Google Scholar] [CrossRef] [PubMed]
  39. Batuyev, I.K.V. Analysis of the factors determining the long-term change in runoff from oligotrophic bogs. Water Manag. Russia 2020, 6, 28–46. [Google Scholar] [CrossRef]
  40. Byzova, N.M.; Preminina, Y.K. Geography of the Arkhangelsk Region; Sport Akadem Press: Moscow, Russia, 2001. [Google Scholar]
  41. GOST 11623-89; Peat and Products of Its Processing for Agriculture. Methods for the Determination of Exchange and Active Acidity. 1993. Standards Publishing House: Moscow, Russia, 1992.
  42. GOST 26423-85; Soils. Methods for Determination of Specific Electric Conductivity, pH and Solid Residue of Water Extract. 1985. Standartinform: Moscow, Russia, 2011.
  43. GOST 28268-89; Soils. Methods of Determination of Moisture, Maximum Hygroscopic Moisture and Moisture of Steady Plant Fading. 1990. Standartinform: Moscow, Russia, 2006.
  44. GOST 26213-91; Soils. Methods for Determination of Organic Matter. 1993. Standards Publishing House: Moscow, Russia, 1992.
  45. GOST 27784-88; Soils. Methods for Determination of Ash Content in Peat and Peat-Containing Soil Horizons. 1988. Standards Publishing House: Moscow, Russia, 1988.
  46. Noskova, M.G. Field Atlas of Sphagnum Mosses in the Taiga Zone of European Russia; Publisher Aquarius: Tula City, Russia, 2016. [Google Scholar]
  47. Lishtvan, I.I.; Bazin, Y.T.; Gamayunov, N.I. Peat Physics and Chemistry; Nedra: Moscow, Russia, 1989. (In Russian) [Google Scholar]
  48. Urquhart, C.; Gore, A.J.P. The redox characteristics of four peat profiles. Soil Biol. Biochem. 1973, 5, 659–672. [Google Scholar] [CrossRef]
  49. Orlov, D.S. Soil Chemistry; MSU Publishing House: Moscow, Russia, 1992; p. 259. [Google Scholar]
  50. MVI Recommendation: MN 3421-2010; Method for Performing Measurements on a Gamma Spectrometer. Belarusian State Institute of Metrology. BelGIM: Minsk, Russia, 2010.
  51. MVI Recommendation 2453-2000; Methods of Radiation Control. General Requirements. VNIIFTI: Moscow, Russia, 2000.
  52. Bahur, A.E.; Manuilova, L.I.; Zueva, D.M.; Ovsyannikova, T.M.; Trukhina, T. The Method for Measuring the Specific Activity of Polonium-210 (210Po) and Lead-210 (210Pb) in Samples of Soils, Soils, Bottom Sediments, Rocks and Building Materials Based on Them by α-β Radiometric Method with Radiochemical Preparation; VIMS: Moscow, Russia, 2013. [Google Scholar]
  53. Bahur, A.E.; Manuilova, L.I.; Zueva, D.M.; Ovsyannikova, T.M.; Trukhina, T.P. The Method for Measuring the Specific Activity of Uranium Isotopes (238U, 234U, 235U) in Samples of Soils, Soils, Bottom Sediments, Rocks and Building Materials Based on Them Using an α-Spectrometric Method with Radiochemical Preparation; VIMS: Moscow, Russia, 2013. [Google Scholar]
  54. Appleby, P.; Oldfield, F. The calculation of lead-210 dates assuming a constant rate of supply of unsupported 210Pb to the sediment. CATENA 1978, 5, 1–8. [Google Scholar] [CrossRef]
  55. Sanchez-Cabeza, J.; Ruiz-Fernández, A. 210Pb sediment radiochronology: An integrated formulation and classification of dating models. Geochim. Cosmochim. Acta 2012, 82, 183–200. [Google Scholar] [CrossRef]
  56. Sanchez-Cabeza, J.-A.; Ruiz-Fernández, A.C.; Ontiveros-Cuadras, J.F.; Bernal, L.H.P.; Olid, C. Monte Carlo uncertainty calculation of 210Pb chronologies and accumulation rates of sediments and peat bogs. Quat. Geochronol. 2014, 23, 80–93. [Google Scholar] [CrossRef]
  57. Parfenova, L.; Selyanina, S.; Trufanova, M.; Bogolitsyn, K.; Orlov, A.; Volkova, N.; Ponomareva, T.; Sokolova, T. Influence of climatic and hydrological factors on structure and composition of peat from northern wetland territories with low anthropogenic impact. Sci. Total Environ. 2016, 551–552, 108–115. [Google Scholar] [CrossRef]
  58. Shishov, L.L.; Tonkonogov, V.D.; Lebedeva, I.I.; Gerasimova, M.I. Classification and detection of soils in Russia. Oykumena Smolensk 2004, 2, 341. (In Russian) [Google Scholar]
  59. Zubov, I.N.; Orlov, A.S.; Selyanina, S.B.; Zabelina, S.A.; Ponomareva, T.I. Redox potential and acidity of peat are key diagnostic physicochemical properties for the stratigraphic zones of a boreal raised bog. Mires Peat 2022, 28, 16. [Google Scholar]
  60. Ponomareva, T.; Selyanina, S.; Shtang, A.; Zubov, I.; Yarygina, O. Transformation of an oligotrophic sphagnum bog during the process of rewetting. Land 2021, 10, 670. [Google Scholar] [CrossRef]
  61. Orlov, D.S. Soil Humic Acids and the General Theory of Humification; MSU Publishing House: Moscow, Russia, 1990; p. 325. [Google Scholar]
  62. Schulz, C.; Meier-Uhlherr, R.; Luthardt, V.; Joosten, H. Portraits of peatland deposits Germany. Mires Peat 2019, 24, 20. [Google Scholar]
  63. Shevchenko, V.P.; Kuznecov, O.L.; Politova, N.V.; Zareckaya, N.E.; Kutenkov, S.A.; Lisicyn, A.P.; Pokrovskij, O.S. The entry of trace elements from the atmosphere, registered in the natural archive (on the example of the Ilas raised bog, the catchment area of the White Sea). Rep. Acad. Sci. 2015, 465, 587–592. [Google Scholar]
  64. Savichev, O.; Soldatova, E.; Rudmin, M.; Mazurov, A. Geochemical barriers in oligotrophic peat bog (Western Siberia). Appl. Geochem. 2020, 113, 104519. [Google Scholar] [CrossRef]
  65. Olid, C.; Diego, D.; Garcia-Orellana, J.; Cortizas, A.M.; Klaminder, J. Modeling the downward transport of 210 Pb in Peatlands: Initial Penetration-Constant Rate of Supply (IP-CRS) model. Sci. Total Environ. 2016, 541, 1222–1231. [Google Scholar] [CrossRef]
  66. Schleich, B.N.; Degering, D.; Unterricker, S. Natural and artificial radionuclides in forest and bog soils: Tracers for migration processes and soil development. Radiochim. Acta 2000, 88, 803–808. [Google Scholar] [CrossRef]
  67. Husson, O. Redox potential (Eh) and pH as drivers of soil/plant/microorganism systems: A transdisciplinary overview pointing to integrative opportunities for agronomy. Plant Soil 2013, 362, 389–417. [Google Scholar] [CrossRef] [Green Version]
  68. Vodyanickij, Y.N.; Grebenkin, N.A.; Manahov, D.V.; Sashchenko, A.V.; Tyuleneva, V.M. Positive anomalies of uranium content in peatlands of the humid zone (review). Soil Sci. 2019, 12, 1492–1501. [Google Scholar]
  69. Rachkova, N.G.; Shuktomova, I.I.; Taskaev, A.I. The state of natural radionuclides of uranium, radium, and thorium in soils. Eurasian Soil Sci. 2010, 43, 651–658. [Google Scholar] [CrossRef]
  70. Putyrskaya, V.; Klemt, E.; Röllin, S.; Corcho-Alvarado, J.; Sahli, H. Dating of recent sediments from Lago Maggiore and Lago di Lugano (Switzerland/Italy) using 137Cs and 210Pb. J. Environ. Radioact. 2020, 212, 106135. [Google Scholar] [CrossRef] [PubMed]
  71. Paatero, J.; Jaakkola, T.; Kulmala, S. Lichen (sp. Cladonia) as a deposition indicator for transuranium elements investigated with the Chernobyl fallout. J. Environ. Radioact. 1998, 38, 223–247. [Google Scholar] [CrossRef]
  72. Rachkova, N.G.; Shuktomova, I.I.; Taskaev, A.I. Sorption of uranium, radium, and thorium from saline solutions on hydrolyzed wood lignin. Russ. J. Appl. Chem. 2006, 79, 715–721. [Google Scholar] [CrossRef]
  73. Selyanina, S.B.; Trufanova, M.V.; YArygina ONOrlov, A.S.; Ponomareva, T.I.; Titova, K.V.; Zubov, I.N. Features of the biotransformation of organic substances in the conditions of the bog ecosystems of the North (on the example of the Ilas bog massif). Proc. IBVV RAS 2017, 79, 200–206. [Google Scholar]
  74. Han, C.H.; Park, J.W. Analysis of the natural radioactivity concentrations of the fine dust samples in Jeju Island, Korea and the annual effective radiation dose by inhalation. J. Radioanal. Nucl. Chem. 2018, 316, 1173–1179. [Google Scholar] [CrossRef] [Green Version]
  75. Chernyshev, I.V.; Golubev, V.N.; Chugaev, A.V.; Mandzhieva, G.V.; Gareev, B.I. Behavior of the 238U, 235U, and 234U isotopes at weathering of volcanic rocks with u mineralization: A case study at the Tulukuevskoe deposit, Eastern Transbaikalia. Petrology 2019, 27, 446–467. [Google Scholar] [CrossRef]
  76. Rigol, A.; Vidal, M.; Rauret, G. An overview of the effect of organic matter on soil–radiocaesium interaction: Implications in root uptake. J. Environ. Radioact. 2002, 58, 191–216. [Google Scholar] [CrossRef]
  77. Arbuzov, S.I.; Il’enok, S.S.; Volostnov, A.V.; Maslov, S.G.; Arhipov, V.S. Forms of uranium in the coals and peat of North Asia. Bull. Tomsk. Polytech. Univ. 2011, 319, 109–115. [Google Scholar]
Figure 1. Location of the studied Ilasskoe peatland where the peat profile ISNO-1 was collected (Arkhangelsk Region). The red cross, arrow and rectangle in the figure indicate the sampling location.
Applsci 12 10870 g001
Figure 2. Change in the elemental composition of peat profile by depth.
Applsci 12 10870 g002
Figure 3. Change in the physicochemical parameters of the peat profile by depth.
Applsci 12 10870 g003
Figure 4. Change in the vertical distribution of radionuclides of the peat profile by depth.
Applsci 12 10870 g004
Figure 5. The results of 210Pb chronology for the ISNO-1 peat core according to the CF model using the Monte Carlo method.
Applsci 12 10870 g005
Figure 6. Linear accumulation rate s and mass accumulation rate r along the depth of the peat profile.
Applsci 12 10870 g006
Figure 7. Plot of factor loadings for the ISNO-1 peat profile. Red circle is a group of factors.
Applsci 12 10870 g007
Table 1. Change in the degree of decomposition, natural moisture content, bulk density, ORP (Eh4), and the rH-index of peat by depth.
Layer, cmDegree of Decomposition
R, %
Natural Moisture Content, g/g Absolutely Dry MatterBulk Density, g/cm3Eh4, mVrH
0–10023.96 ± 0.230.075 ± 0.002428 ± 622.5
10–20523.57 ± 0.040.095 ± 0.001340 ± 719.5
20–30524.49 ± 0.070.097 ± 0.002200 ± 114.8
30–40720.66 ± 1.200.099 ± 0.003125 ± 312.2
40–50715.19 ± 0.110.109 ± 0.004109 ± 711.7
Table 2. Factor loadings matrix for data set on the ISNO-1 peat profile.
ParameterFactor
12345
Depth−0.97−0.06−0.17−0.09−0.10
137Cs0.670.210.340.170.43
210Pb0.780.190.180.000.53
234U/238U−0.08−0.230.060.700.12
U0.30−0.080.74−0.19−0.24
CO32−−0.040.120.780.43−0.08
Ash0.170.240.880.220.20
pHwater−0.870.01−0.080.30−0.22
pHsalt−0.650.060.350.54−0.24
Water-soluble salts0.710.020.320.52−0.02
Organic matter−0.17−0.24−0.88−0.22−0.20
N−0.27−0.31−0.05−0.07−0.89
C−0.17−0.91−0.28−0.16−0.12
H0.040.960.04−0.200.14
O0.32−0.120.470.720.17
H/C0.100.950.21−0.010.18
C/N0.250.12−0.020.100.92
O/C0.280.540.480.530.21
Oxidation level0.12−0.820.140.49−0.05
Moisture content0.750.260.350.36−0.20
Bulk density−0.96−0.060.21−0.05−0.09
Eh0.950.020.230.040.18
rHcp0.950.020.230.040.19
Variance9.974.253.881.841.05
Percentage of Variance (%)43.3518.5016.878.004.55
Cumulative (%)43.3561.8478.7286.7291.26
Publisher’s Note: MDPI stays neutral with regard to jurisdictional claims in published maps and institutional affiliations.

