Article

Failure Behaviour of Jointed Rock Masses with 3D Nonpenetrating Joints under Uniaxial Compression: Insights from Discrete Element Method Modelling

1
School of Resources and Safety Engineering, Central South University, Changsha 410083, China
2
Changjiang River Scientific Research Institute, Wuhan 430015, China
3
State Key Laboratory of Geohazard Prevention and Geoenvironment Protection, Chengdu University of Technology, Chengdu 610059, China
*
Authors to whom correspondence should be addressed.
Appl. Sci. 2022, 12(21), 11027; https://doi.org/10.3390/app122111027
Submission received: 12 October 2022 / Revised: 26 October 2022 / Accepted: 28 October 2022 / Published: 31 October 2022
(This article belongs to the Special Issue Advances in Failure Behavior of Rocks)

Abstract

:
It is well known that joints or fissures have an important effect on the failure mechanism of natural rocks. Previously, many numerical and experimental papers have been carried out to study the strength anisotropy and failure characteristics of jointed rocks. However, few studies have been carried out on the failure mechanism of nonpersistent jointed rock masses with different persistence, especially for nonpersistent joints in three dimensions. In the present study, the failure characteristics of a 3D nonpersistent jointed rock mass with different inclinations (θ) and persistence (K) are studied by numerical simulation. For the 3D digital elevation model (DEM), the linear parallel bond model (LPBM) and smooth-joint model (S-J) were used to model the rock-like material and joint interface, respectively. The connections between the geometric parameters of joints and peak strength are revealed. For the peak strength, the joint persistence only plays a minor role in specimens with inclinations of 0° and 90°, and its influence on strength is mainly reflected in the specimens with shear failure (θ = 45°, 60°, and 75°). Based on microcrack accumulation and evolution, four typical failure processes (shear failure, split failure, mixed failure, and intact failure) are analysed from the micro perspective. The shear stress evolution process on the 3D nonpersistent joint of the specimen with different inclinations under K1 = 0.42 was monitored by the measurement circle, and it was found that the distribution of shear stress inside the rock bridge is related to the failure mode of the specimen. For the specimens with θ = 0° and 90°, the shear stress had little change, indicating that there is slight shear slip behaviour on the joint surface. When the inclination is 45°, 60°, and 75°, the shear stress changes obviously during loading, indicating that the shear action is strong in this failure mode.

1. Introduction

Natural rock masses generally contain joints, the presence of which play an important role in the mechanical properties of rock masses. Research on the failure behaviour of jointed rock masses has always been an influential field in rock mechanics. Typically, rock joints are classified as penetrating and nonpersistent joints. The mechanical properties of nonpersistent joints in uniaxial compression have been one of the fundamental issues in the research of the mechanical behaviour of jointed rock masses. Erdogan and Sih [1] first studied the failure characteristics of joint specimens under uniaxial loading. After that, many scholars carried out experimental and theoretical derivation research in this field. Yang et al. [2] performed uniaxial compression on intermittently prefabricated fractured marble to probe the impact of the geometric distribution on the deformation and failure characteristics of marble. Wang et al. [3] studied the deformation and failure mechanisms of nonpenetrating rock masses under uniaxial compression from the perspective of energy evolution. Liu et al. [4] established a dynamic failure intrinsic model of nonpersistent jointed rock masses with uniaxial compression based on the Taylor–Chen–Kuszmaul (TCK) model. Yuan et al. [5] established an elastic-plastic fracture model of nonpersistent jointed rock under ballast action on the basis of the Drucker-Prager (D-P) criterion. Shen et al. [6] performed uniaxial loading of gypsum specimens containing double prefabricated cracks, and based on a modified maximum strain energy release rate criterion (G-criterion) and displacement discontinuity method (DDM), crack propagation and incorporation behaviour were predicted. Bobet et al. [7] carried out uniaxial and biaxial tests on prismatic specimens under parallel double cracking to investigate crack propagation and coalescence processes and found that the geometry of the crack and the surrounding compressive stress play an important function in crack evolution. Apart from specimens with joints in two dimensions, a small number of scholars have also carried out experimental and numerical simulation research on three-dimensional joints. For example, Dyskin AV et al. [8] investigated the mechanism of three-dimensional crack development during uniaxial compression by fabricating and uniaxially compressing specimens containing a single prefabricated fracture-like rock, and they concluded that the individual presence of cracks has a limiting effect on the three-dimensional propagation of wing cracks. Zhou et al. [9] investigated crack initiation, wrapping and coalescence in specimens with 3D cross-embedded flaws under uniaxial compression. Based on uniaxial tension tests on precracked rock-like specimens, Yang et al. [10] fabricated red sandstone specimens containing two unparallel cracks and characterized the crack evolution of the specimen with different crack inclinations under uniaxial loading.
In contrast to laboratory tests, numerical simulations are utilized to simulate the failure processes of jointed rock due to their economical properties. For the rock fracture process, particle flow code (PFC) has been the most popular simulation method in the past ten years. Based on PFC2D and the parallel bonding model, Sarfarazi et al. [11] explored the effect of joint overlap on the shear failure mechanism of rock bridges from both macroscopic and microscopic perspectives. By using PFC2D, Yang et al. [12] investigated the fracture behaviour of red sandstone specimens with nonparallel flaws under uniaxial compression, and the fracture behaviour during deformation was analysed and discussed. Cao et al. [13] simulated the peak strength and failure characteristics of multifractured rock materials under uniaxial loading by PFC2D and classified the failure modes of multifractured specimens into four categories. Fan et al. [14] established a numerical model of a specimen with multiple nonpersistent joints by PFC3D and investigated the effects of joint geometry parameters and particle parameters on the deformability and damage mode of the specimen under uniaxial compression. Apart from the PFC, numerical methods such as the finite element method (FEM), realistic failure process analysis (RFPA), and fast Lagrangian analysis of continua (FLAC) have also been adopted by scholars, and most studies show good agreement between numerical simulations and experimental results. Fu et al. [15] performed 3D numerical simulations in FLAC3D using hyperfine meshes to completely simulate the brittle failure process of single fractured rock masses under uniaxial and biaxial compression. Zhang et al. [16] used FLAC3D to simulate the loading failure of nonpersistent backfill-jointed rocks and investigated the effects of factors such as joint length, dip angle, internal friction angle, and cohesion of the backfill on the mechanical properties of uniaxial compression. Based on extended nonordinary state-based peridynamics, Wang et al. [17] proposed a new method of simulation to model the crack evolution of jointed rocks under compressive loads. By using RFPA2D, Wong et al. [18] investigated the splitting fracture process of brittle rocks with different joint parameters under uniaxial compression, and the effect of joint length on the extension of wing-shaped cracks was discussed.
Although a significant amount of research has been conducted on the failure behaviour of nonpersistent joints, only a few studies have been conducted to investigate the failure mechanism of nonpersistent joints considering the influence of joint inclination and persistence, especially for nonpersistent joints in three dimensions. However, in practical engineering, most rock nonpersistent joints are 3D nonpersistent joints with different inclinations (Figure 1). Consequently, the failure behaviour of 3D nonpersistent joints should be studied further. In this research, the discrete element software PFC3D is used to establish a nonpersistent fracture joint specimen model and conduct uniaxial numerical simulation tests to explore the effects of joint persistence and inclination on the strength and failure process. The relation between peak strength and joint parameters was explored, and the crack initiation, propagation and fracture pattern of the specimen were studied. Moreover, the shear stress on the joint plane was monitored by using the measuring circle, and its evolution law was also discussed.

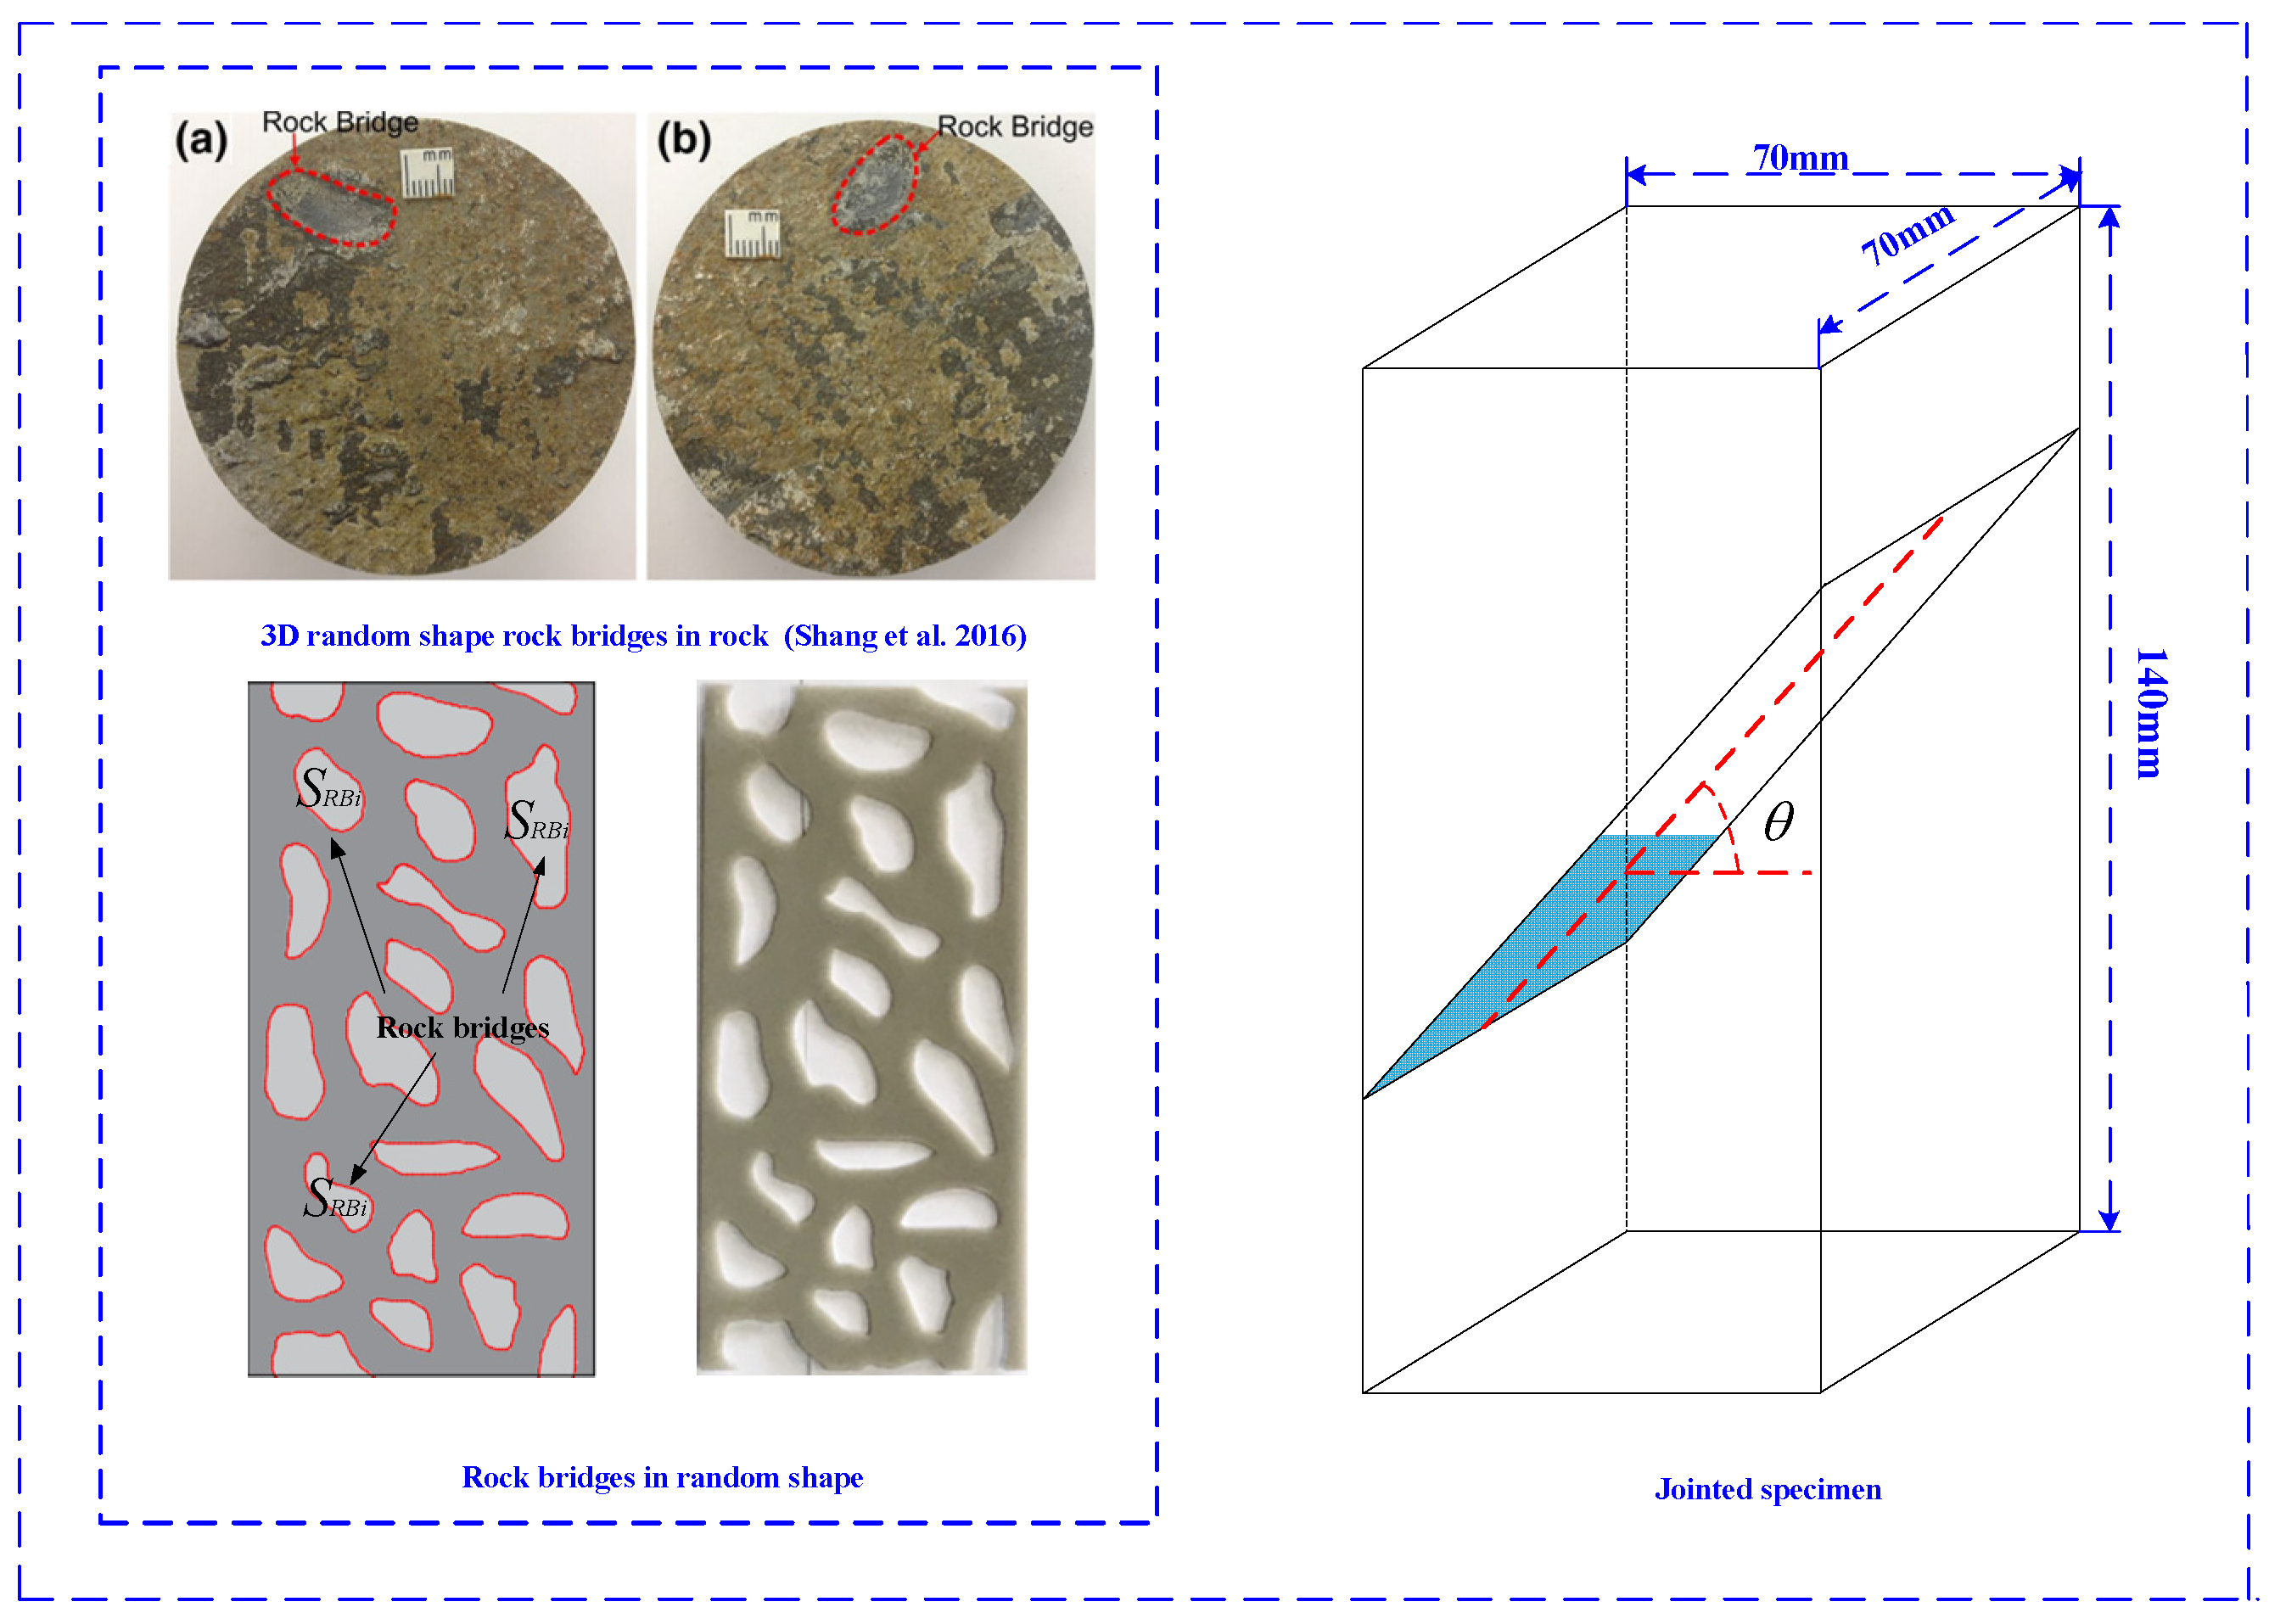
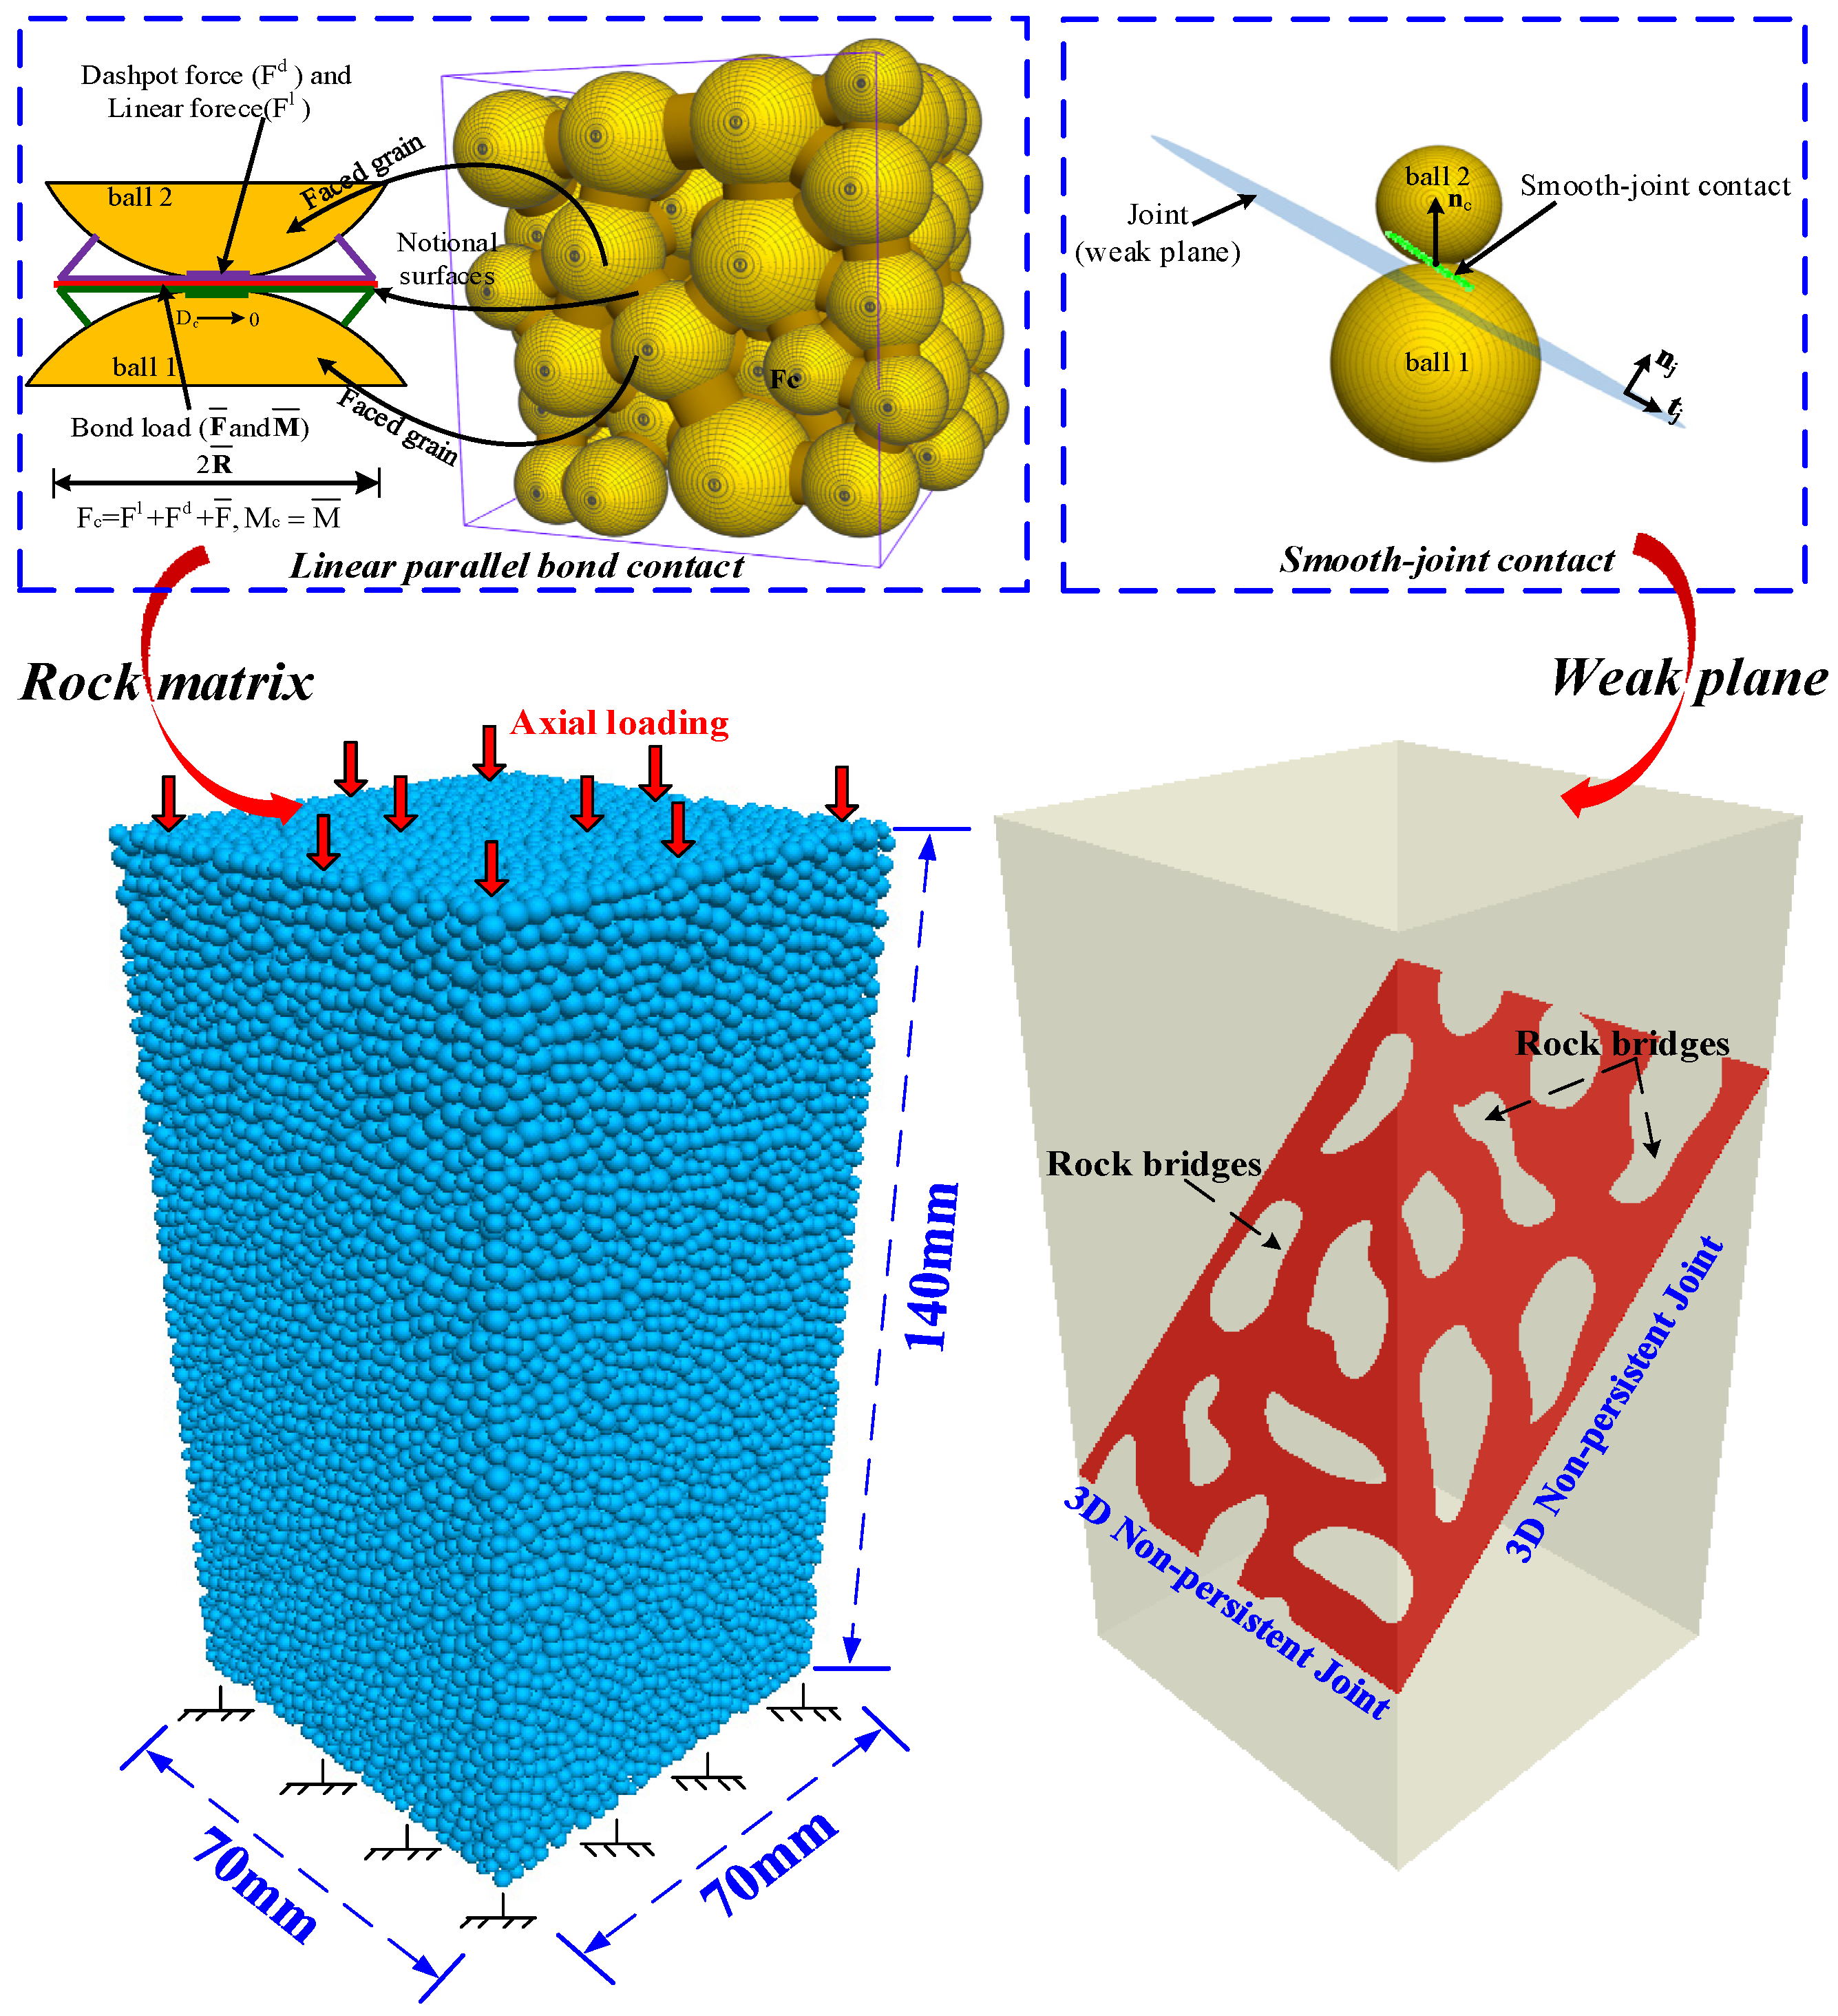
2. Model Setup and Microparameter Calibration

In practical rock engineering, most of the joints in natural rock masses are discontinuous joints. As shown in Figure 2, there are rock bridges with different shapes in the three-dimensional discontinuous joints. In previous studies, few papers have focused on the failure mechanism of 3D nonpersistent jointed rock masses. In the present paper, the fracture behaviour of a three-dimensional nonpersistent jointed rock mass was studied and analysed based on DEM. To study the effect of the inclination and persistence of 3D nonpersistent joints on the failure behaviour of rock masses, different inclination (θ = 0°, 30°, 45°, 60°, 75°, and 90°), and persistence (K1 = 0.42, K2 = 0.61, K3 = 0.75, K4 = 0.88 and K5 = 0.94) values are considered in this paper. The specimen number is used by S-θ-K, where S indicates the specimen, θ indicates the inclination, and K is the persistence. The dimensions of the experimental specimens are also shown in Figure 2.
For the joint persistence, as there are rock bridges with different shapes in the three-dimensional discontinuous joints, it is calculated based on the area ratio. Thus, the joint persistence of the 3D nonpersistent joint is:
K = S J S R B i S J
where SRBi is the total area of the rock bridges and SJ is the area of the complete joint [21].
Figure 3 shows the PFC3D numerical model for 3D nonpersistent joint specimens, and the external dimension of the PFC model is the same as that of the experimental specimen (70 mm in length and width, 140 mm in height). The particles belonging to the individual joint parts are identified separately, and the lower strength parameters are set to form a 3D nonpersistent joint surface.
In previous studies, PFC has been widely adopted to simulate the whole failure process of jointed rocks [22,23,24]. As we know, there are several kinds of contact models in PFC. In this paper, the linear parallel bond model and smooth-joint model have been adopted to simulate the rock-like material and joint interface, respectively. For the linear parallel bond model, since the bond follows the Coulomb criterion, as the corresponding strength limitations are breached, the bond undergoes tensile or shear failure. Previously, the joints of rock masses were modelled by eliminating particles or weakening strength parameters. However, this also leads to the problem of the high strength of the rock mass in the simulation results [14,25,26]. As the smooth-joint model allows the particles intersecting with S-J to overlap and pass through each other (Figure 3) and follows the Coulomb sliding model, this problem was also successfully resolved.
The experimental and simulated values during the parameter calibration are shown in Table 1. The microparameters of the linear parallel bond model are calibrated (by the “trail-and-error” method) based on the macro strength and deformation parameters (including the uniaxial compression strength, elastic modulus and Poisson’s ratio), which were acquired from mechanical tests of rock-like materials, and the calibration results are shown in Table 2. At the same time, the microparameters of the smooth-joint model were calibrated by the shear parameters (including normal stiffness, shear stiffness and friction angle) obtained from laboratory direct shear tests of specimens with intact planar joint planes, as shown in Table 3.

3. Results and Discussion

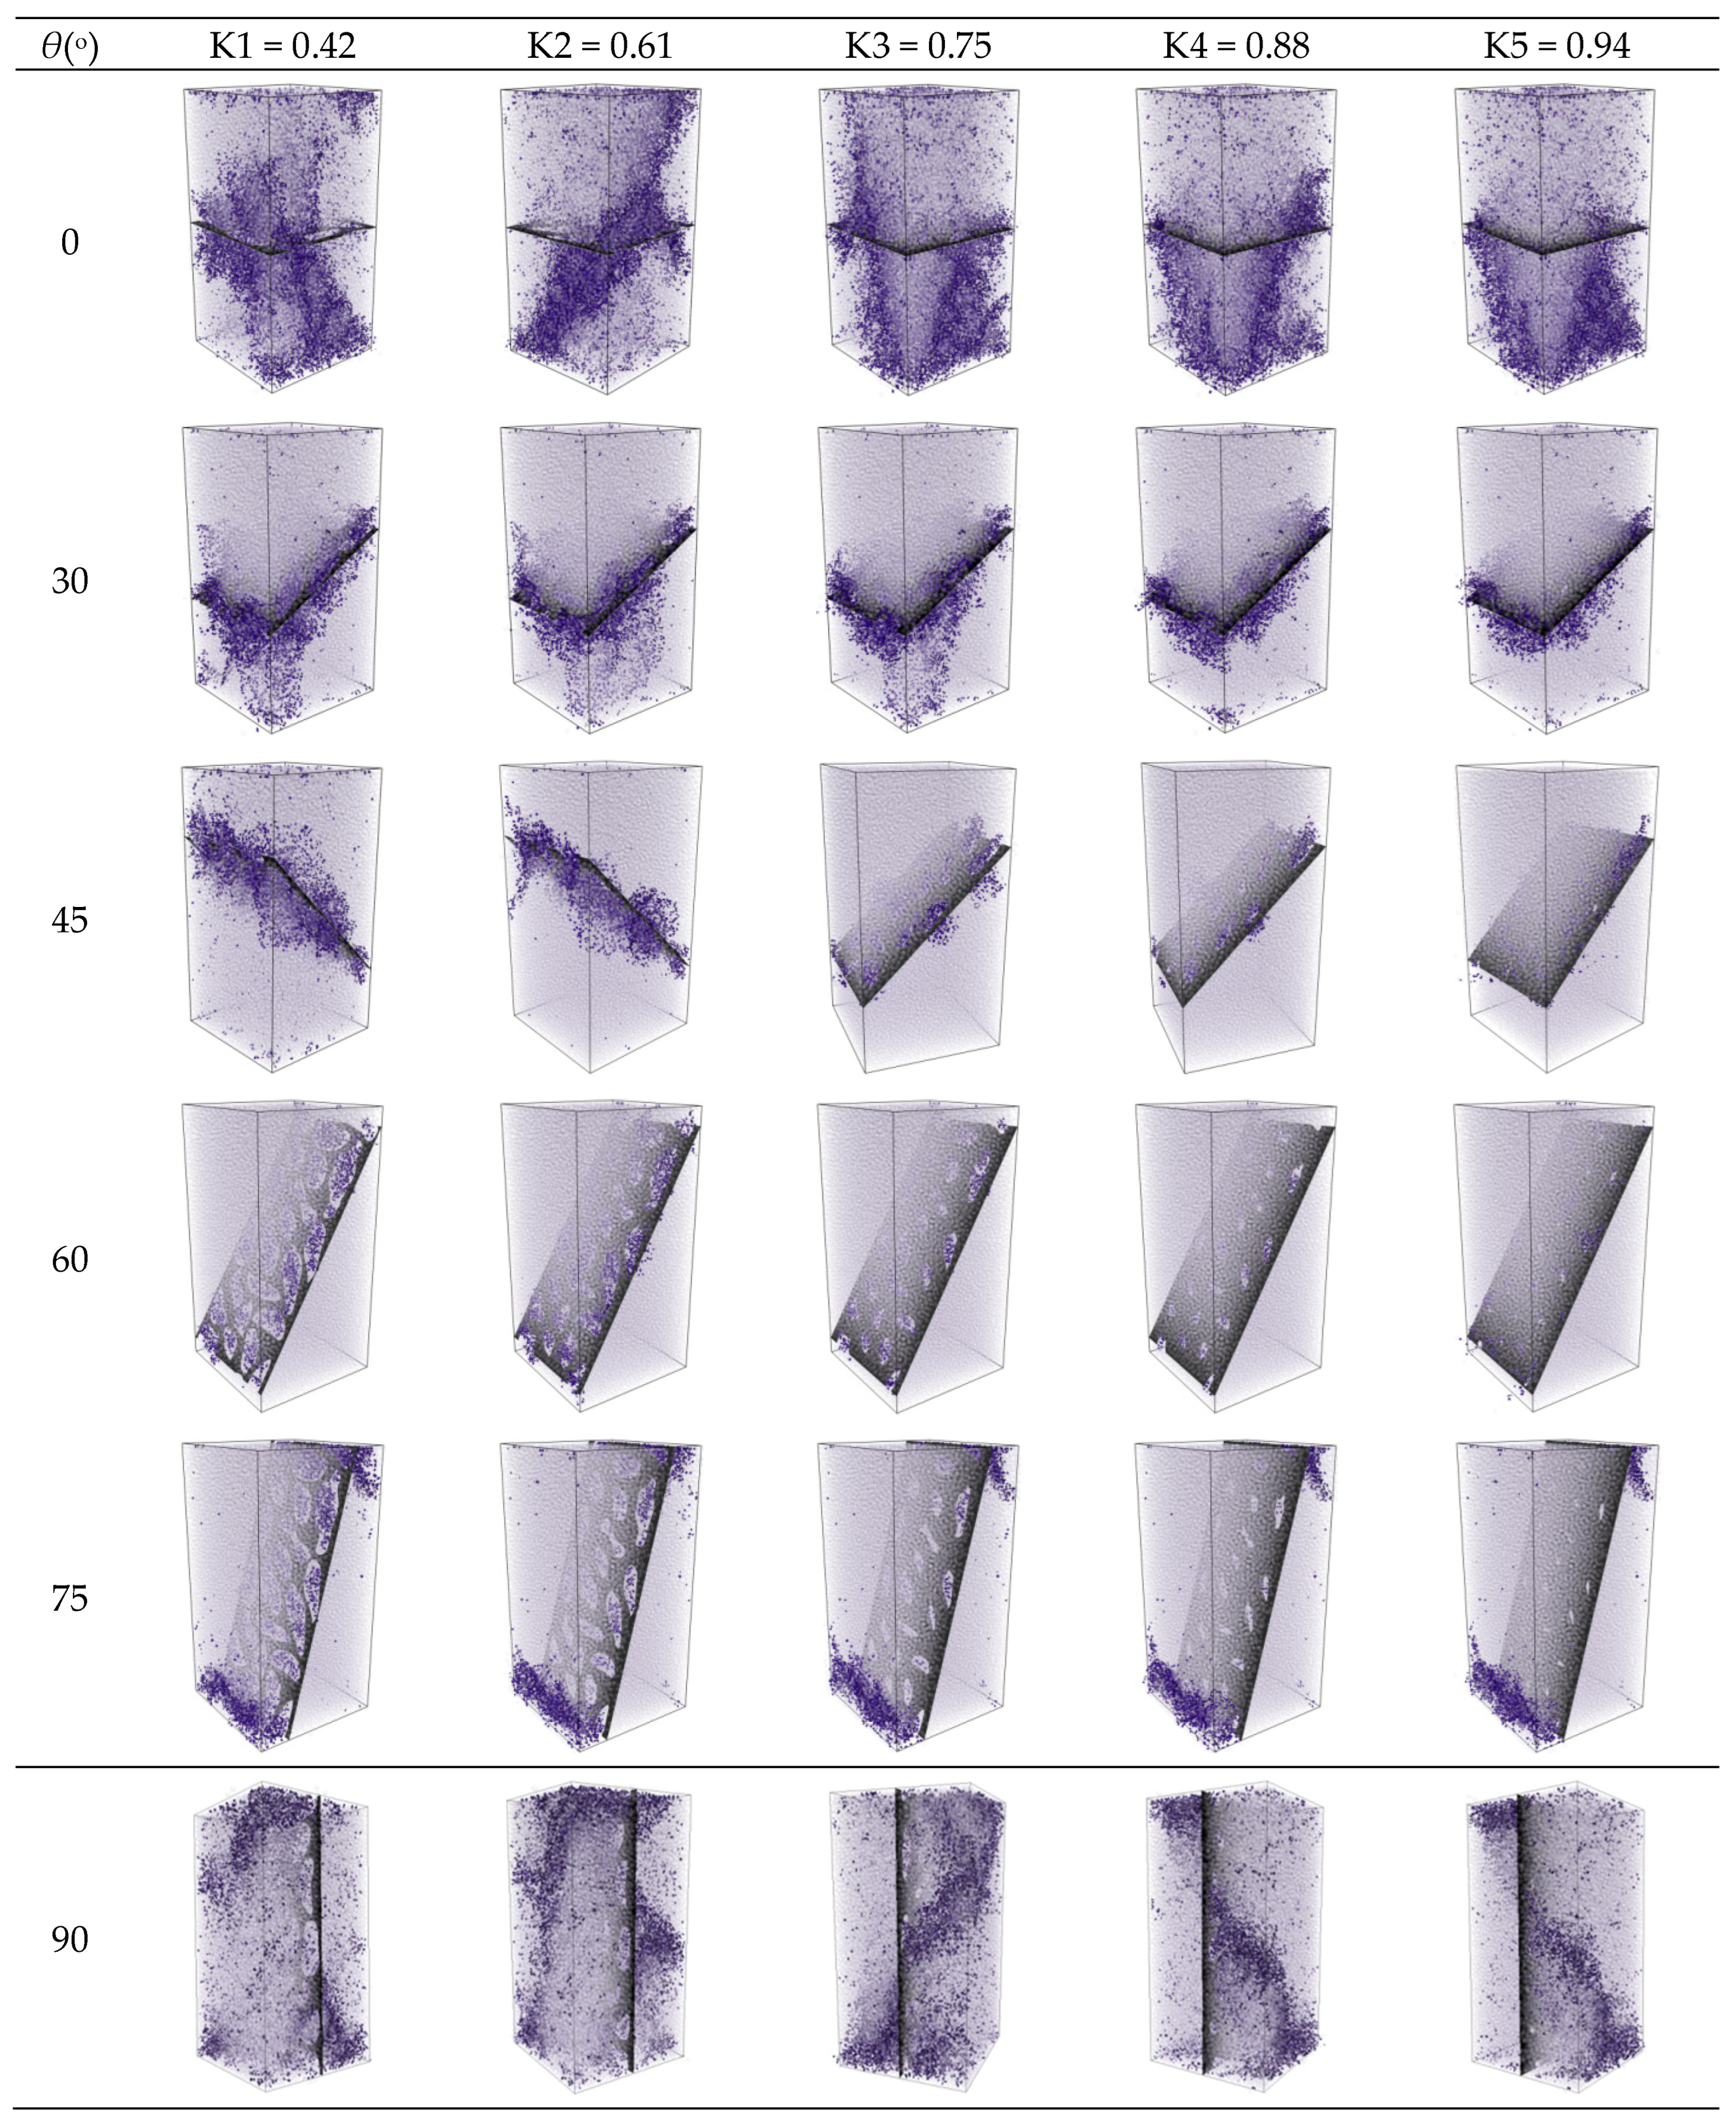
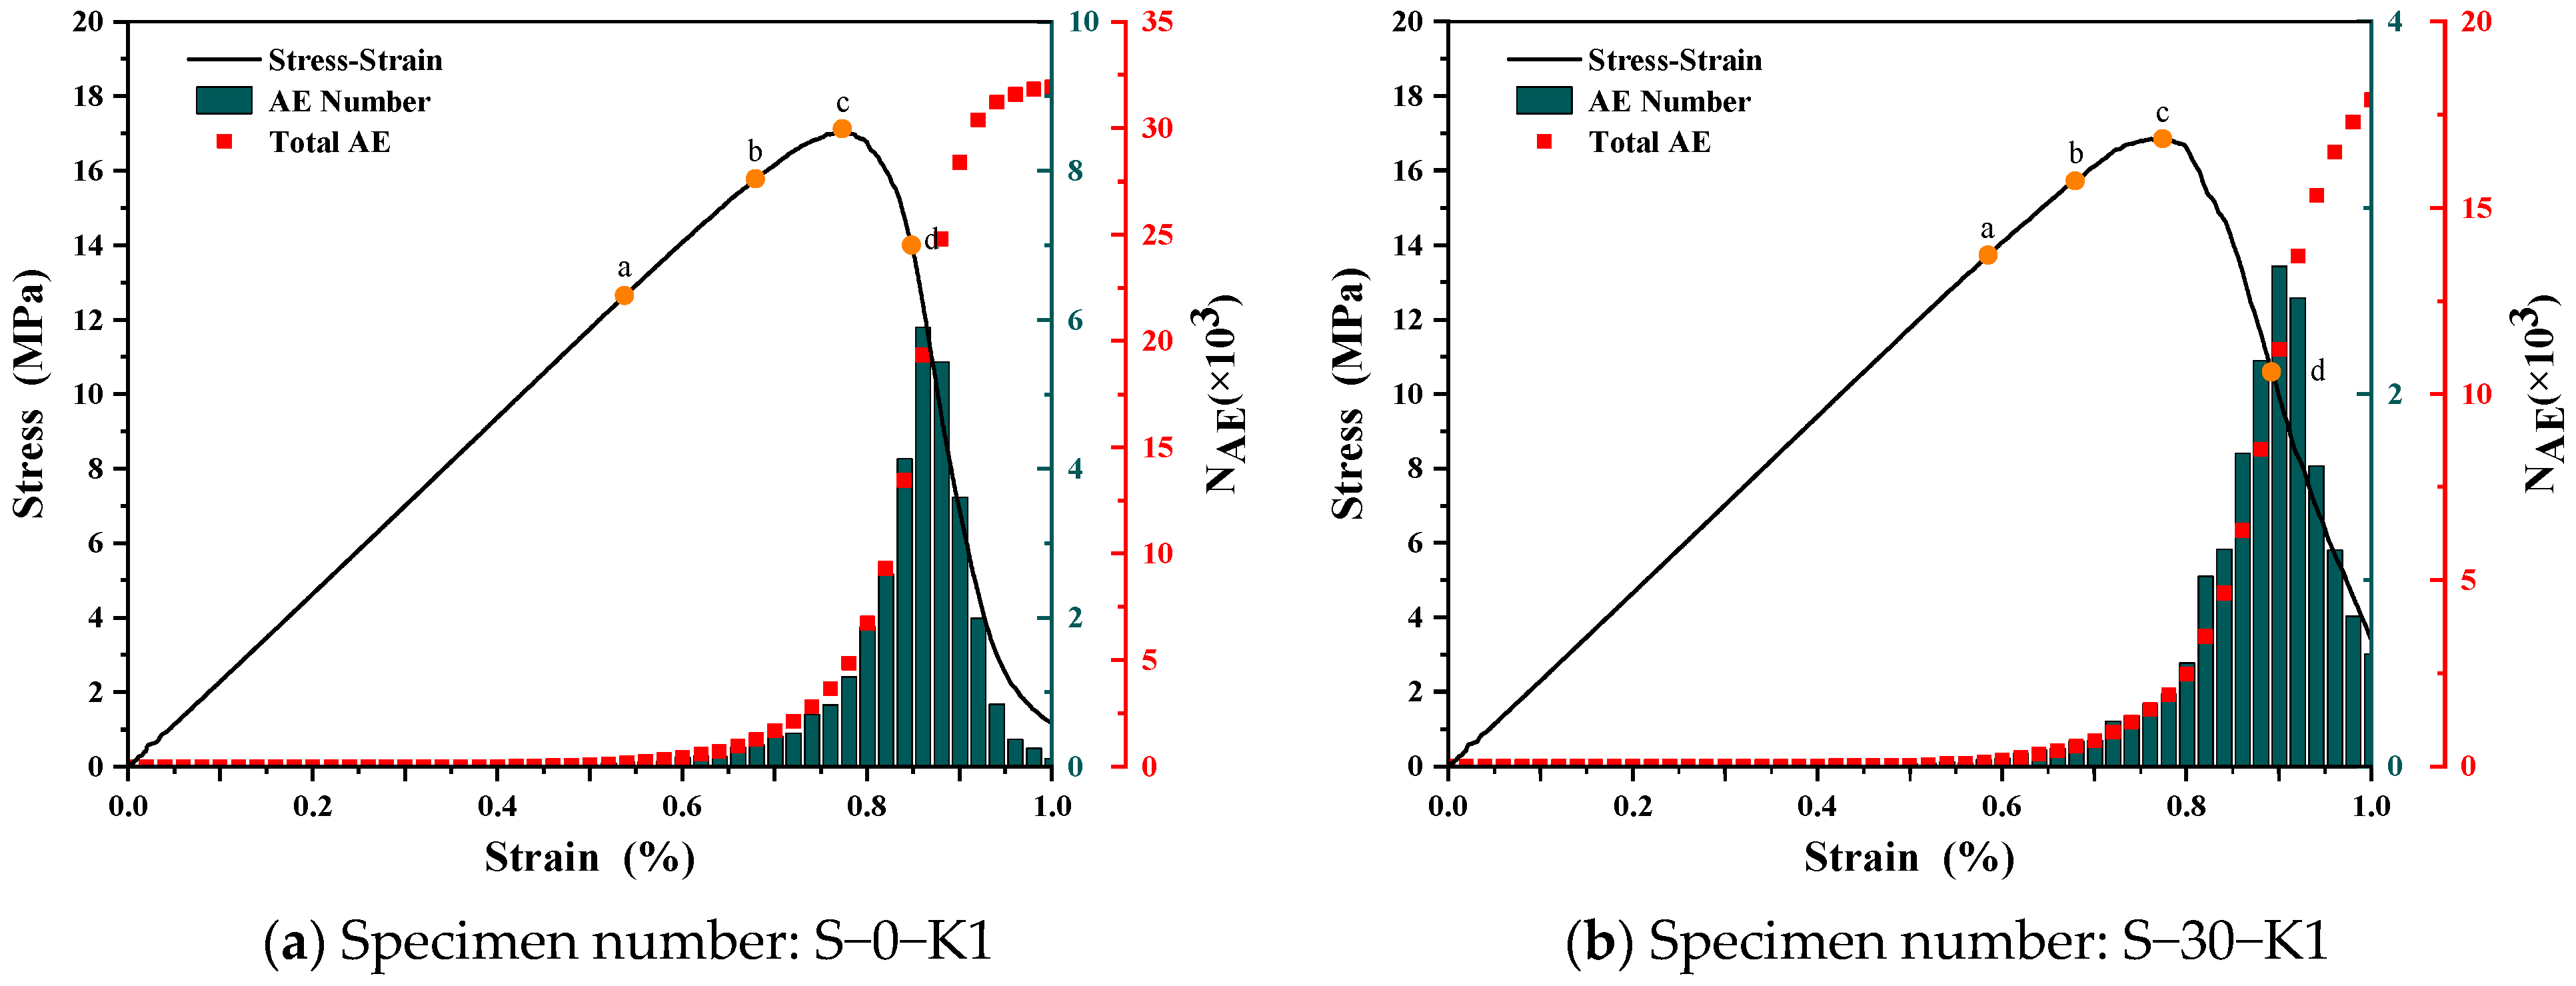
3.1. Strength and Failure Modes

Figure 4 shows the peak strength of the 3D nonpersistent-jointed specimen obtained from numerical simulation. For the specimen with inclinations θ = 0° and 90°, when the joint persistence varies from 0.42 to 0.94, the peak strength is basically stable, and the strength of the specimen is closer to the initial strength value (peak strength of the intact specimen). However, when the inclination angle θ = 45° to 75°, as the joint persistence varies from 0.42 to 0.94, the peak strength of the specimen decreases obviously. This also indicates that the joint persistence plays an important role in the peak strength for the specimens with joint inclinations of 45° to 75°.
With the change in θ, the failure characteristics of jointed specimens will also change greatly. For the specimens with θ = 45° to 75°, due to the influence of θ, the specimens mainly failed due to slippage along the joint plane. Thus, with the increase in joint persistence (K), the smaller the proportion of rock bridges on the joint plane, the weaker the resistance to sliding along the joint surface. Therefore, the joint persistence has a great effect on the strength of the specimens that experience slippage failure. However, when θ ≤ 45° or θ = 90°, the failure behaviour of the specimens is closer to the split failure, and almost no slippage occurs along the joint plane. Thus, the joint persistence seems to play a minor role in the strength of the specimens that experience splitting failure.
Figure 5 shows the peak strength comparisons between the test and numerical results. In general, the numerical results show great agreement with those obtained from the laboratory tests. For all joint persistence conditions, the strength of the specimen with θ = 0° and 90° is closer to the initial strength value, and it is obviously different from the strength of specimens with inclinations of 45° to 90°. However, it should be noted that when the joint inclination of the specimen is 30°, its failure mode is the combination of splitting and shear. Thus, its strength is also in the transition position, and the change in joint penetration has a medium impact on it.
Figure 6 shows the failure patterns for jointed specimens with different inclinations and persistence. Figure 6 shows that for the specimen with inclination θ = 0°, all specimen failures belong to splitting failure, and the splitting plane in the specimen originates near the 3D nonpersistent joint plane. When the inclination angle θ = 45° to 75°, there is no splitting failure plane in the specimen; instead, there is an obvious slippage fracture plane along the joint plane. This also indicates that the specimen fails from the shear crack coalescence between the rock bridges. It is not difficult to find that the failure mode of the specimen with θ = 30° is in the transition region between splitting failure and shear failure. There are not only shear fracture planes but also partial splitting failure bands in the specimen, especially for the specimen with joint persistence values of 0.42 and 0.61. The reason for this phenomenon is that with the increase in joint persistence, the weaker the ability of the rock bridge to resist shear fracture, so it is easier to form shear failure. Unlike the specimen above, the failure mode of the specimen with θ = 90° is very close to the failure characteristics of the intact specimen. Although splitting and shear failure planes are apparent in the specimens, there is no correlation between the splitting/shear failure plane and joint, and the joint seems to have little effect on the failure mode of the specimen.
The comparisons between the failure modes obtained from the numerical and experimental tests are shown in Figure 7. The experimental and simulated stress-strain curves are shown in Figure 8. The experimental curve is fundamentally consistent with the simulated curve. For the mixed failure and shear failure mode, a visible shear failure band can be found in the specimen along the joint plane. In the numerical results, the splitting failure plane in the mixed failure and splitting failure mode agree well with the experimental results. In addition, for the intact failure mode (the specimen with θ = 90°), a macroscopic shear fracture zone appears near the diagonal of the specimen, which appears in both the numerical simulation and experimental results.

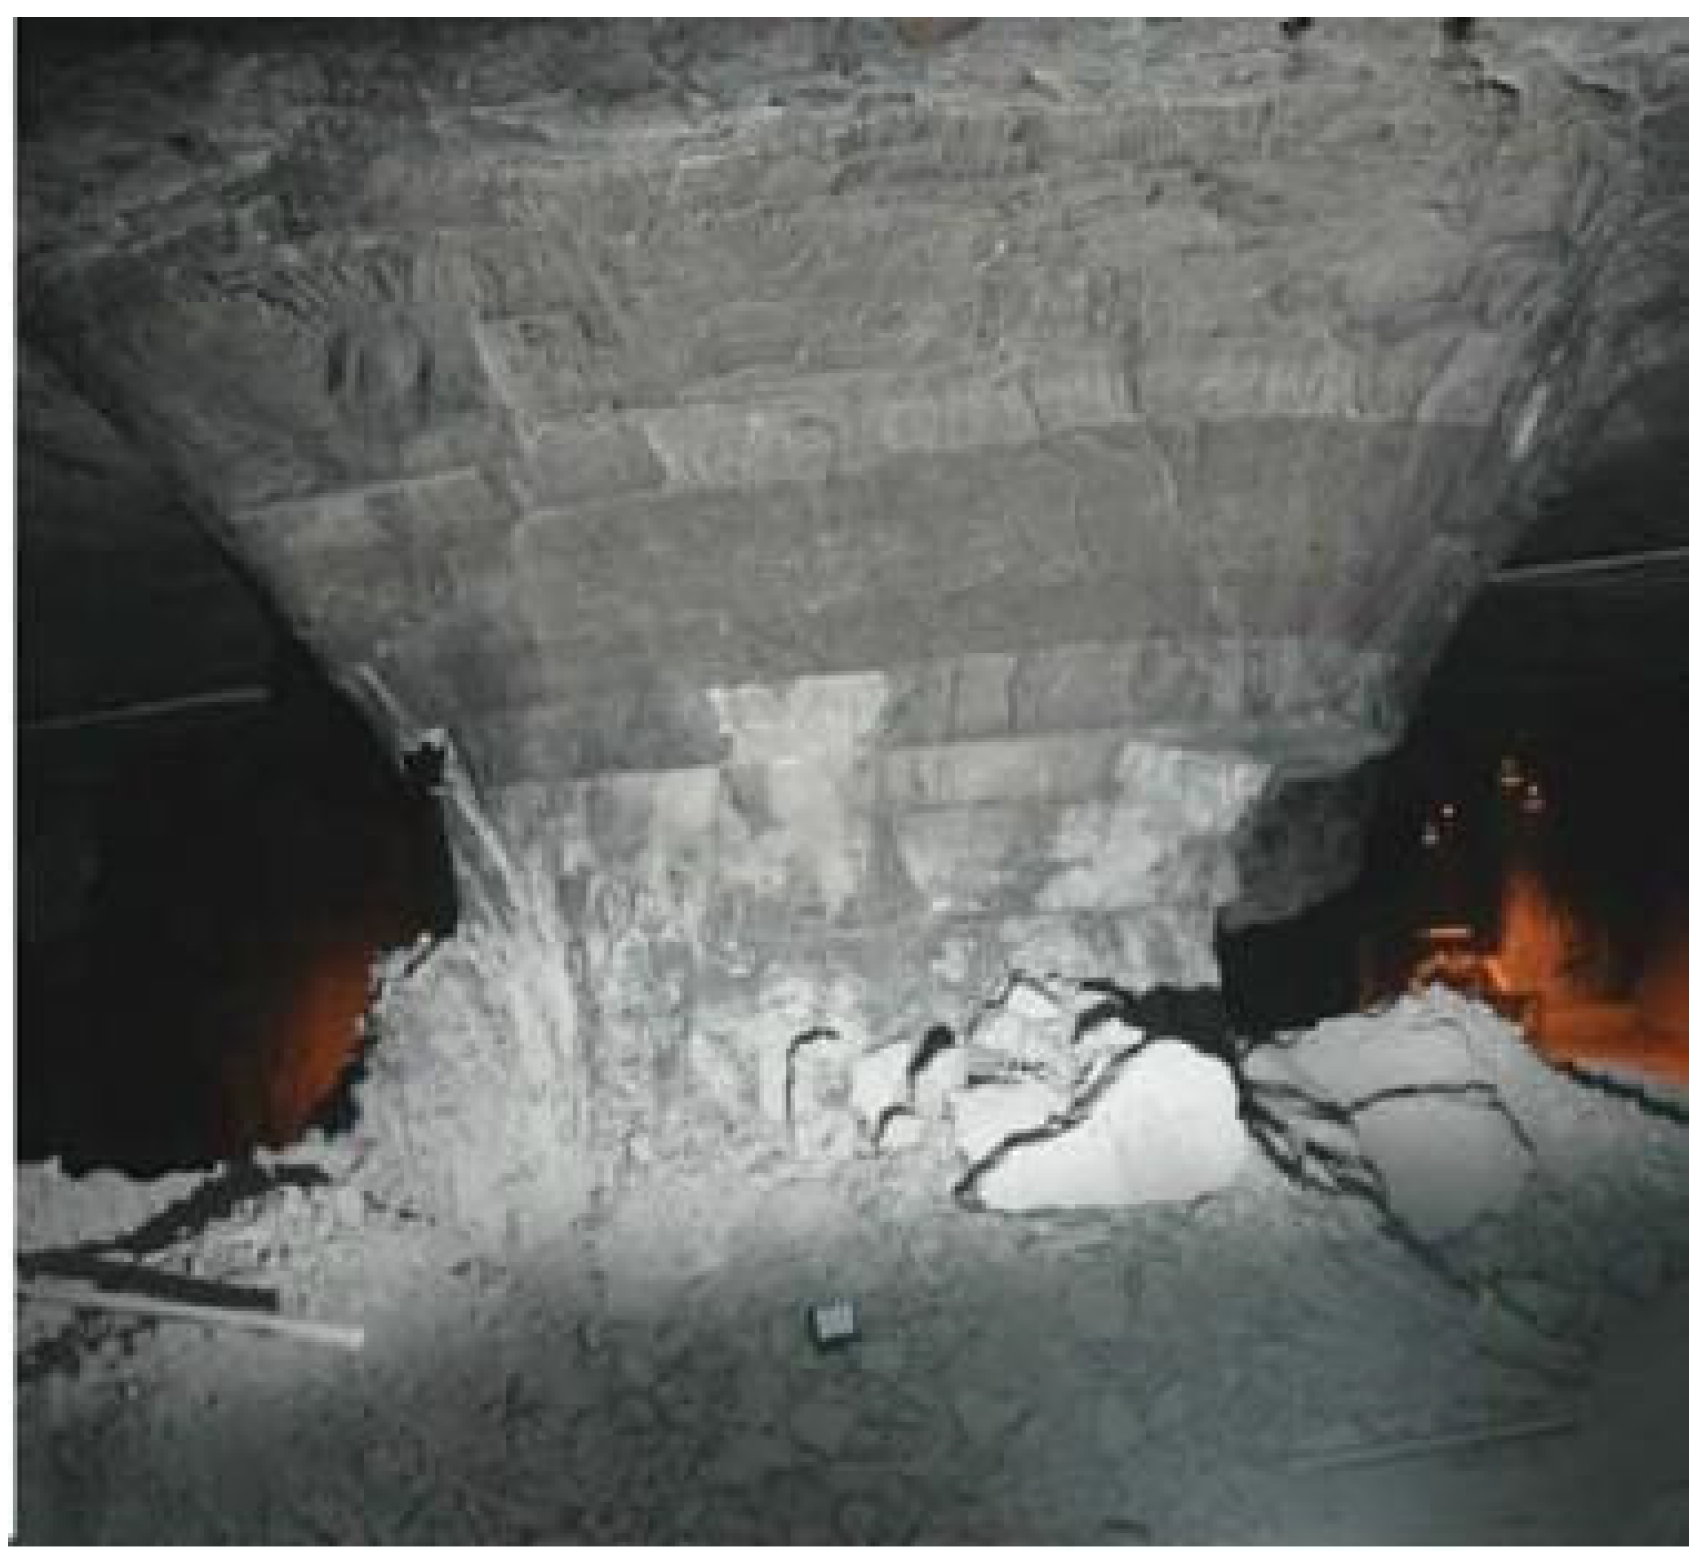
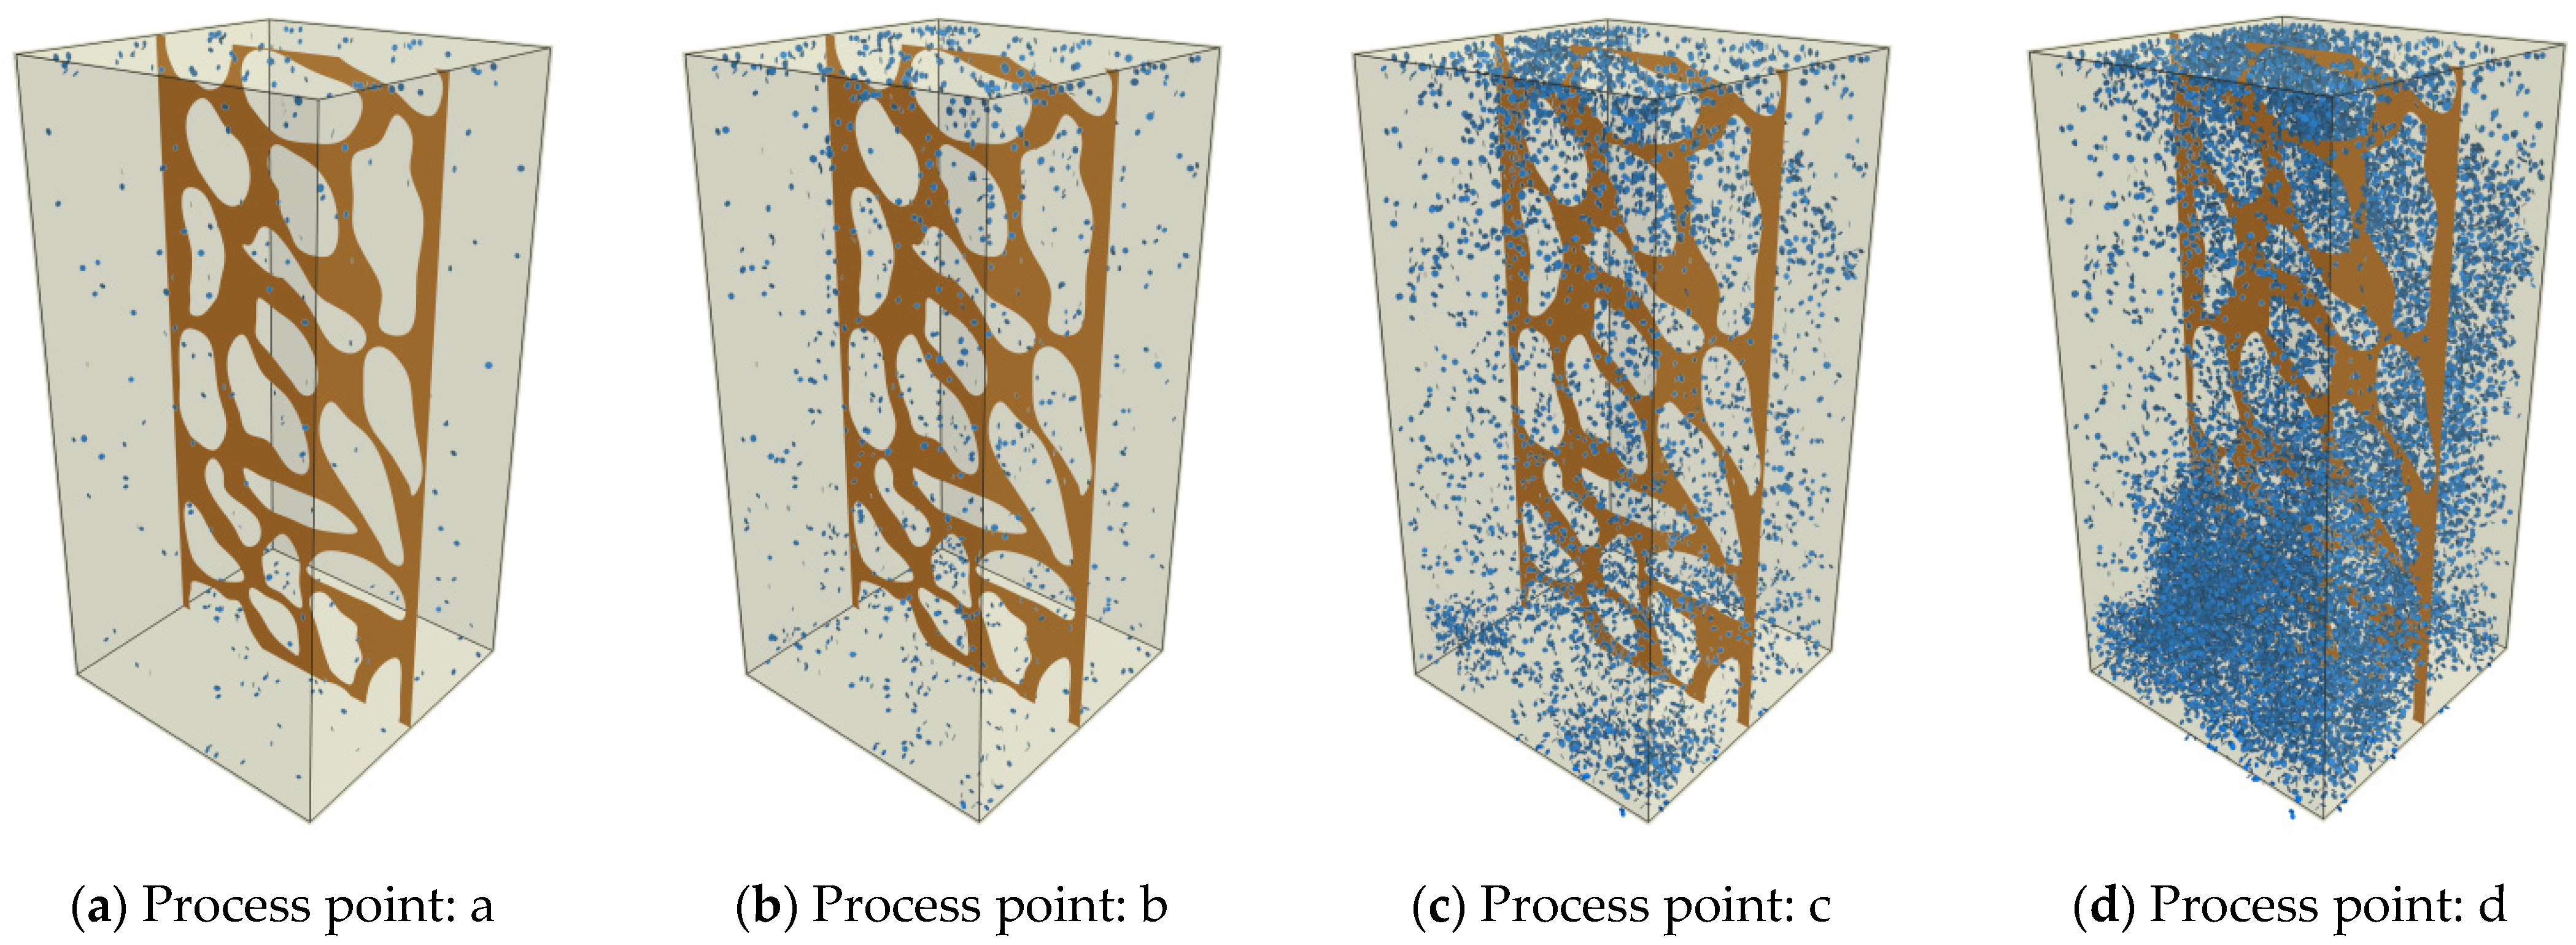
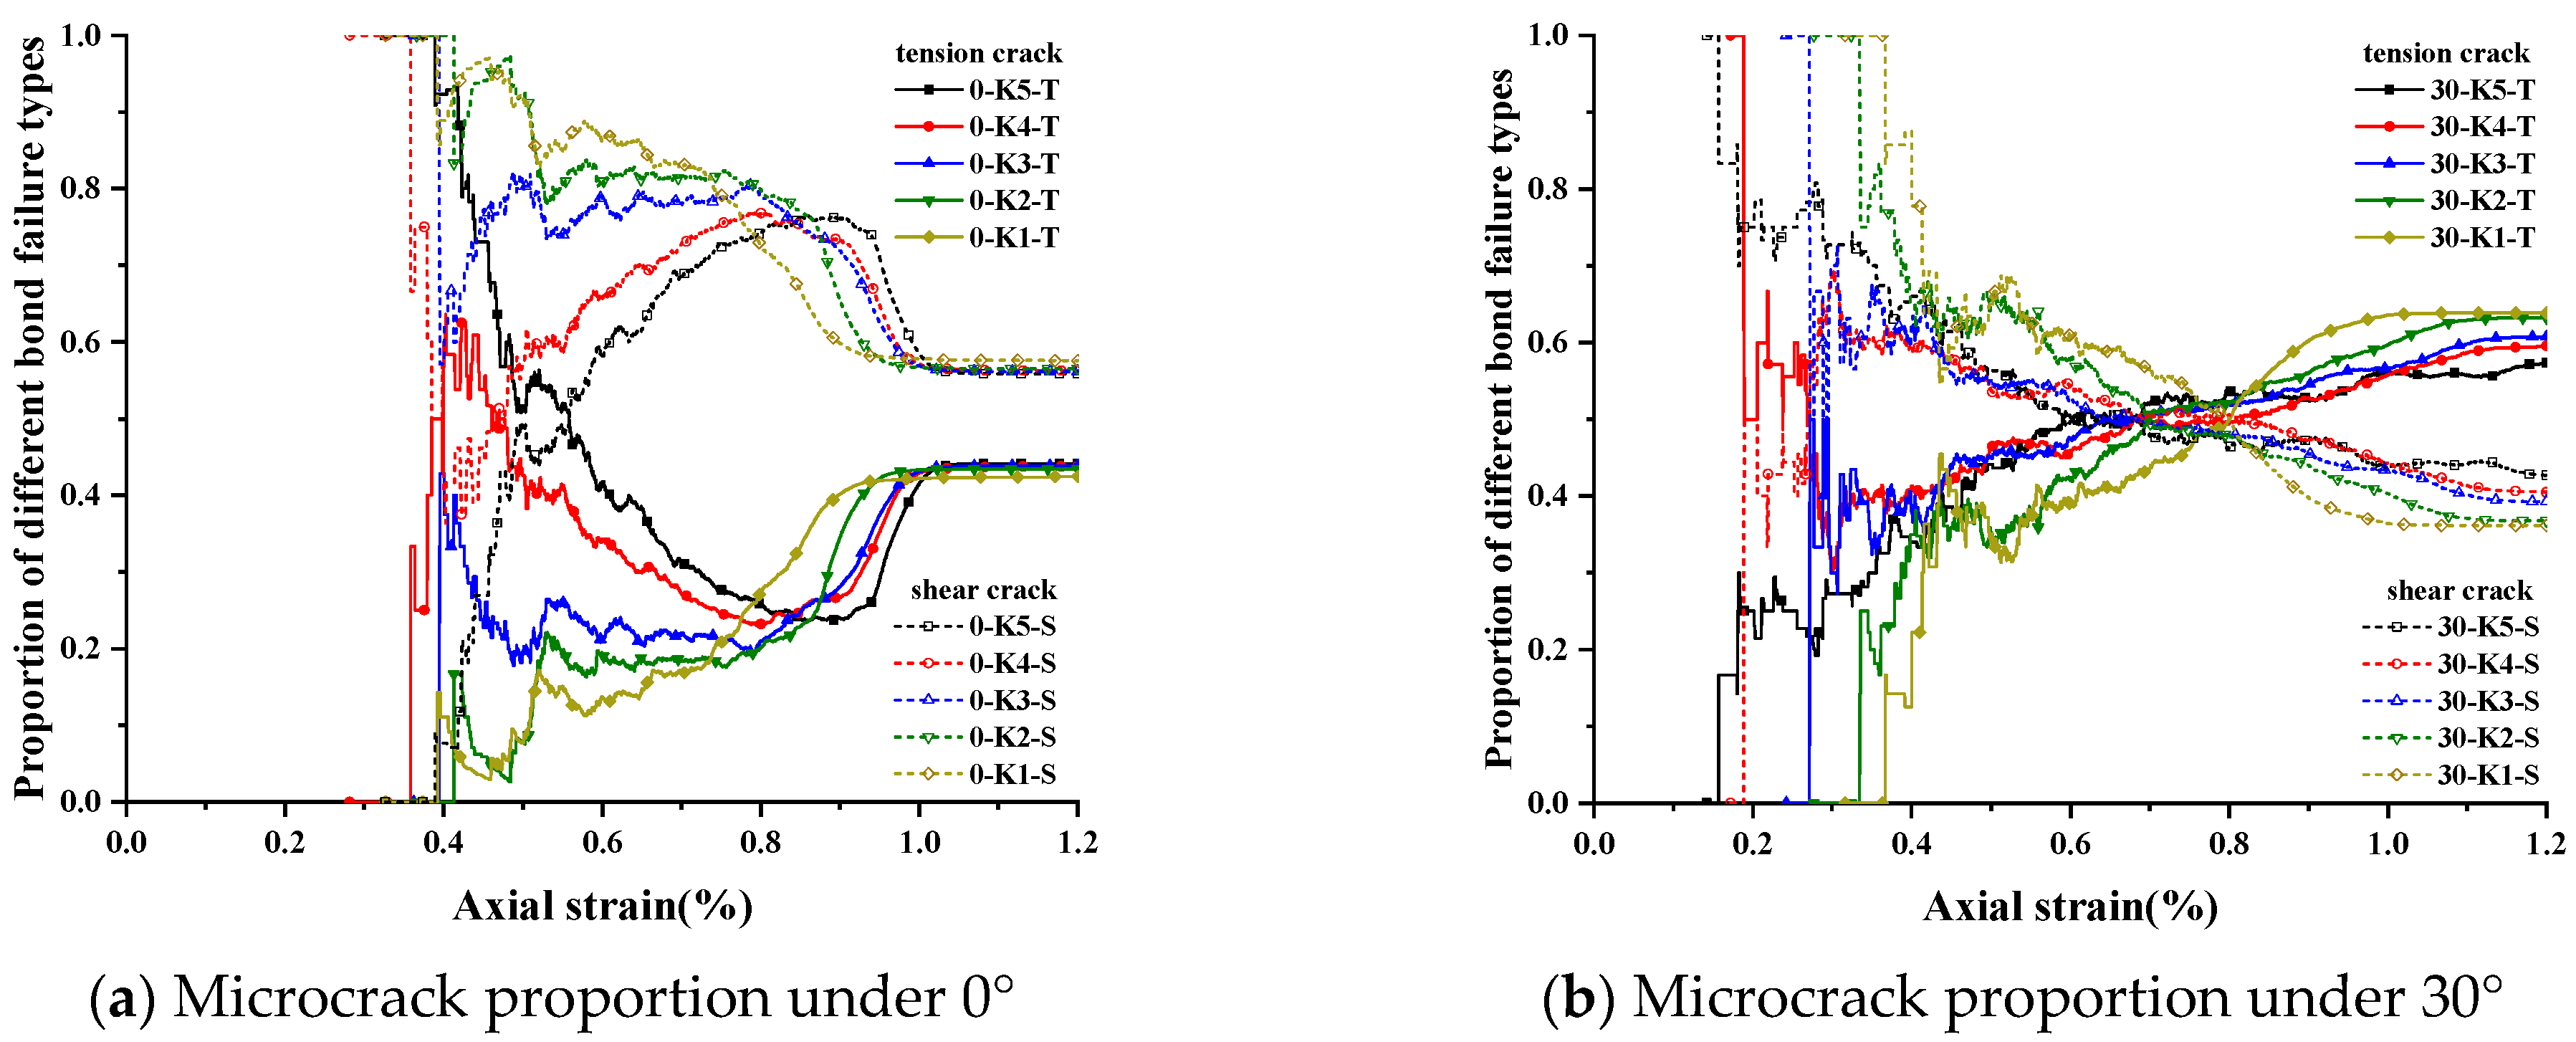
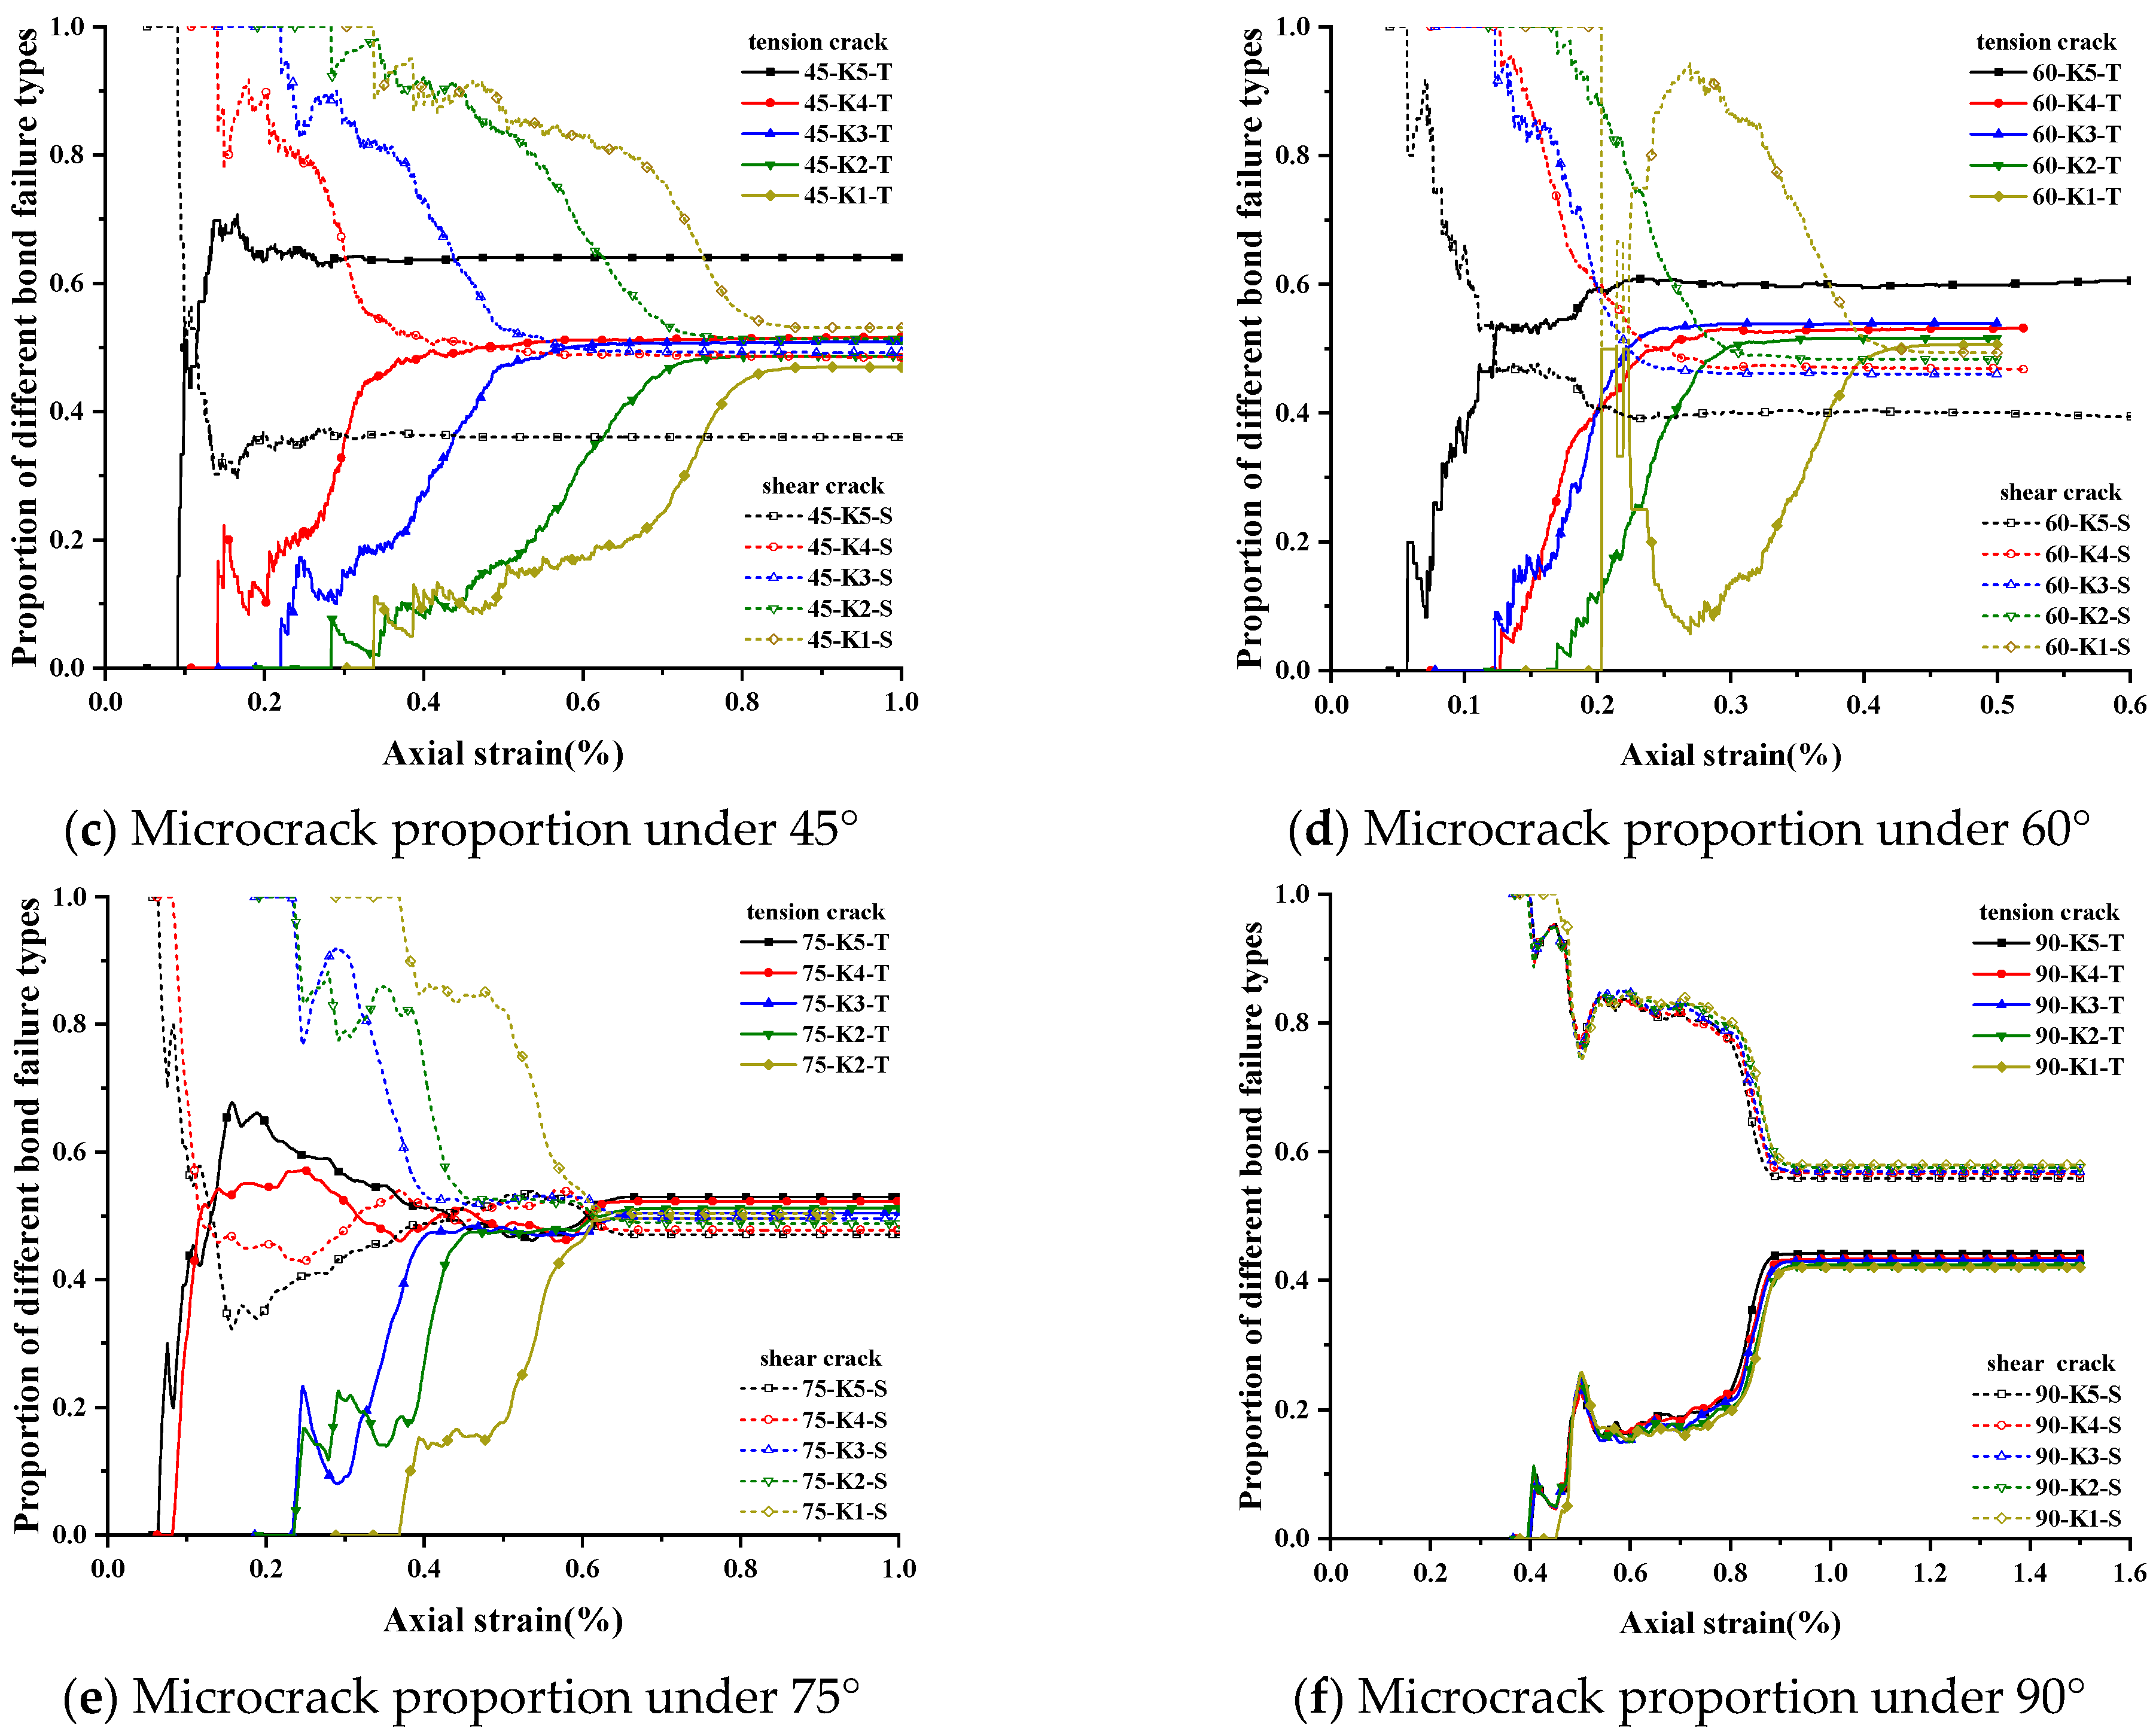
3.2. Failure Characteristics

Figure 9 shows the axial stress-strain curves and acoustic emission (AE) accumulation of the nonpersistent fractured rock specimens with different inclinations. The green histogram exhibits the AE counts over axial strain, the red scatters represent the green histogram exhibits the AE counts over axial strain, and the red scatters represent the accumulation of AE counts. Based on the accumulation trend of AE counts, the failure process can be classified into four stages: the first stage is the linear elastic stage (before point a), in which the microcrack behaviour is very limited and almost no AE signal is generated. After the longer linear elastic stage, the specimen enters the second stage (stable crack growth stage-from point a to b). In this stage, obvious acoustic emission signals are generated, and macroscopic cracks appear and expand inside the specimen. For the third stage (unstable crack growth from point b to c), the AE counts increase significantly with increasing axial load. As the slope of the cumulative AE counts increased rapidly, it also indicated crack growth and coalescence at this stage. The last stage can be called the postdestruction stage (after point c), in which the acoustic emission count is still increasing, the microcracks expand and develop into through-cracks, and the specimen exhibits obvious macroscopic failure.
The particle flow simulation can monitor and count the damage evolution of microcracks in the fracture process. Figure 10, Figure 11 and Figure 12 show the damage evolution process of the nonpersistent jointed rock mass with different inclinations. For each specimen, four points a, b, c, and d (which correspond with Figure 9) were recorded to analyse the microcrack accumulation and macrocrack growth during loading. For the specimen in the splitting failure mode (specimen S-0-K1), the damage evolution process is shown in Figure 9a–d. As shown in Figure 10a,b, before peak stress, crack initiation occurs randomly inside the specimen. Although there are many internal microcracks, no visible macroscopic fracture surface is found. When loading reaches point c, as the crack further develops, the cracks are densely generated on the outer edge of the joint, forming a damage zone (Figure 10c). As the loading continues, at point d, many microcracks gather inside several rock bridges, which indicates that these rock bridges are fractured. Additionally, the splitting failure surface is derived from the boundary position of the rock bridge.
For the specimen with an inclination of 30° (S-30-K1), microcracks first concentrate near the joint surface (Figure 11a). With continuous loading, more microcracks gather in the rock bridge (Figure 11b). This indicates that the failure starts from the damage of the rock bridge, and the derivative development of microcracks is also located near the rock bridge. With the rapid increase in the number of cracks under axial loading, at point c, a potential shear fracture surface appears near the joint surface. At the same time, many microcracks are derived in the direction parallel to the loading direction, which means that a tensile fracture surface appears at the boundary of some rock bridges (Figure 11c). The mixed failure mode can be clearly seen in Figure 11d. A large number of contact failures occurred near the top and bottom of the joint, and a splitting failure surface composed of microcracks appeared on the lower side.
Unlike the specimen above, the microcracks first appeared in the interior of the rock bridge on the joint plane, and no microcracks appeared in the rest of the model (Figure 12a). As the loading continues, the microcracks accumulate in the rock bridge, leading to the continuous damage of the rock bridge (Figure 12b). When the load reaches the peak value, the shear fracture surface along the joint surface is clear, and some microcracks are also gathered at the bottom and top of the specimen (Figure 12c). After failure, on the joint surface, all of the rock bridges are severed, and there are no other fracture surfaces in the model, especially splitting failure (Figure 12d). Compared with the specimen above, the acoustic emission events of specimen S-75-K1 are much less frequent (Figure 9). This phenomenon is mainly attributable to the failure of the specimen concentrated on the joint plane.
Specimen S-90-K1 belongs to the intact failure mode. In this mode, the failure characteristics of the jointed specimen are very close to those of intact specimens. As shown in Figure 13a–d. Regardless of the loading stage, microcrack aggregation occurs in the rock bridge and other positions of the specimen, and the joint plane seems to contribute very slightly to the failure process of jointed specimen S-90-K1. After failure, microcracks gather near the diagonal of the specimen and form a macro shear fracture band (Figure 13d).
Figure 14 shows the variation in the microcrack proportion of the specimen under different inclinations and persistence. Generally, during the loading process, shear cracks and tensile cracks occur simultaneously in the specimen. For the specimens with inclinations of 45°, 60°, and 75°, as the joint persistence increases, the proportion of shear failures increases. At the same time, as the joint persistence increases, the axial strain at which the proportion of tensile and shear failures reaches a stable level decreases continuously. For the specimen with inclinations of 0° and 90°, the failure characteristics of the specimen are very close to the failure mode of the intact specimen, and the joint persistence seems to contribute very slightly to the microcrack proportion of the specimen. Thus, as the joint persistence increases, the axial strain at which the proportion of tensile and shear failures reaches a stable level is basically the same.

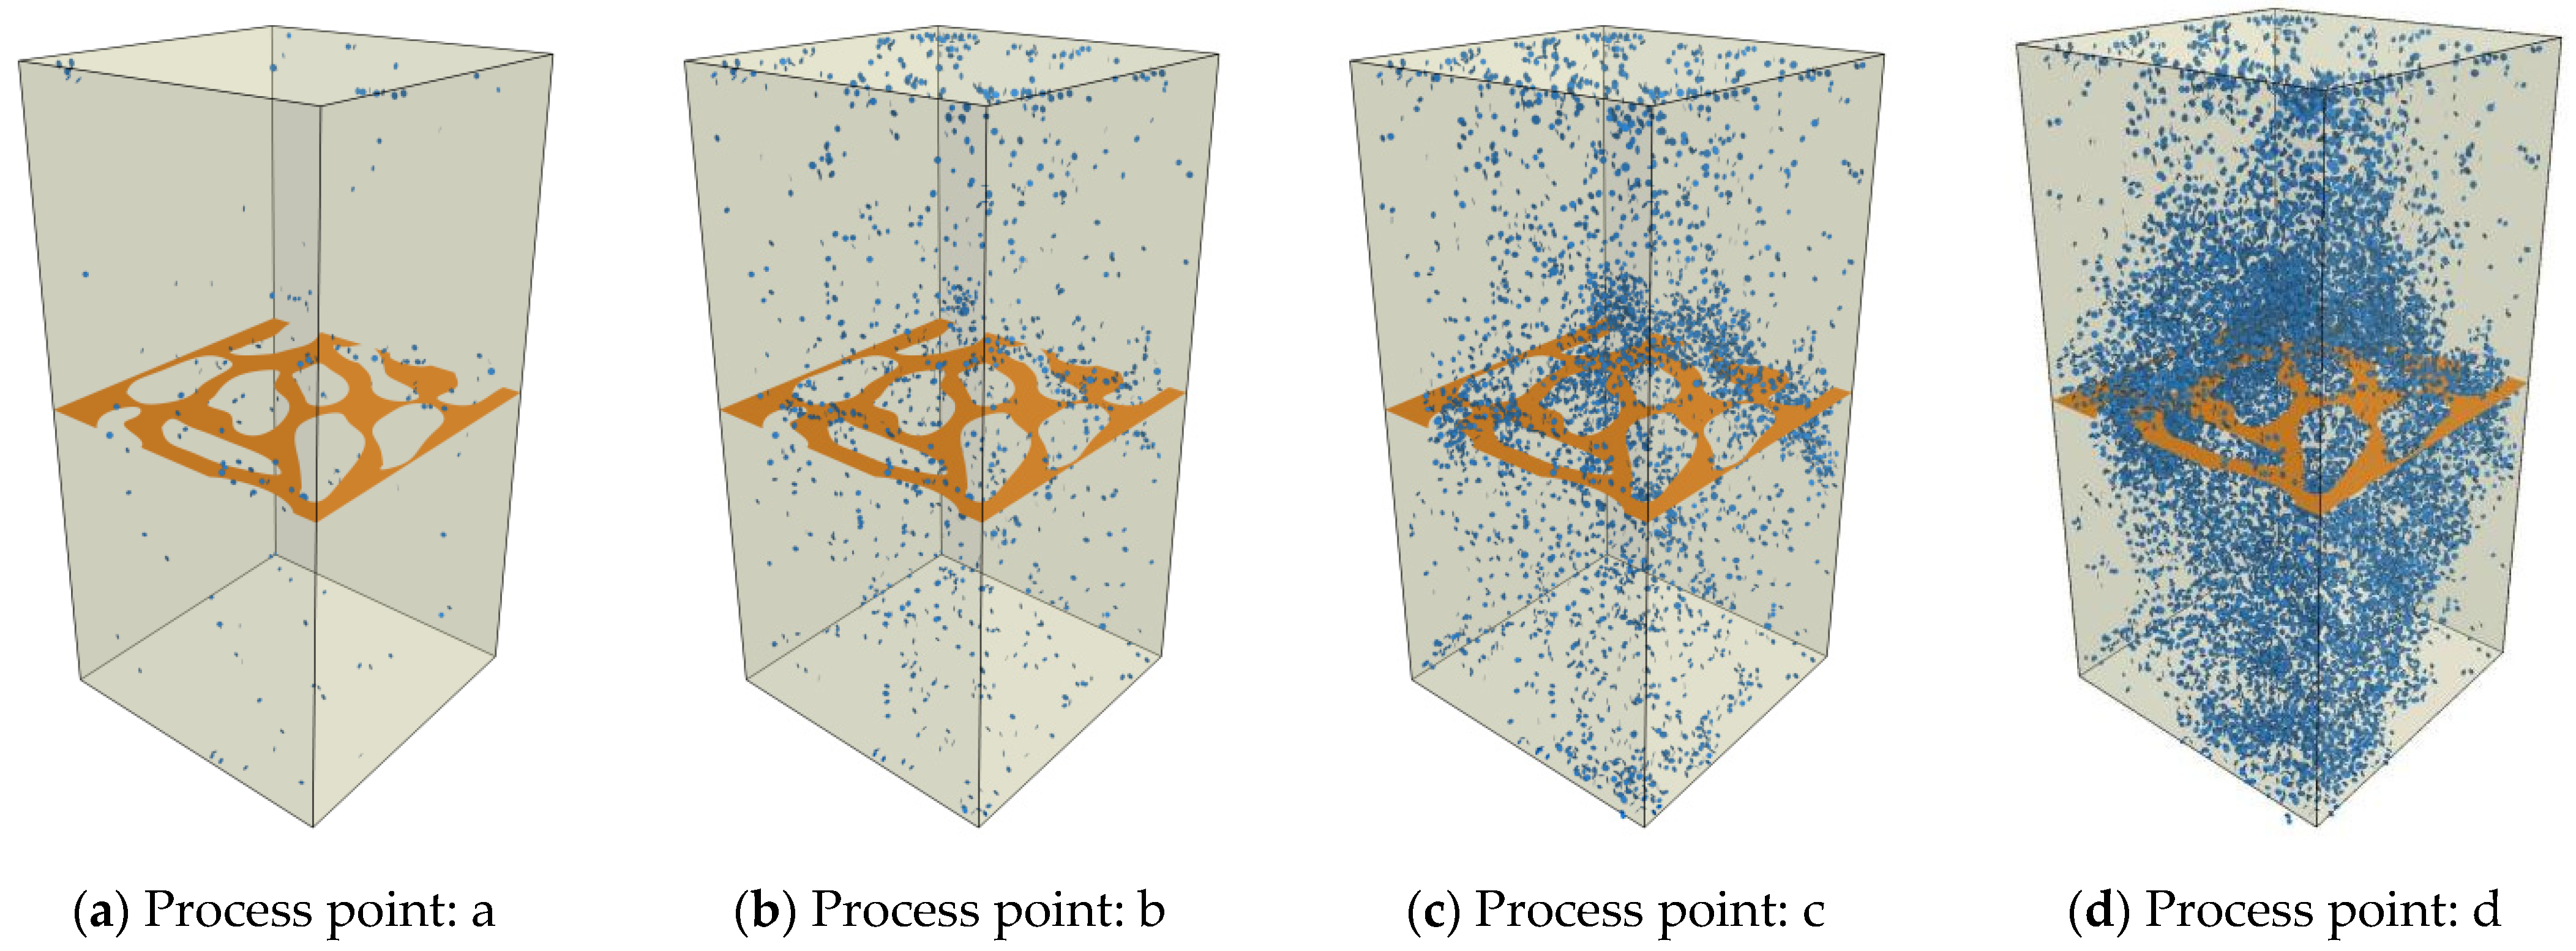
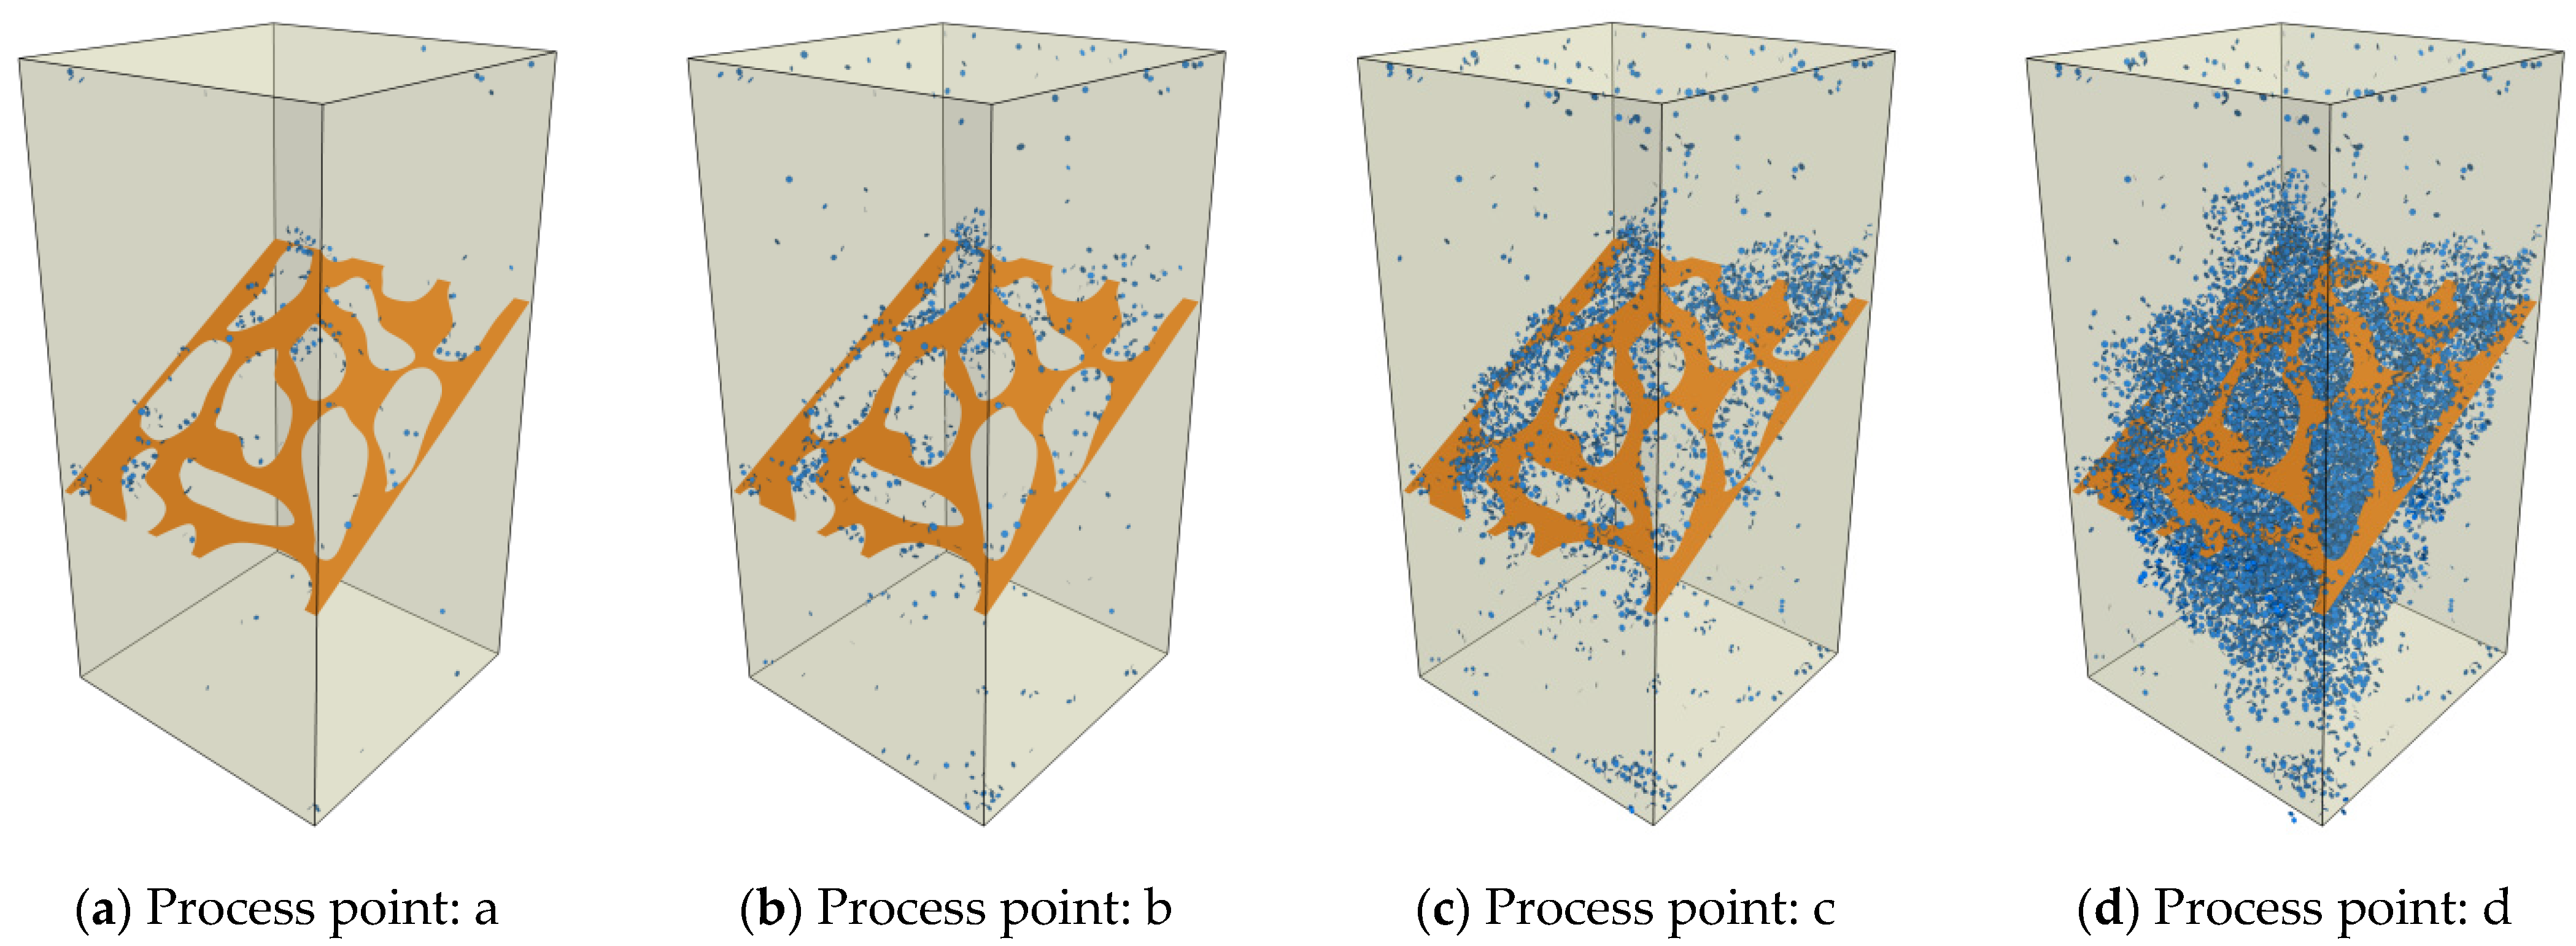
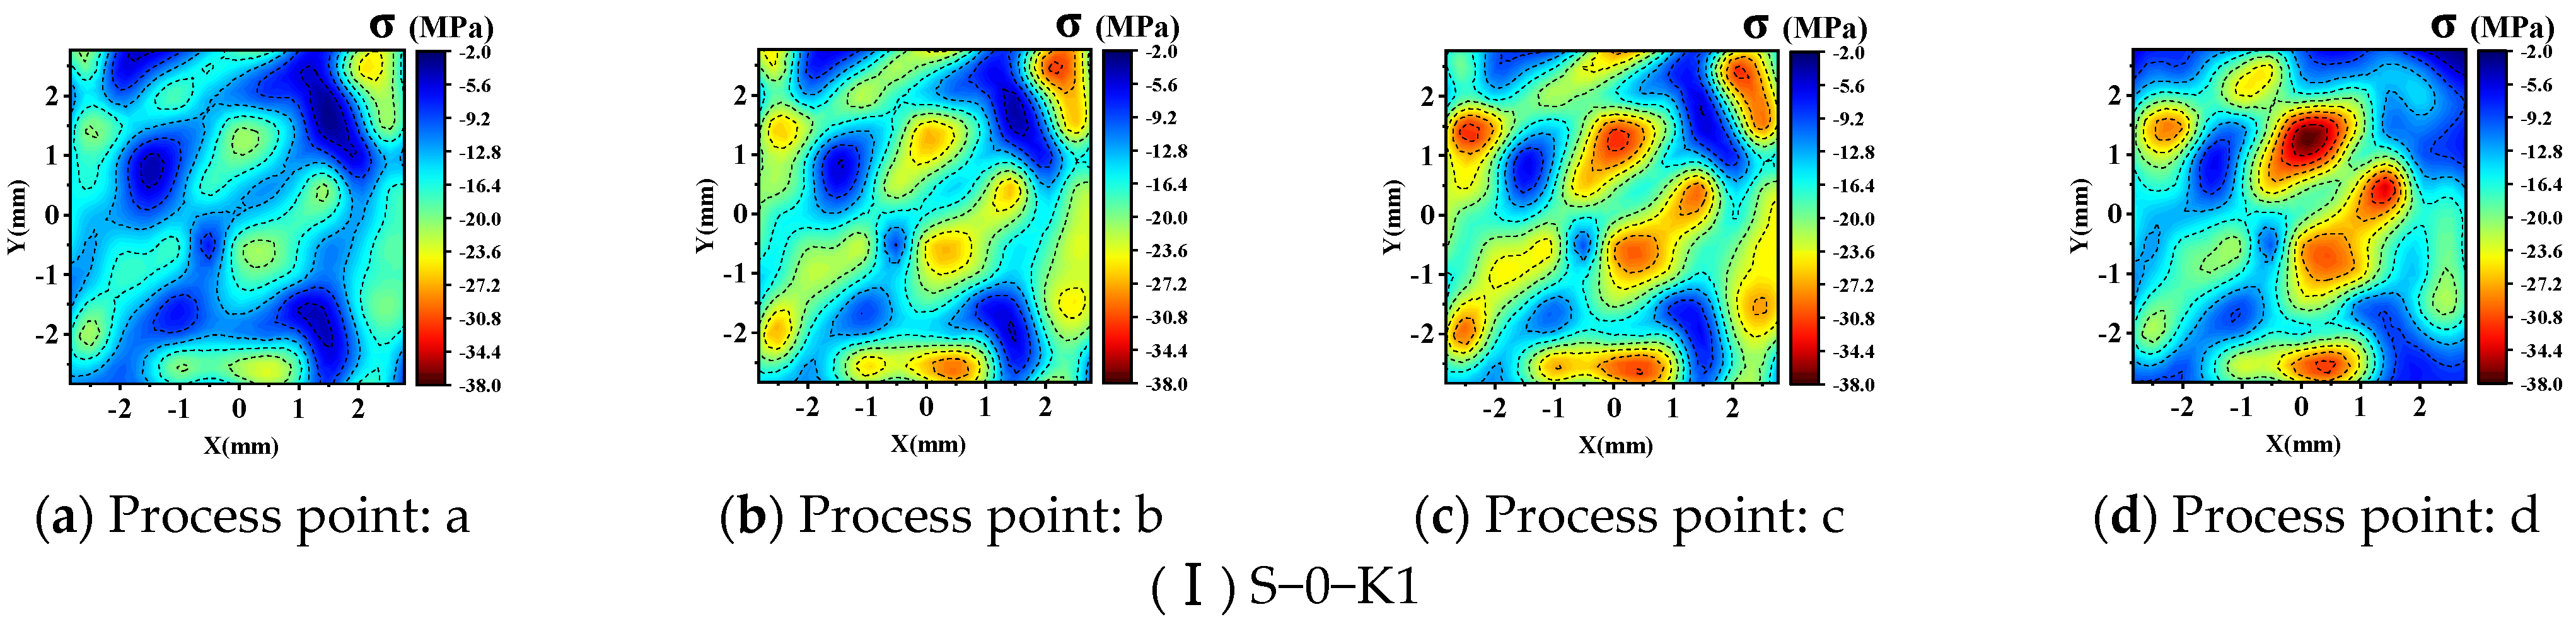
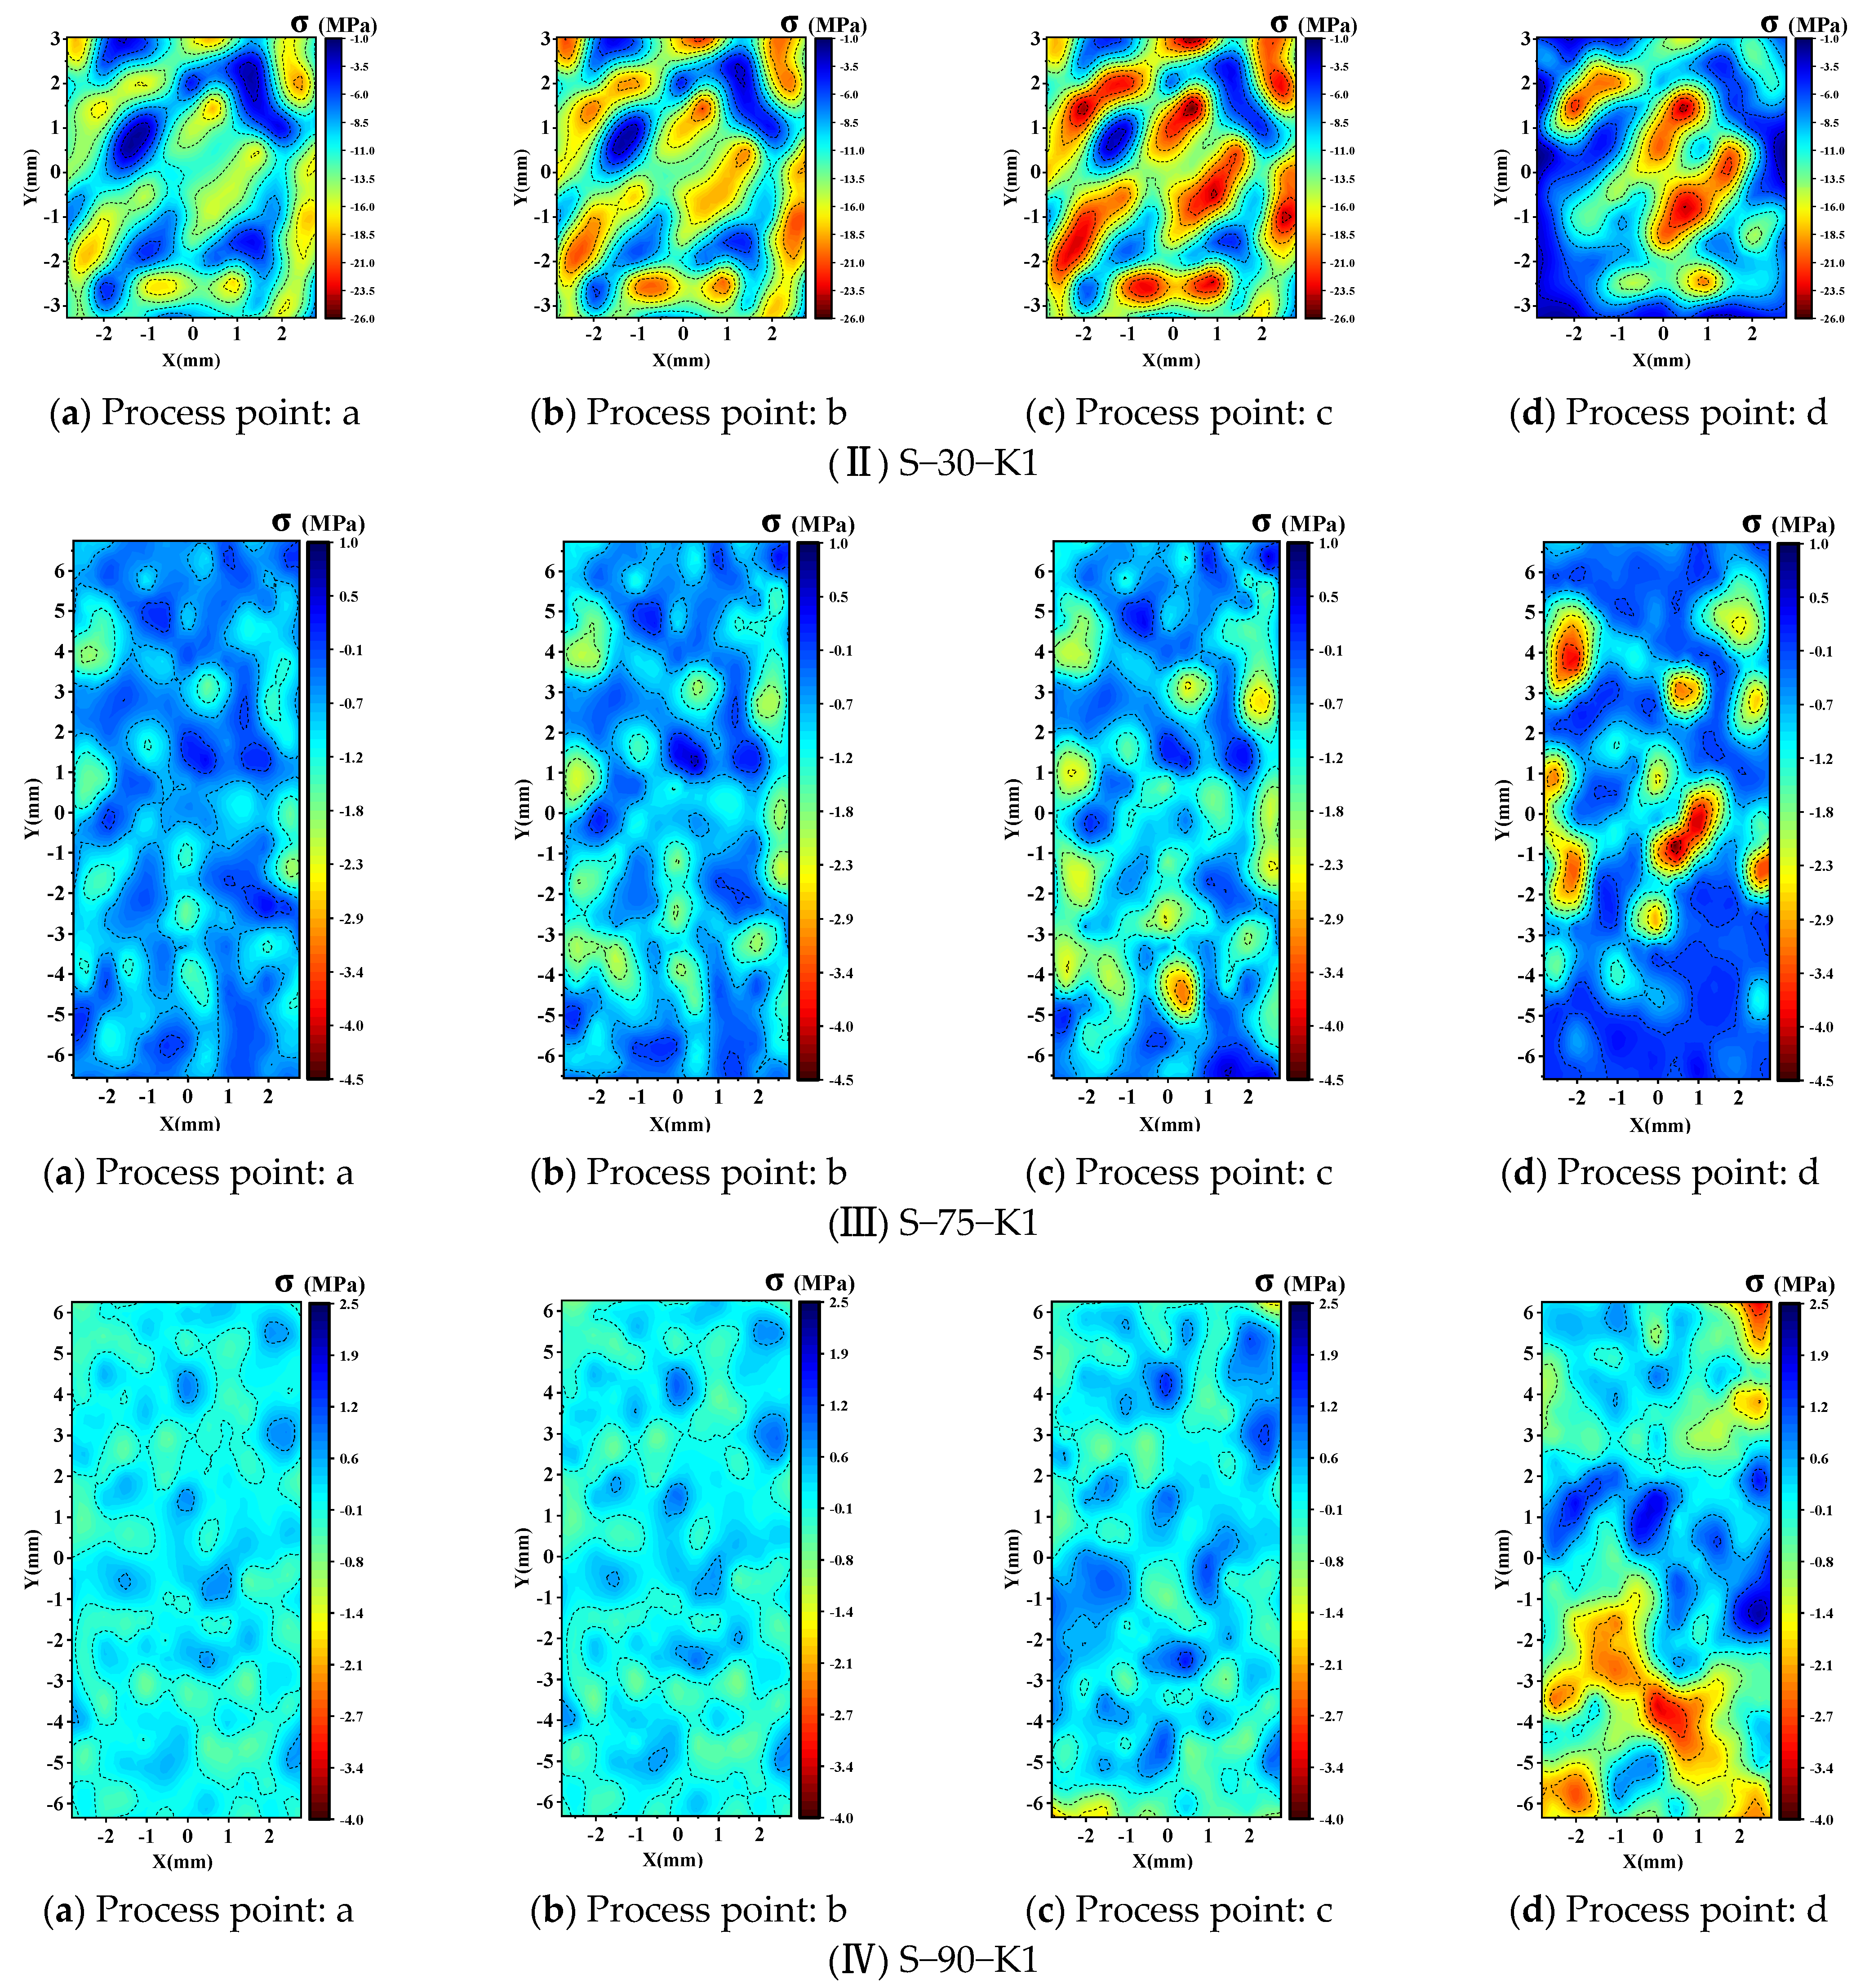
3.3. Stress Field on the Joint Plane

To reveal the stress evolution on the 3D nonpersistent joint specimen during loading, both normal stress and shear stress were monitored by a measurement circle (Figure 15), and four points a, b, c, and d (which correspond with Figure 9) were recorded to analyse the stress state.
During loading, the normal stress distribution in the 3D nonpersistent joint plane is characterized as shown in Figure 16. For the specimen with different inclinations, at the initial stage of loading (for the stress state in point a), stress concentration occurs in the rock bridge. However, it is worth noting that the stress concentration on the joint surface is relatively weak for specimens with inclinations of 75° and 90°. For the specimen with inclination θ = 0°, before failure, the stress concentration area on the joint plane has little change (Figure 16a). The main reason is that the specimen experiences splitting failure, and all rock bridges play a supporting role under axial loading. For the specimen with θ = 75°, as the failure belongs to the shear mode, friction slip occurs along the joint plane during the postpeak stage. Then, a significant distinction in stress appears between rock bridges (Figure 16c). The normal stress of the rock bridge at θ = 90° is virtually unchanged, and some rock bridges deform and rupture at the last load failure stage, resulting in localized stress concentration. The stress concentration mainly occurs at the upper and lower ends (Figure 16d).
Figure 17 shows the evolution of the shear stress on the 3D nonpersistent joint surface under uniaxial loading. For the specimens with θ = 0° and 90°, the variation in the stress concentration area is very slight (Figure 17a,d), which is attributed to the lack of slip behaviour along the joint surface during the fracture process of the specimens. Unlike the specimen with θ = 0° and 90°, the variation in the stress concentration area at 75° is the most significant, followed by that at 30°. Regardless of the slip fracture mode or mixed fracture mode, slip will occur along the joint plane during specimen failure, so all rock bridges on the joint plane will not always play a supporting role in the entire loading process. Thus, after the failure of the specimen, the joint plane is staggered due to the slip, so the support area changes and the shear stress distribution area also changes accordingly (Figure 17b,c).

4. Conclusions

A series of numerical simulations were performed to explore the uniaxial compressive strength and failure mechanisms of 3D nonpersistent joints with different inclinations and persistence. The failure modes and stress evolution during loading were presented. The following conclusions were obtained from the research results:
(1)
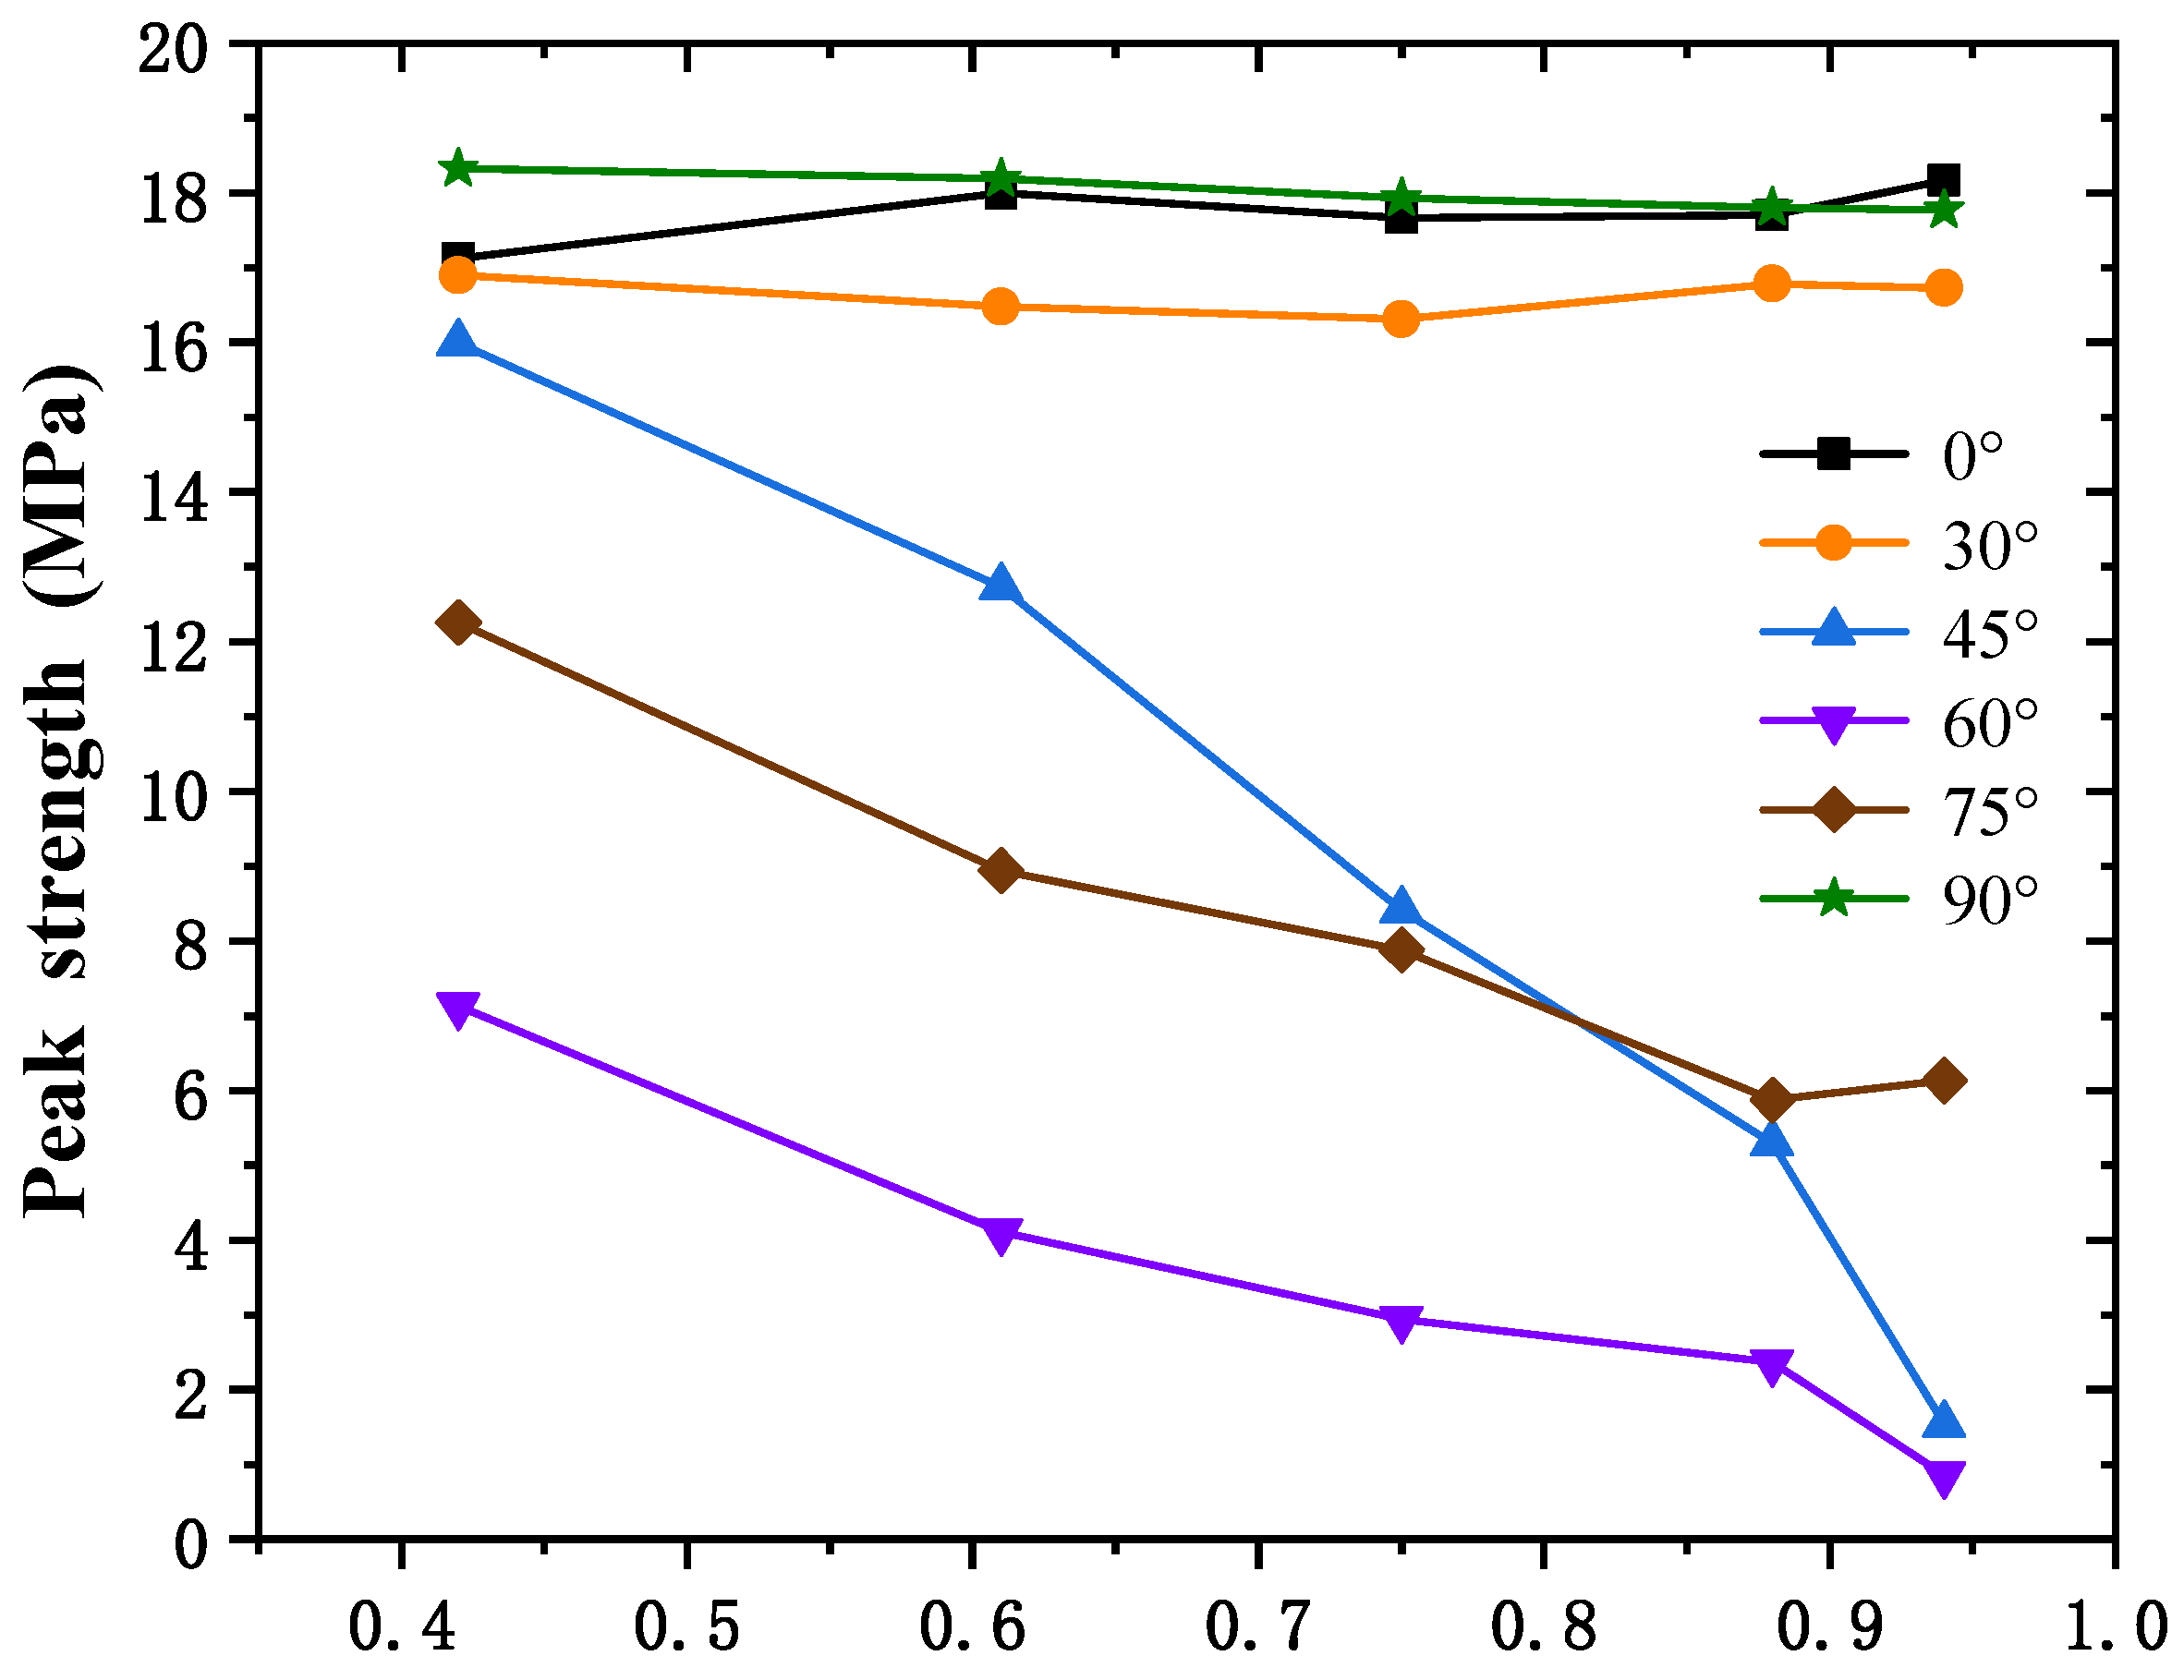
For the strength of the jointed specimens, the numerical results show great agreement with those obtained from the laboratory tests. The peak strength of specimens with θ = 45°–75° is significantly affected by the joint persistence. However, when θ ≤ 45° or θ = 90°, the joint persistence plays a small role in the strength of the specimens.
(2)
Based on microcrack accumulation and evolution, four typical failure processes (shear failure, split failure, mixed failure, and intact failure) are analysed from the micro perspective. As the joint persistence increases, for the specimen belonging to the shear failure mode, the axial strain at which the proportion of tensile and shear failures reaches a stable level decreases continuously. However, for the specimen belonging to split and intact failure, it is basically the same.
(3)
The stress distribution in rock bridges was monitored and analysed. For the specimen belonging to splitting failure and intact failure, the variation in the stress concentration area is very slight. For the slip fracture mode or mixed fracture mode, slip occurs along the joint plane during specimen failure, and as the joint plane is staggered, the shear stress distribution area also changes accordingly.

Author Contributions

Data curation, H.D.; formal analysis, R.Y., K.L.; investigation, R.C., H.L., and H.D.; methodology, R.Y., R.C., and H.L. All authors have read and agreed to the published version of the manuscript.

Funding

This research was funded by projects of the National Natural Science Foundation of China (No. 52104110).

Data Availability Statement

The data used to support the findings of this study are available from the corresponding author upon request.

Conflicts of Interest

The authors declare no conflict of interest.

References

  1. Erdogan, F.; Sih, G.C. On the Crack Extension in Plates Under Plane Loading and Transverse Shear. J. Basic Eng. 1963, 85, 519–525. [Google Scholar]
  2. Yang, S.Q.; Dai, Y.H.; Han, L.J.; He, Y.N.; Li, Y.S. Uniaxial compression experimental research on deformation and failure properties of brittle marble specimen with pre-existing fissures. Chin. J. Rock Mech. Eng. 2009, 28, 2391–2404. [Google Scholar]
  3. Wang, G.L.; Zhang, L.; Xu, M.; Liang, Z.Y.; Ran, B.L. Energy damage evolution mechanism of non-across jointed rock mass under uniaxial compression. Chin. J. Geotech. Eng. 2019, 41, 639–647. [Google Scholar]
  4. Liu, H.Y.; Su, T.M. A Dynamic Damage Constitutive Model for a Rock Mass with Non-Persistent Joints under Uniaxial Compression. Mech. Res. Commun. 2016, 77, 12–20. [Google Scholar]
  5. Yuan, X.P.; Liu, H.Y.; Wang, Z.Q. Crack tip plastic zone and elastoplastic fracture model for nonpenetrating jointed rock mass under uniaxial compression. Rock Soil Mech. 2012, 33, 1679–1688. [Google Scholar]
  6. Shen, B. The Mechanism of Fracture Coalescence in Compression—Experimental Study and Numerical Simulation. Eng. Fract. Mech. 1995, 51, 73–85. [Google Scholar]
  7. Bobet, A.; Einstein, H.H. Fracture Coalescence in Rock-Type Materials under Uniaxial and Biaxial Compression. Int. J. Rock Mech. Min. Sci. 1998, 35, 863–888. [Google Scholar]
  8. Dyskin, A.V.; Sahouryeh, E.; Jewell, R.J.; Joer, H.; Ustinov, K.B. Influence of Shape and Locations of Initial 3-D Cracks on Their Growth in Uniaxial Compression. Eng. Fract. Mech. 2003, 70, 2115–2136. [Google Scholar]
  9. Zhou, X.-P.; Zhang, J.-Z.; Wong, L.N.Y. Experimental Study on the Growth, Coalescence and Wrapping Behaviors of 3D Cross-Embedded Flaws Under Uniaxial Compression. Rock Mech. Rock Eng. 2018, 51, 1379–1400. [Google Scholar]
  10. Yang, S.-Q.; Liu, X.-R.; Jing, H.-W. Experimental Investigation on Fracture Coalescence Behavior of Red Sandstone Containing Two Unparallel Fissures under Uniaxial Compression. Int. J. Rock Mech. Min. Sci. 2013, 63, 82–92. [Google Scholar]
  11. Sarfarazi, V.; Ghazvinian, A.; Schubert, W.; Blumel, M.; Nejati, H.R. Numerical Simulation of the Process of Fracture of Echelon Rock Joints. Rock Mech. Rock Eng. 2014, 47, 1355–1371. [Google Scholar]
  12. Yang, S.-Q.; Huang, Y.-H.; Jing, H.-W.; Liu, X.-R. Discrete Element Modelling on Fracture Coalescence Behavior of Red Sandstone Containing Two Unparallel Fissures under Uniaxial Compression. Eng. Geol. 2014, 178, 28–48. [Google Scholar]
  13. Cao, R.; Cao, P.; Lin, H.; Pu, C.; Ou, K. Mechanical Behavior of Brittle Rock-Like Specimens with Pre-Existing Fissures Under Uniaxial Loading: Experimental Studies and Particle Mechanics Approach. Rock Mech. Rock Eng. 2016, 49, 763–783. [Google Scholar]
  14. Fan, X.; Kulatilake, P.H.S.W.; Chen, X. Mechanical Behavior of Rock-like Jointed Blocks with Multi-Non-Persistent Joints under Uniaxial Loading: A Particle Mechanics Approach. Eng. Geol. 2015, 190, 17–32. [Google Scholar]
  15. Fu, J.-W.; Chen, K.; Zhu, W.; Zhang, X.; Li, X. Progressive Failure of New Modelling Material with a Single Internal Crack under Biaxial Compression and the 3-D Numerical Simulation. Eng. Fract. Mech. 2016, 165, 140–152. [Google Scholar]
  16. Zhang, H.; Liu, H.Y. Simulation on the Uniaxial Compressive Mechanical Properties of Rock Mass with Nonpersistent and Infilled Joints. Min. Res. Dev. 2017, 37, 87–92. [Google Scholar]
  17. Wang, Y.; Zhou, X.; Xu, X. Numerical Simulation of Propagation and Coalescence of Flaws in Rock Materials under Compressive Loads Using the Extended Non-Ordinary State-Based Peridynamics. Eng. Fract. Mech. 2016, 163, 248–273. [Google Scholar]
  18. Wong, R.H.C.; Tang, C.A.; Chau, K.T.; Lin, P. Splitting Failure in Brittle Rocks Containing Pre-Existing Flaws under Uniaxial Compression. Eng. Fract. Mech. 2002, 69, 1853–1871. [Google Scholar]
  19. Esterhuizen, G.S.; Dolinar, D.R.; Ellenberger, J.L. Pillar Strength in Underground Stone Mines in the United States. Int. J. Rock Mech. Min. Sci. 2011, 48, 42–50. [Google Scholar]
  20. Shang, J.; Hencher, S.R.; West, L.J. Tensile strength of geological discontinuities including incipient bedding, rock joints and mineral veins. Rock Mech Rock Eng. 2016, 49, 4213–4225. [Google Scholar]
  21. Cao, R.; Yao, R.; Meng, J.; Lin, Q.; Lin, H.; Li, S. Failure Mechanism of Non-Persistent Jointed Rock-like Specimens under Uniaxial Loading: Laboratory Testing. Int. J. Rock Mech. Min. Sci. 2020, 132, 104341. [Google Scholar]
  22. Shang, J.; West, L.J.; Hencher, S.R.; Zhao, Z. Geological Discontinuity Persistence: Implications and Quantification. Eng. Geol. 2018, 241, 41–54. [Google Scholar]
  23. Cao, R.; Yao, R.; Hu, T.; Wang, C.; Li, K.; Meng, J. Failure and Mechanical Behavior of Transversely Isotropic Rock under Compression-Shear Tests: Laboratory Testing and Numerical Simulation. Eng. Fract. Mech. 2021, 241, 107389. [Google Scholar]
  24. Cao, R.; Cao, P.; Fan, X.; Xiong, X.; Lin, H. An Experimental and Numerical Study on Mechanical Behavior of Ubiquitous-Joint Brittle Rock-Like Specimens Under Uniaxial Compression. Rock Mech Rock Eng. 2016, 49, 4319–4338. [Google Scholar]
  25. Cundall, P.A. Numerical Experiments on Rough Joints in Shear Using a Bonded Particle Model. In Aspects of Tectonic Faulting; Springer: Berlin/Heidelberg, Germany, 2000; pp. 1–9. [Google Scholar]
  26. Asadi, M.S.; Rasouli, V.; Barla, G. A Laboratory Shear Cell Used for Simulation of Shear Strength and Asperity Degradation of Rough Rock Fractures. Rock Mech Rock Eng. 2013, 46, 683–699. [Google Scholar]
Figure 1. Joints with different inclinations in pillars [19].
Applsci 12 11027 g001
Figure 2. 3D nonpersistent joint and jointed specimen [20].
Applsci 12 11027 g002
Figure 3. Numerical model for a 3D nonpersistent joint.
Applsci 12 11027 g003
Figure 4. Variation in peak strength with joint persistence.
Applsci 12 11027 g004
Figure 5. Comparison of the test and numerical results for peak strength.
Applsci 12 11027 g005aApplsci 12 11027 g005b
Figure 6. Failure patterns for jointed specimens with different joint parameters.
Applsci 12 11027 g006
Figure 7. Typical failure pattern in jointed specimens.
Applsci 12 11027 g007
Figure 8. The experimental and simulated stress-strain curves.
Applsci 12 11027 g008aApplsci 12 11027 g008b
Figure 9. Evolution of the load, AE count rate and cumulative AE count of sandstone over time.
Applsci 12 11027 g009aApplsci 12 11027 g009b
Figure 10. Microcrack development in specimen S-0-K1.
Applsci 12 11027 g010
Figure 11. Microcrack development in specimen S-30-K1.
Applsci 12 11027 g011
Figure 12. Microcrack development in specimen S-75-K1.
Applsci 12 11027 g012
Figure 13. Microcrack development in specimen S-90-K1.
Applsci 12 11027 g013
Figure 14. Microcrack proportion for jointed specimens with different inclinations and persistence.
Applsci 12 11027 g014aApplsci 12 11027 g014b
Figure 15. Measurement circle distribution around the joint plane.
Applsci 12 11027 g015
Figure 16. The normal stress evolution of the 3D nonpersistent joint during loading.
Applsci 12 11027 g016aApplsci 12 11027 g016b
Figure 17. The shear stress evolution of the 3D nonpersistent joint during loading.
Applsci 12 11027 g017
Table 1. Results of laboratory experiments and numerical simulations.
Uniaxial Compressive Strength (MPa)Elastic Modulus
(GPa)
Poisson’s RatioShear
Stiffness (MPa/mm)
Normal Stiffness (MPa/mm)Friction
Angle (°)
Experimental results19.22.540.260.817.831.79
Numerical results18.62.490.260.837.928.40
Table 2. Microparameters of linear parallel bond model (LPBM).
Particle PropertiesValueBond PropertiesValue
E c   G P a 3.3 E ¯ c   G P a 3.0
R m i n   m m 1.0 k ¯ n / k ¯ s 3.0
R m a x / R m i n 1.66 σ ¯ c   M P a 18 ± 1.8
μ 0.5 τ ¯ c   M P a 12 ± 1.2
k n / k s 3.0 ϕ   ¯ ° 0.3
ρ   k g × m 3 2020 μ 0.5
Table 3. Microparameters of the smooth-joint (S-J) model.
ParametersValue
Normal   stiffness   k ¯ n   G P a × m 1 85
Shear   stiffness   k ¯ s   G P a × m 1 20
Friction   coefficient   μ 0.8
Publisher’s Note: MDPI stays neutral with regard to jurisdictional claims in published maps and institutional affiliations.

