Abstract
Longwall mining is one of the most widespread methods globally. During the preliminary development of the working, the coal seam is sectioned into panels divided by protective pillars. The pillars are necessary for maintaining the service life of underground mines, a highly productive stope, and personnel safety. In this work, we apply the finite-difference continuum damage mechanics approach to modeling the stress–strain evolution of the rock mass during the extraction of two adjacent longwall panels of an inclined seam. A new modification of the damage accumulation kinetic equation is proposed. The numerical-modeling approach accounts for an explicit number of numerous factors affecting the rock mass behavior. These factors are gravity forces, lithology, tectonic stresses, natural discontinuities, geotechnical, and mining parameters. When the model parameters are calibrated against the in situ observations, the results of the numerical-modeling approach provide a reliable basis for a pillar stability assessment. We build a structural model of a rock mass containing an underground working based on a simplified stratigraphy of the Kondomsky deposit, Kuznetsk coal basin, Russia. Based on the results of the numerical modeling, the stability of a pillar is analyzed. A new numerical technique extending the classical approach to the stability analysis is proposed and verified against the field data.
1. Introduction
The stability of coal pillars has been among the most important practical problems for ensuring the geodynamic safety of underground mining. Underground openings strongly disturb the virgin state of stress and strain and cause their redistribution [1]. Stress amplification in the vicinity of openings is responsible for the manifestation of rock, coal, and gas bursting; immediate roof collapses into the working zone; and the failure of protective pillars [2]. The stress-induced damage of pillars occasionally interrupts mining due to outbursts [3]. Clogging of the working sections of the air or conveyor roadways by rock fragments as a result of the pillars’ failure leads to a shutdown of the mine equipment and can give rise to casualties among the personnel. Each emergency case demands extra measures towards the unscheduled restoration of the working zone and equipment to a safe state according to the project documentation and safety instructions. The emergency downtime of mining facilities results in the worsening of the mine’s production efficiency. For this reason, the development of a scientific background for maintaining the pillars’ stability is one of the most important challenges facing geomechanics. Alongside the development of technologies, new control methods and innovative solutions for maintaining the stability of protective pillars between the panels are continuously being developed. Several approaches to stability assessments of the pillars and edges of coal seams have been discussed in the literature.
When designing protective pillars, one of the main tasks is to determine their optimal size, which will ensure mining safety while the coal recovery ratio is maximized [4]. One of the key parameters in various pillar design methods is the width-to-height ratio (W/H). The methods for calculating this parameter use both analytical [5] and empirical formulas [6,7,8,9]. The analytical size estimates have been obtained on the assumption that the rocks are elastic, i.e., the formula is valid only for very hard rocks, where such an assumption is possible. The empirical formulas also have a key drawback in that they are applicable only for specific geotechnical and geological conditions that they have been derived for. In addition, these formulas refer mainly to the room-and-pillar-mining system and cannot be fully applied to assess the pillars’ stability when a longwall is employed (an exception is Wilson’s method, designed entirely for the longwall).
Another problem of coal pillar stability analysis is that one also needs to estimate the edge and core pillar stress to calculate the factor of safety (). The coal pillar is generally treated to be stable when is greater than unity. The latter, however, does not guarantee the complete safety of mining since pillar instability cases occur even when the safety condition is met [10]. This is not surprising, since if we consider the features of a rock sample’s behavior under compression in laboratory conditions (e.g., [11]), we can find that damage is initiated long before the peak stress point. This suggests that the uniaxial compressive strength (UCS) might be better replaced by the crack damage threshold (0.7–0.9 of UCS) or even the crack initiation threshold (0.4–0.6 of UCS) in the formula for calculating . This might result in a low coal recovery ratio due to an excessive amount of the unextracted (leftover) coal reserves. Therefore, the trade-off between the safety and economic efficiency of mining is an acute and challenging problem associated with the pillars’ design. Obviously, the classical methods, assuming a static load equally distributed across the width of the pillars, do not consider the patterns of their actual loading. A nonstationary behavior of stress and strain of the rock mass elements caused by the mining operations creates a unique history of pillar loading, which can be taken into account by means of three-dimensional geomechanical modeling.
Some classical methods for assessing the stability of the protective pillars and edge sections of coal seams include the methods of visual inspection in situ and a number of geophysical methods that allow for the determination of a relative concentration of the abutment pressure and rock-burst potential [12]. Currently, the number of in situ methods have increased due to development of the methods for assessing the degree of pillar stability based on borehole drilling and determining the parameters of the actual load-bearing pillar core [13].
It is well known that the physical and mechanical properties of rocks have high spatial variability even within the same deposit. In this regard, probabilistic methods for assessing possible protective pillar damage have become widespread as an alternative to classical deterministic approaches. The majority of these estimates are based on the Monte-Carlo simulation method (e.g., see [14,15,16]). Recently, the methods for predicting the stability of protective pillars based on machine learning algorithms and neural networks have become popular [10,16,17,18,19]. Such approaches by means of probabilistic modeling allow for the simulation of many different scenarios and, therefore, establishing a database for the effective forecasting of the pillar behavior. Moreover, the possibility of considering several factors simultaneously and recognizing the patterns of rock mass behavior strongly enhances the probabilistic approach. Despite the competition between the deterministic and probabilistic approaches, they both use the UCS of a pillar as a key characteristic for stability analysis. In other words, the limit design seems to be among the main approaches to assessing the pillar stability. However, the probabilistic approach has the advantage of taking into account the spatial variability of rock properties.
With the development of high-performance-computing technology, a large number of numerical methods have been involved in pillar stability calculations, e.g., [20]. Recall that numerical modeling enables the consideration of many factors affecting the rock mass behavior. These are gravity forces, lithology, tectonic stresses, natural discontinuities, geotechnical and mining parameters, etc. When the model parameters are carefully calibrated against the experimental and/or in situ observations, the pillar stability assessment is reliably improved. For instance, Xia et al. [20] justified the application of a new system of cables and anchors for roof and rib support based on the numerical modeling of stope face advancement, which successfully solved the problem of improving stability.
Another issue that we have to bear in mind is the actual structure of the rock mass and the complexity of the geotechnical conditions. Due to the depletion of shallow seams, many mines surpassed the 1000 m depth in mine operations several years ago, which increased the vertical load of the pillars and edge sections of seams [21]. Moreover, the sufficiently large dip angles of the coal seams might produce equipment-sliding problems and frequent shifts of the abutment pressure maximums towards roadways [22]. The latter results in the worsening of the geotechnical conditions; meanwhile, ground control becomes extremely difficult. An estimation of the pillar stability of inclined seams is a more complex problem than that in the case of flat-dipping seams. This is due to the additional action of tangential stresses causing a redistribution of loads and a change in the geometry of the actual load-bearing core. A good overview of the inclined seam instability problem can be found in [23]. The authors show that the classical formula for calculating becomes inappropriate in this case.
In this work, we apply the finite-difference continuum damage mechanics approach to modeling the stress–strain evolution of the rock mass during the extraction of adjacent inclined longwall panels. We propose a new modification of the damage accumulation kinetic equation in this study. This is performed so as to decrease the number of constants entering the equation in contrast to the previous version [24]. The initial state of the rock mass has been formed by the gravity forces. We build a structural model of a rock mass containing a system of development workings and panels on the basis of a simplified stratigraphy of the Kondomsky deposit. We extend the classical formula for calculating to the case of a generalized stress state to estimate the pillar stability, which is the major objective of the present study.
2. Case Study Site
The Kuznetsky coal basin (Kuzbass) consists of several exploration districts, as illustrated in Figure 1. Herein, we focus on the Kondomsky district. Borehole studies carried out in the study cite have revealed the features of geologic bedding (on the right side of Figure 1). It was found that high beds of sandstone or siltstone typically form the main roof of several coal seams. The latter reduces the roof cavability, which increases the rock burst potential of coal. Seam 3 in this study has an immediate roof of 10 m of siltstone and the main roof composed of sandstone and siltstone of 20–25 m. For more details, the borehole log is given in Figure 2b.
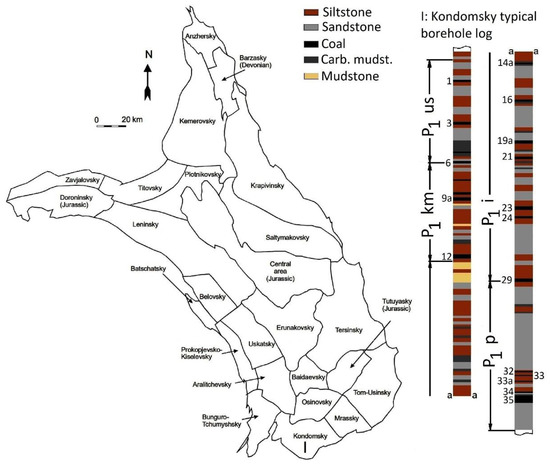
Figure 1.
Division of the Kuznetsk Basin into exploration deposits [25] and a simplified borehole log of the Kondomsky deposit [26].
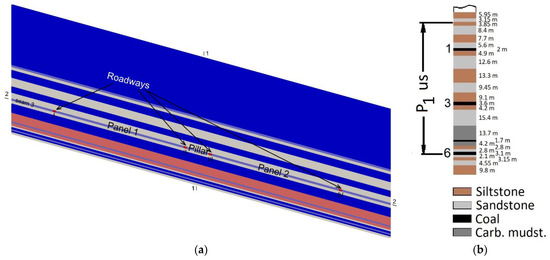
Figure 2.
Central cross-section of the geomechanical model (a) and magnified stratigraphy (b) of the study site.
A three-dimensional geomechanical model (a cross-section of the model is given in Figure 2a) has been built on the basis of a simplified stratigraphy of the Kondomsky deposit (Figure 2b). The panels are located at the depths of 540–650 m; the inclined seam 3 in the study site has a dip angle of 16°. The panel width is 200 m, the mining height is 3.6 m, the pillar width is 35 m, and the roadway width is 5 m. The roadways are indicated by Roman numerals. The stratigraphy above seam 1 is disregarded in the model; for simplicity, it is replaced by a single rock layer of a finite height to limit the influence of the boundary conditions. Other boundary conditions are discussed in the Section 3.
The problem of maintaining the stability of the protective pillars in the area under consideration is also accounted for by significant technogenic seismicity. During the extraction of the first panel, a strong rock burst was recorded in the air roadway. As a result of the rock burst, the floor cracked, followed by a collapse of the roadway wall from the side of the stope spanning more than 40 m. Over the ten-month period preceding the rock burst, about 5500 events of various classes were recorded. More than 95% of them were classified as dynamic phenomena associated with the stope’s advancement. Figure 3 illustrates the seismic activity dynamics in the mine area over 70 days, including the date of the largest-scale rock burst.
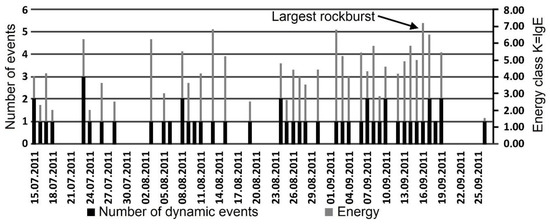
Figure 3.
Dynamics of seismic activity due to panel 1 stope advancement in study site over 70 days. Arrow points out the largest rock burst.
3. Numerical Modeling
To analyze the regularities of the stress–strain evolution in the rock mass, we use the finite-difference continuum damage mechanics approach discussed in [24]. The standard system of equations solved numerically is also discussed in [24]. The equations used for inelastic deformation modeling are discussed briefly in Appendix A.
Table 1 summarizes the physical-mechanical properties of the rocks used in the modeling procedure developed in [24].

Table 1.
Physical-mechanical properties of rocks used in modeling.
Other parameters are explained in the nomenclature list in Appendix A. The model is subjected to the action of gravitational forces. Once the gravitational stress is established, the next stages of modeling are associated with a consequent increase in the gob, where panels 1 and 2 are consecutively extracted. Normal displacements of the model are constrained in all but the upper facet. The overburden weight (540–710 m) is taken into account implicitly by assigning a value of the vertical stress tensor component. Within the model, an ideal mechanical contact condition is assumed between the sedimentary layers. The rocks between the bedding planes are taken to be isotropic. The computational domain consists of a total of 18.6 mln mesh elements, for which the mesh step is 1.15 m. Due to the general complexity of the formulated problem, several factors are disregarded in the model: (i) the influence of any natural discontinuities; (ii) the influence of tectonic stresses.
4. Results and Discussion
4.1. Stress–Strain Evolution
In this section, we visualize the stress–strain distribution within the computational domain. Looking ahead, we note that this subsection presents the results for a 40 m pillar, which has been chosen as a compromise between the coal recovery ratio and the safety factor. The distributions are further used in the numerical analysis of the stability of the rocks adjacent to the openings. The stability evaluation is closely related to the stress distribution analysis in the vicinity of the protective pillar. Notably, the stress change is even more important than a single static value. For this reason, we first record the values of normal stresses along the vertical line drawn through the model center (line 1-1 in Figure 2a) and along the line associated with the dip direction of seam 3 (line 2-2 in Figure 2a). Figure 4a–c illustrate the stress distributions. It can be concluded that even in the initial state (prior to the mining operations) there is stress amplification associated with the roadways. The latter yields a deviation from the monotonically increasing vertical stress tensor component in Figure 4a and the characteristic stress pattern in the coal seam horizon (Figure 4b,c). Figure 4c illustrates the vertical stress distribution in the seam plane. Since we do not account for tectonic stresses, two other horizontal components of the stress tensor, namely, and , are related to the vertical stress through Poisson’s ratio. Below, we compare further stress states along these lines with the initial states.
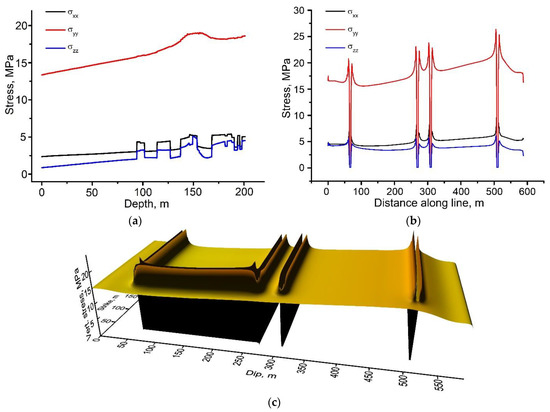
Figure 4.
Distribution of normal stresses along: the vertical line drawn through the center of the model (a), the line drawn through the center along the dip direction of seam 3 (b), and the initial vertical stress distribution in seam plane (c).
Let us trace the stages of the inelastic strain distribution in the course of the gob increase in panel 1. This step of the numerical modeling is necessary to validate the model. To do so, we compare the steps of the roof caving with the field data. If the misfit error between the model estimation and the field data is smaller than 20%, we accept the model and use the results of the model in the further analysis.
Figure 5 illustrates the stages of the development of inelastic deformation in the roof of the coal seam after the first collapse. The corresponding gob length is given in the figure caption. To clearly represent the inelastic strain distribution, we rotated the model by 180° in contrast to the view given in Figure 4. The mining direction is illustrated by a black arrow in Figure 5a. Judging by the distribution of the inelastic strain in Figure 5a, strong non-homogeneity and asymmetry can be observed. The corresponding gob length is 130 m. Further stages of inelastic deformation and damage development in the roof are illustrated in Figure 5b–d. The corresponding gob lengths are 180 m and 200 m. Figure 5d illustrates the final distribution of the inelastic strain in the roof, corresponding to the surface subsidence state. The dome-shaped damage of seam 3’s roof is concentrated in the left part of panel 1 closer to roadway I. Such a distribution is logical since the roof of the seam has much greater support near the protective pillar than near roadway I due to the inclination. Notably, this asymmetry of the inelastic strain distribution is due to the enhanced influence of slip planes oriented along the strike direction. Based on the obtained distribution of the inelastic strain and damage, we can draw a conclusion that the aero and hydro interconnections with the undermined seam 1 are formed, which is generally treated as a negative phenomenon, since it allows for the enhanced migration of water and gas through the developed network of cracks. The formation of several largescale inclined surfaces of damaged rocks after state c generally causes the worsening of the geotechnical conditions.
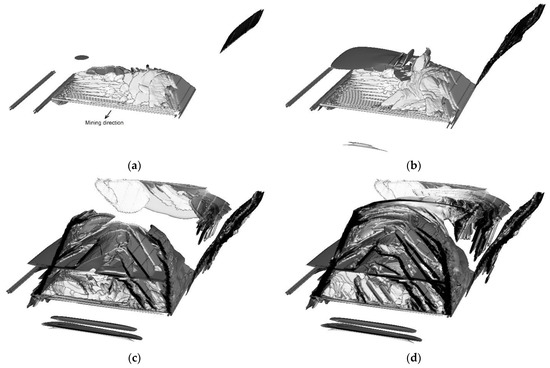
Figure 5.
Stages of inelastic deformation development in the course of the gob increase from panel 1: (a) 136 m, (b) 178 m, (c) 203 m, and (d) surface subsidence state.
Figure 6a illustrates the distribution of the inelastic strain in the vertical cross-section of the model in the plane close to roadway I. Measuring the length of the first dome along the strike direction gives the value of the first caving step. In the considered case, the value is 50 m, which is typical of the south Kuzbass mines [24]. Finally, after the extraction of panel 1, we obtain a distribution of the vertical stress in the seam horizon illustrated in Figure 6b. It can be noted that the stress distribution has a pronounced asymmetry relative to the center of the extracted panel. This is due to the dip angle of the coal seam.
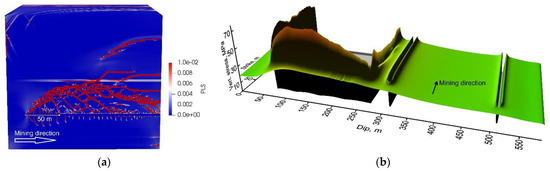
Figure 6.
Distribution of inelastic strain in vertical cross-section of the model in plane close to roadway I (a); resultant distribution in the seam 3 plane (b).
The following step of the numerical modeling is associated with stress recovery in the gob of panel 1. We take account of this step explicitly by transferring the data on the damaged elements from the previous step and once again solve the gravity stress field problem. In this step, we assume that the overburden subsidence is completed, and the stress field almost recovers its gravitational state. Let us further trace the stages of inelastic strain distribution in the course of the gob increase in panel 2. Figure 7 illustrates the damage distribution in the rock mass for different instants of the panel 2 gob increase. The model is again rotated by 180° relative to the view given in Figure 6b, since this view better illustrates the regularities of damage accumulation.
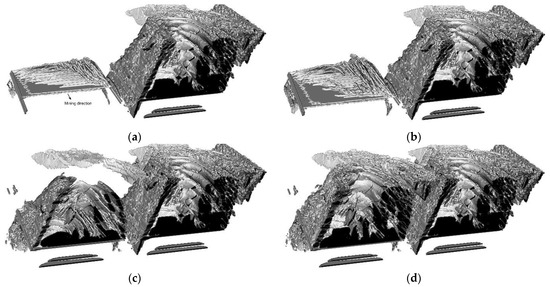
Figure 7.
Stages of damage development in the course of the gob increase in panel 2: (a) 136 m, (b) 178 m, (c) 203 m, and (d) surface subsidence state.
Once we have obtained the distribution of the damage and inelastic strain in the rock mass after the extraction of two adjacent panels, we can further move towards the analysis of the stress distribution in and around the protective pillar between the panels. The vertical stress tensor component and equivalent stress are only used in the stress analysis below. Let us first discuss the change in the vertical stress in characteristic time instants, namely, after the extraction of panel 1, after the stress recovery in the gob of panel 1, and after the extraction of panel 2. Figure 8 illustrates the vertical stress distributions along the line drawn through the center of the model in the dip direction of seam 3. Shortly after the extraction of panel 1 (wherein the face retreat reaches the boundary of the computational domain), the vertical stress values (gray dash-dot line) are strongly amplified in the vicinity of the pillars on the left and right sides of panel 1. The extraction of panel 1 also affects the stress amplification in the edge section of the undisturbed panel 2. Meanwhile, when the stress recovery in the gob area takes place, the stress amplification sufficiently reduces and approaches the normal abutment stress diagram (blue line) with a maximum stress concentration factor of 2. However, the extraction of panel 2 yields even stronger vertical stress amplification in the protective pillar. Interestingly, in the case of an inclined seam, the right side of the pillar is subjected to a much stronger increase in the vertical stress. Once again, the abutment diagrams discussed above suggest that the static stress analysis is not suitable, since the loading history of the protective pillar is unique.
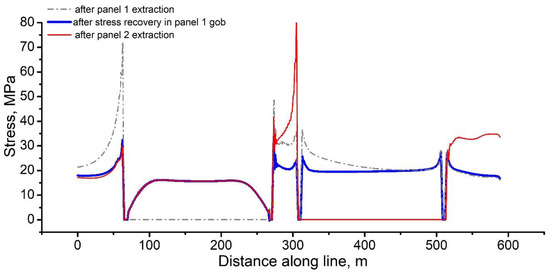
Figure 8.
Distribution of vertical stress along the line drawn through the center of the model in the dip direction of seam 3.
4.2. Numerical Approach to Evaluation of FoS
We have noted in the Introduction that the general formula for the determination of the Factor of Safety is poorly applicable in the case of complex stress states. The complexity of a stress state is attributed to the enhanced influence of tangential stresses. In the considered case study site, the stress state complexity is due to the coal seam inclination. For this reason, the ratio of the uniaxial compressive strength and vertical stress must be replaced by a formula suitable for the generalized stress state. Since we employ the Drucker–Prager yield surface as a part of the constitutive response, we can extend the classical approach formula for a stability analysis to the case of the generalized stress state. Notably, the shear strength of a medium has the following expression within the Drucker–Prager model as an extension of the classical Coulomb–Mohr model
We can also calculate the level of an equivalent stress acting on the medium element using the following expression:
Using Equations (1) and (2), we can find the ratio that is represented by the factor of safety formula for the case of a generalized stress state
Let us consider the distribution of the stress–strain parameters in the vicinity of the protective pillar. Figure 9 illustrates the combined distributions of vertical stress , equivalent plastic strain , and the factor of safety along the line drawn through the center of the model in the dip direction of seam 3. Judging by the equivalent plastic strain distribution, the edge sections of the protective pillar have accumulated 1–2% of plastic strain in the course of the stress–strain evolution. This is quite enough for the rocks to become unstable. It can be noted that the stronger stress amplification on the right side of the pillar reduces the factor of safety in that part of the pillar down to the range of 1–1.1, which is lower than in the left side. The latter suggests that roadway III is probably more prone to the violation of its functional properties. The same qualitative distributions have been obtained for other pillars in the width range of 5–50 m; meanwhile, the width of panels remained constant.
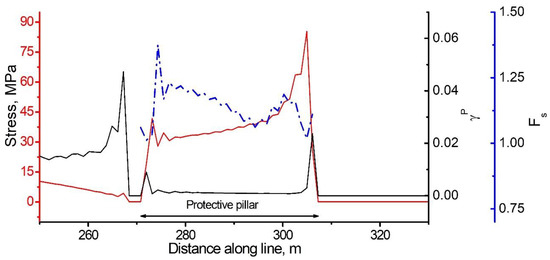
Figure 9.
Distribution of vertical stress , equivalent plastic strain , and factor of safety along the line drawn through the center of the model in the dip direction of seam 3 after extraction of panel 2.
Let us also consider the values of the factor of safety averaged over the entire volume of the protective pillars for various W/H ratios. Figure 10 shows the dependence of the average on the W/H ratio. Note that dependence is a non-linear asymptotic function, approaching its asymptote where the pillar width is about 40 m. Considering the additional factor of 10% used in the engineering practice in order to account for the random factors disregarded in the stability calculations, we find that the pillar can be considered to be stable in the cases where the average exceeds 1.1. Obviously, this criterion is met by a pillar with the ratio W/H = 11. A further increase in the pillar width is not economically feasible, since there is no significant change in , according to the asymptotic dependence (see Figure 10). At the same time, a further increase in the pillar width results in a smaller coal recovery ratio. The pillar width in that case is 39.6 m. The field data suggest that the width of the protective pillars used in this particular mine at the given depth varies in the range of 40–60 m. Therefore, the model results satisfy the lower bound of this parameter.
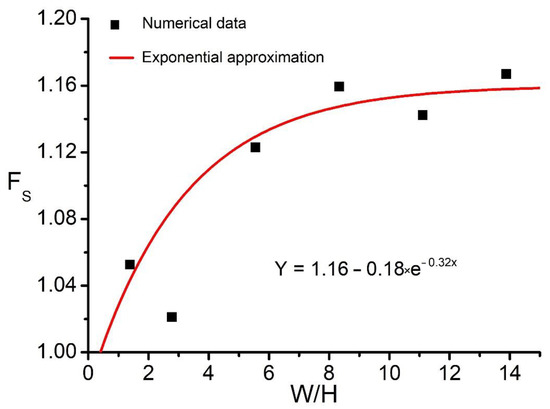
Figure 10.
Dependence of on ratio averaged in the protective pillar volume.
The resulting dependence of the factor of safety can be explained as follows. The failure of the protective pillars during mining starts from the surface of the pillars at the junction of the walls to the roof and floor. According to the data from the instrumental observations and numerical modeling, the zone of inelastic deformation and damage adjacent to the walls of the protective pillars has a finite length. In this zone, a significant concentration of stresses is observed. However, as they go deeper into the pillar, the stress tends towards a normal value in the virgin rock mass. Therefore, at a certain width of the pillar (or more), we can expect the absence of the influence of the anomalous zone of inelastic deformations and damage on the stress distribution and, accordingly, , with all other factors being equal. In other words, the statistical weight of the points with a “normal” safety factor will cease to increase significantly, starting from a certain W/H ratio of the pillar.
5. Conclusions
In this work, we have proposed a new modification of the mathematical model of the stress–strain evolution during the extraction of two adjacent panels of an inclined coal seam. Judging by the results of the numerical modeling obtained in this study, the proposed model adequately describes the regularities of plastic deformation, damage, and roof-caving behavior of the study site compared to the field data.
We have also proposed a numerical approach for the assessment of the protective pillar stability of an inclined seam based on the analysis of the stress–strain evolution in one of the south Kuzbass mines. The approach is based on an extension of the classical formula for the evaluation of the factor of safety to the case of a generalized stress state. The results suggest that modern methods of geomechanics may be used as an additional tool in pillars’ design, ensuring the geodynamic safety of mining operations.
The following conclusions can be drawn on the basis of the results obtained:
- (i)
- The inclination of the seam causes a strong stress–strain asymmetry;
- (ii)
- The formation of a larger damage zone dome is manifested in the vicinity of roadway III;
- (iii)
- Roadway III is probably more prone to the violation of its functional properties than roadway II;
- (iv)
- In order to maintain the stable state of the protective pillars and to increase the coal recovery ratio and the economic efficiency of the mine, a pillar’s W/H ratio should not fall below 11.
In our future work, we plan to simulate the artificial methods for abutment pressure management and compare their relative effectiveness regarding, for example, discharging boreholes and directed hydraulic fracturing.
Author Contributions
M.E.: Conceptualization, Methodology, Writing; A.P.: Visualization, Software, Formal analysis; G.E.: Conceptualization, Formal analysis; L.P.: Field data, Formal analysis, V.F.: Field data, Formal analysis. All authors have read and agreed to the published version of the manuscript.
Funding
This work was supported by the Russian Science Foundation, Project No. 21-71-10079.
Data Availability Statement
The data presented in this study are available on request from the corresponding author.
Acknowledgments
The authors express gratitude to the anonymous reviewers whose critical comments allowed for the improvement of the manuscript.
Conflicts of Interest
The authors declare no conflict of interest.
Nomenclature
| density | |
| pressure | |
| components of deviatoric stress tensor | |
| bulk and shear modulus | |
| components of inelastic strain tensor | |
| multiplier used in theory of plasticity | |
| plastic potential equation | |
| yield surface equation | |
| internal friction factor | |
| dilatancy factor | |
| the second invariant of deviatoric stress tensor | |
| reference and current values of cohesion | |
| time parameter of damage accumulation measure | |
| measure of damage |
Appendix A
To determine the stress–strain behavior of the rock mass, we numerically solved the system of solid mechanics equations. The system includes: the laws of mass and momentum conservation. The geometrical relations are used to determine the strain increments. The relations of the hypo-elastic medium are used as the constitutive equations to determine separately the increment of the stress tensor volumetric and deviatoric parts. For further details, the reader is referred to [24].
We use the Drucker–Prager model in Equation (A1) [27] to describe the inelastic deformation of host rocks.
and are calculated from rock cohesion and internal friction angle of the Mohr–Coulomb criterion [27].
The non-associated flow rule in Equation (A3) is used to calculate the increments of the inelastic strain tensor components in Equation (A4)
The increments of the inelastic strain tensor components are calculated as follows in Equation (A5):
The details of the stress relaxation procedure are discussed elsewhere [28].
The choice of the dilatancy factor of the rocks is described in [24]. Let us discuss the new modification of the kinetic equation for the damage measure time derivative in Equation (A6)
wherein is the Coulomb stress and is the model parameter controlling the rate of damage accumulation; has the physical meaning of the characteristic time of a fracture incubation process. The new modification allows for a reduction in the number of constants to be validated in contrast to the previous version [24].
We use a piece-wise linear yield strength envelope of rocks with two segments. Figure A1 schematically illustrates the proposed piece-wise linear function of the yield/damage surface and possible loading paths of a single continuum point (No. 1 and 2).

Figure A1.
Schematic representation of the double-slope yield surface and possible loading paths of a single continuum point.
Figure A1.
Schematic representation of the double-slope yield surface and possible loading paths of a single continuum point.

A continuum point is assumed to be fractured when the damage parameter reaches unity. After fracture, the continuum point no longer resists tensile stresses (all stress tensor components are nullified when hydrostatic pressure is negative) but still resists shear and compressive stresses with a local strength of (when hydrostatic pressure is positive).
References
- Shabanimashcool, M.; Li, C.C. A numerical study of stress changes in barrier pillars and a border area in a longwall coal mine. Int. J. Coal Geol. 2013, 106, 39–47. [Google Scholar] [CrossRef]
- Xie, J.-L.; Xu, J.-L. Effect of key stratum on the mining abutment pressure of a coal seam. Geosci. J. 2017, 21, 267–276. [Google Scholar] [CrossRef]
- Islavath, S.R.; Deb, D.; Kumar, H. Numerical analysis of a longwall mining cycle and development of a composite longwall index. Int. J. Rock Mech. Min. Sci. 2016, 89, 43–54. [Google Scholar] [CrossRef]
- Zhang, G.; Liang, S.; Tan, Y.; Xie, F.; Chen, S.; Jia, H. Numerical modeling for longwall pillar design: A case study from a typical longwall panel in China. J. Geophys. Eng. 2018, 15, 121–134. [Google Scholar] [CrossRef]
- Wilson, A.H.; Ashwin, D.P. Research into the determination of pillar size. Trans. Inst. Min. Eng. 1972, 131, 409–429. [Google Scholar]
- Salamon, M.D.G.; Munro, A.H. A study of the strength of coal pillars. J. South. Afr. Inst. Min. Metall. 1967, 2, 68–78. [Google Scholar]
- Medhurst, T.P.; Brown, E.T. A study of the mechanical behaviour of coal for pillar design. Int. J. Rock Mech. Min. Sci. 1998, 35, 1087–1105. [Google Scholar] [CrossRef]
- Salamon, M.D.G.; Ozbay, M.U.; Madden, B.J. Life and design of bord-and-pillar workings affected by pillar scaling. J. S. Afr. Inst. Min. Metall. 1998, 98, 135–145. [Google Scholar]
- Galvin, J.M.; Hebblewhite, B.K.; Salamon, M.D.G. UNSW coal pillar strength determinations for Australian and South African mining conditions. In Proceedings of the Second International Workshop on Coal Pillar Mechanics and Design, Vail, CO, USA, 6 June 1999; NIOSH: Pittsburgh, PA, USA, 1999. IC9448. [Google Scholar]
- Deng, J.; Yueb, Z.Q.; Tham, L.G.; Zhu, H.H. Pillar design by combing neural networks and reliability: A case study of the Feng Huangshan copper mine China. Int. J. Rock Mech. Min. Sci. 2003, 40, 585–599. [Google Scholar] [CrossRef]
- Hoek, E.; Martin, C.D. Fracture initiation and propagation in intact rock–A review. J. Rock Mech. Geotech. Eng. 2014, 6, 287–300. [Google Scholar] [CrossRef]
- Oparin, V.N. Zonal Disintegration of Rocks and Stability of Underground Workings; Publishing House of SB RAS: Novosibirsk, Russia, 2008; p. 278. (In Russian) [Google Scholar]
- Liu, S.; Wan, Z.; Zhang, Y.; Lu, S.; Ta, X.; Wu, Z. Research on evaluation and control technology of coal pillar stability based on the fracture digitization method. Measurement 2020, 158, 107713. [Google Scholar] [CrossRef]
- Griffiths, D.V.; Fenton, G.A.; Lemons, C.B. Probabilistic analyses of underground pillar stability. Int. J. Numer. Anal. Methods Geomech. 2002, 26, 775–791. [Google Scholar] [CrossRef]
- Ghasemi, E.; Shahriar, K.; Sharifzadeh, M.; Hashemolhosseini, H. Quantifying the uncertainty of pillar safety factor by Monte Carlo simulation-a case study. Arch. Min. Sci. 2010, 55, 623–635. [Google Scholar]
- Li, C.; Zhou, J.; Armaghani, D.J.; Li, X. Stability analysis of underground mine hard rock pillars via combination of finite difference methods, neural networks, and Monte Carlo simulation techniques. Undergr. Space 2021, 6, 379–395. [Google Scholar] [CrossRef]
- Idris, M.A.; Saiang, D.; Nordlund, E. Stochastic assessment of pillar stability at Laisvall mine using Artificial Neural Network. Tunn. Undergr. Space Technol. 2015, 49, 307–319. [Google Scholar] [CrossRef]
- Ding, H.; Li, G.; Dong, X.; Lin, Y. Prediction of Pillar Stability for Underground Mines Using the Stochastic Gradient Boosting Technique. IEEE Access 2018, 6, 69253–69264. [Google Scholar] [CrossRef]
- Ghasemi, E.; Kalhori, H.; Bagherpour, R. Stability assessment of hard rock pillars using two intelligent classification techniques: A comparative study. Tunn. Undergr. Space Technol. 2017, 68, 32–37. [Google Scholar] [CrossRef]
- Xia, Z.; Yao, Q.; Meng, G.; Xu, Q.; Tang, C.; Zhu, L.; Wang, W.; Shen, Q. Numerical study of stability of mining roadways with 6.0-m section coal pillars under influence of repeated mining. Int. J. Rock Mech. Min. Sci. 2021, 138, 104641. [Google Scholar] [CrossRef]
- Wang, P.; Zhao, J.; Chugh, Y.P.; Wang, Z. A Novel Longwall Mining Layout Approach for Extraction of Deep Coal Deposits. Minerals 2017, 7, 60. [Google Scholar] [CrossRef]
- Zhao, J.; Wang, P.; Su, Y. An Innovative Longwall Mining Technology in Tangshan Coal Mine, China. Minerals 2017, 7, 14. [Google Scholar] [CrossRef]
- Foroughi, M.H. Some Aspects of Coal Pillar Stability in Inclined Coal Seams. Ph.D. Thesis, Tehran University, Tehran, Iran, 1996. [Google Scholar]
- Eremin, M.; Esterhuizen, G.; Smolin, I. Numerical simulation of roof cavings in several Kuzbass mines using finite- difference continuum damage mechanics approach. Int. J. Min. Sci. Technol. 2020, 30, 157–166. [Google Scholar] [CrossRef] [PubMed]
- Jones, N.S. A review of the AMM and CMM resources in the Kuznetsk (Kuzbass) Coal Basin, Russia. Br. Geol. Surv. Intern. Rep. 2005, 48. [Google Scholar]
- Yavorskii, V.I. Geologiya Mestorozhdenii Uglya i Goryuchih Slancev SSSR. Tom 7. Kuznetsky, Gorlovsky Basseini i Drugie Ugolnie Mestorozhdeniya Zapadnoy Sibiri; Nedra: Moscow, Russia, 1969. (In Russian) [Google Scholar]
- Drucker, D.C.; Prager, W. Soil Mechanics and plastic analysis or limit design. Q. Appl. Math. 1952, 10, 157–165. [Google Scholar] [CrossRef]
- Stefanov, Y.P.; Evseev, V.D.; Bakeev, R.A. Numerical modelling of deformation and fracture in geomaterials. Phys. Mesomech. 2004, 7, 265–268. [Google Scholar]


Publisher’s Note: MDPI stays neutral with regard to jurisdictional claims in published maps and institutional affiliations. |
© 2022 by the authors. Licensee MDPI, Basel, Switzerland. This article is an open access article distributed under the terms and conditions of the Creative Commons Attribution (CC BY) license (https://creativecommons.org/licenses/by/4.0/).