Article

Geometrical Parameter Effects on Solidification/Melting Processes Using Twin Concentric Helical Coil: Experimental Investigations

by
H. A. Refaey
1,2,*,
Abdullah S. A. Alotaibi
1,
A. A. Abdel-Aziz
1,
M. F. Abd Rabbo
1,† and
H. E. Abdelrahman
1
1
Department of Mechanical Engineering, Faculty of Engineering at Shoubra, Benha University, Cairo 11629, Egypt
2
Department of Mechanical Engineering, College of Engineering at Yanbu, Taibah University, Yanbu Al-Bahr 41911, Saudi Arabia
*
Author to whom correspondence should be addressed.
Deceased Author.
Appl. Sci. 2022, 12(21), 11047; https://doi.org/10.3390/app122111047
Submission received: 5 October 2022 / Revised: 28 October 2022 / Accepted: 28 October 2022 / Published: 31 October 2022
(This article belongs to the Section Applied Thermal Engineering)

Abstract

:
Moving the load peak to consume electrical power is valuable in air conditioning systems. Consequently, the current study presents an experimental thermal investigation of an ice storage system. For this purpose, a twin concentric helical coil (TCHC) is utilized. The coil is submerged in distilled water in an insulated tank. The main aim is to explore the effect of geometrical/operating conditions for the TCHC on percentage energy stored/regained, solidified/melted mass fraction, and average charging/discharging rate. The main parameters are twin coil pitch and tube diameter while keeping the cold heat transfer fluid (HTF) inlet conditions at −12 °C and 10 L/min. The results disclosed that the discharge time increases by about 79% for total energy gained as the coil pitch rises from 30 to 50 mm at a smaller tube diameter of 9.52 mm. At the same time, the discharge time is doubled when the tube diameter is 15.88 mm. Furthermore, the complete solidification needs half the time (time reduced to 50%) to be achieved as the tube diameter increases from 9.52 mm to 15.88 mm (68% increases in diameter) for lower pitch (P = 30 mm).

1. Introduction

Nowadays, countries such as Kuwait have a long, hot, dry summer (almost eight months); hence, conventional air conditioning systems (HVAC) are standard in most buildings. The increasing need for refrigeration drives up electrical power consumption. In Kuwait, over 70% of all energy goes toward powering building air conditioning systems. As a result, thermal energy storage (TES) tanks accumulate cooling energy during off-peak hours to minimize energy usage during peak hours. The chillers are used at night (during off-peak hours) to charge energy storage devices; then, they are released during on-peak time to help meet the building’s cooling needs. So, when cooling storage is included in district cooling systems, cool thermal energy storage plays an essential part in the control of peak loads and the solution to the intermittency issue of renewable energy sources. Therefore, the cool thermal energy storage (CTES) system is used through the off-peak period to compensate for the on-peak energy demand. To store energy, the chillers run throughout the off-peak period. Later, the stored energy is recovered throughout the on-peak period to cover the building cooling requirement. Some studies were illustrated using tubes for energy storage. Habeebullah [1] introduced an experimental analysis for ice growth on the exterior copper tube surfaces dipped in water in a separate vessel. The results implied that the ice axial growth rate was distinctive at a low Reynolds number, which lowered the freezing times. Sait and Selim [2] presented an experimental examination for ice creation on a horizontal tube in vertical banks exposed to falling-film–jet mode. It showed that the ice creation was controlled by tube pitch and time. Besides, the maximum ice layer was achieved after 45 min, which was identical to one-half of the pitch. Fanga et al. [3] accomplished an experimental analysis of the storage capacity in shell-and-tube by using four PCM composites. The study was implemented for the Reynolds number range Re: 500–14,500. The outcomes disclosed that the obtained storage capacity was twice the ideal stratified-water-storage tank when using the pentadecane–EG composite at Re = 4300. Experimental work for counter-current spiral coils submerged in water was introduced by López-Navarro et al. [4]. It was concluded that the most negligible energy intake was attained at the speediest charging experiments. Sait [5] presented a study to form an ice-parallel round tube coil subjected to several falling film modes. It was revealed that 170 W/m2 and nearly 1.73 g/m2 s of ice were produced in jet mode.
Xie and Yuan [6] used the Taguchi method to examine the fine layer rings’ impact on ice growth in a rectangular area. Bai et al. [7] provided experimental research on the effect of inserting fins into metal foam at the pace at which water solidifies. The study demonstrated that incorporating fins increased the space in which water froze. Jannesari and Abdollahi [8] numerically and experimentally studied ice creation in thermal storage systems using fine rings and annular fins all around coils. Ice production was enhanced by 21% and 34% when using rings and annular fins. Experiments by Gasia et al. [9] analyzed the storage time of latent heat as a thermal energy storage system. The outcomes implied that heat transfer and temperature summaries were marginally influenced by the charging time throughout the first 30 min. Ezan and Erek [10] experimented with different parameters for the ice-on-coil systems. The results implied that the inlet flow rate and temperature considerably influence the charging and discharging processes.
Some studies have been performed in a spherical capsule. ElGhnam et al. [11] conducted experimental work on the water within spherical shells to examine the heat transfer beyond freezing and melting. The results demonstrated that the total charging time was reduced. The frozen mass fraction improved using small metallic capsules with smaller heat transfer fluid temperatures and greater volume flow rates. Prabakaran et al. [12] examined the melting behavior of a fatty-acid-based PCM with functionalized graphene nanoplatelets ranging from 0.1% to 0.5% by volume in a spherical capsule. The results showed that adding graphene nanoplatelets to PCM changed its Newtonian to non-Newtonian behavior at low shear rates. Adding 0.5 vol% graphene nanoplatelets to PCM nanocomposite decreased melting time by 26% and 21% at 10 °C and 2 °C, respectively
Researchers studied the helical, conical, and twin coils in energy storage systems. The use of a coiled heat exchanger for ice storage has been studied by Li et al. [13] using both numerical and theoretical methods. Recently, Mahdi et al. [14] accomplished an experimental examination of paraffin wax in a tapering coil used as a storage unit. Compared with the standard coil, the findings suggested a maximum increase in melting rate of about 28.32% at a fluid intake temperature of 80 °C. Naphon [15] examined the helical coil thermal presentation and pressure fall with and devoid of helical-crimped fins. The results illustrated that the inlet operating conditions for hot and cold water considerably influenced the heat exchanger’s effectiveness. Abdelrahman et al. [16] presented experimental examinations on an ice storage system utilizing a twin concentric helical coil (TCHC). The outcomes disclosed that about 90% of energy stored was attained at 59% to 74% of the total charging time. Hamzeh and Miansari [17] numerically analyzed ice-on-coil thermal storage phase variations using many parameters. Ice formation was performed in a hollow space with a refrigerant transporter. The results discovered that increasing fin height increased the freezing rate. Table 1 represents the merits and demerits of different coils used in cool thermal energy storage.
Recently, some studies used nano-PCM as a HTF in the energy storage system. Sathishkumar and Cheralathan [18] examined the impact of HTF intake temperature and volumetric flow rates on the overall charging and discharging time of a low-capacity energy storage tank (nano-PCM). HTF settings minimize charging and discharging time by 18.26% to 22.8%. Discharging restores 85.89% of the stored energy, or 2637 kJ (3070 kJ). At 4 °C HTF, f-GNP dispersion reduces nano-PCM SEC by 28%. The performance of a low-capacity energy storage tank filled with nano-PCM-containing spherical capsules was assessed by Sidney et al. [19]. The findings showed that by adjusting to the HTF parameters, charging and discharging times were reduced by 18.26% to 22.8%. The melting rate was raised by 42% at 31 °C and 63% at 36 °C when 0.5 vol% graphene was added.
Dogkas et al. [20] used organic phase transition materials in a cold thermal energy storage system (A9 and A14). The real-world system contains a heat pump that circulates water via pipes to chill organic material and fan coil units that release their thermal load in the initially cooled storage medium. A staggered heat exchanger immersed in phase change material is within a thermal energy storage tank. The tank absorbed over 6 kWh per fan coil, and the heat transmission rate reached 5 kW for 32 and 24 min using A9 and A14. The staggered heat exchanger provided less than 10 kW of heat when the water output temperature was 5 to 10 °C, which a commercial heat pump can easily achieve. Al-Mudhafar et al. [21] studied a modified webbed tube heat exchanger using two-dimensional numerical models to improve PCM thermal energy storage (TES) performance. This heat exchanger’s thermal performance was compared with webbed and triple-tube heat exchangers. Simulations monitored solidification (discharging). The redesigned webbed tube heat exchanger sped up the PCM solidification process by 41%. Mahdi et al. [22] presented a double-pipe helical-coiled tube for containment containing latent heat thermal energy storage (LHTES) PCM. Experiments validate a 3D numerical model of PCM melting in horizontal and vertical straight double-pipe LHTES systems with the same surface area. In PCM melting, the double-pipe helical-coil LHTES performs badly. Horizontal and vertical LHTES systems must minimize PCM melting time by 25.7% and 60%. In a double-pipe helical-coiled tube, coil pitch impacts PCM melting time.
So, from the review, the studies were conducted on straight tubes and ice-on-coil systems. Further, other studies concentrated on helical coil tubes with different pitches and compared the results with straight tubes. The biggest challenge in this investigation area is the continuing decline in the heat transfer coefficient with the accompanying reduction in the thermal conductivity with the growth of additional ice on test tubes through the charging process because of ice layer resistance. The current study uses a twin concentric helical coil (TCHC) as a novel coil instead of the normal helical coil, which previous researchers have used. So, this work concentrates on enhancing the (TCHC) performance used in the storage system. To do this, it is necessary to understand the twin concentric helical coil (TCHC) geometrical characteristics, built and developed to improve heat transmission between the PCM and HTF. This research also looks at how the geometrical and operational restrictions affect the thermal performance of CTES systems. Coil pitch and tube diameter are the most researched geometrical characteristics.

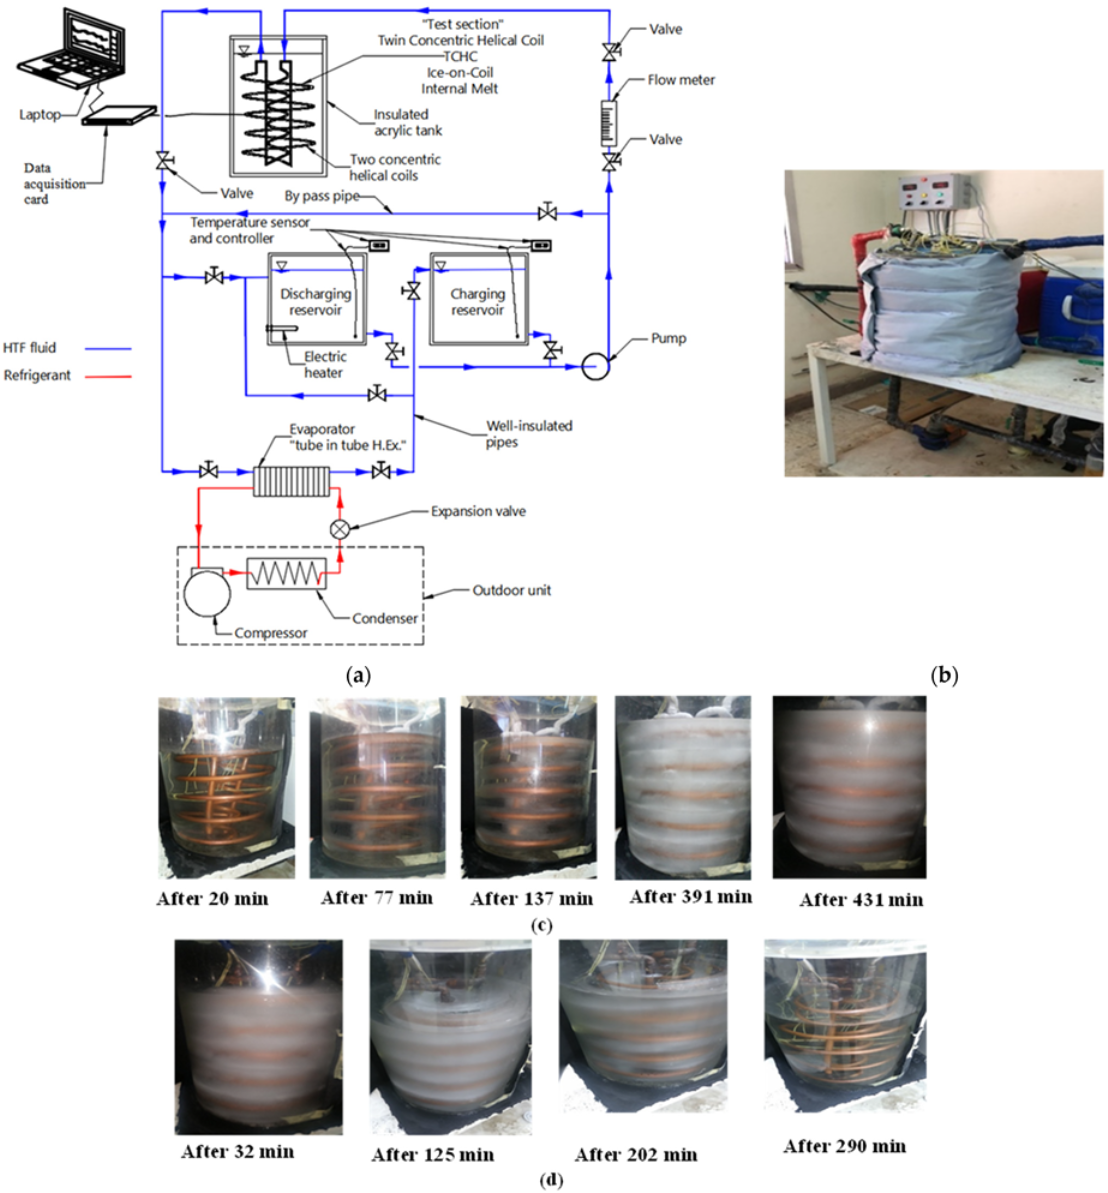
2. Experimental Setup and Procedures

The current work is performed on an experimental test rig presented by Abdelrahman et al. [16]. The representation of the setup with its details is demonstrated in Figure 1. As shown, it comprises a refrigeration cycle (vapor-compression cycle, R-22) and the cycle of ice storage. The refrigeration cycle is created to cool the ethylene glycol solution and heat transfer fluid (HTF) to the mandatory operating temperature during charging.
The TCHC (test section), which houses measurement equipment, makes up most of the ice storage cycle. Samples of experimental results for ice formation during charging and discharging operations are shown in Figure 1. A heat transfer fluid is an aqueous ethylene glycol solution with a freezing point of −19 °C and a concentration of 35% by weight (HTF). The experimental setup specifications are presented in Table 2. The cylindrical acrylic ice storage tank is fabricated to be filled with distilled water (PCM). The PCM fills the tank to half a pitch above the top turn of the TCHC. The details of the coil’s geometrical parameters are presented in Table 3. Two typical insulated reservoirs for charging and discharging each are filled with 45 L of HTF. Data acquisition with 16 channels is used to instantaneously record the HTF temperature distribution in 15 different locations with calibrated (T-type) thermocouples. Figure 2 represents the positions of the nine thermocouples in the middle turns of TCHC. The remaining six thermocouples are on three vertical axes on upper, lower, and middle turns. Some thermocouples are employed to determine the inlet and outlet HTF temperatures.
Furthermore, a rotameter is employed to evaluate the volume flow rate of HTF, which is constant in this study at 10 L/min. The charging and discharging HTF temperatures are maintained at −12 °C and 10 °C, respectively, for all experiments in the current work. A digital temperature controller (DTC) with a set point differential of ±1 °C is used to keep the charging and discharging temperatures inside the charging or discharging reservoirs during the experiments. An air-conditioned laboratory unit uses a 22 ± 1 °C dry bulb temperature and 50 ± 5% relative humidity.
The experimental procedures start with positioning the valves for charging or discharging. Then, with the DTC instrument, the temperatures are settled to the required values. Once the HTF temperature is achieved, it can proceed through the test section with the adjusted volume flow rate. Furthermore, the PCM temperatures are recorded every 1 s using the data acquisition system. The DTC sensor controls the HTF temperature throughout the discharging mode by an electric heater placed in the discharging tank.

Data Reduction

The solid–liquid boundary standpoint with time is forecasted throughout the charging and discharging processes by tracking the temperature at numerous positions displayed in Figure 2. Consequently, with the average thickness t a v g , the solidified or melted mass around the inner and outer coils can be predicted. As per Figure 2, t a v g = t 1 + t 2 2   for the inner coil of TCHC and t a v g = t 3 + t 4 2     for the exterior coil of TCHC. The calculations of the solidified and melting volume, depending on the average thickness of the solidified or melted mass, are categorized into two domains. The first domain is when the average thickness is within the half pitch around the coil turn, while the second domain is when it is higher than the half pitch. Accordingly, the solidified and melting volumes are calculated as follows:
In the first domain, [ 0 < t a v g ( p / 2 r t , o ) ] :
V s = ( ρ w / ρ i ) ( π [ ( r t , o + t a v g ) 2 r t , o 2 ] 2 π R c o i l , c )
V m = N   π [ ( r t , o + t avg ) 2 r t , o 2 ] 2 π R coil , c
In the second domain, [ t a v g > ( p / 2 r t , o ) ] :
V s = N ( ρ w / ρ i ) ( [ π ( r 2 2 r 1 2 ) × p ] ( π r t , o 2 × 2 π R c o i l , c ) )
V m = N ( [ π ( r 2 2 r 1 2 ) × p ] ( π r t , o 2 × 2 π R coil , c ) )
where r 3 and r 4 are used in place of r 1 and r 2 when computations are taken for the outer coil of TCHC.
The solidified and melted mass fractions are calculated from the following forms, respectively:
m s m o = ρ i V s ρ w V o
m m m o = ρ i V m ρ w V o
The following formulas are used to calculate the cumulative and maximum thermal energy stored and regained:
Q st = ρ w V o { c w ( T o T l ) + ( m s m o ) H f u s + ( m s m o ) c i ( T pc T s ) }
Q st , max = ρ w V o { c w ( T o T pc ) + H f u s + c i ( T pc T HTF ) }
Q reg = ρ w V o { c i ( T s T o ) + ( m m m o ) H f u s + ( m m m o ) c w ( T l T pc ) }
Q reg , max = ρ w V o { c i ( T pc T o ) + H f u s + c i ( T HTF T pc ) }
Additionally, the following forms are used to determine the average charging and discharging rates.
  Q ˙ ch = Q st τ
  Q ˙ dis = Q reg τ
The PCM (distilled water) properties and constant values applied in the current study in the two liquid and solid phases are scheduled in Table 4.
The uncertainties of the measured solidified/melted mass fraction, percentage energy stored/regained, and average charging/discharging rate are calculated as per the procedure reported by Moffat [24], as follows, and for the charging processes, where similar equations are used for the discharging processes. The main parameter uncertainties are stated in Table 5 for all experimental runs.
m s m o = f ( V s ,   V o   ,   t a v g ,   R c o i l , c ) m s m o m s m o = [ ( V s V s ) 2 + ( V o V o ) 2 + ( t a v g t a v g ) 2 + ( R c o i l , c R c o i l , c ) 2 ] 0.5
% Q st = f ( Q st ,   Q st , max ) = f ( V o , m s m o , T o , T l , T pc , T s ,   Q st , max ) ( % Q st ) % Q st = [ ( V o V o ) 2 + ( m s m o m s m o ) 2 + ( T o T o ) 2 + ( T l T l ) 2 + ( T pc T pc ) 2 + ( T s T s ) 2 + ( Q st , max Q st , max ) 2 ] 0.5
  Q ˙ ch = f ( Q st ,   τ )   Q ˙ ch   Q ˙ ch = [ ( Q st Q st ) 2 + ( τ τ ) 2 ] 0.5

3. Results and Discussion

The objective of the current experimental investigation is to determine the effects of coil pitch and tube diameter on the performance of a CTES system for solidification/melting mass fraction, charging/discharging average rate, and percentage of energy stored/recovered during distilled water (PCM) charging and ice discharging processes.

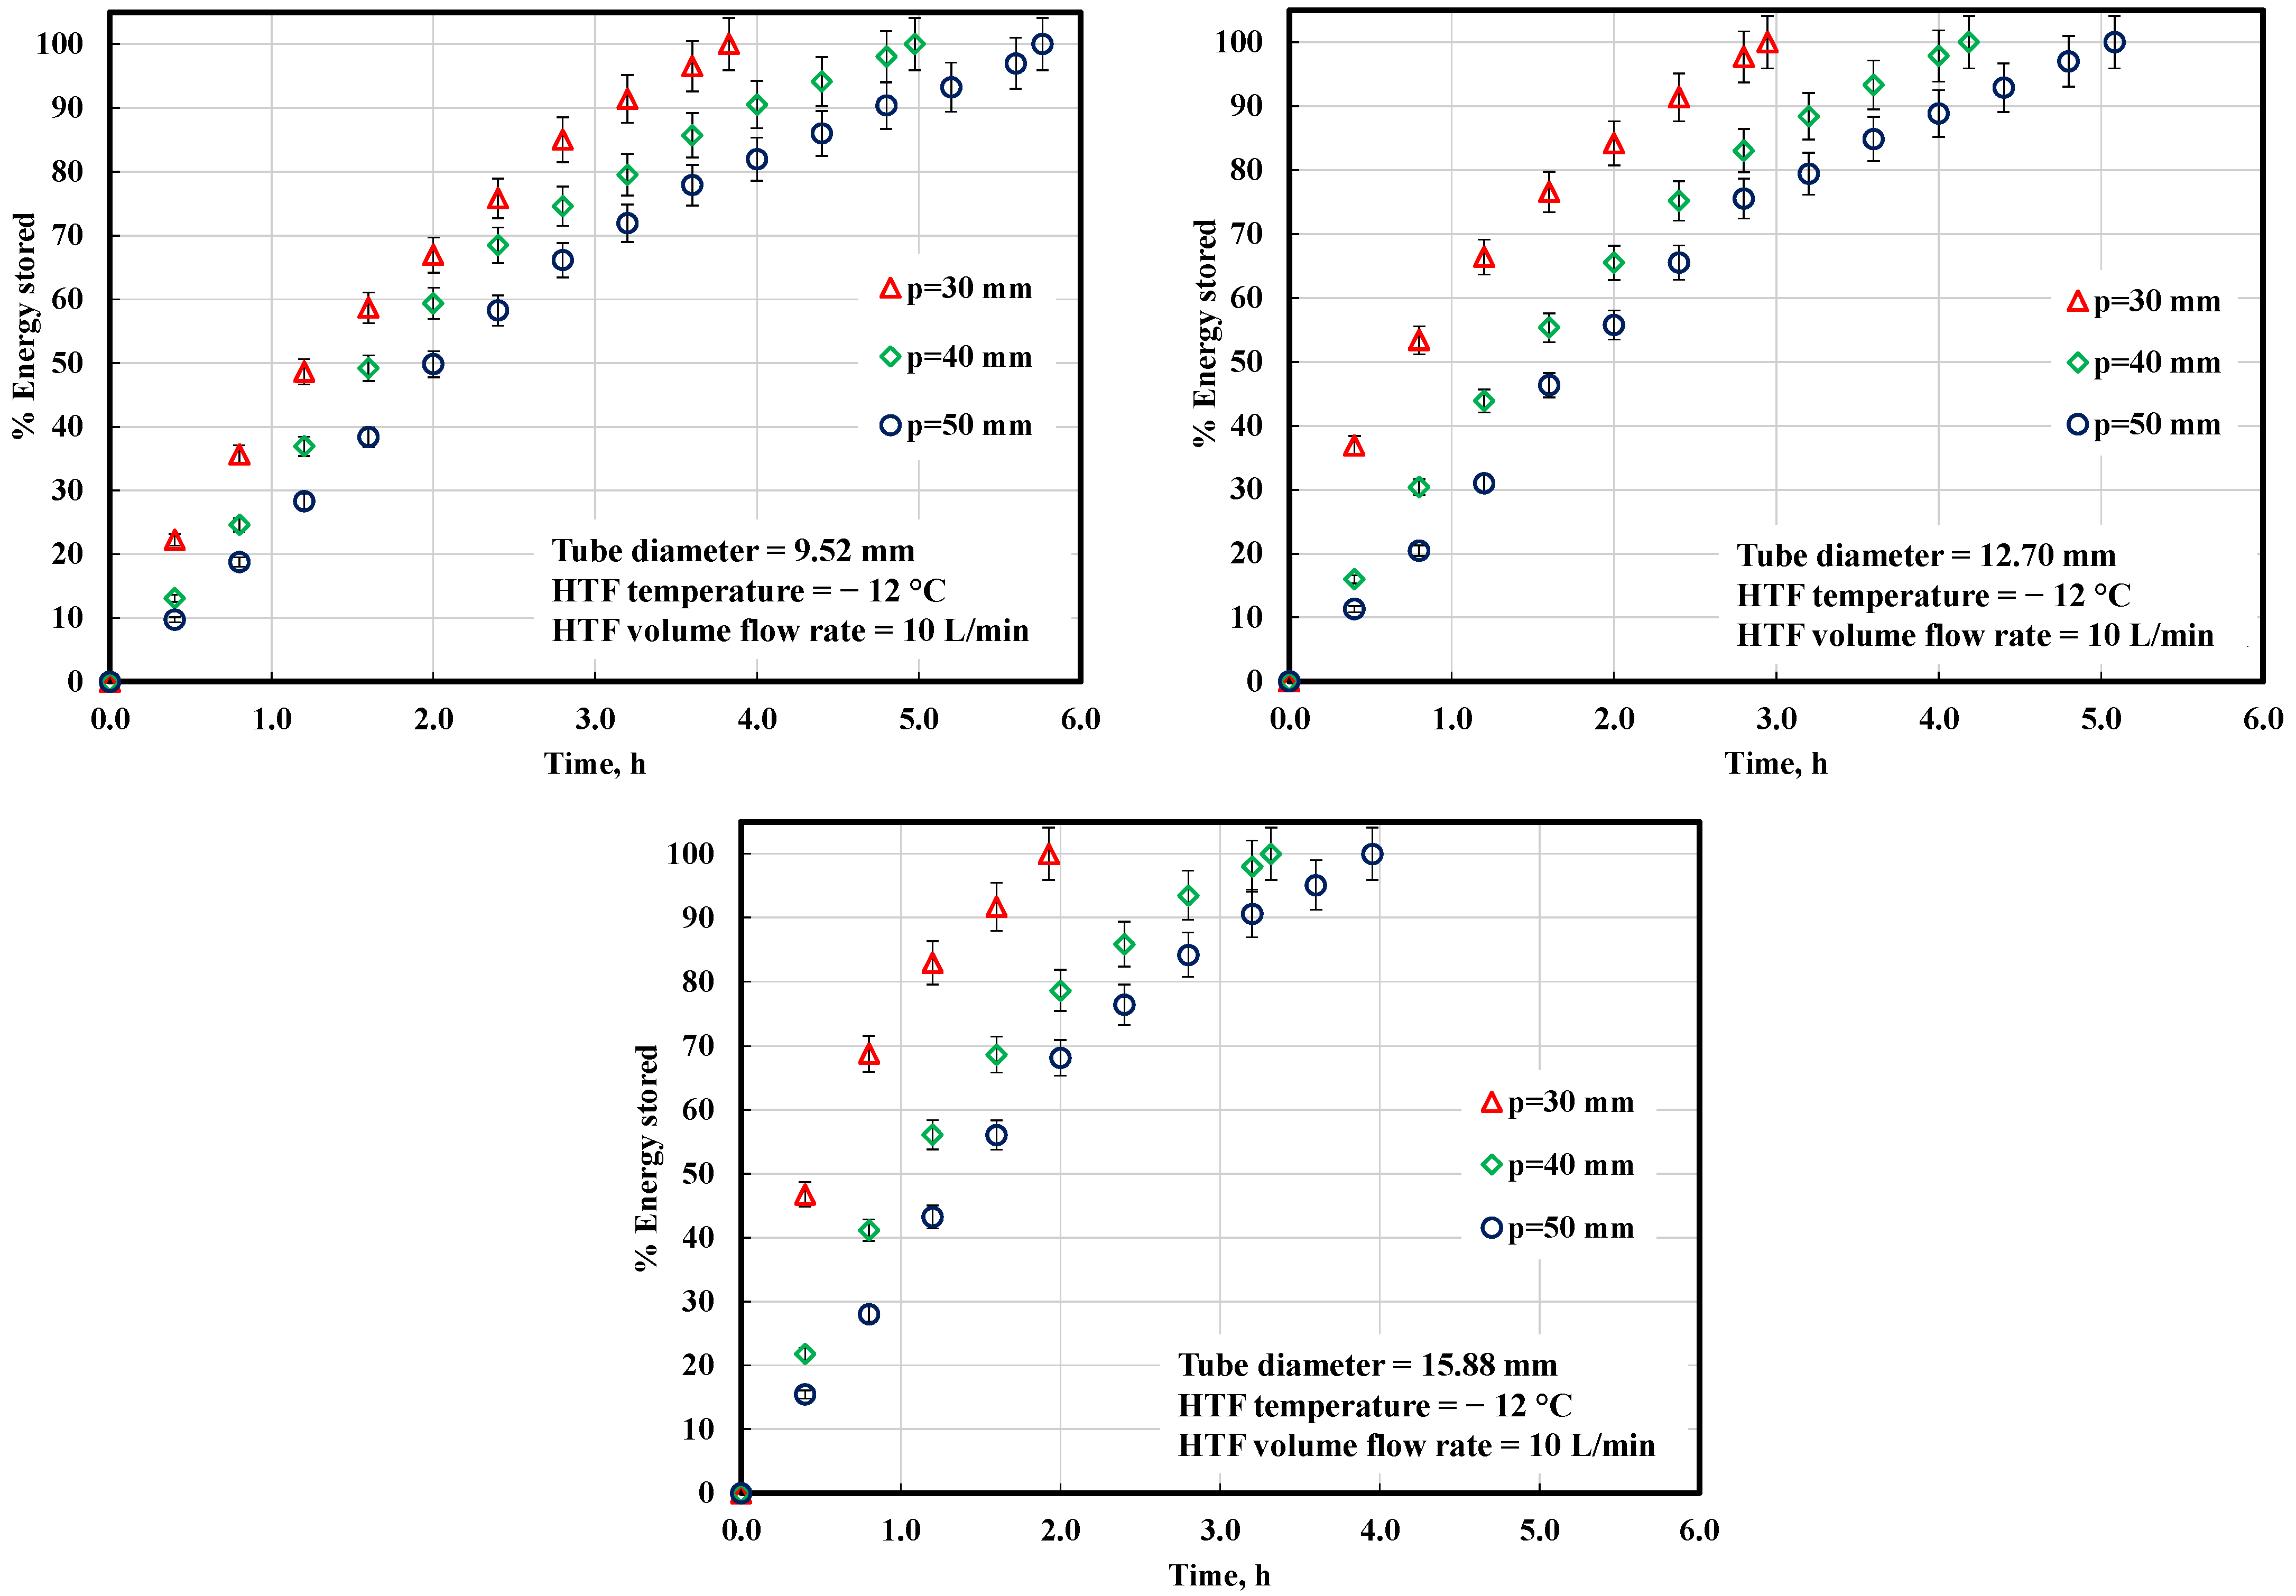
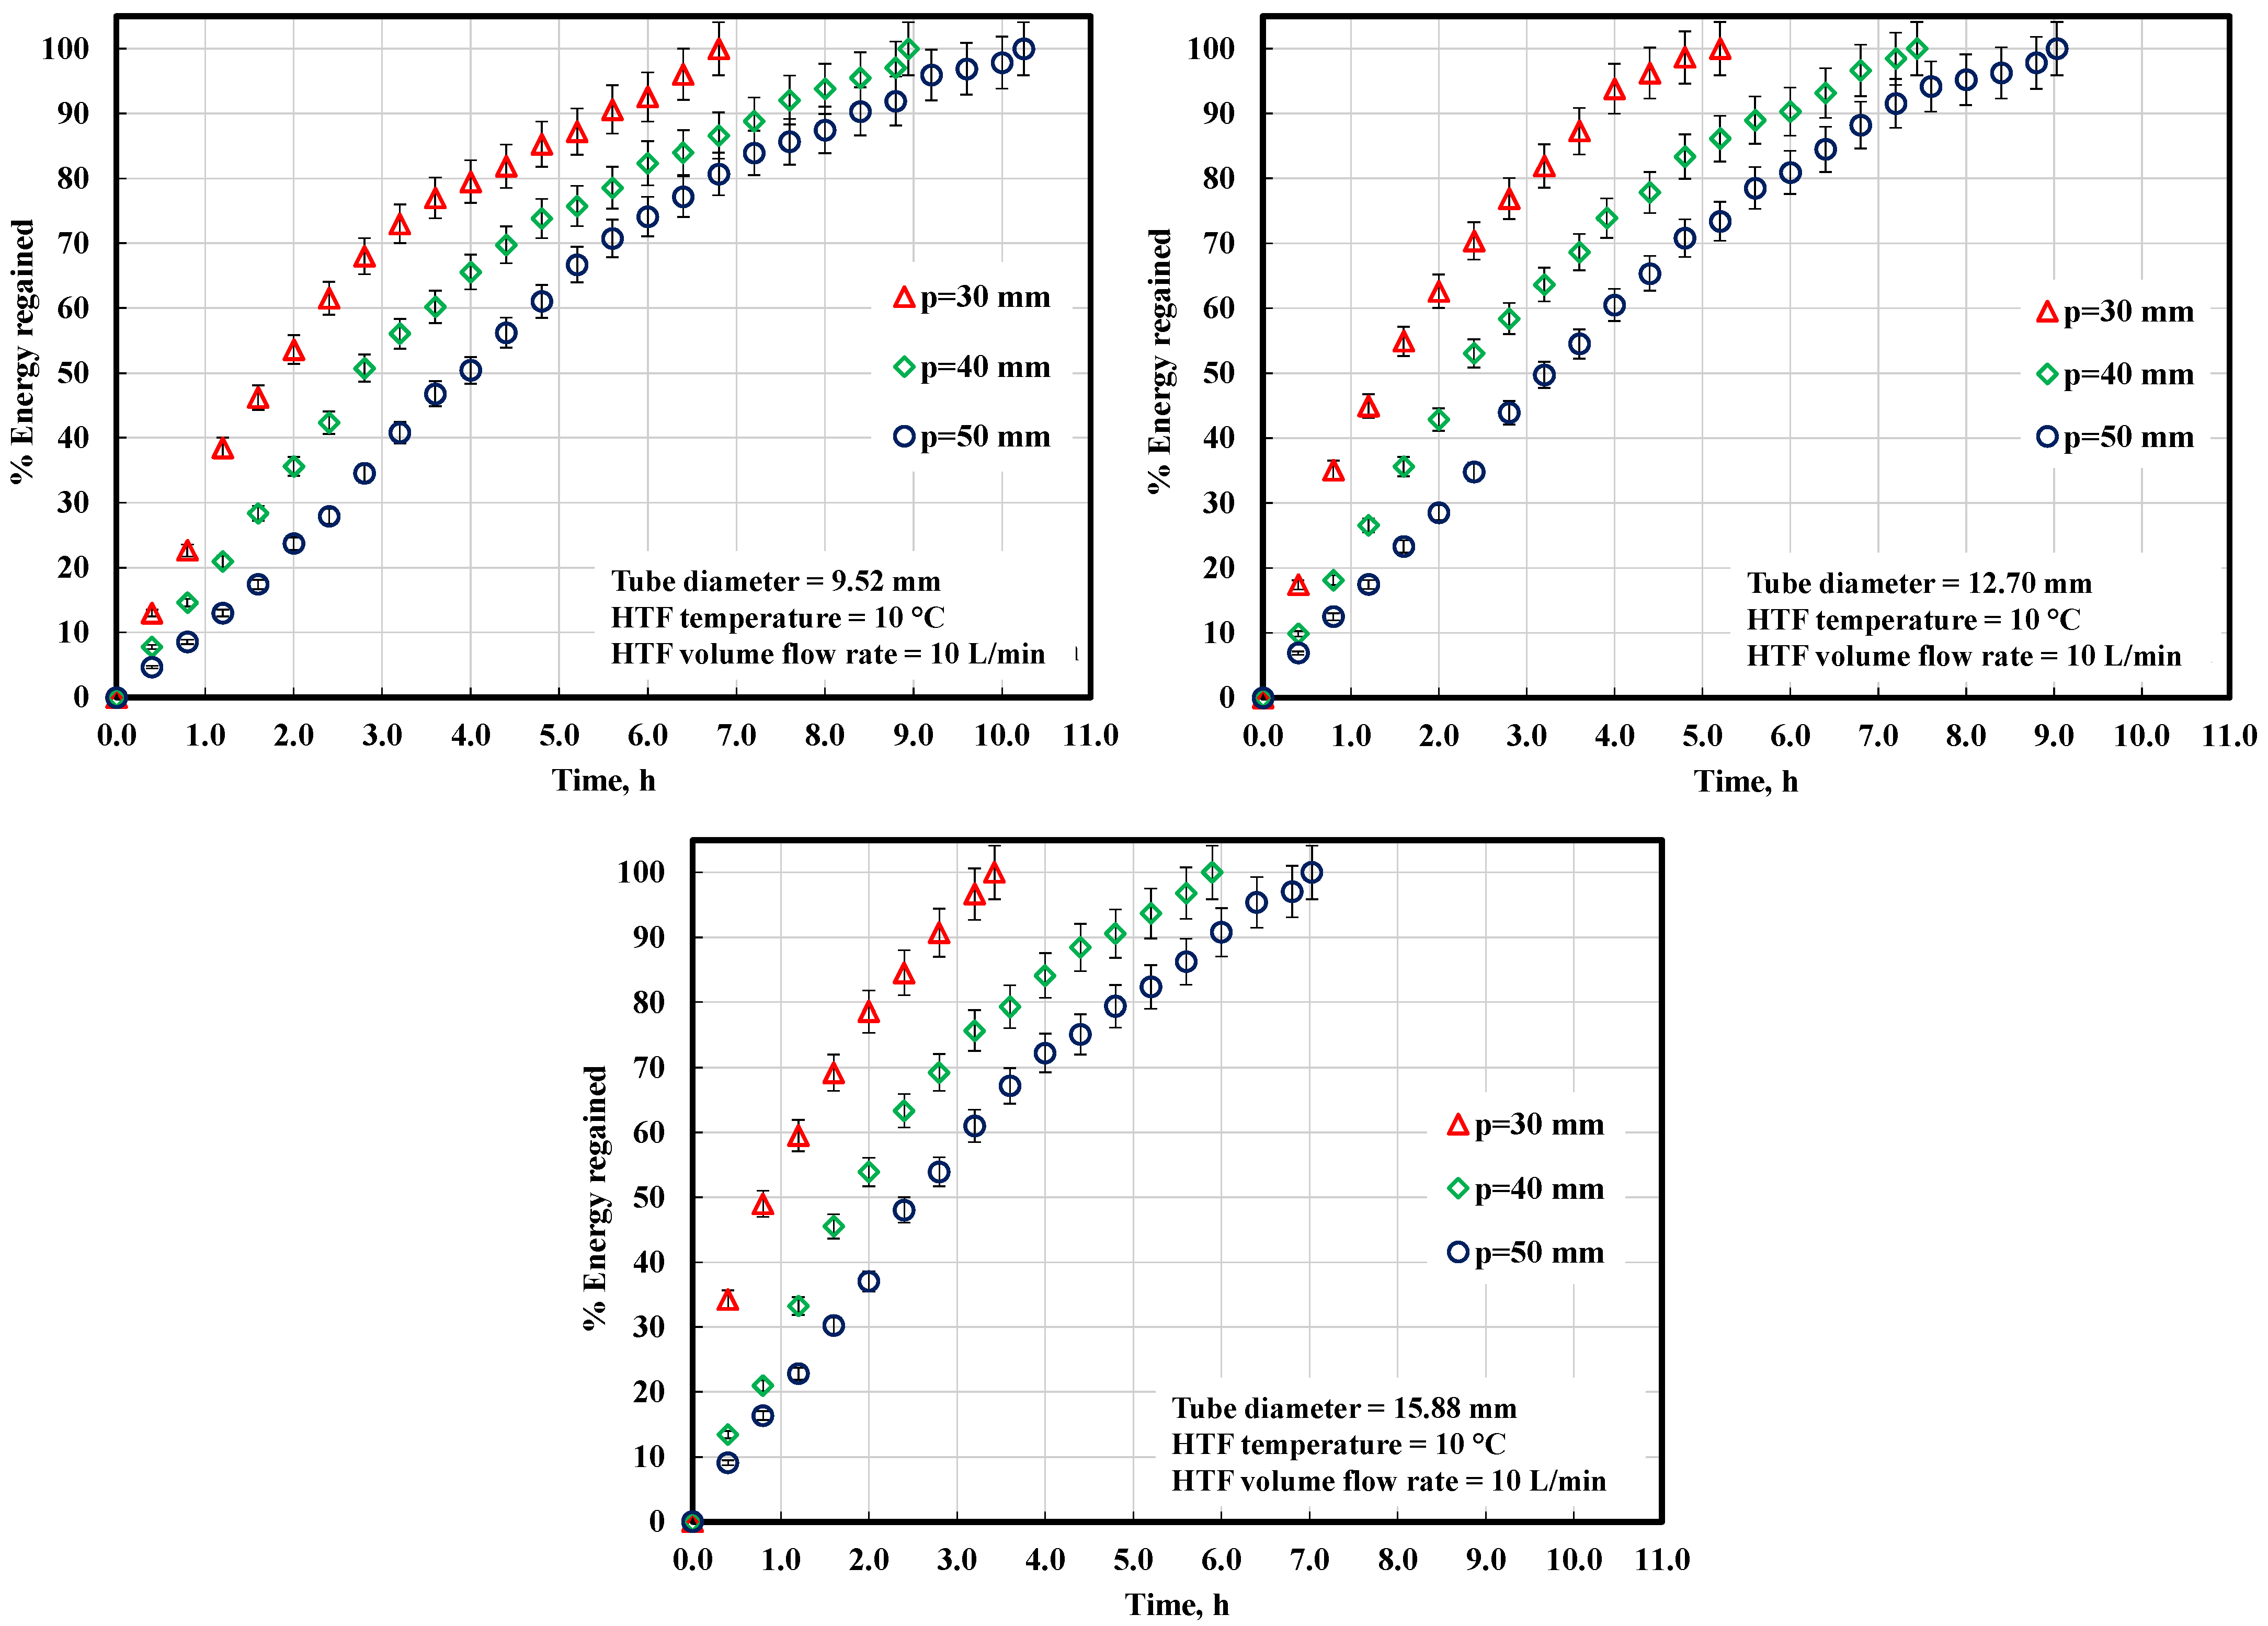
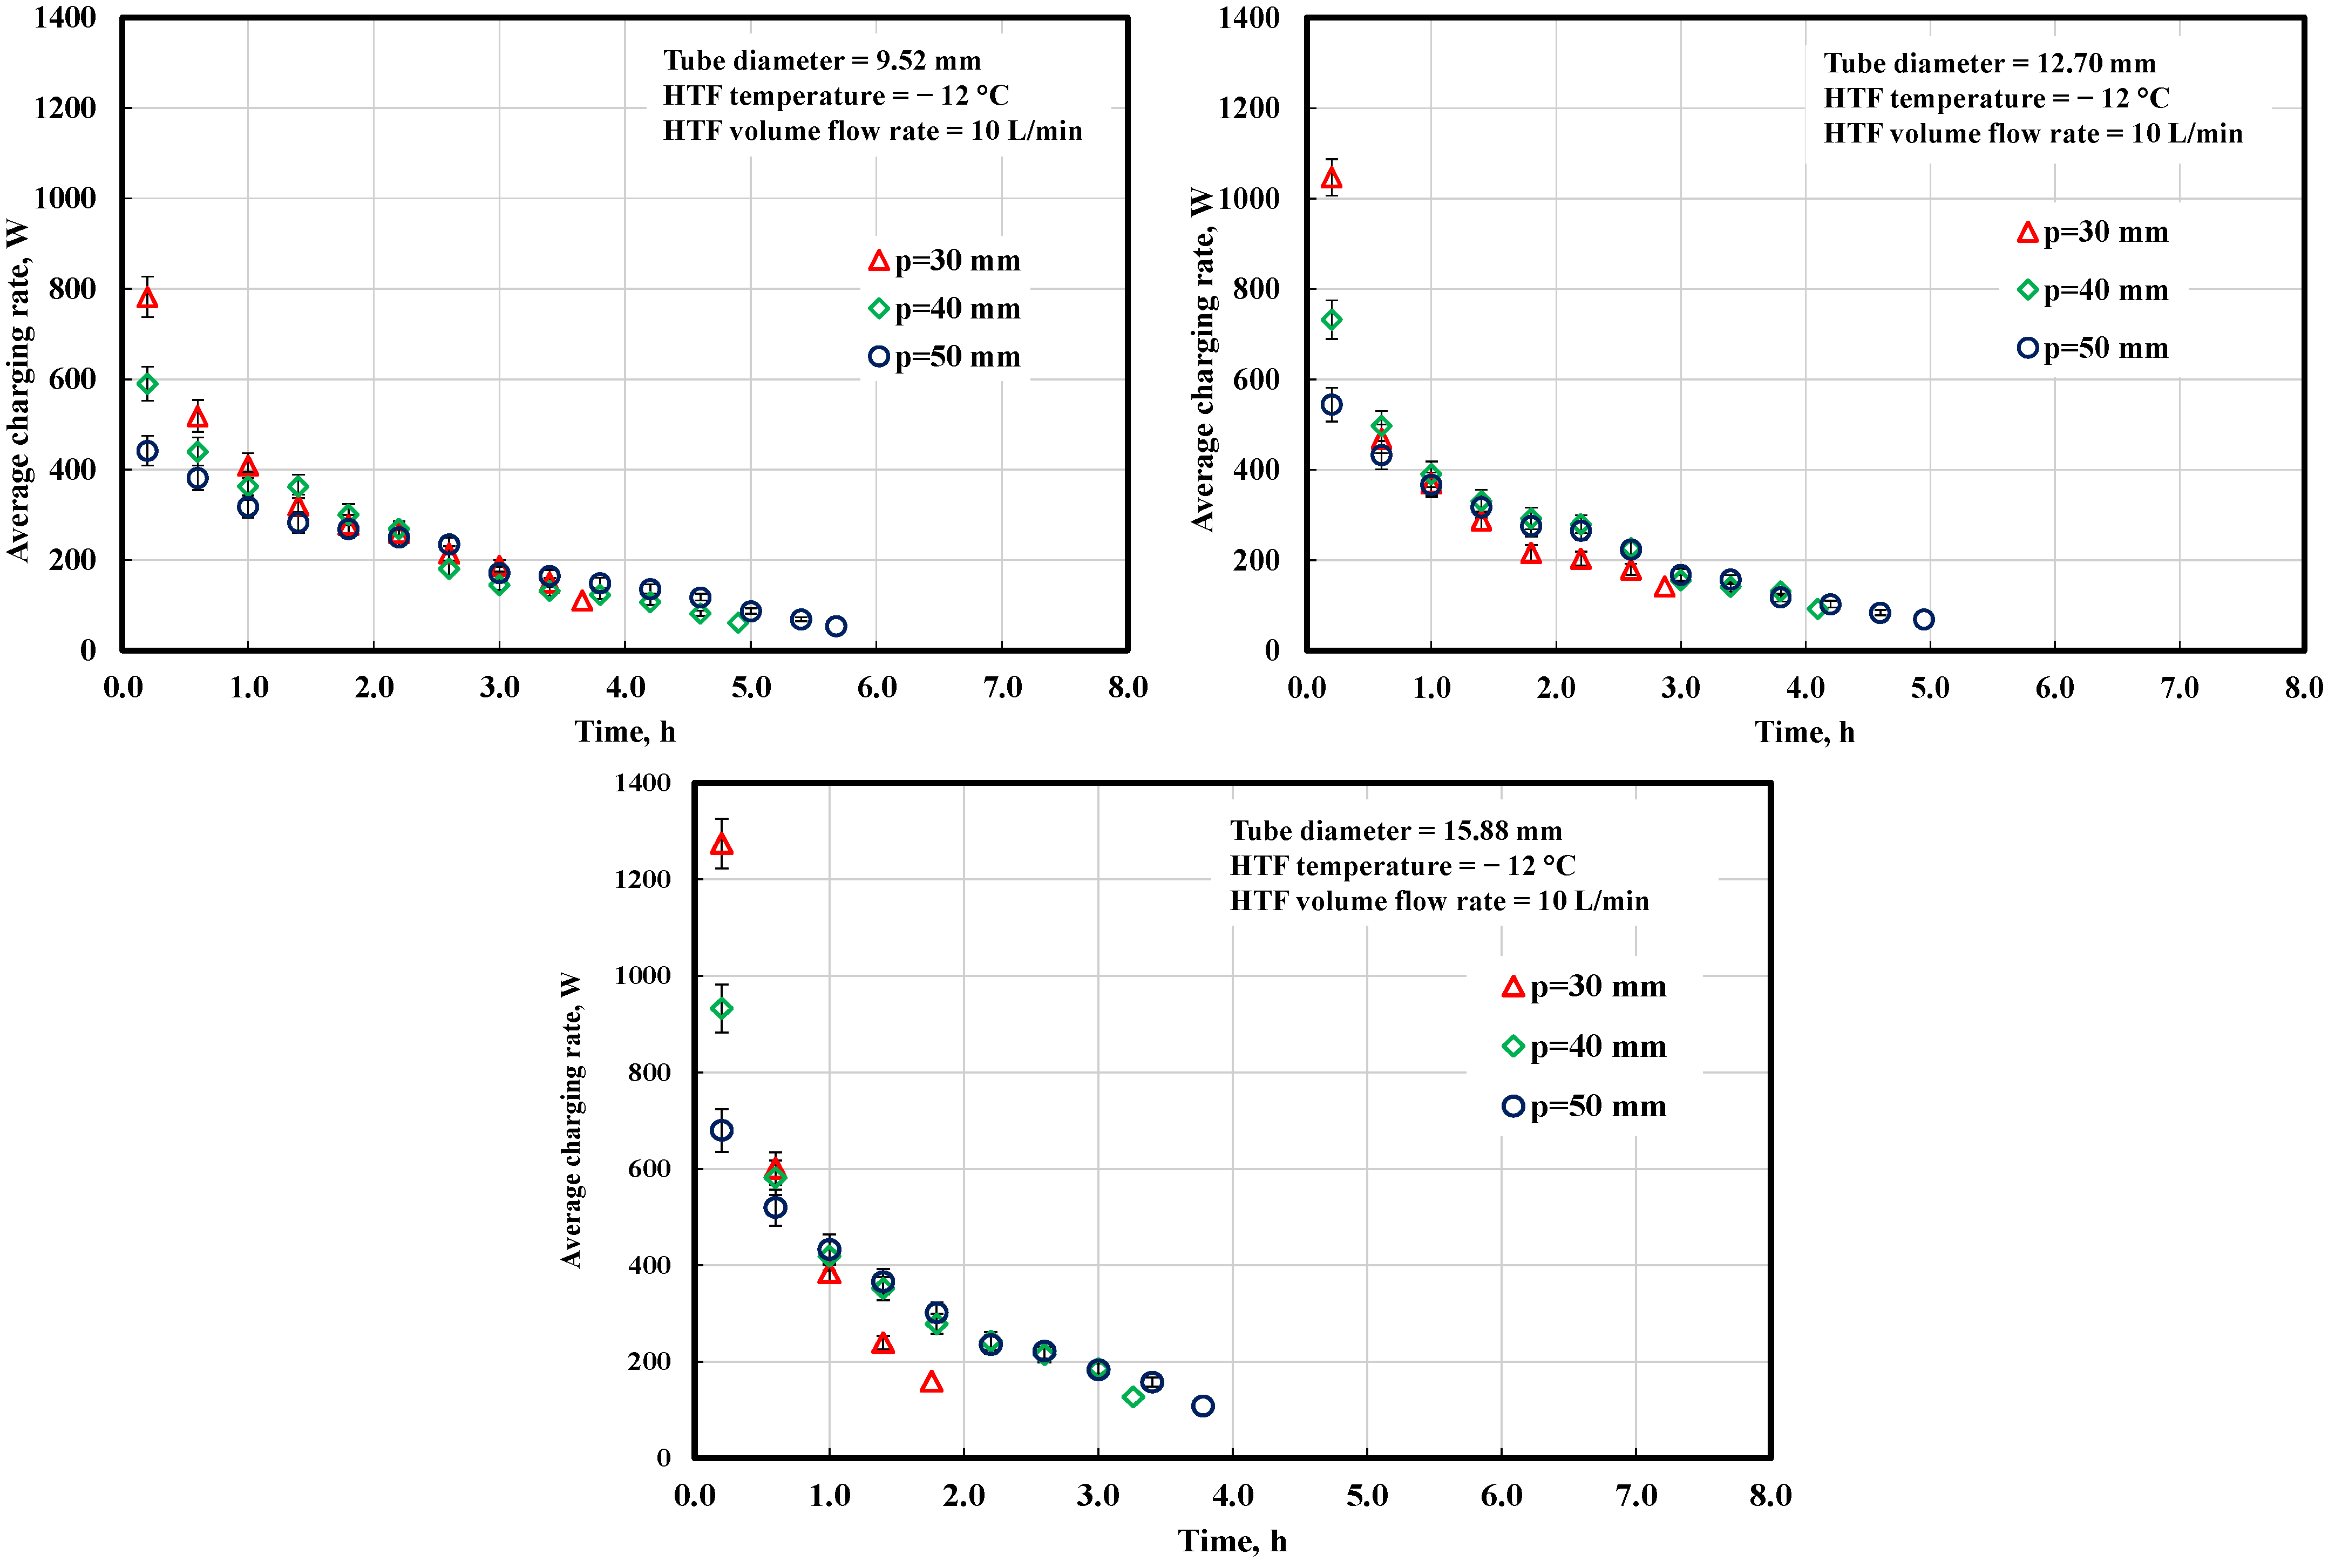
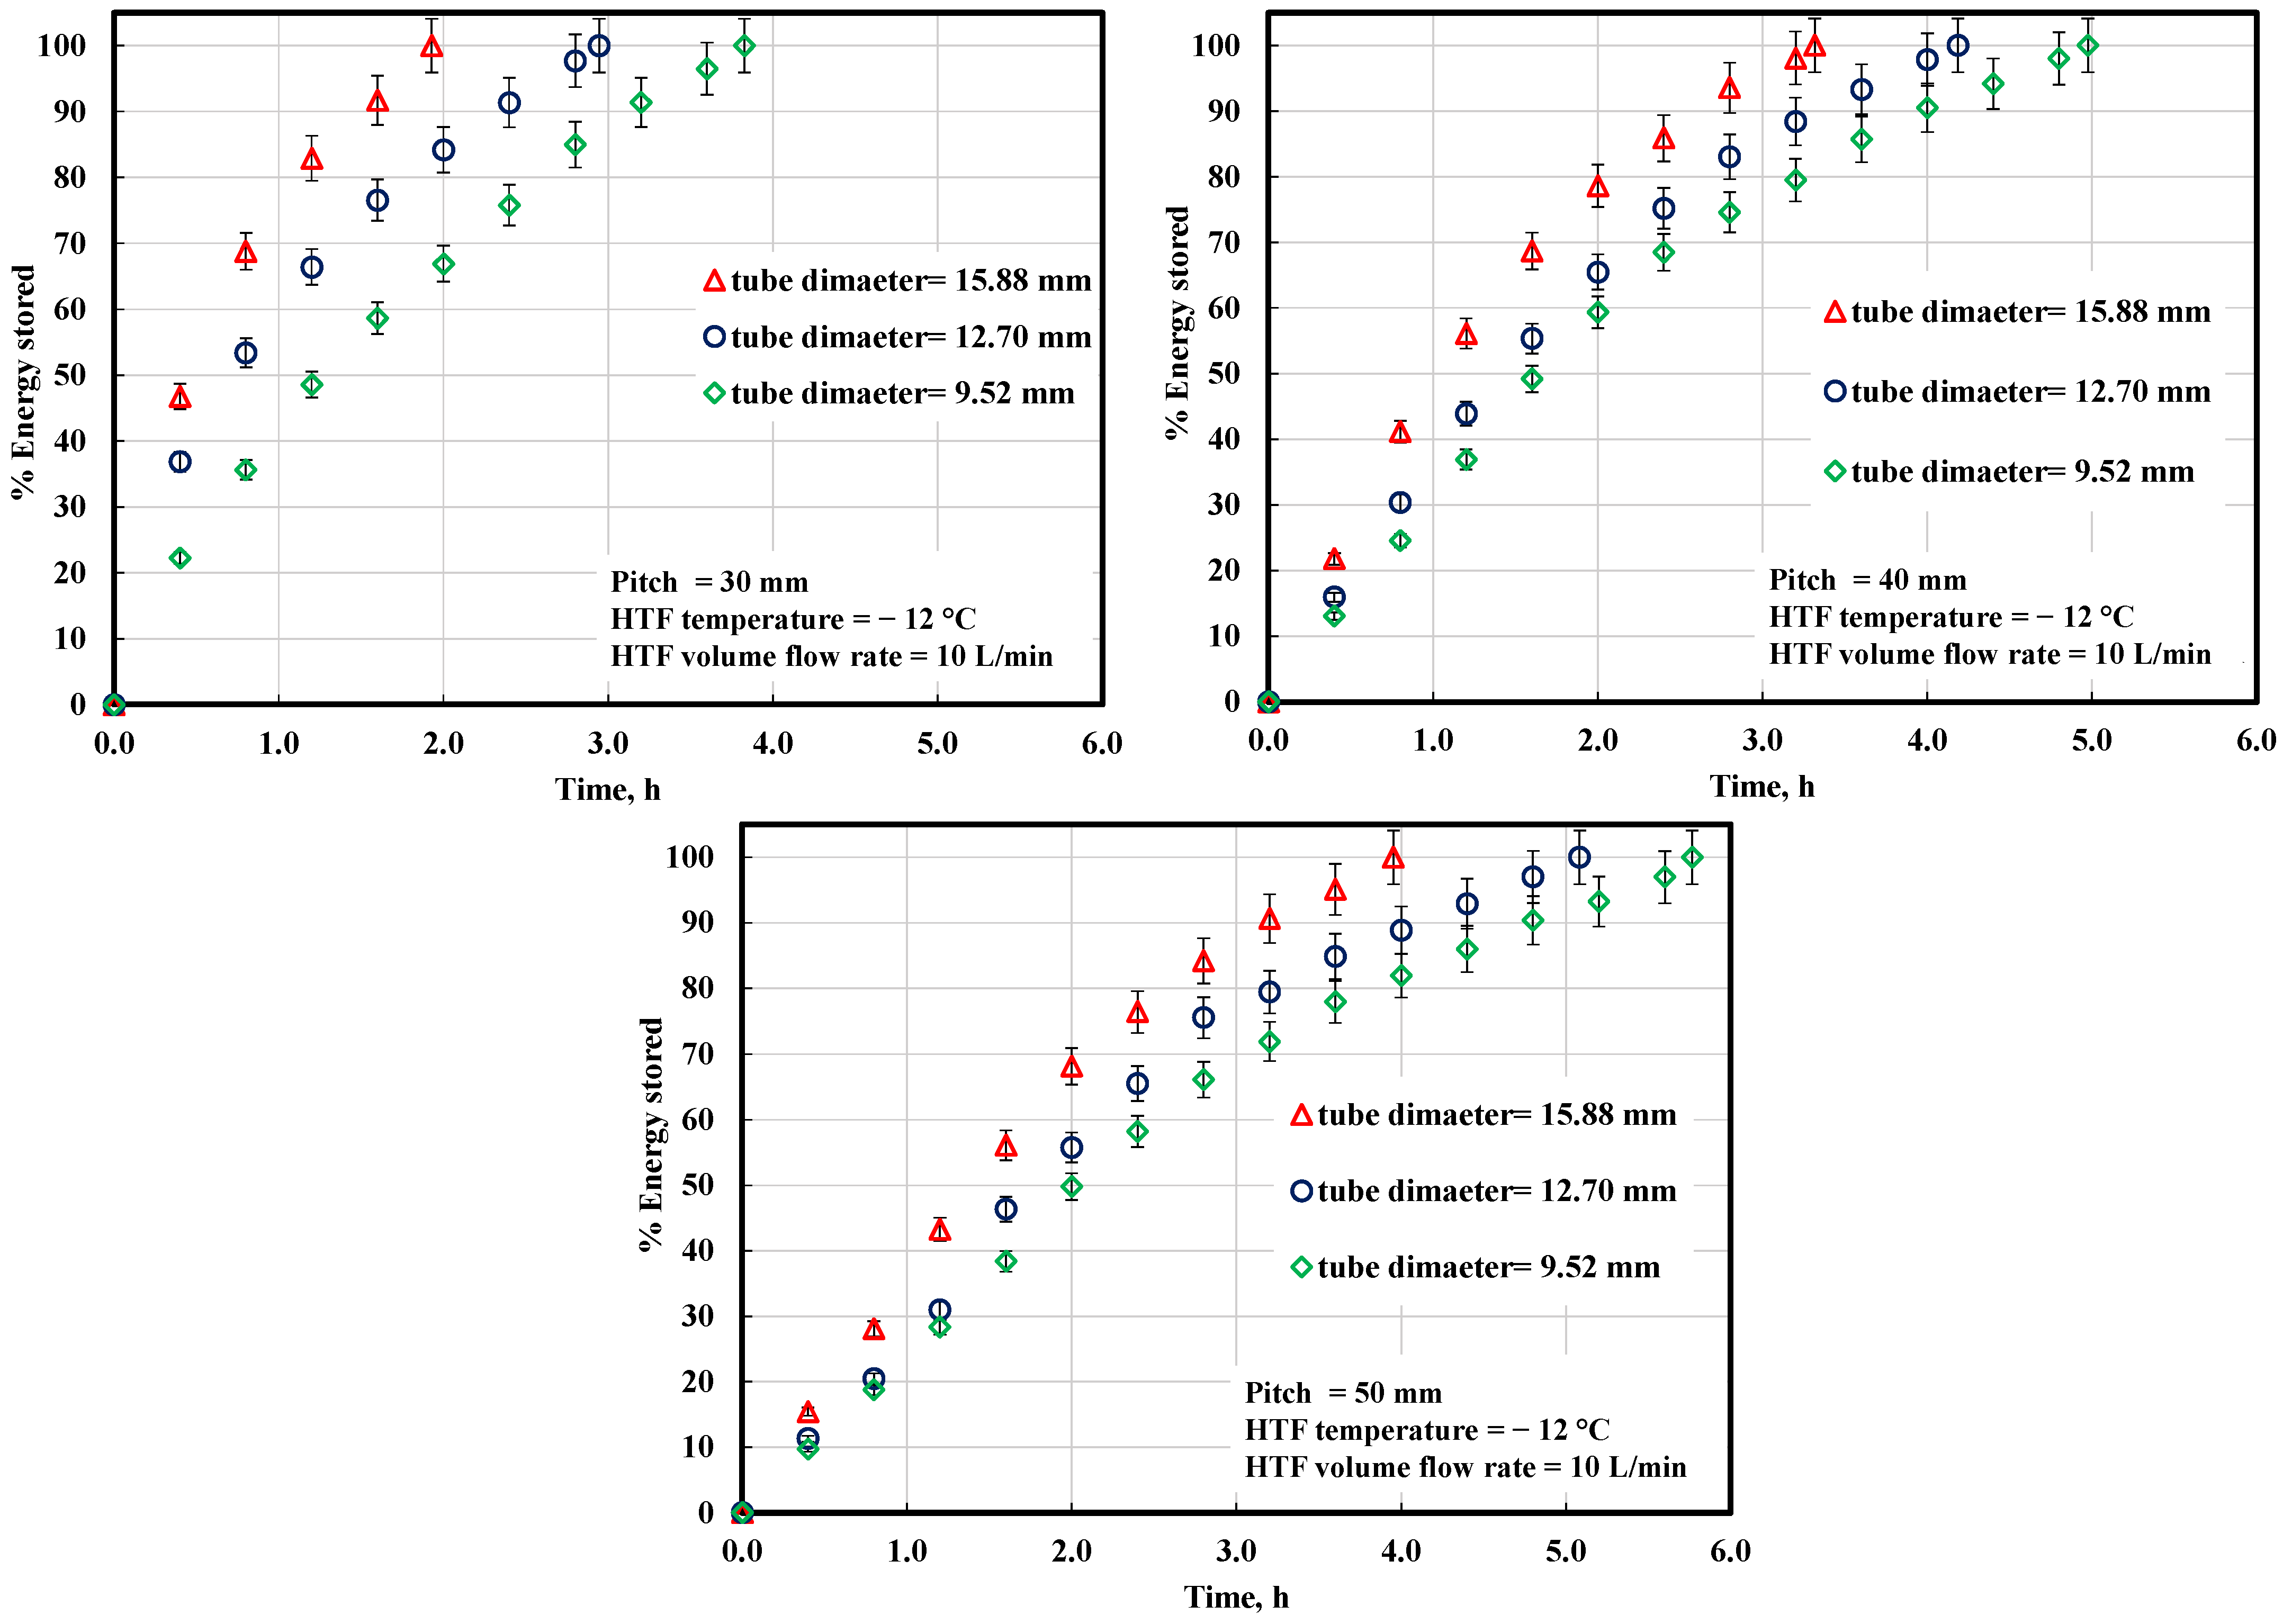
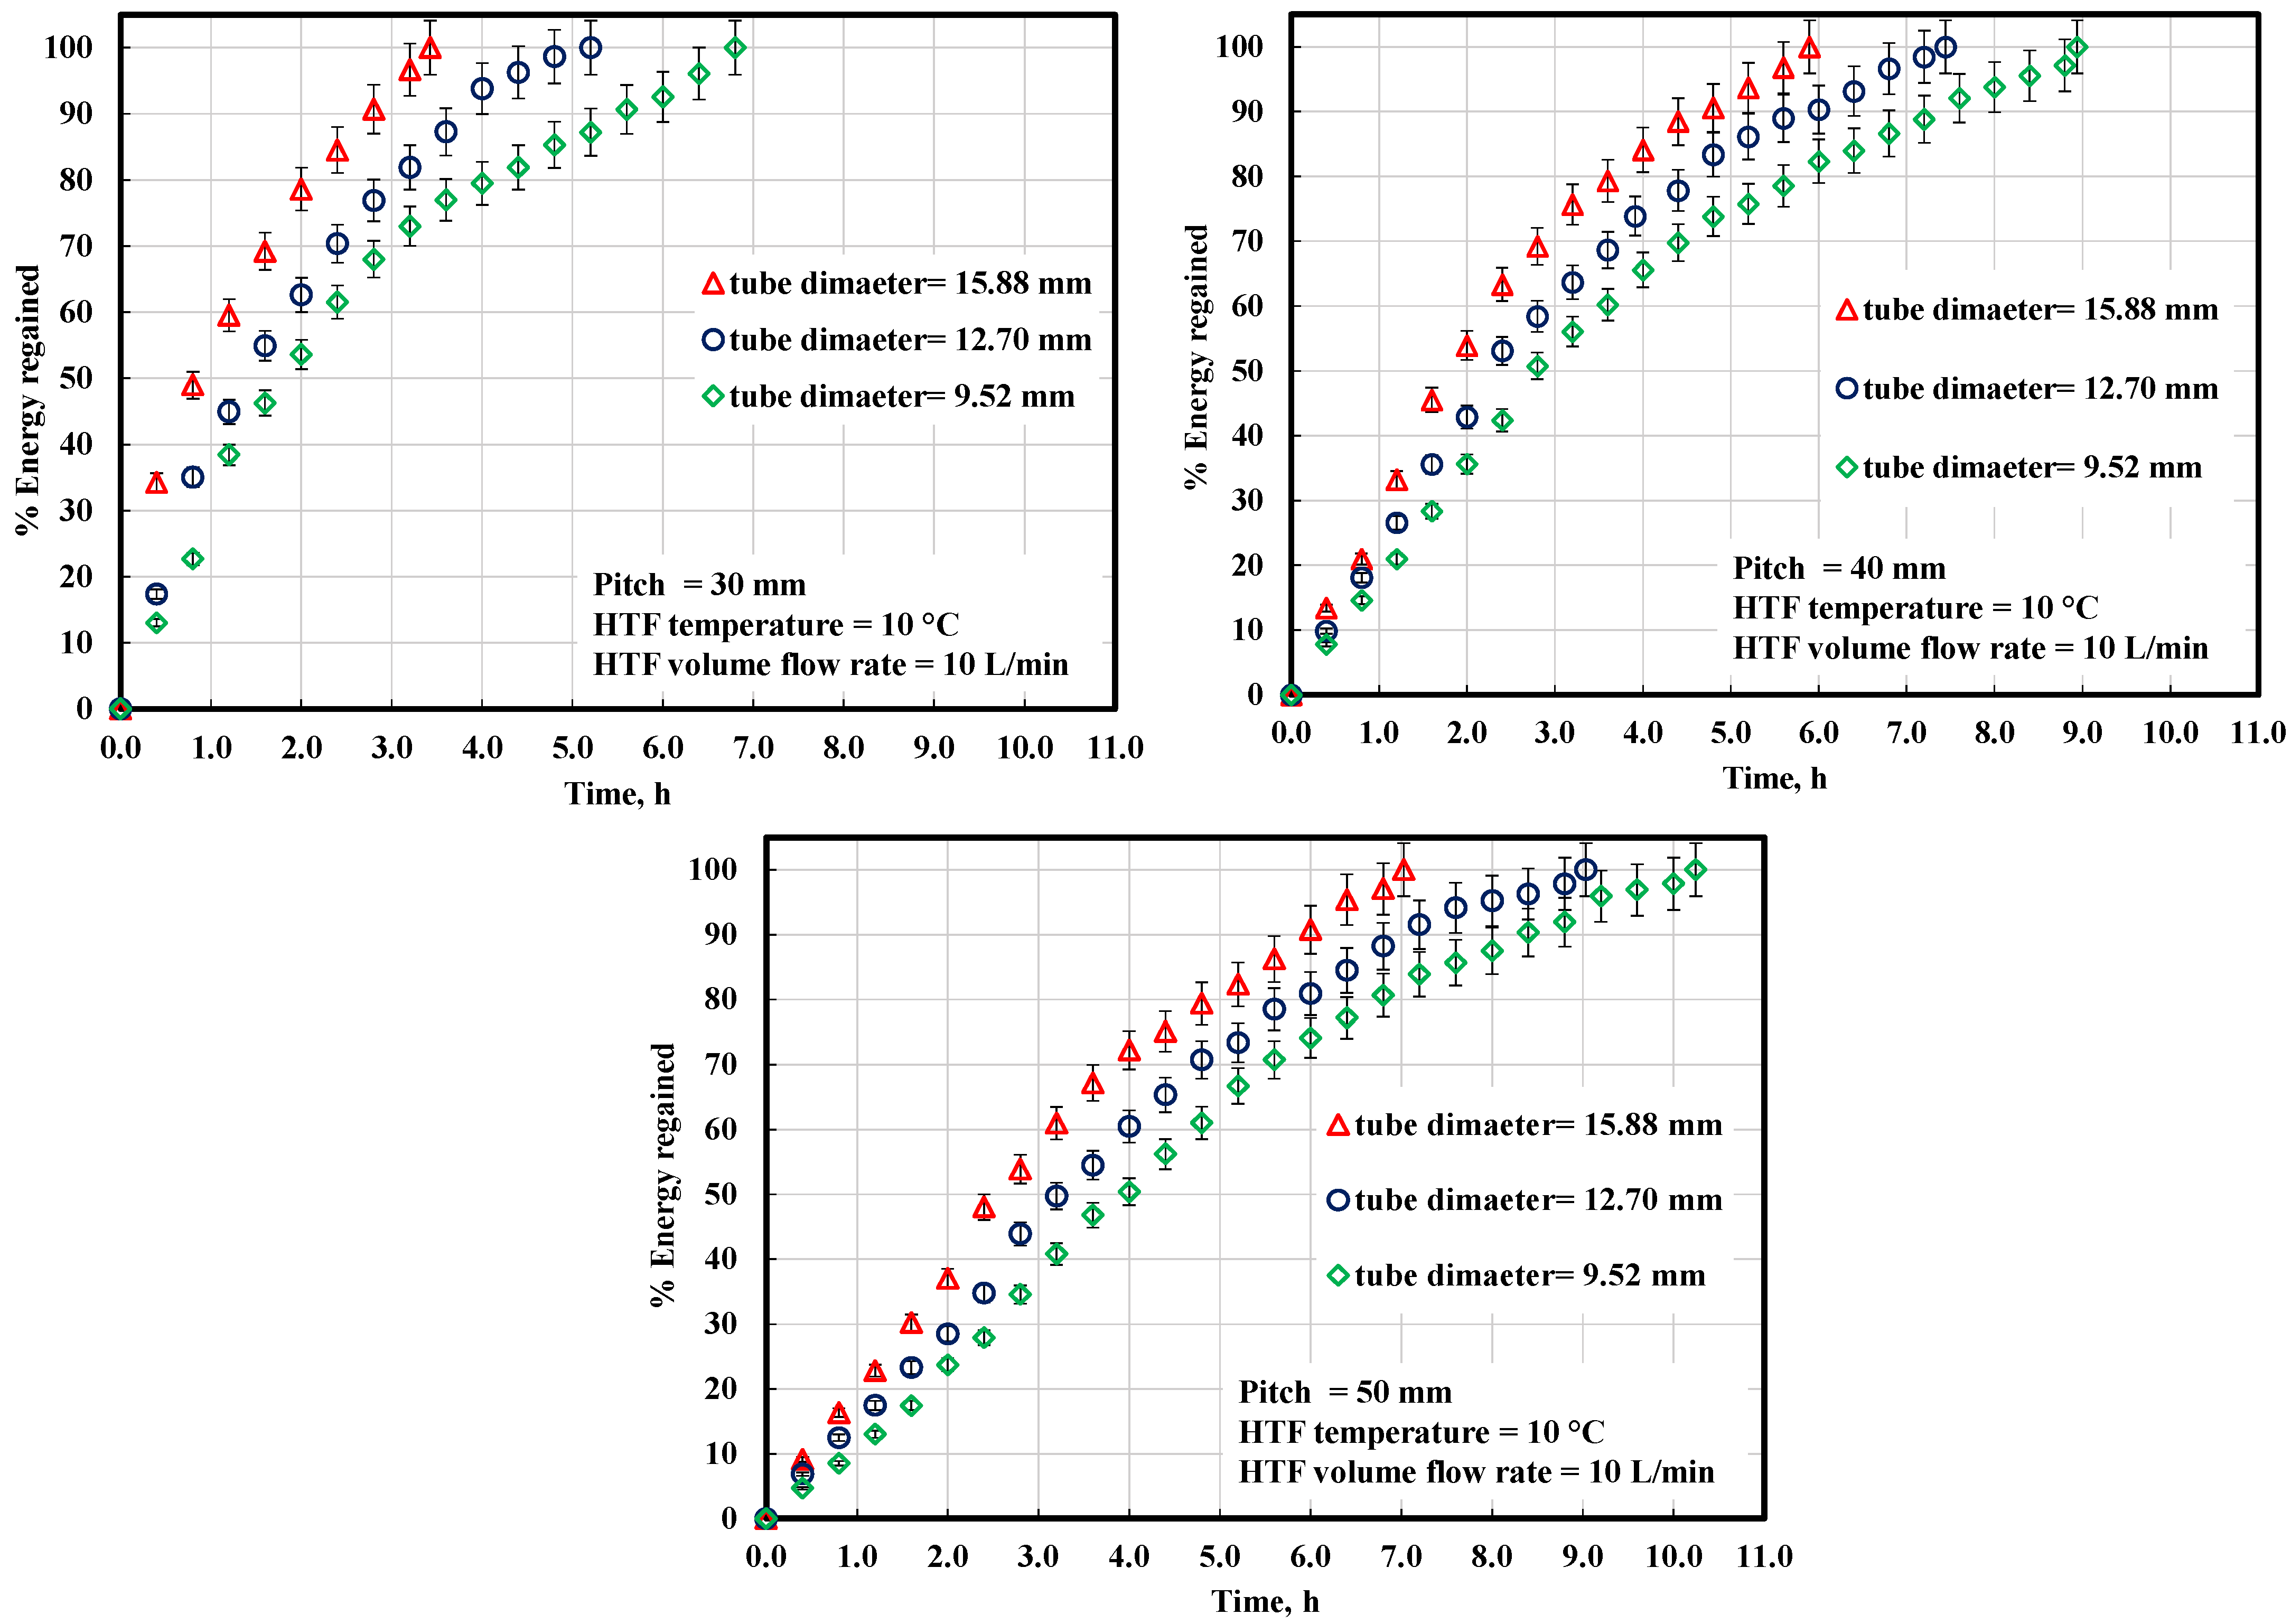
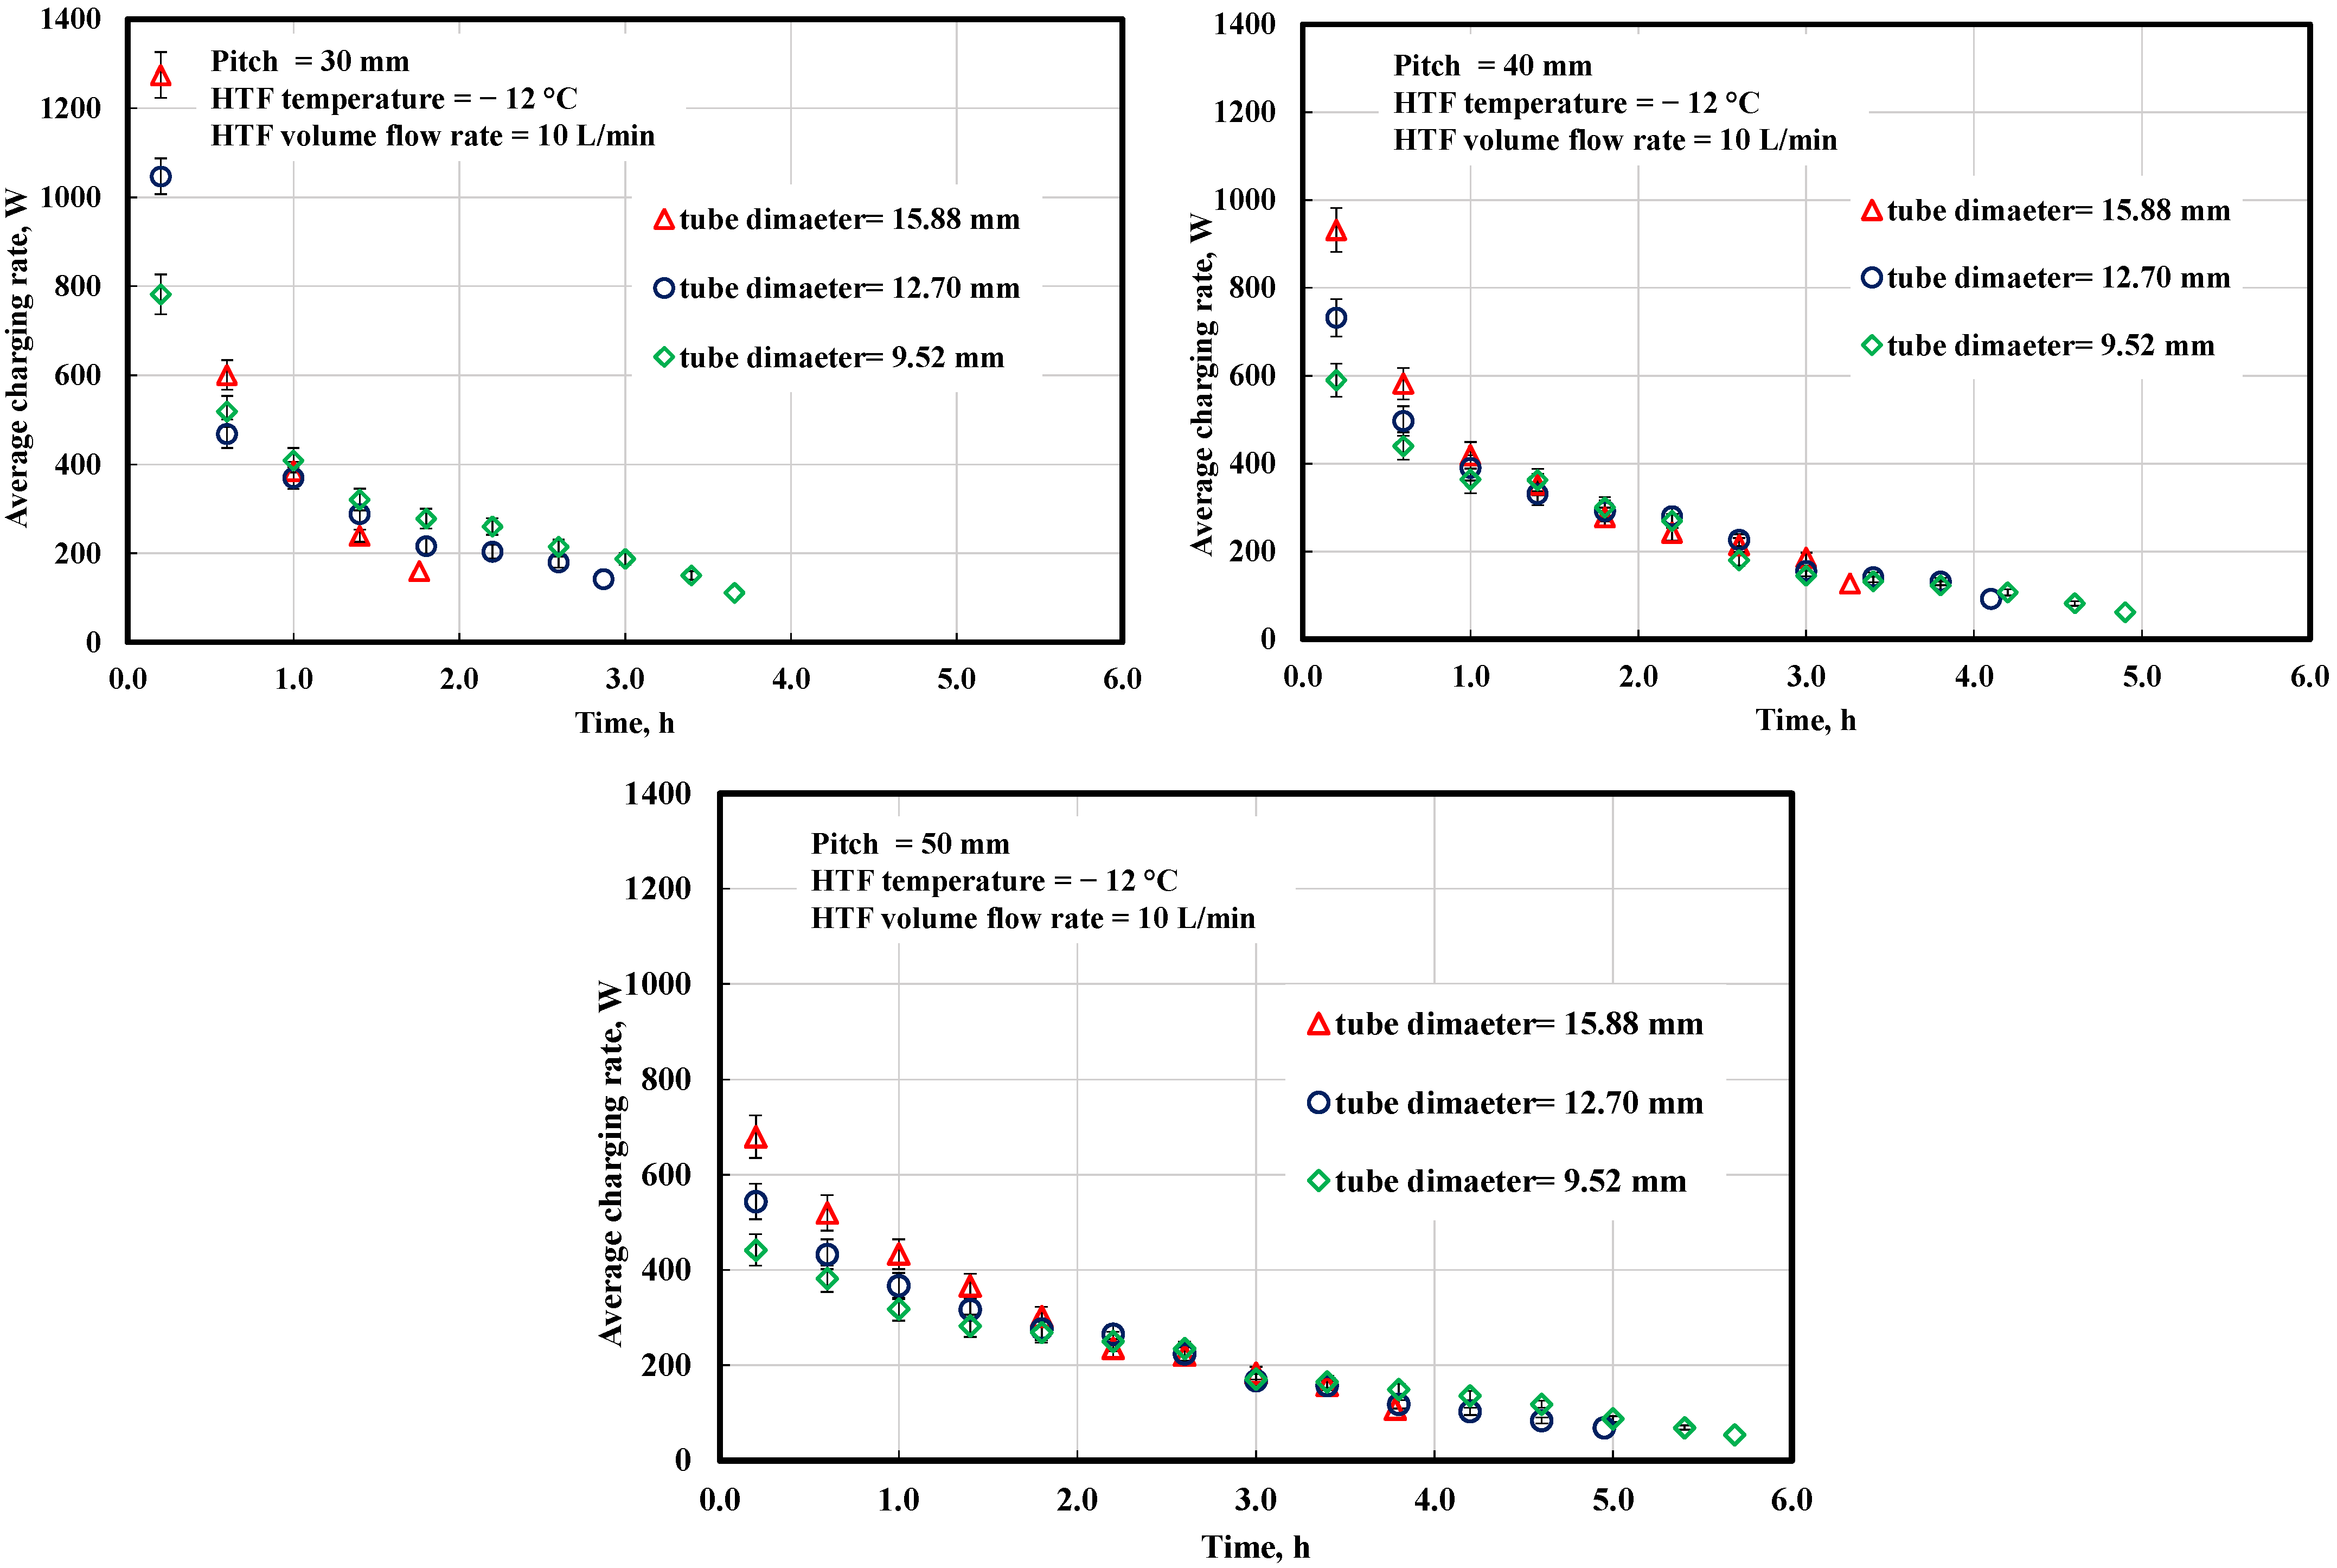
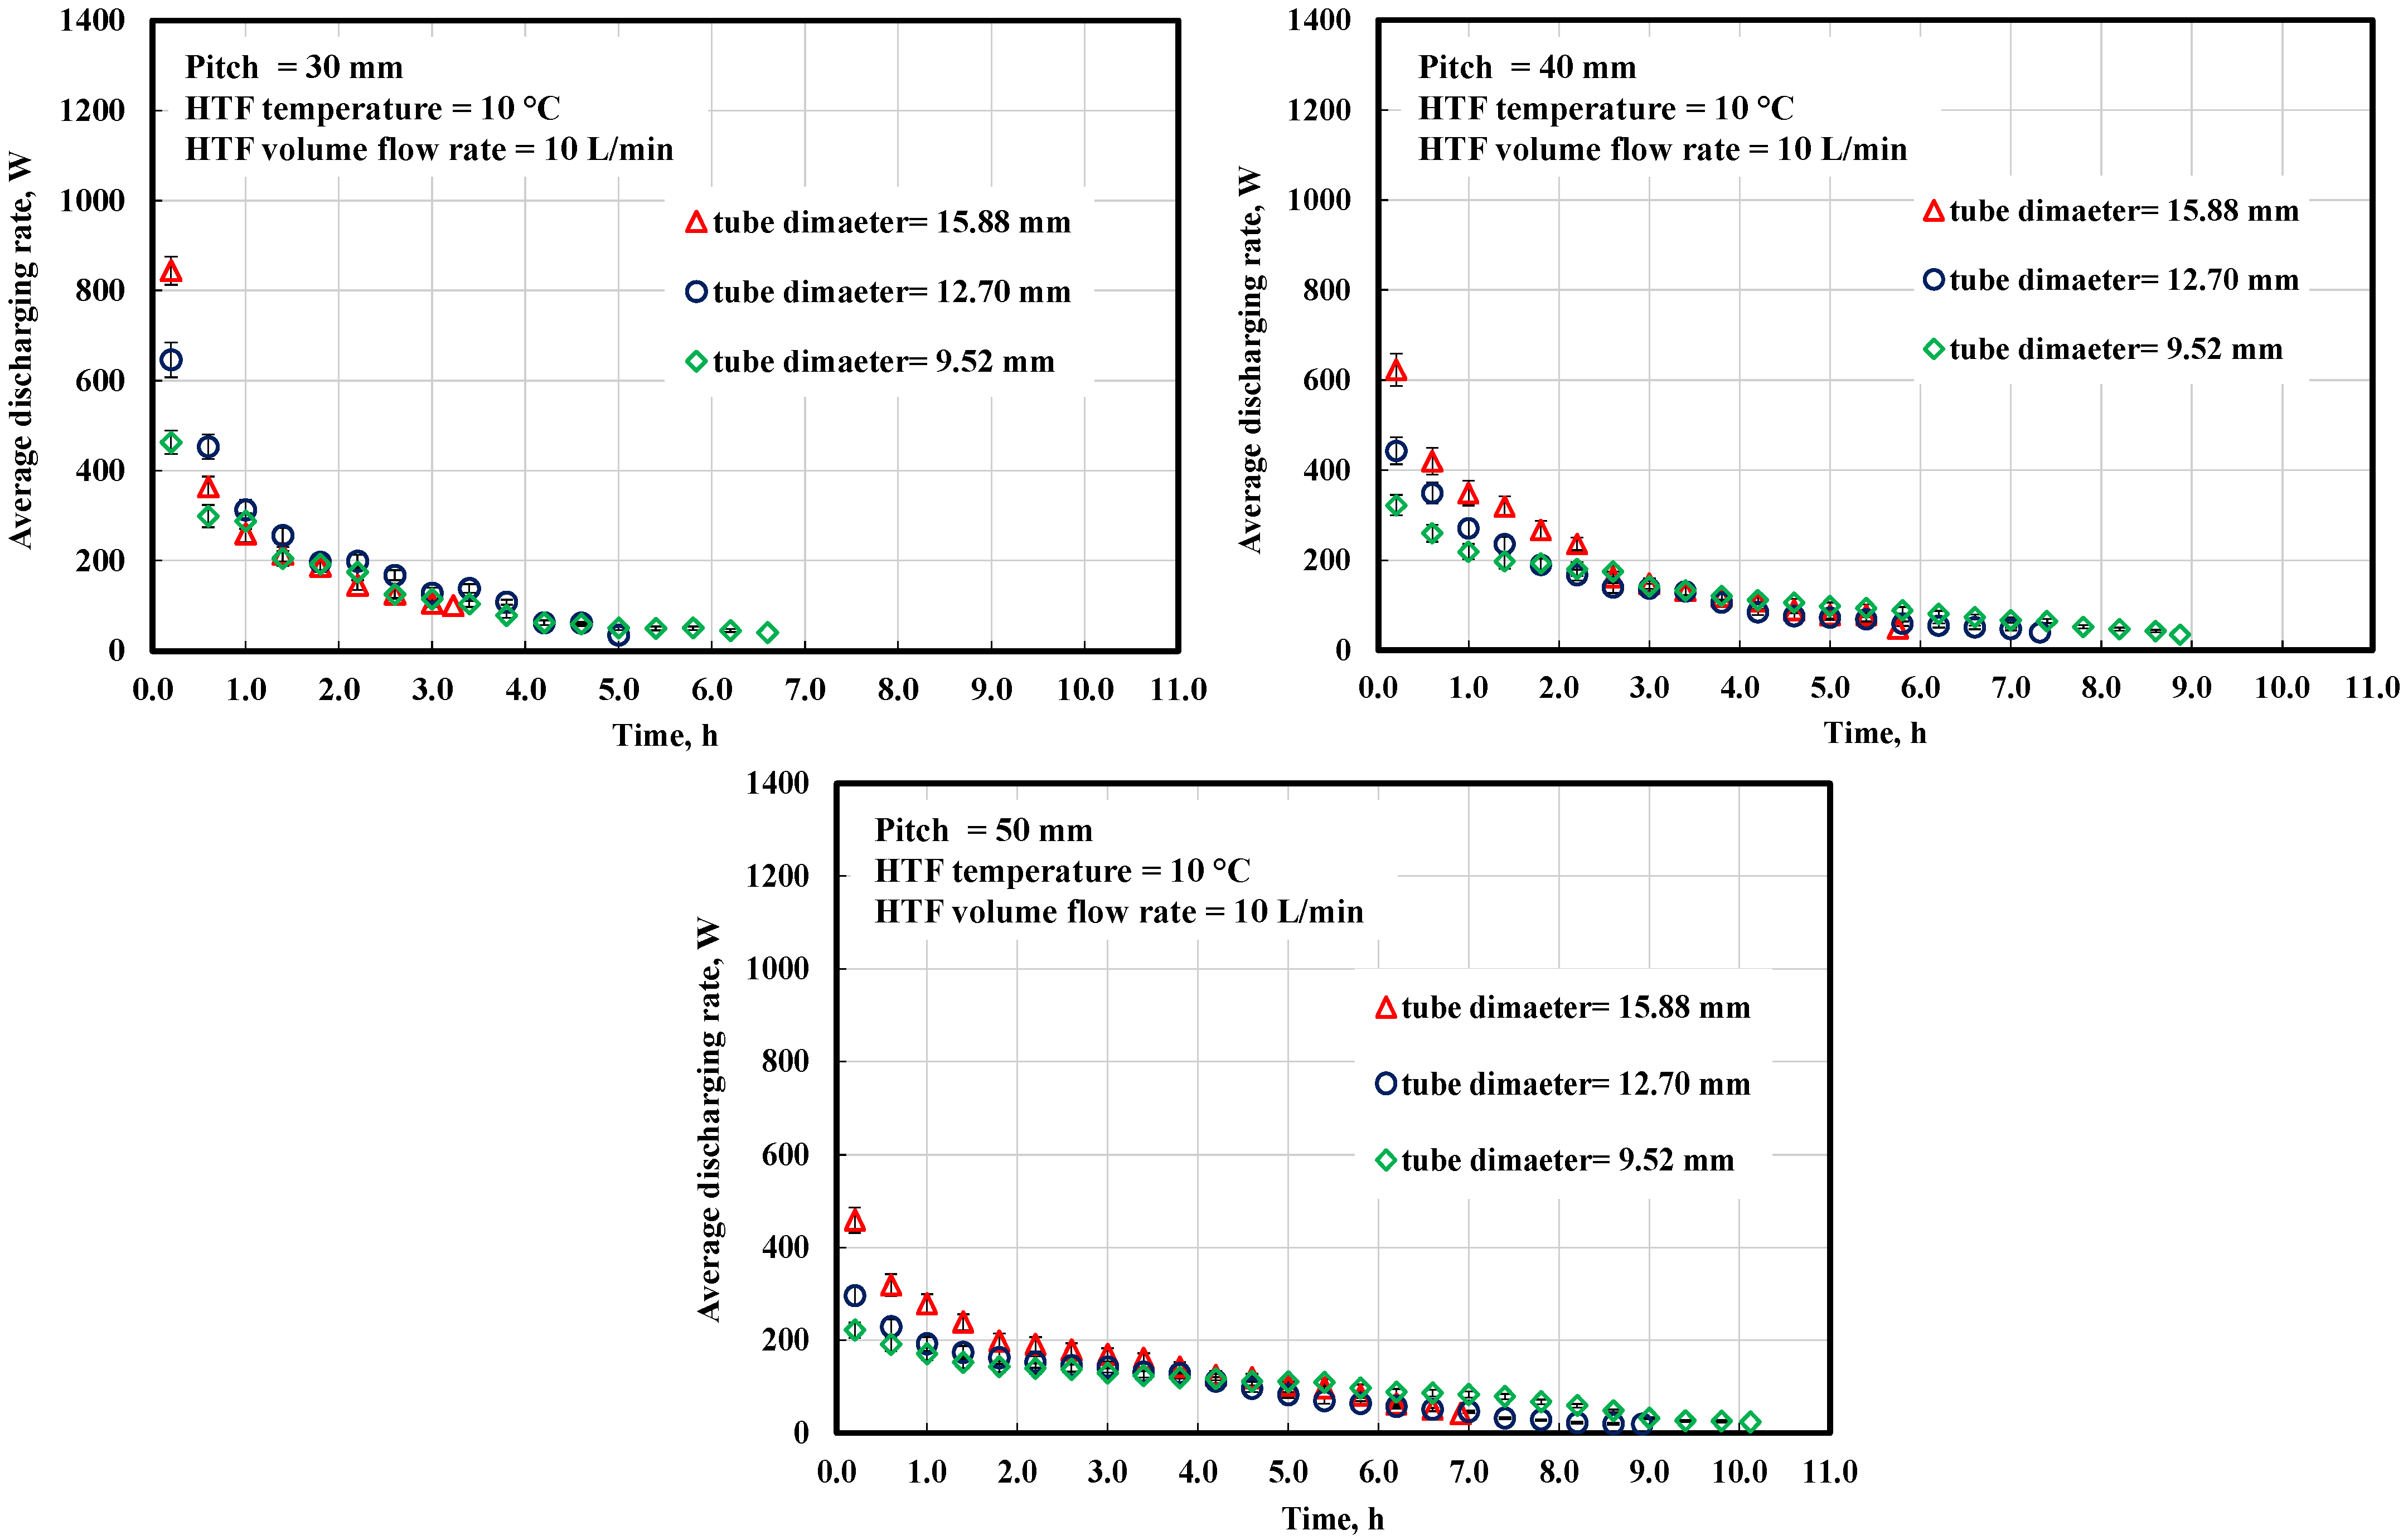
3.1. Effect of Coil Pitch

Throughout the charging procedure, the ice formation exists around the TCHC, during which heat is transmitted to cold HTF from water. During all experiments, the temperatures are instantaneously measured in the radiating path at mid-plan of the TCHC; then, the solidified mass fraction and percentage of energy stored are computed instantaneously across the storage tank. This is employed to imply the twin coil thermal performance throughout the charging process for all studied geometrical/operating parameters. Figure 3 demonstrates the percentage of energy stored during charging against time for various pitches at three tube diameters. The figure indicates that the energy saved percentage trend is the same for all studied pitches, with a nearly linear curve for the first 50% of the charging process. It is noted that, as the pitch diminishes, the energy stored percentage curve becomes linear, which implies that the charging process becomes quicker. Furthermore, at pitch (P = 30 mm), the completed charging process takes half the needed time for pitch (P = 50 mm) with a large tube diameter. Therefore, it is advised that the chiller be turned off as soon as possible to save energy. Supercooling phenomena has no significant effect in the current study because the water is contained in a relatively large storage tank and the inlet coolant temperature is lower than the water nucleation temperature. The temperature profiles for temperature variation of the PCM in the storage tank with time during the charging process show an insignificant effect for supercooling in our study [16].
The effect of coil pitch on the energy regained percentage at a given tube diameter during the discharging process is shown graphically in Figure 4. The graph displays a profile similar to that seen during charging. However, this time, the detection rate is lower and the duration longer. This is because, as was said before, the water conductance layer with a lesser influence from natural convection in the contained water layer formed around the TCHC. With a decrease in tube diameter of 9.52 mm, the discharge duration rises by roughly 79% when the coil pitch goes from 30 to 50 mm (60%). However, when the tube diameter is just 15.88 mm, the discharge time is increased by 2.
The impact of coil pitch on the average charging amount against time for the three tube diameters is illustrated in Figure 5. The figure indicates that the average charging rate declines rapidly with time for the whole studied coil pitches. Furthermore, the small coil pitch with the highest coil tube diameter indicates the shortest total charging time, and its average charging rate is nearly linear. Furthermore, as the coil pitch decreases, the average charging rate decreases rapidly for a fixed tube diameter. The charging rates are noted to be higher, which reduces the charging times. This attributes to the high ice formation rate for small twin helical coil pitches.
The impact of coil pitch on the average discharging rate is exemplified in Figure 6. It can be observed that the average discharging rate declines rapidly with time (first 60% of the discharging process) for all studied coil pitches. Afterward, it continues nearly constant for all studied pitches. In addition, as the coil pitch improves, the average discharging rate decreases for the fixed tube diameter. The discharging rates are observed to be small when matched to the charging process, indicating that higher discharging times are accomplished. The ice movement is slow due to the pitch effect described previously.

3.2. Effect of Tube Diameter

One of the main geometrical parameters in this work is the impact of the tube diameter of the TCHC throughout the charging and discharging processes. Three tube diameters are investigated.
Figure 7 shows the relative percentage of energy gained during charging against charging time for a range of tube sizes (9.52 mm, 12.70 mm, and 15.88 mm). For short pitches (P = 30 mm), the figure shows that the trend of the percentage of energy conserved is similar across all tested diameters. The liquid layer thickness becomes thicker with time during the charging process, and a smaller amount of heat is transferred by the conduction dominant mode. Therefore, the melting is considered constrained. Further, there is a convection mode driven by heat flux from the coil wall and this convection induces thermal instability. Due to the presence of this thermal instability, the melting is considered constrained. Increases in coil tube diameter result in a higher percentage of energy stored and a quicker charging time. In addition, the trends for the second two pitches (P = 40 mm and P = 50 mm) are consistent across all coil tube diameters investigated. Linear patterns may be seen in the first half of the charging period. For all tube diameters at both examined pitches, the curve flattens out after charging is complete, demonstrating that the rate at which energy is stored grows linearly. In addition, the coil tube diameter has a negligible impact on the coil pitch; therefore, the overall charging time is decreased when the coil tube diameter is increased. As a result, it is advised that the chiller be turned off as soon as possible to save energy consumption when the coil tube diameter and pitch are both high.
Figure 8 depicts the percentage of energy recovered during discharging as a function of operation time for a range of tube diameters. The graphic demonstrates that across all tested pitches, there is a consistent upward trend in the proportion of acquired energy over all three diameters. For modest coil pitches (P = 30 mm), the discharging process speeds up as the coil tube diameter grows, reducing the time needed for 100% energy obtained. For larger diameter coil tubes and smaller pitches, the trend seems linear, suggesting that the rate at which energy is recovered increases linearly until full discharge occurs. Due to the shorter discharge period, the chiller should be shut off as soon as possible to prevent wasteful energy use.
Figure 9 displays the effect of the coil tube diameter on the average charging rate versus time for the three investigated coil pitches. For the largest coil tube diameter, it has been shown that the average charging rate decreases rapidly with time, particularly for the smallest pitch. All coil tube diameters exhibit essentially the same behavior. Further, when coil tube diameter increases, charging time decreases. This is because a larger diameter coil tube provides a larger surface area for transferring heat and, hence, a greater effect. Figure 10 shows the effect of coil tube diameter on the average discharging rate against time. For all coil tube diameters examined, the average discharging rate drops sharply after the first 60% of the discharging process. After then, the typical rate of discharge remains almost the same. The time needed to discharge also decreases as the coil tube diameter increases. This is because an increase in coil tube diameter increases the surface area for heat transmission.

4. Conclusions

The current work presented an experimental work on the novel TCHC to augment the performance of ice storage systems to be applied in air conditioning applications. Two main parameters are presented in this work: twin coil pitch and coil tube diameter. The heat transfer fluid (HTF) operating parameters (the HTF inlet temperature and flow rate) throughout charging and discharging are constant in studying the influence of the previous parameters. This study investigates the thermal performance of cool thermal energy storage (CTES) systems for various geometrical parameters through the water charging and discharging processes of ice inside a storage tank containing TCHC.
The experimental outcomes disclosed that the complete solidification process needs a shorter time as the coil pitch decreases for the interval of the charging process. The solidification time was lowered by about 24 and 34% when the pitch was reduced from 50 mm to 40 mm and 30 mm, respectively. Furthermore, as the tube diameter increases from 9.52 mm to 15.88 mm (68% increase in diameter), the complete solidification needs half the time (time reduced to 50%) to be achieved for small pitches (30 mm).
The results disclosed that the melting period required for complete melting increased by about 80% compared with the needed time in the charging process. This can be attributed to the constraint of both coil tube diameter and pitch effect.

Author Contributions

Conceptualization, H.A.R., A.S.A.A., A.A.A.-A., M.F.A.R. and H.E.A.; Data curation, H.E.A.; Formal analysis, H.A.R. and A.A.A.-A.; Methodology, A.S.A.A., A.A.A.-A. and H.E.A.; Resources, A.S.A.A. and A.A.A.-A.; Supervision, A.A.A.-A. and M.F.A.R.; Validation, H.E.A.; Visualization, H.A.R., A.S.A.A. and H.E.A.; Writing—original draft, H.A.R., A.S.A.A. and H.E.A.; Writing—review and editing, H.A.R. All authors have read and agreed to the published version of the manuscript.

Funding

This research has no fund.

Conflicts of Interest

The authors declare no conflict of interest.

Nomenclature

c i Ice specific heatJ/kg.°C
c w Water specific heatJ/kg.°C
d t , o Test tube outer diameterm
H f u s Water latent heat of fusionJ/kg
m m Distilled water melted masskg
m o PCM total stored mass in the tank
m s Solidified mass of the PCMkg
kg
NNumber of coil turns-
pPitch of the TCHC-
-
m
Q r e g Accumulative thermal energy regainedW
Q reg , max Max thermal energy regainedW
Q r e g Accumulative thermal energy regained difference J
% Q reg Q reg Q reg , max × 100 J
Q s t Accumulative thermal energy storedJ
% Q st Q st Q st , max × 100
Q st , max Max thermal energy storedJ
Q s t Accumulative thermal energy stored differenceJ
R c o i l , c Coil centerline radiusm
R c o i l , i Coil inner radiusm
R c o i l , o Coil outer radiusm
r 1 Radius of the solid–liquid interface at the left side of the inner coil of TCHCm
r 2 Radius of the solid–liquid interface at the right side of the inner coil of TCHCm
r 3 Radius of the solid–liquid interface on the left side of the outer coil of TCHCm
r 4 Solid–liquid interface radius m
The right side of the outer coil of TCHC
r t , o Outer radius of the test tubem
t a v g Solid–liquid average thicknessInterface around the TCHCm
°C
T HTF Heat transfer fluid temperature°C
T l Liquid phase temperature °C
T o Initial temperature°C
T pc Phase change temperature°C
T s Solid phase temperature°C
V m PCM melted volumem3
V o Stored PCM total volume m3
V s Solidified volume of the PCMm3
τ Time intervals
Greek symbols
ρ i Ice densitykg/m3
ρ w Water densitykg/m3
ρ w / ρ i Volume correction factor-
τ Times
Abbreviations
CTESCool thermal energy storage
DTCDigital temperature controller
HTFHeat transfer fluid
L/minLiter/min
PCMPhase change material
TCHCTwin concentric helical coil

References

  1. Habeebullah, B.A. An experimental study on ice formation around horizontal long tubes. Int. J. Refrig. 2007, 30, 789–797. [Google Scholar] [CrossRef]
  2. Sait, H.; Selim, A. Charging and discharging characteristics of cool thermal energy storage system with horizontal pipes using water as phase change material. Energy Convers. Manag. 2014, 77, 755–762. [Google Scholar] [CrossRef]
  3. Fanga, Y.; Xub, H.; Miaob, Y.; Baib, Z.; Niua, J.; Deng, S. Experimental study of storage capacity and discharging rate of latent heat thermal energy storage units. Appl. Energy 2020, 275, 115325. [Google Scholar] [CrossRef]
  4. López-Navarro, A.; Biosca-Taronger, J.; Torregrosa-Jaime, B.; Corberán, J.M.; Bote-García, J.L.; Payá, J. Experimental investi-gations on the influence of ice floating in an internal melt ice-on-coil tank. Energy Build. 2013, 57, 20–25. [Google Scholar] [CrossRef] [Green Version]
  5. Sait, H.H. Experimental study of water solidification phenomenon for ice-on-coil thermal energy storage application utilizing falling film. Appl. Therm. Eng. 2018, 146, 135–145. [Google Scholar] [CrossRef]
  6. Xie, J.; Yuan, C. Parametric study of ice thermal storage system with thin layer ring by Taguchi method. Appl. Therm. Eng. 2016, 98, 246–255. [Google Scholar] [CrossRef] [Green Version]
  7. Bai, Q.; Guo, Z.; Cui, X.; Yang, X.; Yanhua, L.; Jin, L.; Sun, Y. Experimental investigation on the solidification rate of water in open-cell metal foam with copper fins. Energy Procedia 2018, 152, 210–214. [Google Scholar] [CrossRef]
  8. Jannesari, H.; Abdollahi, N. Experimental and numerical study of thin ring and annular fin effects on improving the ice formation in ice-on-coil thermal storage systems. Appl. Energy 2017, 189, 369–384. [Google Scholar] [CrossRef]
  9. Gasia, J.; de Gracia, A.; Zsembinszki, G.; Cabeza, L.F. Influence of the storage period between charge and discharge in a latent heat thermal energy storage system working under partial load operating conditions. Appl. Energy 2018, 235, 1389–1399. [Google Scholar] [CrossRef]
  10. Ezan, A.; Erek, M.A. Solidification and Melting Periods of an Ice-on-Coil Latent Heat Thermal Energy Storage System. ASME. J. Heat Transfer. 2012, 134, 062301. [Google Scholar] [CrossRef]
  11. ElGhnam, R.I.; Abdelaziz, R.A.; Sakr, M.H.; Abdelrhman, H.E. An experimental study of freezing and melting of water inside spherical capsules used in thermal energy storage systems. Ain Shams Eng. J. 2012, 3, 33–48. [Google Scholar] [CrossRef] [Green Version]
  12. Prabakaran, R.; Kumar, J.P.N.; Lal, D.M.; Selvam, C.; Harish, S. Constrained melting of graphene-based phase change nanocomposites inside a sphere. J. Therm. Anal. 2019, 139, 941–952. [Google Scholar] [CrossRef]
  13. Li, Y.; Yan, Z.; Yang, C.; Guo, B.; Yuan, H.; Zhao, J.; Mei, N. Study of a Coil Heat Exchanger with an Ice Storage System. Energies 2017, 10, 1982. [Google Scholar] [CrossRef] [Green Version]
  14. Mahdi, M.S.; Mahood, H.B.; Campbell, A.N.; Khadom, A.A. Experimental study on the melting behavior of a phase change material in a conical coil latent heat thermal energy storage unit. Appl. Therm. Eng. 2019, 175, 114684. [Google Scholar] [CrossRef]
  15. Naphon, P. Thermal performance and pressure drop of the helical-coil heat exchangers with and without helically crimped fins. Int. Commun. Heat Mass Transf. 2007, 34, 321–330. [Google Scholar] [CrossRef]
  16. Abdelrahman, H.; Refaey, H.; Alotaibi, A.; Abdel-Aziz, A.A.A.; Rabbo, M.A. Experimental investigations on the thermal performance of an ice storage system using twin concentric helical coil. Appl. Therm. Eng. 2020, 179, 115737. [Google Scholar] [CrossRef]
  17. Hamzeh, H.A.; Miansari, M. Numerical study of tube arrangement and fin effects on improving the ice formation in ice-on-coil thermal storage systems. Int. Commun. Heat Mass Transf. 2020, 113, 104520. [Google Scholar] [CrossRef]
  18. Sathishkumar, A.; Cheralathan, M. Charging and discharging processes of low capacity nano-PCM based cool thermal energy storage system: An experimental study. Energy 2023, 263, 125700. [Google Scholar] [CrossRef]
  19. Sidney, S.; Dhasan, M.L.; C., S.; Harish, S. Experimental Investigation of Freezing and Melting Characteristics of Graphene-Based Phase Change Nanocomposite for Cold Thermal Energy Storage Applications. Appl. Sci. 2019, 9, 1099. [Google Scholar] [CrossRef] [Green Version]
  20. Dogkas, G.; Koukou, M.K.; Konstantaras, J.; Pagkalos, C.; Lymperis, K.; Stathopoulos, V.; Coelho, L.; Rebola, A.; Vrachopoulos, M.G. Investigating the performance of a thermal energy storage unit with paraffin as phase change material, targeting buildings’ cooling needs: An experimental approach. Int. J. Thermofluids 2020, 3–4, 100027. [Google Scholar] [CrossRef]
  21. Al-Mudhafar, A.H.N.; Nowakowski, A.F.; Nicolleau, F.C. Performance enhancement of PCM latent heat thermal energy storage system utilizing a modified webbed tube heat exchanger. Energy Rep. 2020, 6, 76–85. [Google Scholar] [CrossRef]
  22. Mahdi, M.S.; Mahood, H.B.; Mahdi, J.M.; Khadom, A.A.; Campbell, A.N. Improved PCM melting in a thermal energy storage system of double-pipe helical-coil tube. Energy Convers. Manag. 2019, 203, 112238. [Google Scholar] [CrossRef]
  23. Incropera, F.P.; Dewitt, D.P. Fundamental of Heat and Mass Transfer, 4th ed.; John Wiley & Sons: New York, NY, USA, 1996. [Google Scholar]
  24. Moffat, R.J. Describing the uncertainties in experimental results. Exp. Therm. Fluid Sci. 1988, 1, 3–17. [Google Scholar] [CrossRef]
Figure 1. Experimental setup. (a) Schematic illustration. (b) Experimental test rig photo [16]. (c) Sample of charging experimental results. (d) Sample of discharging experimental results at certain time slots.
Applsci 12 11047 g001
Figure 2. Positions of thermocouples on the horizontal plane at the mid-turn of TCHC [16].
Applsci 12 11047 g002
Figure 3. Percentage of energy stored with time for different coil pitches with coil tube diameters during the charging process.
Applsci 12 11047 g003
Figure 4. Percentage of energy regained with time for different coil pitches with coil tube diameters during discharging process.
Applsci 12 11047 g004
Figure 5. Average charging rate with time for different coil pitches with coil tube diameters during the charging process.
Applsci 12 11047 g005
Figure 6. Average discharging rate with time for different coil pitches with coil tube diameters during the discharging process.
Applsci 12 11047 g006
Figure 7. Effect of tube diameters on the energy stored percentage versus time using three pitches during the charging process.
Applsci 12 11047 g007
Figure 8. Effect of tube diameters on the energy regained percentage versus time using three pitches during the discharging process.
Applsci 12 11047 g008
Figure 9. Average charging rate versus time using various tube diameters with different pitches during the charging process.
Applsci 12 11047 g009
Figure 10. Average discharging rate versus time using various tube diameters with different pitches during the discharging process.
Applsci 12 11047 g010
Table 1. Merits/demerits of different shaped coils used in CTES.
ReferenceUsed CoilType of StudyMerits Demerits
[4]Thirty-four counter current spiral-shaped tubesExperimentalThe use of spiral-shaped coils induces centrifugal forces in the HTF, which have a stabilizing effect on the flowIce cracking is random but follows a specific pattern. When ice begins to crack, it floats, and the heat transfer fluid that returns from the top coils, where most of the ice is gathered, tends to diminish. In contrast, heat transfer fluid in lower coils tends to rise more quickly.
[8]Thin rings and annular fins
around coils
Experimental
And
Numerical
- Results for the case of annular fins demonstrate that the optimal operating point is calculated at a spacing of 50 mm between two neighboring fins.
- The ice production would be 21% and 34% greater when annular fins and rings are used compared with the bare tube.
- Most ice forms when diagonal rings are used, and more ice forms while using the tube with fins.
The effect of annular fin spacing is quantified. More fins increase the contact surface area, which speeds up heat transfer. As the number of fins grows, more phase change materials near the tube surface will be replaced by low-heat capacity fin materials, reducing the cold storage available.
[10]The coil has a counterflowing staggered pipe configuration with an Archimedean spiral shape.Experimental
And
Numerical
The interface measuring approach may monitor solid–liquid interface fluctuations in big, closed storage tanks.An external melting mode may provide lower output temperatures for longer than an internal melting mode.
[14]Conical coil and normal coil (Helical coil)Experimental- Conical coil melting rate was 28.32% higher than conventional coil at 80 °C HTF intake temperature. Conical coils store energy more quickly than normal coils.
- Faster energy storage with conical coil storage compared with regular storage.
- The conical coil form was suitable for heat transmission since its base is wider than its peak.
[14]
Table 2. Experimental setup specifications.
ItemDescription
Ice storage tankAcrylic “Insulated”
Inner diameter = 250.8 mm
Height = 350 mm
Thickness = 6 mm
Twin-Centric Helical Coils (TCHC)Geometrical parameters are described in Table 3
Charging reservoir45 L capacity
Discharging reservoir45 L capacity
Charging temperature, °C−12
Discharging temperature, °C10
HTF volume flow rate, L/min10
Digital Temperature Controller (DTC)Temperature control, with a set point differential of ±1 °C
Table 3. Geometrical parameters of the twin-centric helical coils.
DescriptionInner CoilOuter Coil
Outer tube diameter ( d t , o ), mm9.52, 12.70, 15.88
Centerline radius ( R c o i l , c ), mm29.7692.46
Pitch (p), mm304050304050
No. of turns (N)6.67546.6754
Table 4. Properties of the distilled water (PCM) from Incropera 1996 [23].
PropertyWater at 0 °CIce at 0 °C
Density, kg/m3 ρ w = 1000 ρ i = 920
Specific heat, J/kg.°C c w = 4230 c i = 2040
Fusion latent heat, J/kg H f u s = 333.7 × 10³
Table 5. The main parameters’ average uncertainties.
Parameter Uncertainty   ( ω )
m s m o   or   m m m o , (-)±2.7%
Q st   or   Q reg , (%)±4.1%
Q ˙ ch   or   Q ˙ dis , (W)±8.6%
Publisher’s Note: MDPI stays neutral with regard to jurisdictional claims in published maps and institutional affiliations.

