3.1. Solid-Liquid Partition Experiment
In this experiment, the aqueous and non-aqueous liquids were not separated; as such, the amount of hexadecane retrieved from the liquid phase accounts for the dissolved and NAPL forms of this compound. Considering the physical-chemical properties of hexadecane, i.e., low water solubility (9.0 × 10
−4 mg/L at 20 °C), low vapour pressure (1.9 × 10
−1 Pa at 20 °C) and predicted log Kow = 8.6 and Koc = 2.9 × 10
3 L/kg [
48], adsorption to the organic carbon in soil can be mainly expected to occur.
The mass of hexadecane recovered from the solid and liquid (aqueous and non-aqueous) phases, relativel to the different amounts added, are shown in
supplementary material (Figure S1). More than 61% of the hexadecane added was retrieved from the solid phase, while only 1 to 4% was quantified in the liquid phase (
Table 4), showing that this compound mostly adsorbed soil particles for all the concentrations tested. Total hexadecane recovery, calculated by the sum of the mass obtained from both solid and liquid phases, ranged from 64% to 109% (
Table 4).
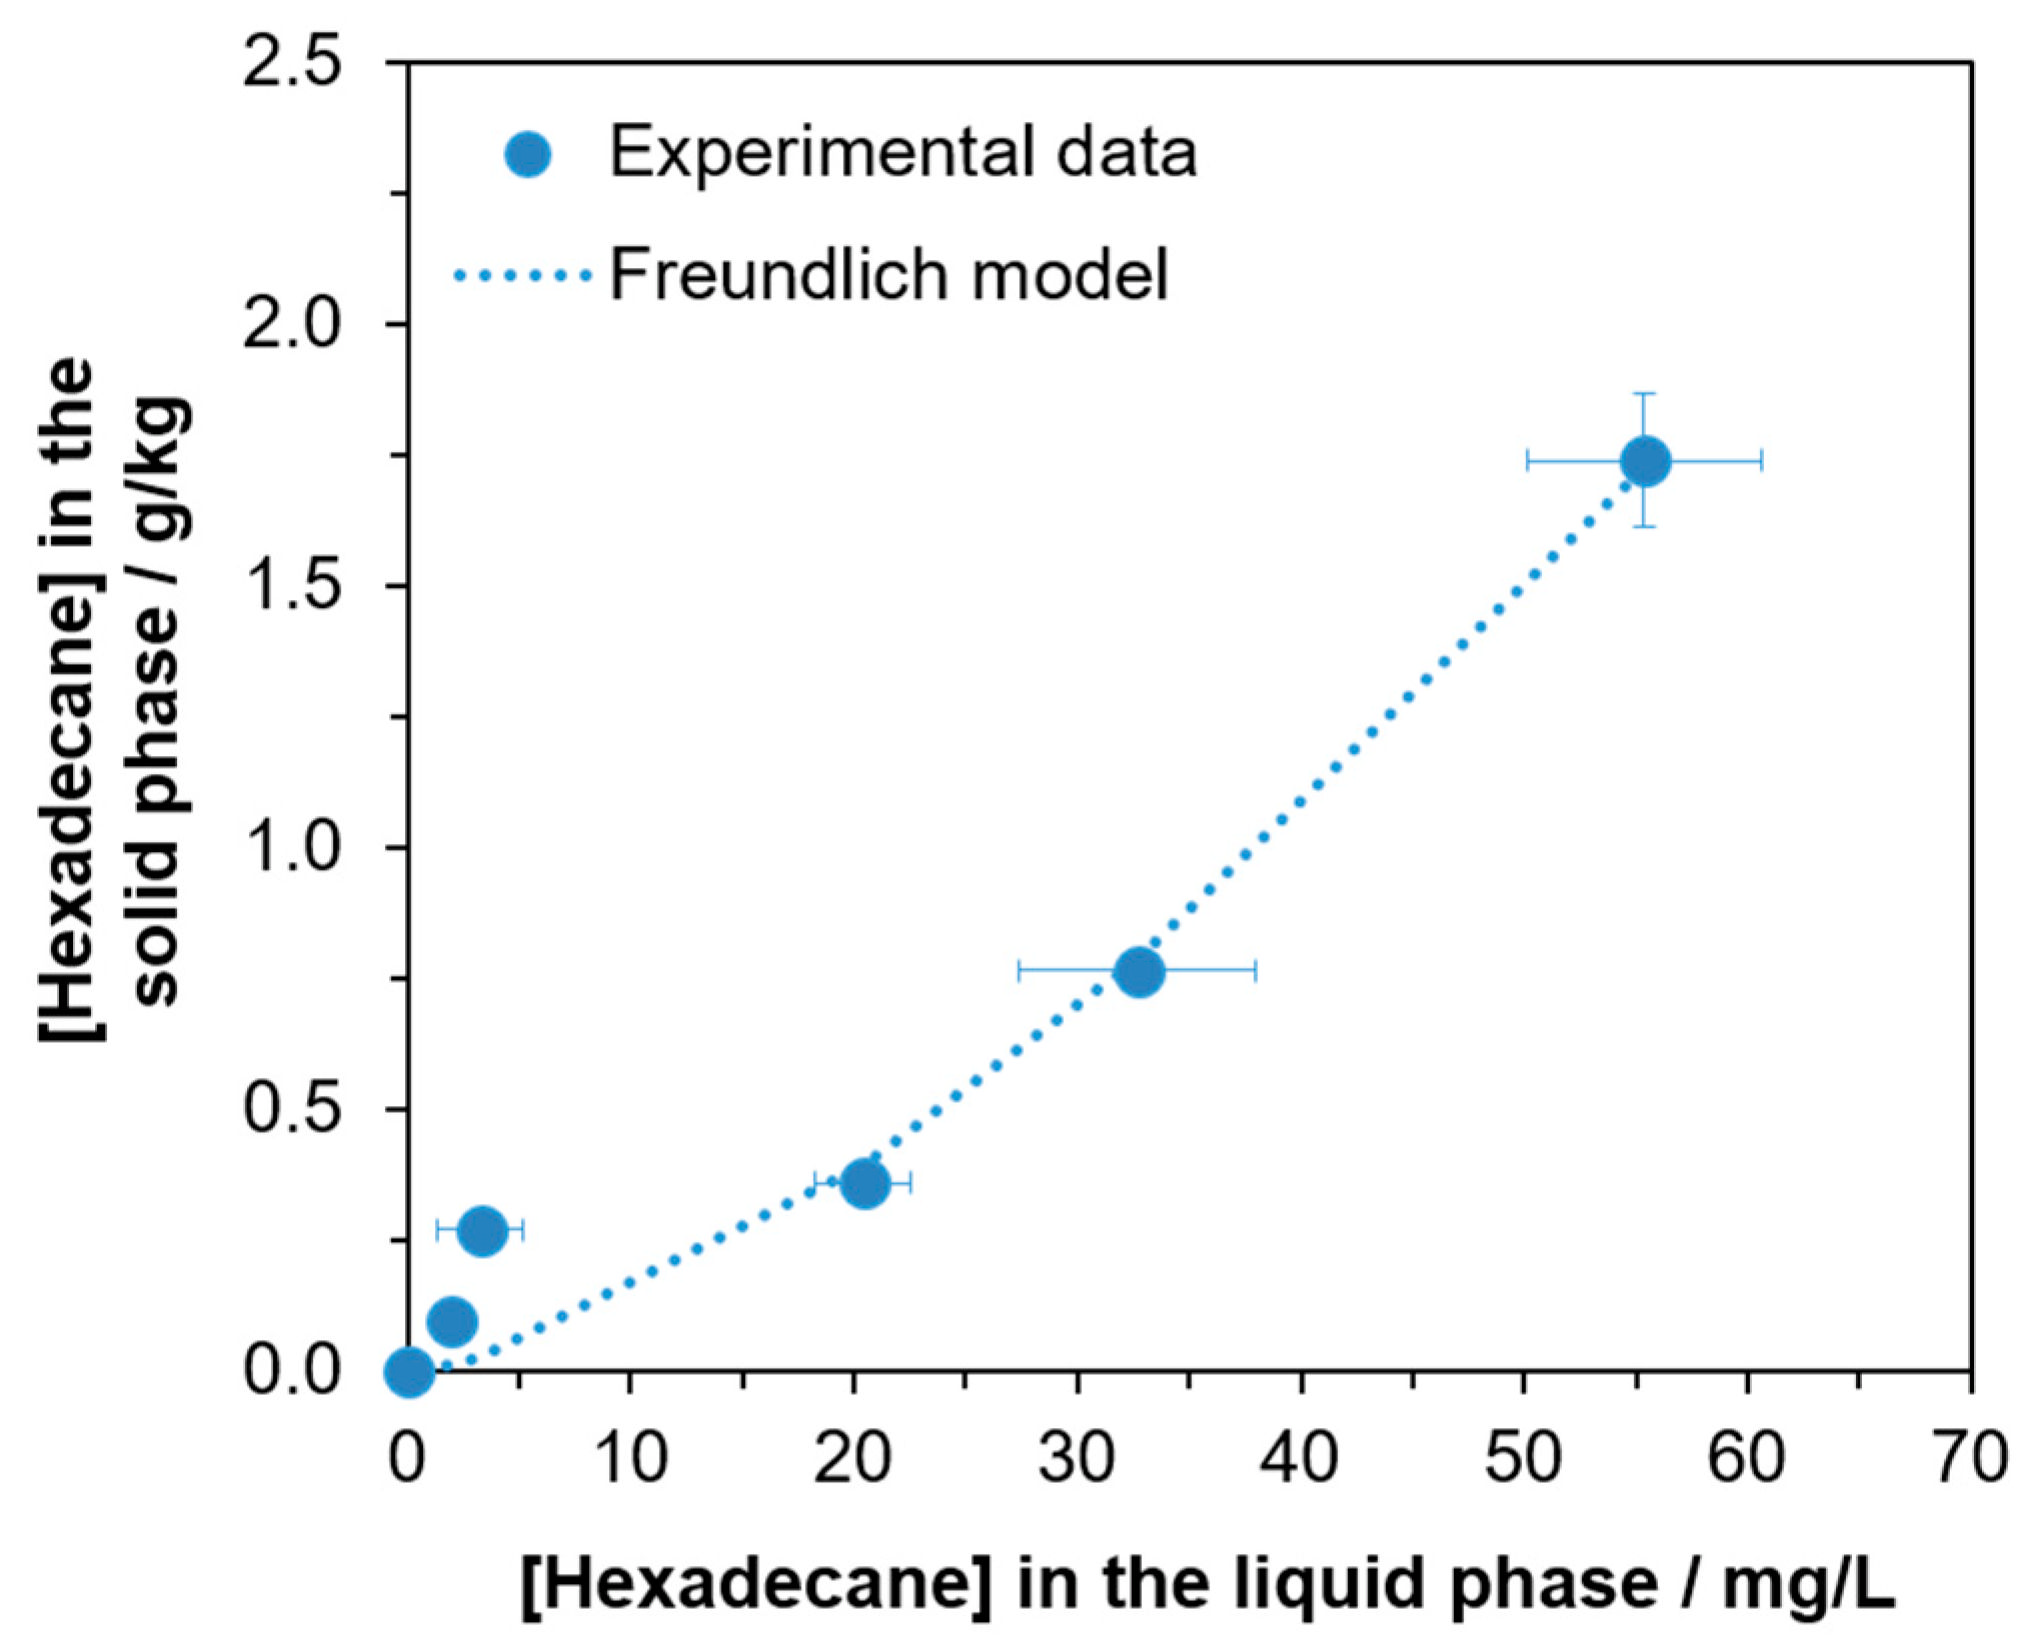
In
Figure 2, the distribution of hexadecane concentration between solid and liquid matrices is presented, highlighting once more the tendency of hexadecane for partitioning into the soil. The experimental results were adjusted to a Freundlich isotherm (Equation (2)) [
49]. This equation is used here to describe the distribution of hexadecane in the soil (solid phase) versus in the liquid (aqueous and non- aqueous) phase. In this experiment,
where
S is the hexadecane concentration adsorbed on the solid phase (g/kg),
C is the remained hexadecane concentration in the liquid (aqueous and non- aqueous phase) (g/L) and
Kf and n are constants, specific for the adsorbate and adsorbent at a given temperature. The obtained parameters were:
Kf = 0.004355 L/kg and
n = 0.6712, with a
R2 of 0.97. This correlation coefficient is satisfactory, suggesting that the Freundlich model can adequately describe hexadecane sorption characteristics.
The ratio between the concentration of hexadecane adsorbed in soil and remaining in the liquid phase increases with the increase of hexadecane concentration, resulting in a convex curve (
Figure 2). Therefore, for higher initial hexadecane concentrations, this compound will tend to adsorb more in soil and remain less in the liquid phase. This can possibly relate to the fact that at higher hexadecane concentrations, the surface of the soil particles may become covered by this compound, which potentially facilitates additional adsorption. Since in
Figure 2 a plateau was not reached, the sorption capacity of the soil was not limited under the range of concentrations studied.
3.2. Biodegradation Assays
In the hydrocarbon biodegradation assays, a rapid increase of the Oxitop values (i.e., a fast oxygen consumption) and a decrease of NO
3− concentrations were verified in the aerobic and anoxic assays, respectively, during the first 30–40 days of incubation (data not shown). This was probably due to the oxidation of more biodegradable substrates from the sediment and inoculum sludge. The same inoculum already showed similar behavior in previous experiments [
50]. Therefore, this initial period was not considered for the calculation of the hydrocarbon biodegradation rates.
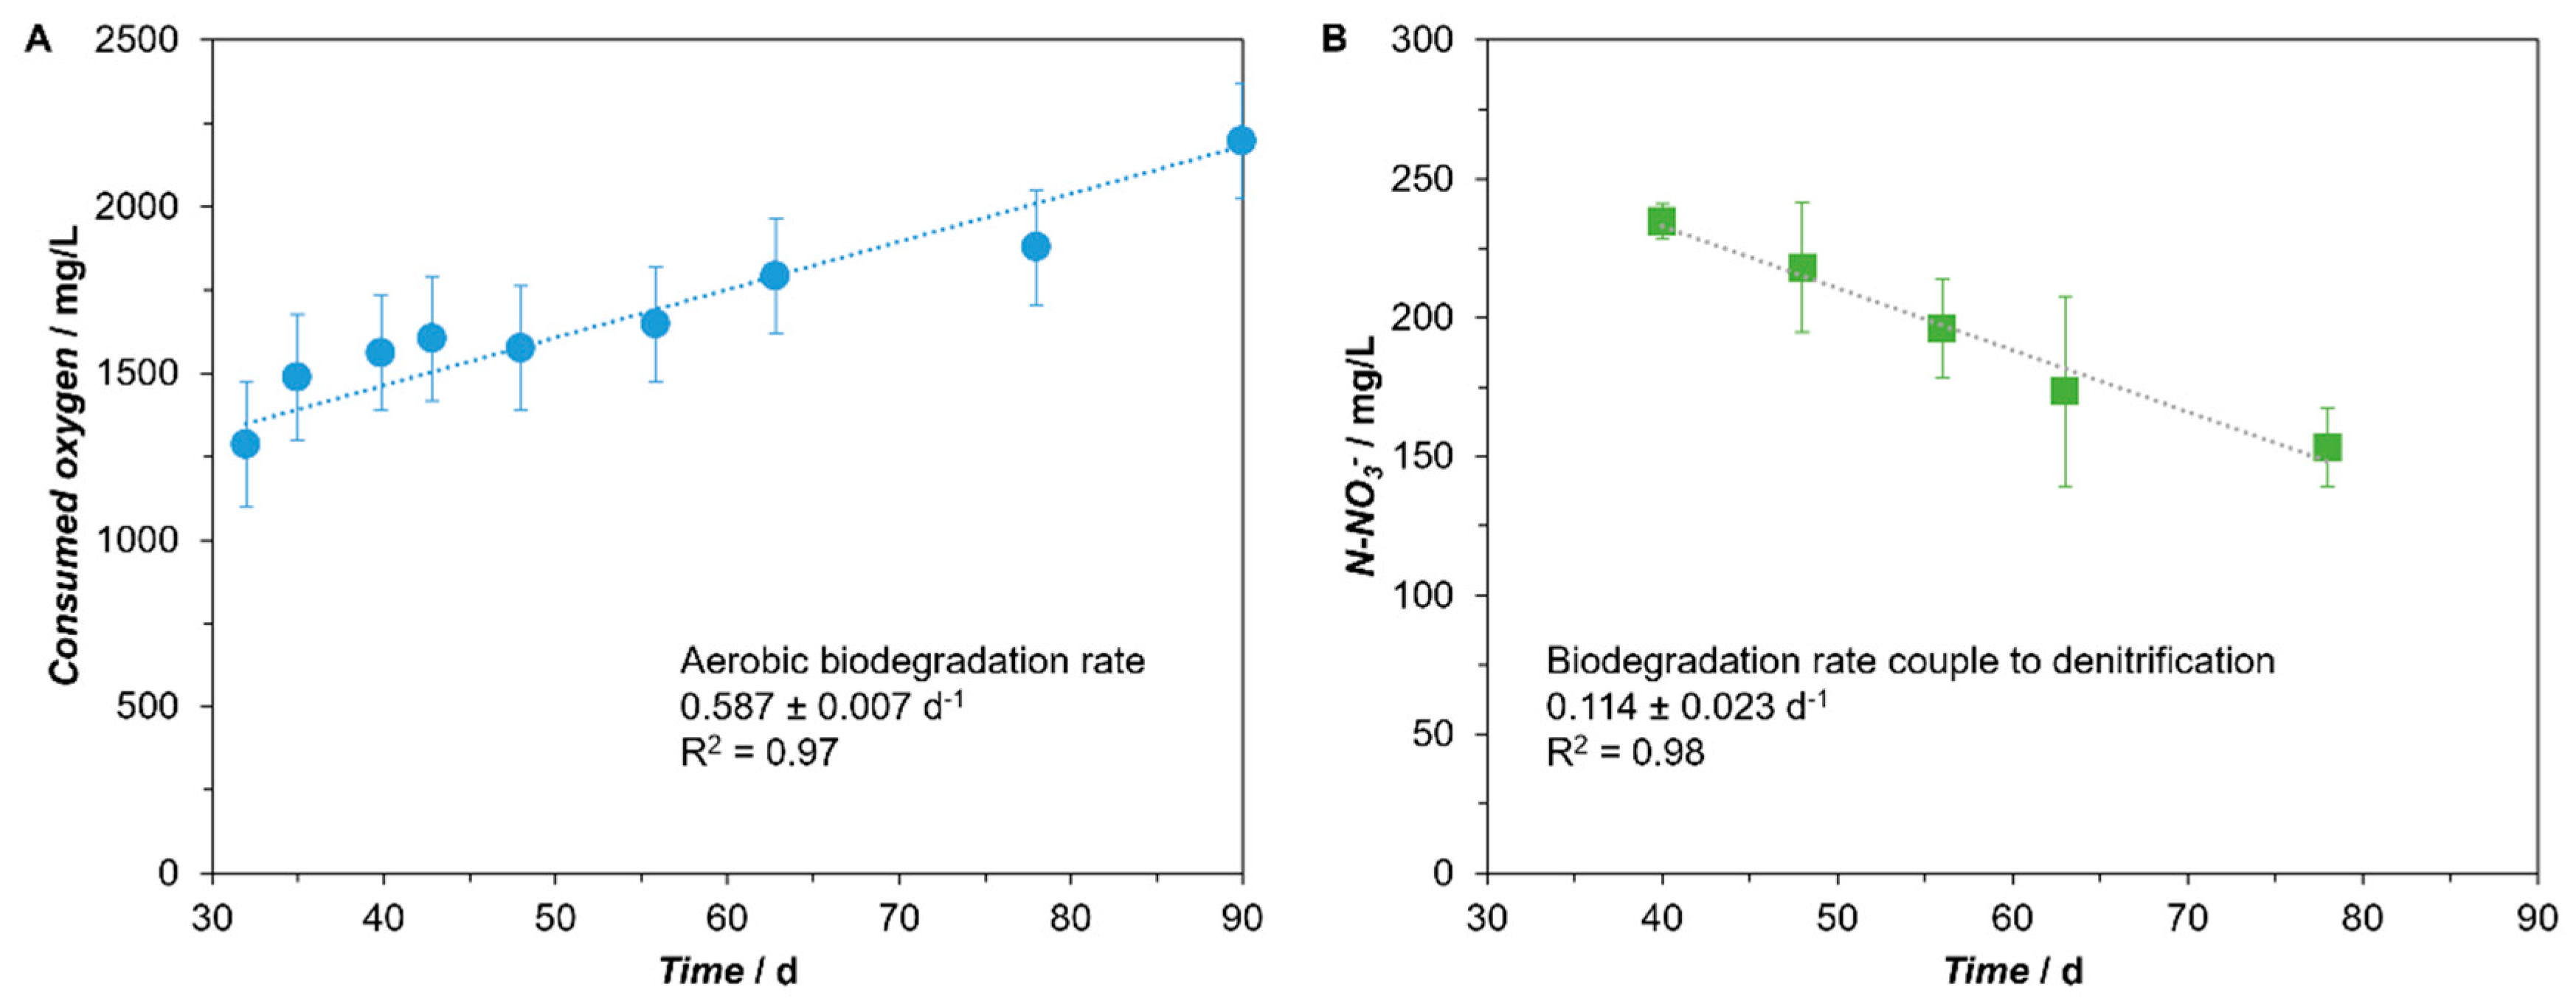
From day 32 and until the end of the test, the oxygen consumed increased gradually in the aerobic assays (
Figure 3A), while in the anoxic tests NO
3− concentrations decreased consistently after the first 40 days of incubation (
Figure 3B), pointing to the occurrence of aerobic and denitrifying hydrocarbon biodegradation activity. From the curves slope, the corresponding biodegradation rates were obtained and are depicted in the
Figure 3. For the calculation of biodegradation rates, the stoichiometry of the chemical reactions presented in
Table S1 was considered.
Regarding the biodegradation rate in the presence of oxygen, a wide range of values have been reported by several authors, depending on the substrate and experimental conditions applied. For example, aerobic biodegradation rate of diesel could range from 0.074 d
−1 to 0.35 d
−1 [
14], while other studies present values ranging from 0.587 d
−1 to 4.75 d
−1 for petroleum hydrocarbons and diesel [
7,
51]. The value obtained in this work is in line with those from the literature. Regarding the values in the presence of nitrate, Roy and Greer [
52] reported a higher rate (0.91 d
−1) for hexadecane mineralisation in the presence of NaNO
3, while Bregnard et al. [
53] reported values around 0.14 to 0.35 d
−1.
3.3. Mathematical Model Development
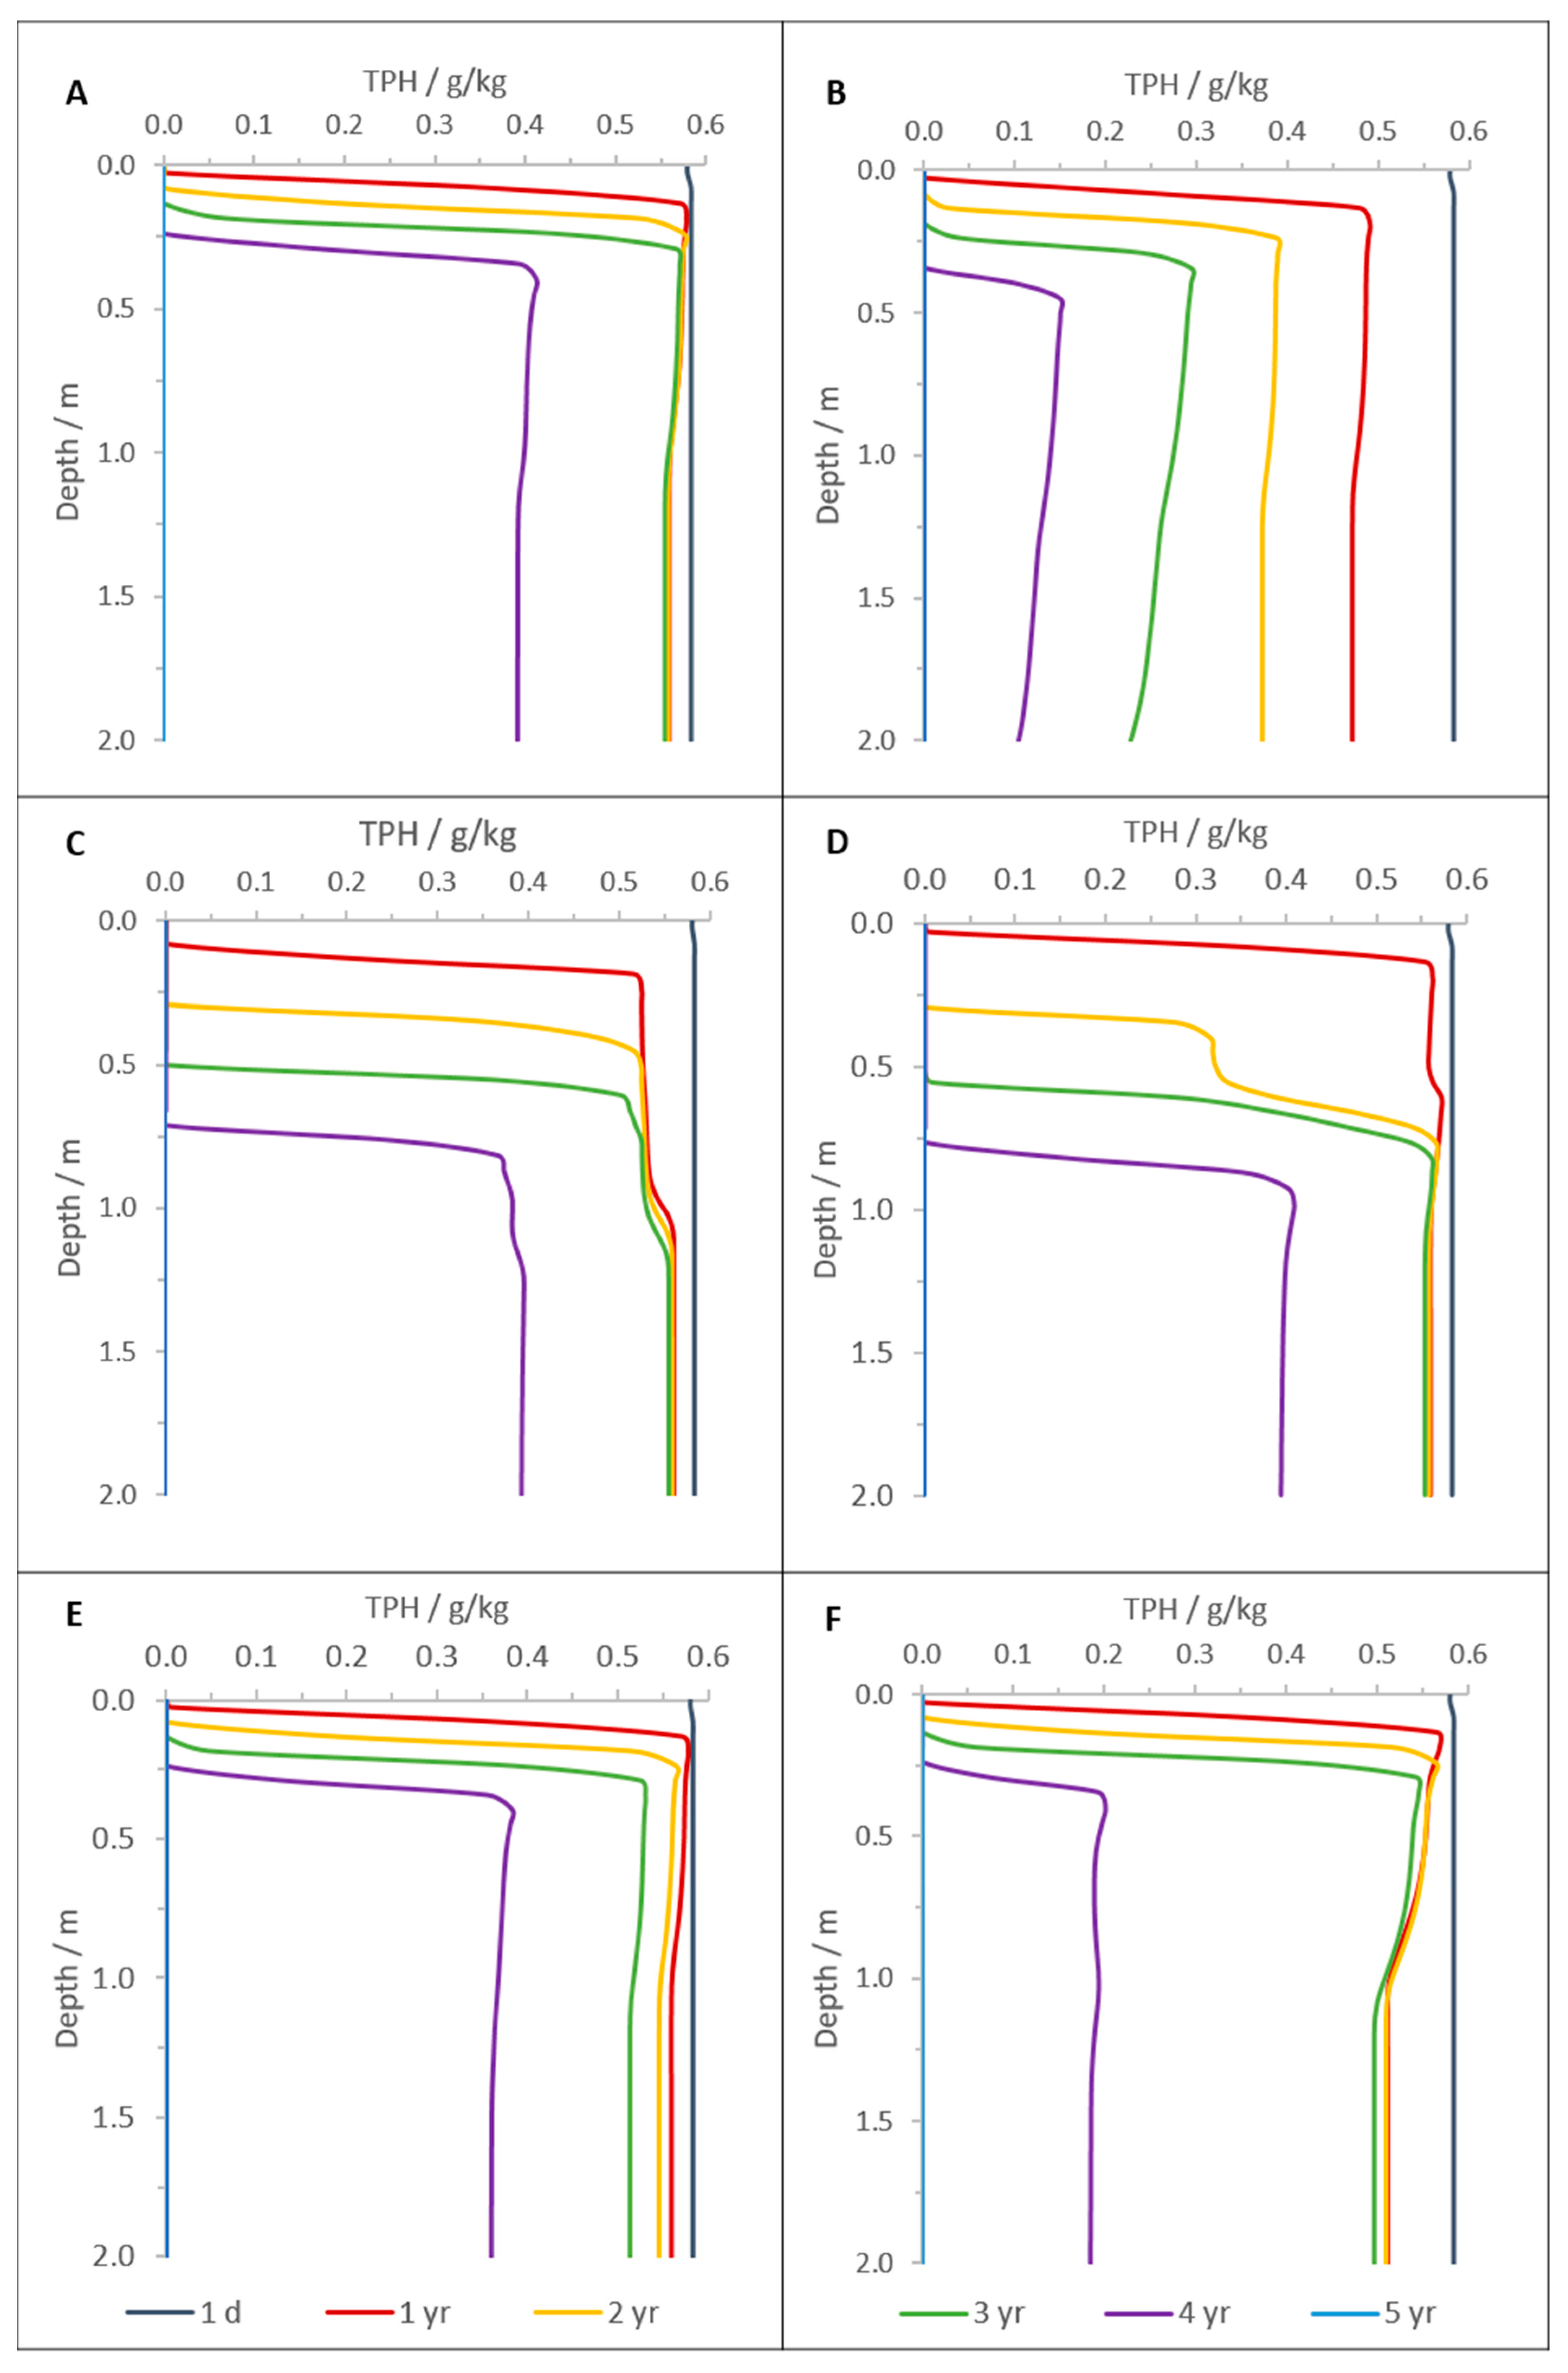
The developed mathematical model was able to predict the variation of hydrocarbon and electron acceptors concentrations, over time and at different depths. As shown in
Figure 4, hydrocarbon concentrations decreased over time, both in the solid (STPH) and liquid (CTPH) phases. In the first 0.1 m depth, the decrease of STPH starts slowly and accelerates afterwards (
Figure 4A), reaching 50% of the initial value after ~1.2 years (439 days). For depths higher than 0.4 m (
Figure 4A,C), STPH remains relatively constant for 3.2 years (1150 days), after which it decreases consistently, reaching a 50% reduction approximately one year later (1507 days). In the liquid phase, the decrease of hydrocarbon concentration follows a similar tendency (
Figure 4B,D); here, ~2.3 years (850 days) or ~4.5 years (1626 days) are necessary to reach TPH concentrations lower than 1.0 mg/L, at 0.1 m depth or at depths higher than 0.4 m, respectively. After 5 years, hydrocarbons are almost completely removed from both phases, at any depth (
Figure 4).
The top layers of the soil column are the first to show low TPH concentrations (
Figure 4C,D), which may result from hydrocarbons biodegradation by aerobic and/or anoxic microorganisms. However, dissolved oxygen concentration rapidly decreases in depth (
Figure S2A), e.g., it reaches null values after 1 day for depths higher than 0.1 m, which limits aerobic biodegradation. As the first layers of the soil column became free of hydrocarbons, oxygen concentration increases again along the time. For example, O
2 values close to 10 mg/L are observed in the first 10–20 cm of the soil column after 3–4 years, and up to ~90 cm depth after 5 years (
Figure S2A). Aerobic biomass exhibits a peak after 1 year at ~25 cm depth and decreases afterwards (
Figure S2B). At higher depth (up to 0.5 m) aerobic biomass also grows, but to a less extent and more slowly than in the upper layers (
Figure S2B). Nitrate, sulfate and iron are also rapidly consumed by microbial biomass, soon becoming limiting for TPH biodegradation (
Figure S3).
All these results point that, besides biodegradation, the decrease of STPH and CTPH in the first layers of the soil column is most probably due to transport phenomena. To verify this, a new simulation was then performed considering only the adsorption/desorption and transport processes (i.e., all the biodegradation processes were not included). As observed in
Figure 5, the profile of STPH and CTPH in the first layers of the soil column (<0.2 m) is very similar to the ones obtained when microbial activity is also considered (
Figure 4), highlighting that desorption and transport are the main processes influencing TPH removal over time for the top layers of soil. In addition, Péclet number (Pe) was calculated to verify if diffusion or advection was the most important transport phenomenon in the soil column. Thus, assuming a mass diffusion coefficient for hexadecane of 4 × 10
−10 m
2/s [
54] and an average water inflow of 3.75 L/d, the Pe was 217, meaning that the advective transport predominates over diffusion in the mass transport process.
In deeper soil layers (>0.4 m), however, when just adsorption/desorption and transport processes are considered, STPH and CTPH only begin to decrease after 4 years (
Figure 5). By comparison, with
Figure 4A,B, it seems that microbial activity has an important role and accelerates TPH removal at higher depths. In fact, after this same time period, STPH was already reduced by 40% at 0.4 m depth when biodegradation was also taken into account (
Figure 4A). Since oxygen, nitrate, iron or sulfate are not available below 0.4 m depth at 3–4 years (
Figure S3), TPH biodegradation is possibly related with the activity of the methanogens.
Methane concentration presents a long lag phase and starts to increase in the third year of simulation (
Figure S4). This is in agreement with the literature, since it has been previously reported that the onset of methanogenic hydrocarbon degradation is often preceded by extended lag phases [
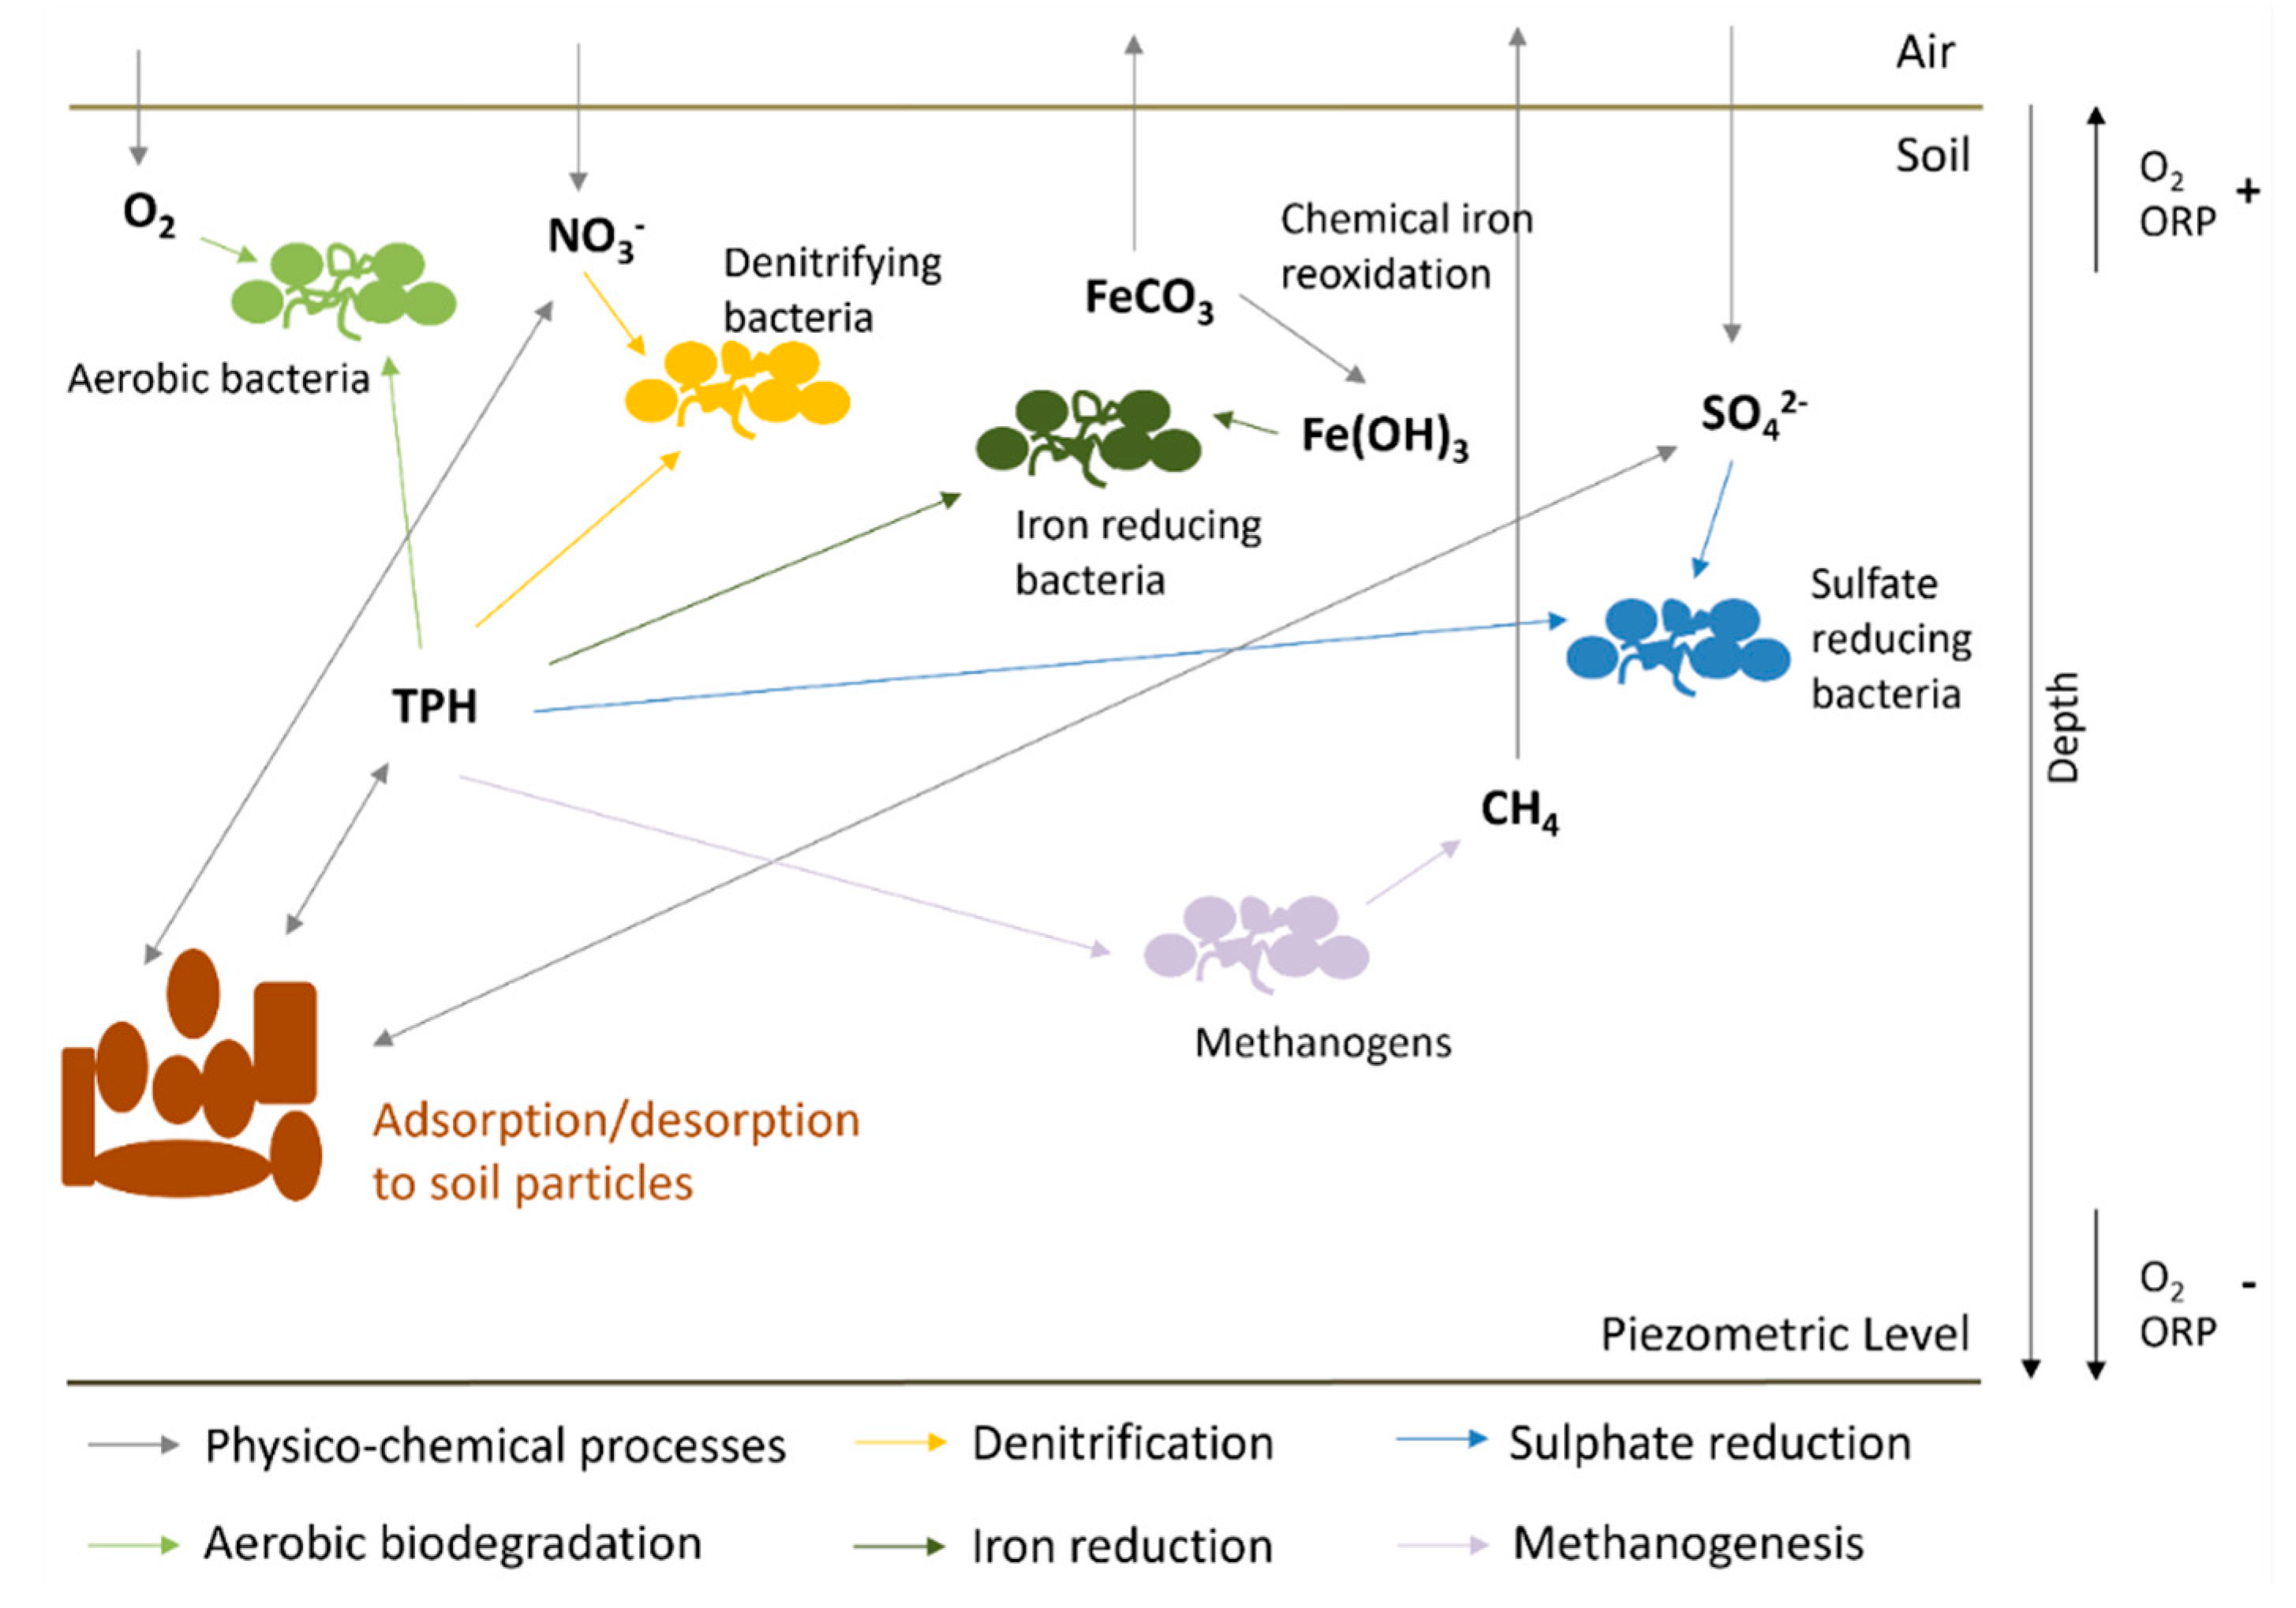
55]. The observed lag phase was related with (i) the small initial concentration of methanogenic microorganisms and (ii) substrate utilization by other microbial groups. Only when denitrification, iron reduction and sulfate reduction become limited by the lack of electron acceptors, does methanogenesis start (
Figures S3 and S4). This tendency was previously reported in contaminated aquifers [
56] and as such it can be expected to happen also in soils. Theoretically, the redox cascade will flow from aerobic degradation, to denitrification, iron(III) reduction, sulfate reduction and finally methanogenesis, determined by the availability of electron acceptors [
56]. In this work, the decreased time of hydrocarbon concentration in depth (
Figure 4) is closely associated with the methane concentrations in the soil column, which increases exponentially at ~3.5 years and reaches the highest values around 4.4 years for depths higher than 1 m (
Figure S4). These results show that methanogenesis has a high impact on TPH concentration and, therefore, TPH biodegradation under methanogenic conditions appears to be the main process contributing for TPH removal at deeper layers of the soil. Methanogenesis was previously shown to be important in the natural attenuation of hydrocarbon contaminated soils [
57,
58].
3.3.1. Sensitivity Analysis
The results of the sensitivity analysis (summarised for the top 5 parameters with higher sensitivity in
Table 5), carried out to assess the effect of the different parameters on the concentration of TPH in the solid and liquid phases, are presented in
Table S4 and corroborate the results described in the previous section. The two parameters from hydrocarbon adsorption isotherm (
Kf,TPH and
nTPH) are among the most sensitive parameters, demonstrating the importance of adsorption/desorption for the dynamics of TPH in the soil column, both for
CTPH and for
STPH. In addition, the maximum TPH biodegradation rate under methanogenic conditions (
μmax,met,20) is the most sensitive parameter for adsorbed TPH (
STPH,
Table 5). As such, STPH is highly dependent of TPH biodegradation coupled to the activity of methanogenic microorganisms. This is possibly related to the fact that, as hydrocarbons are consumed and converted into methane, their concentration in the liquid phase decreases, which facilitates the subsequent desorption and increases their availability to biodegradation. The death rate for anaerobic microorganisms is also a very sensitive parameter, which is most probably linked with the high sensitivity of maximum TPH biodegradation rate under methanogenic conditions. Soil porosity (
θ) and soil density (
ρ) are also very sensitive parameters, showing the importance of both soil physical properties, and of the physicochemical processes.
3.3.2. Bioremediation Scenarios
Different bioremediation strategies were implemented and the results are depicted in
Figure 6. Similar to the previous results, close to the surface (at 0.1 m depth), all scenarios predicted more than 83% TPH removal after two years of simulation (
Table 6). In fact, in the scenario with a high concentration of nitrate, after one year a TPH removal of around 82% can be observed. In these first soil layers (<0.5 m), the high TPH removal can be attributed to the presence of the electron acceptors but also to adsorption/desorption and transport processes as previously discussed. In depth, clear differences between the different scenarios can be observed. The implementation of a soil aeration mechanism (
Figure 6B) resulted in a faster TPH removal. After one year of the oil spill, the TPH removal was already higher than 19% at 0.5 m depth, reaching values above 50% after 3 years in the presence of oxygen, nitrate and sulfate (
Table 6). In the scenarios with the addition of a high concentration of nitrate or sulfate, the results show that near the surface (0.1 m) the model predicts the complete TPH removal in two years (
Figure 6C,D,
Table 6). These results are in agreement with the literature results, since increasing concentrations of electron acceptors promotes an increase in biodegradation rates [
10,
33]. For deeper layers, the removal was lower, mainly due to the depletion of the electron acceptor. Indeed, neither nitrate nor sulfate reaches the end of soil column, meaning that this will not be a problem in terms of groundwater contamination.
For the scenario with higher initial iron (III) concentration in the soil column (
Figure 6E), the results showed similar behavior to the baseline scenario. At surface layers, it is expected to be a 100% removal; for deeper layers (>0.25 m), the TPH removal was not very high (maximum of 40% after four years), although an increase in removal over time was generally observed (
Table 6).
Some authors suggested that adsorbed hydrocarbons are also directly available for microorganisms [
21,
22,
59]. Thus, a scenario where the microorganisms can use the TPH adsorbed to soil (scenario 10%_
STPH), though at a lower rate, was designed (
Figure 6F). The results showed higher removal efficiencies than in the base scenario but lower that in the high NO
3 and high SO
4 scenarios, in the first layers (
Table 6). For depths higher than 1 m, two times higher TPH removal is predicted, relative to the high NO
3 and high SO
4 scenarios (
Table 6). This scenario could reflect, for example, the addition of surfactants to contaminated soil. Surfactants reduce the interfacial` tension, increasing the solubility and bioavailability of hydrocarbons, thus facilitating their transport and biodegradation [
5,
51].
In summary, and based on mathematical model results, soil re-aeration and surfactants (oxygen and 10%_STPH scenarios) addition are the bioremediation strategies that will guarantee a faster treatment of the oil spill. Nevertheless, the natural attenuation (baseline scenario) could also be considered to be applied, since the technical and economic issues involved in soil re-aeration and the application of dissolved compounds could be challenging.
Very few examples of mathematical models were completely validated for one or two bioremediation methodologies [
14]. In the present study, and to overcome the difficulty of model validation, we determined the adsorption isotherm for hexadecane as a major compound of petroleum hydrocarbons (sensitivity analysis showed that adsorption is a very important process) and calculated the biodegradation rate of a complex hydrocarbon mixture in the presence of oxygen or nitrate.
Experimental databases from which to verify and/or calibrate the model are lacking, but sensitivity analyses and the different prospective scenarios developed helped to parameterize and validate the model. In addition, sensitivity analysis provided important information towards the identification of important parameters to be determined in future experiments. The fact that model assumptions are flexible, as well as the modular nature of the mathematical model implemented in AQUASIM, make it possible to be applied to other situations such as mixed reactors and sediment column modeling.
The benefit from such endeavor was the development of a modeling tool capable to predict the fate of hydrocarbons in situ, in a contaminated soil column. With the present mathematical modeling, a series of bioremediation scenarios (alternatives involving a spectrum of electron acceptors application schemes) could be designed prior to in situ implementation. In this manner, bioremediation options for petroleum-contaminated soils might be made comparable in an engineering (and economic) sense [
15].


 ,
, 


