1. Introduction
With the ubiquity of smartphones equipped with various embedded sensors, smartphone users can collect a wealth of real-time contextual data. Mobile phones have become personal sensing platforms that complement and replace traditional Wireless Sensor Networks (WSNs). WSNs have been the leading solution for contextual data acquisition and sensing activities in various domains such as environment monitoring, healthcare applications, home automation, and traffic control. Sensing-as-a-Service was conceived leveraging cloud computing systems that interface with WSNs to allow end-users to request sensing services while WSNs fulfill those requests [
1]. However, dedicated sensing infrastructures typically involve high deployment and maintenance costs [
2,
3]. Today, we have robust computing systems on mobile smartphones that are increasingly powerful, permeating our everyday environment. These miniature computers communicate with each other over the Internet or Device-to-Device (D2D) communication and form a powerful network that is now, essentially, the mobilizing agent of the Internet of Things (IoT). Indeed, mobile devices act as mobile super sensors to provide Mobile Sensing-as-a-Service (MSaaS). In MSaaS, mobile phones are perceived as data collectors, and their users participate in the sensing process offering their phones’ sensory data collection capabilities as services. In addition to the enhanced data processing and validation capabilities achieved on smartphones, motivations for using MSaaS include: the increased sensing coverage area due to devices/users mobility, higher uptime of sensors as the users ensure to charge their phones, the easy on-demand deployment of a network of sensors in an area of interest, the addition of a social dimension to sensing, and the saving of time and cost in comparison to traditionally deployed specialized WSN infrastructures [
4].
A variety of application areas have been suggested and studied in the literature for MSaaS, such as traffic monitoring [
5,
6], environment monitoring [
7,
8], location tagging [
9], and localization [
10,
11]. Such MSaaS applications are categorized as either participatory (with the active involvement of users that contribute data) or opportunistic (data collection without direct user interaction) [
12]. The source of this data is mobile users who share data from their sensor-rich smartphones. There are many challenges in realizing an MSaaS platform, including the time-space constrained nature of crowdsensing tasks, combined with participants’ mobility, the diverse types and quality of sensors on the devices, effective power utilization of the devices, user acceptance, and unpredictable behavior that affects the sensory data [
13]. Moreover, in participatory sensing, the user should be motivated to participate in the process, while in opportunistic sensing, the phone’s context and the availability of the required sensors are difficult to predict [
14,
15]. In this context, we recently proposed a comprehensive MSaaS participant recruitment model that proactively ensures the quality and reliability of the smartphone sensors before it contributes to a sensing campaign hosted on the MSaaS platform [
16]. However, even if good quality and reliable sensors are identified, there is always the possibility that malicious and erroneous data are sent to the MSaaS platform either intentionally or carelessly, which drastically reduces the effectiveness of crowdsensing services. Thus, monitoring and controlling the quality of sensory data received becomes very important to ensure the efficiency of the services.
Owing to this array of open challenges, the main goal of our work was to build a comprehensive end-to-end crowdsensing platform offering standard interfaces for the management and brokerage of sensory data, thereby enabling the rapid integration and deployment of smart city applications. To address the challenge of malicious and erroneous data, we employ an unsupervised machine learning approach combined with participants’ reputations to evaluate the quality of data collected. Specifically, we use clustering, an unsupervised machine learning technique, to discover natural groupings in sensory data automatically. To demonstrate our platform, we focus on using our MSaaS platform for incident reporting during emergencies in smart cities.
1.1. Research Scope
The main challenges to realizing both the client and server side of the MSaaS platform are as follows. The first challenge is to capture data using different frequencies (e.g., once, time-based, event-based) and spanning different contribution scales (i.e., individual, group, and community). The next challenge is managing mobile users with varying devices’ capabilities and recruiting reliable users for a sensing campaign with different sensing paradigms (i.e., both opportunistic and participatory). The next challenge is to automatically process and determine the quality of the raw sensory data received, optimize processing efforts, and transform the data into useful reports. The other challenge is the requirement to broker the communication between data collectors and data consumers in a structured manner using standard protocols.
To address these challenges, we designed and implemented CrowdPower, a novel end-to-end MSaaS platform. CrowdPower allows tapping into the sensing capabilities of existing smartphones to collect the needed intelligence in an on-demand and resource-efficient manner. CrowdPower acts as an intermediary between data consumers (i.e., smart city applications) and data collectors (i.e., sensor-enabled mobile devices) by matching sensing requests in real-time with the most suitable sources and offering information management and data brokerage capabilities. The platform enables the management of various mobile sensing data efficiently and supports different sensing paradigms (i.e., both opportunistic and participatory sensing). To ensure the modularity and extensibility of the system, the platform design leverages SOA (Service Oriented Architecture) concepts to offer its functionalities as RESTful services. Furthermore, it includes AI-based capabilities for evaluating data quality and the automatic generation of incidents’ intelligence reports from raw sensory data. CrowdPower also includes a sensing mobile application that enables data collectors and data consumers to participate in sensing activities. Finally, an administration Web portal is also devised to enable the management of sensing activities and obtain visualization of sensing sessions and incident reports.
As depicted in
Figure 1, our use case encompasses a set of data consumers (interested in crowd-sensed data), data collectors (participants collecting the requesting data using their phone), and the CrowdPower MSaaS platform acting as the broker between data consumers and data collectors. Data collectors and data consumers are registered on the platform using the CrowdPower mobile app. The platform collects status information (i.e., updated location and sensors’ availability) from data collectors’ mobile applications to keep track of all available data types and the associated quality levels offered to data consumers.
To illustrate CrowdPower, consider the example of a data consumer needing data to be collected about a car accident in a certain location in the city. As a result, the data consumer sends a sensing request to CrowdPower, matching the requirements and the available data collectors’ status information to find the appropriate set of collectors who can respond to the request. When a data consumer sends a request to the broker, the request specifies the type and location of the event of interest, along with the minimum quality level required for the task, the maximum budget allocated, as well as the maximum time window required for the task (e.g., car accident at location, min. quality level of 8, max. budget of USD 10, and max. time window of 5 min). Once the selection of collectors (participant selection) is complete, the request is transmitted to the chosen data collector’s mobile app. The participants who accept the received sensing task would complete the sensing activity either manually (e.g., taking a picture or video of an incident) or automatically (sensory data automatically collected by the app.) and transmit the resulting sensed data to the platform. CrowdPower then validates the quality of the received data, removes outliers, and processes the data to generate an incident report sent to the data consumer automatically.
This knowledge on-demand service could provide valuable insights and allow authorities to be better prepared to react to an incident or emergency. The CrowdPower mobile app installed on the smartphones of data collectors and data consumers offers a rich set of functionalities and acts as a sensing gateway. This functionality includes registration to the CrowdPower platform and discovering existing sensing services and sensing communities (representing a grouping of services based on a certain criterion—such as sensing services in a certain city or services offered by a certain institution). Other functionalities include the creation of a sensing request and viewing of a sensing report (by a data consumer), performing/stopping a sensing task (by data collector), voluntary sensing (initiated by the data collector, i.e., steps 3, 4, 5, and 6 in
Figure 1), as well as preference settings (notifications management, access to sensors, and frequency of status update). CrowdPower uses Representational State Transfer (RESTful) Web-services to enable access to its services [
17]. This ability to offer on-demand sensory data using platform-independent, lightweight Web-services brings significant benefits for smart city applications to pull data and constitutes an efficient and flexible solution to the problem of real-time contextual data collection.
1.2. Research Contributions
Our major contributions in this paper are the following.
- 1.
Literature survey: We provide an in-depth literature survey, comparing with other existing crowdsensing platforms, and a discussion on the benefits of CrowdPower.
- 2.
Software architecture, design, and implementation of a crowdsensing-as-a-service platform: We provide a description of the end-to-end development of a cloud-based comprehensive crowdsensing platform that offers sensing services, which researchers can use to study various crowdsensing applications further. We discuss the following:
- a.
The software requirements and the client/server architectural components: The interface between the various components on the mobile application (client) and the MSaaS server is described, providing modularity and scalability. We also discuss the various operations of the system, explaining the flow of messages using sequence charts. Moreover, we describe the design and implementation of comprehensive RESTful Web services. By exposing its capabilities as Web Services, the CrowdPower platform allows flexible access to a wide range of crowdsensing-related functionalities consumed by mobile and Web clients, thus facilitating the flexible implementation and deployment of smart applications.
- b.
The design and implementation of a sensing mobile app: Existing solutions require specialized applications to showcase crowdsensing capabilities and need to develop different applications for each use case. Our platform, on the other hand, is the first to offer a generic sensing gateway application that enables both data collectors and data consumers to participate in sensing activities. It allows the collection of a large variety of sensory and user collected data on different frequencies and scales and supports both opportunistic and participatory sensing (both triggered and voluntary). Such an application would enable the collection of any crowdsensing data required (according to the specified criteria), thus combining the capabilities of multiple crowdsensing applications in one.
- c.
The design and implementation of an administrative Web portal: An administration portal was designed and fully implemented to enable easy administration and visibility over sensing activities and sessions. Furthermore, a customer’s Web portal was provided to allow authorities (acting as data consumers) to have a full view of the data related to their geographic location, along with useful statistics and analytics.
- 3.
Model for gathering good quality sensory data for efficient processing: We use a double-edged approach to ensure efficient processing of the sensory data. For a given sensing campaign, as an initial phase, we proactively make a participant selection by comparing the sensors on the participants’ mobile phones to ensure the quality of the phone. This approach was proposed earlier [
16]. We briefly explain this approach to provide the reader with an overall understanding of the whole system. The next phase, which we describe here in detail, is where our system relies on unsupervised machine learning combined with user reputations to evaluate the quality of sensory data received at the server. We preprocess data received to detect and filter anomalies in the data, and then we use clustering, which is a machine learning technique to discover natural groupings in the data automatically. Moreover, we also describe a model for benchmarking phone sensors to compare sensors of the same type on different phones and allocate them a relative quality score.
- 4.
Empirical evaluation: We discuss the evaluation of the participants’ selection model (first phase) and the data quality model (second phase). Our data quality estimation model was tested, and the results are analyzed and discussed to show how the data quality is determined, including determining participant reputation and filtering outliers.
The rest of the paper is organized as follows: The next section presents the related work and literature review, highlighting the benefits of MSaaS over traditional WSNs and comparing CrowdPower with similar research contributions in the area.
Section 3 describes the architecture and detailed design of the platform, followed by
Section 4, which highlights the software implementation details on both the client (mobile app) and server components.
Section 5 discusses the empirical evaluations of our proposed models, and finally, we conclude in
Section 6.
2. Related Work and Literature Review
Smart cities are continuously innovating to use information and communication technologies to solve major challenges of urban life, such as traffic congestion, environmental pollution, waste management, and regulation of health requirements. These requirements of smart cities are enabled using service-oriented architecture, which promotes cost-effective, seamless, and efficient communication between a network of sensors (including WSNs) and a cloud computing platform. With sensors being widely deployed in smart cities and the possibility of accessing everything-as-a-service over the Internet, this has enabled the scalability and availability of the various urban services [
18,
19]. Yet, the challenge remains: deploying and maintaining these dedicated sensing platforms and sensory networks are expensive. Recently, with the advent of powerful smartphones that have embedded sensors, the possibility of using these mobile smartphones as sensing platforms caught the interest of researchers, leading to the concept of mobile phone sensing [
20].
Table 1, presents a comparison between the traditional sensing paradigm (i.e., WSNs) and mobile sensing. The main objective of the literature review is to show how CrowdPower compares with the existing tools and also to highlight the research gaps in the literature. However, this article is not considered a systematic literature review. In finding the related work, we minimized the bias by searching for articles using widely used search libraries such as Scopus, and we used keywords relevant to our work, such as “sensing”, “crowdsensing”, and “platform”, among others.
Mobile phone sensing is ideal for sensing applications since it uses the widely available, self-maintained, comparatively secure, cost-effective, and resource-rich platform of an already existing infrastructure of mobile phones [
21,
22]. Moreover, the development of mobile crowdsensing applications is scalable and easily adaptable when designed with SOA concepts [
23,
24], since it allows the decoupling of sensing applications from the sensing hardware. Such crowdsensing platforms offer seamless participant recruitment, data collection, data processing, and data dissemination services. As described earlier, CrowdPower offers SOA along with extensive RESTful Web services to expose its functionality as services.
Table 2 presents a comparison of the crowdsensing platforms that use mobile sensing and would help the reader to identify and compare our contributions in comparison to existing solutions. A middleware that automates the process of users finding and joining online social network services and collecting contextual data is [
25]. It combines user activities on such services by sensing the physical environment using mobile devices while maintaining privacy. Hence, applications easily capture both user context and sensed data. The key features are that users can build an application on SenSocial for social media monitoring and define their triggers for sensing. The framework has a close coupling of social networks and mobile sensing data streams which can be filtered. The Publish–Subscribe interaction paradigm is used where the middleware is the publisher, and the applications are the subscriber. Since the framework uses an online social network, it is not device-dependent, but all activities are restricted through the specific social media application.
Vita [
26] is a mobile cyber–physical system built using SOA for crowdsensing. It presents both the mobile and the cloud platforms to enable sensing services. It optimizes task allocations to users by using genetic algorithms and K-means clusters. It also uses RESTful Web-services to provide mobile users with HTTP-based URIs to interact with their cloud platform. They also provide a REST-SOAP adapter to integrate SOAP Web service requests. SOAP is inherently heavy both in terms of computation and implementation architecture. Moreover, since SOAP-based web services are outdated and have drastically been reduced [
27], scalability and adaptability would be a considerable benefit if all services provided were purely RESTful based on widely adopted and tested HTTP verbs and identifiers.
Another interesting work is Medusa [
28], a programming framework for crowdsensing. It provides high-level abstractions for specifying the steps required to complete a crowdsensing task and employs a distributed system that coordinates the execution of sensing tasks between smartphones and a cluster on the cloud. The framework includes a sandboxed environment on the client that receives a task. An interpreter parses the program and creates an intermediate representation passed on to a module that tracks the tasks, which contacts a backend service. The framework allows users to define their sensing tasks with the help of a high-level language and includes an incentive system using Amazon Mechanical Turk. In contrast to our research, Medusa does not allow voluntary sensing and does not support the concept of location-based communities.
Hermes [
29] is a framework for developing more powerful context-aware applications for the modern mobile environment. It employs real-time dynamic configuration of sensors, uses a distributed architecture, and allows application developers to create and extend their custom widget types. The framework has the Shared Hermes Service Infrastructure (SHSI) where the SHSI layer of a device communicates with the SHSI layer of another device for widget discovery and management. The issues are that it is limited to a single user, creating a network of SHSIs per user and has a limited number of pre-defined widgets.
The Platform for Remote Sensing using smartphones (PRISM) is another attempt to create a crowdsensing framework for realizing a pervasive application based on collaborative and opportunistic sensing with personal mobile devices [
30]. The framework is designed to harness the appropriate phones with the required sensing resources. The researchers aimed to balance the goals of generality, security, and scalability by providing support for two deployment modes, namely deploy-or-cancel and trigger modes. PRISM has a two-level predicate API for the application servers and enables sandboxing to run remote sensing applications in a secure and monitored environment. The framework uses a typical client–server architecture, allowing the clients to update their server status periodically. Both opportunistic and participatory sensing tasks are supported, and the clients run all executable code in a sandboxed environment and provide security and resource management. The framework is limited to Windows Phone only, and the developer must provide application binaries for different frameworks. In addition, contrary to CrowdPower, PRISM does not support the submission of voluntary sensing from mobile users and does not support an XML-based format for specifying tasks.
AnonySense [
31], a framework for accessing mobile sensors, allows consumers to request sensing tasks that are then distributed across participating mobile devices. The system then receives verified yet anonymized sensor data reports back from producers. It has its special-purpose language called AnonyTL for expressing sensing requests and task requirements. The framework supports a well-defined trust model and uses Mix network to provide anonymization. The AnonySense server is divided into three components, RA (Registration Authority), TS (Task Service), and RS (Report Service). The tasks are executed as sensor requests on the phone and not executable code. The framework supports privacy, security, and anonymity and allows data aggregation on the server. Using a proprietary language reduces security leaks but prevents the reuse of existing third-party libraries. AnonySense has scalability issues because of the pull model of obtaining tasks and performance issues because of the use of the Mix network. Contrary to CrowdPower, this framework does not support the submission of spontaneous or voluntary sensory data from mobile users who are producers, which is an important feature required for incident reporting.
CenceMe [
32] exploits off-the-shelf sensor-enabled mobile phones to infer people’s presence automatically. This framework classifies streams from different devices and uses two types of classifiers, Power Aware Duty Cycle, and Software Portability. It is one of the first applications to automatically retrieve and publish sensing presence to social networks using the Nokia N95 mobile phones. Dynamix [
33] is an open-source plug-n-play contextual framework for Android that provides a community-based approach to context-aware computing. It supports the automatic discovery and integration of framework components at runtime. It has a modular and configurable architecture that provides real-time discovery and integration of plug-ins and provides detailed custom settings for privacy and security, but the processing and computation is limited to on the phone itself.
One of the earlier attempts at creating service-based sensing applications is the Web Architectures for Service Platforms (WASP) project [
34]. WASP allows applications to dynamically subscribe to contextual information. WASP has its language and processing performed on either the phone or the cloud. The framework defines two types of service units: function and action. Function as a service unit performs a computation with no side effects, and action as a service unit performs a computation with side effects for one or more parties in the system. The complex computation and processing are handled on the server side, and applications add, update, or delete their subscriptions at run-time. WASP uses an expressive language for application subscriptions and requirements. The frameworks’ support for knowledge representation is restricted to the UML class and does not support ontologies.
Most architectures propose proprietary languages for OS abstractions or specify sandboxed environments for the secure execution of applications. While this would be convenient, the fact that only pre-defined functions and software modules are provided hampers the flexibility of application developers. Moreover, most of these solutions support a limited range of sensory data and are either opportunistic or participatory sensing. In addition, existing approaches do not address the social aspect of crowdsensing and fail to consider sensing communities and voluntary sensing. Those solutions proposed specialized applications to demonstrate their capabilities instead of a generic crowdsensing application that could be used for many cases—this approach requires developing a new application for each use case, which is not practical. Finally, existing solutions lack the end-to-end practical implementation covering different aspects of MSaaS, which are necessary to make the concept of crowdsensing a reality.
In comparison to existing solutions, the main features that set this research apart from the rest are the following: CrowdPower is a comprehensive MSaaS platform offering a generic sensing gateway application that can be used for various crowdsensing use/cases scenarios. Unlike existing solutions that offer one specialized application per use case, CrowdPower aims at offering a comprehensive and standardized approach to mobile crowdsensing. This approach embraces the heterogeneity of phone sensing capabilities, the diversity of data consumers’ requests, and the discrepancies in data quality and participants’ reliability. By supporting a quality and reliability-based participants’ selection approach [
16], CrowdPower ensures that the most reliable participants offering the best quality data are selected. Moreover, CrowdPower offers practical mobile and web applications enabling data collectors, data consumers, system administrators, and officials to easily and flexibly access the system capabilities. The social dimension of crowdsensing is also reflected in CrowdPower through the concept of sensing communities, sensing services, and data collectors and data consumers. Finally, CrowdPower leverages AI capabilities for data quality check, the automated analysis of raw sensory data, and the automated generation of intelligence reports from this data. In the following section, we discuss the different design and implementation aspects of CrowdPower.
3. System Architecture and Design
The main architectural components of CrowdPower are concentrated either in the client-side mobile platform or the MSaaS cloud server, as depicted in
Figure 2. In this section, we first discuss the software requirements and the architectural components of the application. Next, we present the system’s design with some of the collaboration diagrams to explain the important message transmissions between the components. We also explain the design of Web services using the standard RESTful verbs and APIs with a few examples of the main services. Then, we explain the benchmarking of device sensors and the model for selecting participants. Finally, this section explains our models for estimating the quality of data received at the server, estimating participants’ reputations, and filtering outliers.
3.1. Software Requirements
CrowdPower users must install the client software on their smartphone (mobile application) and register with the MSaaS server platform. The application is network-dependent, and therefore, it expects the user’s device to be connected to the Internet. The users are either collectors of sensory data or consumers of the same. An incident refers to a sensing task that a consumer requests. An incident is restricted to a specified geographic zone or area of interest (AoI) and must be completed within a given time duration as data collected for an incident would be outdated as time passes. A geographic zone is also represented as a community of users, where different data sensing services are provided. Sensing services are mapped to a type of incident, such as fire monitoring or accident monitoring.
Consumers can create, view, and delete an incident using the mobile application on their smartphone. A report of all the incidents requested by a consumer is made available for tracking purposes. An incident request includes a name for the incident, a description of the incident, the frequency of the data capture, the sensors required for the data collection, the geographical location, and the associated community of users. These data points are published to the CrowdPower server as a request raised to be processed by potential collectors to supply sensory data.
The collectors (or producers) are those users that collect or produce the sensory data for a published incident on CrowdPower. Based on AoI and community constraints, collectors are selected for an incident. Collectors can view raised incidents, and they can choose to contribute to an incident or not to. Once the collector accepts a request for supplying the sensory data for an incident, they are given the option to upload the same. The sensory information capture is either automated (data collection does not require user intervention) or manual (users must manually collect data such as taking photographs or videos). The collectors also can use both automated and manual modes for a single incident.
The application also allows collectors to upload sensory data voluntarily (i.e., not for a specific consumer request), which is also available for consumers to access. Access to such voluntary data is subject to approval. These are typically dynamic real-time incidents for which sensory data is captured. Voluntary incident reports also include a name, description, the sensors used, sensor data type, location, and intended target community.
We used the publisher–subscriber design pattern [
35] to facilitate the communication between consumers and collectors (
Figure 3). For instance, when consumers publish incidents (requests for sensory data), they are stored in an incident channel on CrowdPower. A selected group of collectors is notified of incidents they have subscribed to. Moreover, collectors can also act as publishers to contribute data in response to the incident requests. Consumers are notified of such data as they become available, but data are processed first, and only data with the required quality are sent. In addition to facilitating communication between consumers and collectors, the publisher–subscriber design pattern de-couples the consumers and collectors.
User management is an important aspect of the application, where the user registers with credentials such as a valid phone number, a valid email-id, and a strong access password. Once authenticated, the user can switch between the collector or consumer modes. Certain functionalities in the application are exclusive to a mode. For example, only consumers create a new incident, and only producers upload data for an incident. The data synchronization option is provided when the user logs in with a device different from the previously used one. The device’s incident metadata and voluntary metadata are synchronized with the backend server. Users can create a profile to select which communities they want to subscribe to and which services are under those communities they would be interested in. Multiple communities and/or services can be selected. Application settings for including or excluding certain sensors, frequency or the time duration for data upload, an indication of user availability, and the option to deactivate the account is also provided.
3.2. Client/Server Architectural Components
The software components of the CrowdPower application are distributed either on the client side (smartphone) or the server side (MSaaS server platform), as shown in
Figure 2. We used component-based architecture [
36] based on the methodology described in [
37] as the system consists of a set of components interacting with one another. The client side of the application consists of seven components, User Interface (UI) Manager, Data Store, Service Manager, Schedule Manager, Security Manager, Communication Manager, and Location Tracker. The application’s server side also consists of eight components: Web Manager, Data Analysis, Data Store, Service Tracker, Communication Manager, Information Processor, Registration Manager, and Security Manager. The interactions between the components exchange data, control signals, or requests for resources. Next, the functionality of each module is described.
Communication Manager: This component manages all client and server interactions. The sub-components are the Message Interpreter, Message Handler, and the Web-service Manager on the client side. Message Interpreter classifies the messages based on type, requests, control, or data, through syntax analysis. If the message type is valid, the content is passed to a Message Handler and the Web-service Manager if the messages are RESTful APIs. Otherwise, the message is discarded. These components exchange data in JavaScript Object Notation (JSON), the standard data-interchange format used. The main interactions of this module are with the Service Manager and Security Manager. On the server side of this component, the main function is to queue the messages and check their validity. Consequently, the messages are sent to the Information Processor or the Service Tracker.
Service Manager: This component is responsible for the core functionalities related to mobile sensing. The sub-components are the Role Tracker, Sensor Manager, Mode Manager, and the Event Monitor. It keeps track of the status of all incidents that the user is a part of, either as a data consumer or producer. It also keeps track of all the voluntary contributions that the users have created. It collects the data from the phone sensors by interacting with Android’s built-in Sensor API. As the core component, it interacts with almost every other component. It sends information to the UI Manager to keep the user engaged and informed. It also uses the Data Store to store information related to incident participation.
Security Manager: This component is responsible for preserving the data security in both the client and server sides of the application. The sub-components are the Encryption Manager and the Access Control. The application receives information such as sensor data and the user’s current location. It receives inbound or outbound messages from the Communication Manager and decrypts or encrypts the messages. The component also ensures access control and authentication based on the registered details available on the server. This component also manages the identification and authentication of participants.
User Interface (UI) Manager: This component is responsible for all interactions with the user. The sub-components are Event Handler, Notification Manager, and Interface Manager. It uses Android’s built-in View API with graphical widgets to display the information to the user. It receives all user input and passes it on to other components. It also displays push notifications to the user. The main interaction is with the Service Manager component, from which it receives information to display to the user and to which it sends user input for further processing.
Data Store: This component is responsible for storing all relevant sensing data for incidents, voluntary contributions, and the data collected from the device sensors. The information is synchronized with the server side based on the selected frequency of updates.
Database: The main functionalities are similar to that of the client data store, but on the server side, the data model maintains data of multiple clients, communities, data relationships, and respective services.
Location Tracker: This component keeps track of the user’s location. It uses Android’s built-in Location API to approximate the user’s current location. Its main interaction is with the Service Manager, which periodically updates the user location to the server.
Schedule Manager: CrowdPower has many asynchronous background operations performed at different times, such as collecting data at a scheduled time and sending periodic user status updates to the server. Hence, this component keeps track of these time-delayed events and initiates other components to perform tasks at scheduled times.
Information Processor: The packing and unpacking of messages happen in this component. The main sub-components are Syntax Analyzer, Syntax Validator, and Data Formatter. The syntax of messages received is analyzed, validated, and formatted when messages are sent to a client. Messages that are Web-service requests or responses are moved to the database.
Service Tracker: This component manages the lifecycle of all service requests. The main sub-components are Device Matcher, Mode Manager, and Service Manager. This component keeps track of the producers that are assigned to each service. Moreover, this component identifies producers and related devices most suitable for handling the service. In addition, if the service request requires interaction with an Online Social Media (OSM), it handles the communication with the relevant OSM plug-in.
Web Manager: This component manages the RESTful APIs and OSM requests; therefore, the main sub-components are the Web Service Manager and the OSM Extractor. OSM Extractor gathers data from social media by interacting using the OSM plug-ins. The Web Service Manager manages RESTful resources, which allow direct machine-to-machine communication between the MSaaS platform and the client-side application without direct user interaction.
Data Analysis: This component analyzes the sensor data submitted by producers for a service request. The analyzed data are then passed onto the database. A detailed description of the quality analysis performed by the component is presented later.
Registration Manager: The responsibilities of this component are to handle the registration of users and respective service requests. This is also responsible for updating and removing users and expired services from the server. This component provides a unique identifier to the user concerning the SIM details and maps the registered user to communities and groups.
3.3. System’s Operation: Collaboration Diagrams
The sequence of messages that flow between the components determines how the application’s functionalities are accomplished. We use message collaboration diagrams to depict some of the major message sequences in the application and explain them. The message sequences shown here are initiated by a user (consumer or producer) and passed between one of the components or sub-components explained above. We first describe four important sequences from the client perspective.
Figure 4A shows the createNewIncident message received by the Service Manager from the consumer, where the details of the requested sensing incident are validated. The message is passed on to the server and then added to the Data Store on successful validation. Once the results are available, the Notification Manager sends the respective notification to the user.
Once an incident is registered, a producer (data collector) chooses to accept an incident, and the respective message is sent to the Service Manager, as shown in
Figure 4B. An updateStatus message is sent to the database, which includes a mapping from the producer to the incident. The updateIncidentStatus is also sent to the backend server, and a scheduleNotifications message with the respective user ID, incident ID, time durations, and frequency is sent to the Notification Manager. The producer also receives an appropriate notification to reflect the choice made.
After the user accepts to participate in an incident, the producer responds to the notification and sends the startDataCollection message to the Service Manager for a particular incident, as shown in
Figure 5. The Sensor Manager is triggered with collectSensorData message with the appropriate sensor ID. The sensory data collected is updated to the database using the insertSensorData message with appropriate incident ID, sensor ID, and collected data. The data are uploaded to the backend server using the uploadSensorData message.
Figure 6 depicts the creation of voluntary sensing requests by the producer, where the createVoluntaryRequest message is sent to the Service Manager, and the details are updated to the backend server with the createVoluntaryDetails message. The Service Manager also sends the addVoluntaryToDB message to the Data Store with relevant details. The Notification Manager is also informed to respond with the approval or rejection decision once it is ready.
Next, we describe two important message sequences from the perspective of the MSaaS server. Data are collected from the mobile sensors based on user-initiated events, periodically (time-based) or autonomously (opportunistic sensing). Concerning opportunistic sensing, the mobile device validates the conditions set by the user (privacy settings) to ensure the data from the sensor can be collected. Once the conditions are checked, and data are collected from the respective sensors, the application uses uploadSensorData message to upload the sensor data to the backend. The MSaaS server provides a RESTful API that the application uses to upload sensor data over the available network connection. The service request is then verified, and based on the type of data, the Data Analysis module tags the sensed data, using NumPy and OpenCV modules for reasoning out the data content. Finally, the server converts the sensor data into JSON format, and the details of the analysis details are then stored in the database with respective tags that enable data search.
The other important activity that the MSaaS platform performs is the selection of participants for sensing incidents as shown in
Figure 7. The Service Tracker module in the MSaaS server initiates the process for obtaining the required participants based on the sensing requirement for an incident. The findMatchingUser message is sent to the Information Processor module that uses the participant selection algorithm to select the potential participants. The request is sent to the user (producer), and once the user accepts, the Registration Manager module registers the user as a provider of sensor data for the incident. The producer’s device is alerted to start the sensing service.
3.4. CrowdPower’s Web Service Interfaces
CrowdPower uses RESTful APIs to reveal its functionality as services. The advantage of using RESTful APIs is that they are lightweight and provide a standardized communication format that is understood by various HTTP-based client applications regardless of the system framework. Moreover, RESTful APIs ensure scalability, which is essential when new services must be introduced [
38].
Table 3, provides some examples of RESTful APIs, from the user management, community management, and incident management categories with respective actions.
To interact with the APIs, the application authenticates the user. The authentication is handled through JWTs (JSON Web Tokens). Any authenticated request presents the JWT in the authorization header of the HTTP request. All the API end points are not necessarily authenticated. The application must provide valid credentials (email and password) during login to obtain an API token. The application handles invalid/error states, such as losing Internet connection in the middle of sensor upload or invalid user credentials. Standard HTTP errors, such as 404-Not Found and 500-Internal Server Error are used. Standard HTTP verbs such as POST, GET, PUT, PATCH, and DELETE are used for initiating actions. Since PATCH is not idempotent, failed requests are not automatically re-attempted on the network. In addition, if a PATCH request is made to a non-existent URL, it simply fails without creating a new resource, unlike PUT, which would create a new resource using the payload.
3.5. Benchmarking Sensors
CrowdPower’s mobile application allows the interaction with a variety of sensors using different data collection frequencies (i.e., sense once, time-based repeated collection, and event-based collection). Furthermore, the quality of different phones’ sensors is benchmarked to the same types of sensors in other phones to ensure accurate scoring of sensors’ quality level and a more reliable participants recruitment. This section will detail how the sensory data are collected using the CrowdPower mobile app and discuss our sensor-quality-benchmarking approach. A list of all the sensors supported by CrowdPower and their type and description are given in
Table 4. Sensors that are currently supported by the CrowdPower mobile app can be roughly divided into the following categories:
Environmental Sensors: These allow the user to monitor the state of the surrounding environment and its properties.
Motion Sensors: These sensors allow the user to monitor the motion of the mobile device itself, such as tilt, shake, rotation, or swing.
Positional Sensors: These sensors allow the user to determine the position of the mobile device. Android OS provides a Sensor API that provides access to the underlying hardware sensors of the mobile device. The application must register to a sensor to collect data to get events. Each sensor event contains the following information:
Accuracy: How accurate the values are;
Sensor Name: The sensor that generated the event;
Data: The actual Sensor data. This is a string array of variable length. The number of values and the context of each value depends on the sensor type that is being collected.
The CrowdPower mobile app registers to the required sensor for one second and stores all the events sent by the OS during that time. The exact number of events accumulated in a one-second duration depends on the sensor type. While CrowdPower makes extensive use of the Sensor API, by itself, it does not provide access to all the sensors given in
Table 4. This is because the Android OS has organized and divided its API. The ‘Image/Video’ and ‘GPS’ have their APIs, respectively. The application must collect data from these different APIs and combine them in a common format that is understood by the backend server. The backend provides a REST API that the application uses to upload sensor data over a network connection. Depending on the sensor type, there are two different end points to upload data. One is used for ‘voluntary request,’ and the other is for ‘incidents.’ The application converts the sensor data into JSON format.
Sensors’ quality benchmarking aims at comparing the quality of different brands of sensors of the same type (e.g., accelerometer sensors in different phones) to score their quality relative to each other. This enables the consideration of sensors’ quality in participants’ selection and recruitment for sensing tasks based on the quality level required. To benchmark a sensor, an initialization process is required. This process must be performed at least once per device before testing sensors. During initialization, the sensor is activated, and the device is moved for ten seconds, ideally in different directions and at different movements speeds. At the end of initialization, the mean and standard deviation are calculated for each sensor axis (x, y and z) and the timestamps of the measured values per sensor.
Following initialization, the sensor benchmark is performed based on six categories/metrics, according to the SensMark approach [
39]. Each metric gives a partial score, and the final sensor score is the summation of all these partial scores. Certain metrics are applied to all sensors, whereas others are specific to certain sensors. If a metric is not valid for a sensor, it will simply have a score of 0. These metrics are the number of events, standard deviation, step increment, time continuity, count of unique values, and gravity accuracy.
The number of events is the number of returned events during the benchmarking process. This will vary depending on the device and how long the sensor events are collected. Standard deviation is calculated for measured values across each sensor axis. To determine the score, a constant c with the fixed value 33 is divided by the standard deviation for each sensor axis. These partial results are added and finally divided by the number of axes, according to Equation (1), where ‘
σ’ is the standard deviation, ‘
c’ is the fixed constant value, and ‘
a’ is the number of axis for the sensor.
Step increment is the difference between two consecutively measured values per sensor axis, as shown in Equation (2). The constant c is divided with each sensor’s respective minimum step increment. These partial results are added, provided the sensor has more than one axis. The respective results are added and finally divided by the number of axes.
where 2 ≤
k ≤
n,
a = # axes,
c = 33.
Time continuity refers to the time difference between two successive sensor events. The average time difference
is calculated and is divided by the average time difference during the initialization phase, as shown in Equation (3). This results in a relative ratio
with a value between 0 and 1, depicted in Equation (4).
Then, the constant value is divided by the standard deviation
σ of measured timestamps during the benchmark, as per Equation (5). Finally, the score depends on the partial result of the initialization process and the ratio of the average time differences to the initialization and benchmark, calculated as per Equation (6).
Count of unique values is only used for light and proximity sensors. This is the number of unique x-axis values among the measured values during the benchmark. Gravity accuracy is used only for the gravity and accelerometer sensors. First, the arithmetic mean is calculated for the Z axis values (Equation (7)). A division is used to calculate the percentage deviation from the standard acceleration g = 9.80665 m/s
2. Finally, this percentage is multiplied with the maximum achievable score (4000) for this category to obtain the partial score for the overall rating (Equation (8)).
Table 5 summarizes the different metrics used in the sensor benchmark, which sensors they apply to, and their impact on the final quality score. The ‘Others’ column refers to all other sensors not mentioned in the previous two columns.
3.6. Participants’ Selection Model for a Sensing Campaign
Here, we discuss our participant selection model [
16] and highlight the main contribution for continuity in the discussion and to allow the reader to understand the whole system. This phase is a proactive process where we use the capability of phones to determine participants for a sensing campaign to obtain good quality sensory data. We adopt an approach where a group of participants (gathered into sites) collaborates to achieve the sensing task using the combined capabilities of their smartphones.
To realize our model, an iterative participants’ selection algorithm is illustrated in
Figure 8.
The procedure begins as follows. The consumer initiates a request to obtain sensing information. The request lists several attributes, including the location of AoI, the kind of incident, the least accepted degree of quality, the highest allocated budget, and the time needed to fulfil the task. Upon the specification of the data, the selection algorithm splits the AoI into locations. The number of the locations will be computed, and a grid is built. Thereafter, the data producers (participants) are allotted an arbitrary location in the grid and possess different types of smartphones. The brands of the smartphones are in relation to the most prevalent smartphones in twenty-one countries globally. We chose the countries as they constitute various percentages of market penetration [
40,
41].
Following the assignment of data producers, the algorithm calculates the scores determining the quality of the smartphones, considering the quality scores of the sensors. We used Dxomark [
42] and SensMark [
39], tools for testing sensors to calculate the quality of the smartphone sensors. Relying on the scores fetched from the testing tools, the algorithm calculates the scores of the quality of the smartphones. First, the quality scores of sensors associated with incidents are calculated. Second, for each location, the algorithm computes the quality score by averaging the phones quality score. Third, the algorithm computes the locations’ entire quality scores and the locations’ costs. Next, the locations’ likelihood of task fulfillment, the location’s score of reliability, and the rates of the locations’ data quality are calculated. Finally, the algorithm computes the locations’ final score of selection.
3.7. Estimation of Data Quality, Participant’s Reputation, and Filtering Outliers
In the previous sections, we described our models for benchmarking the sensors and to select participants based on the quality of the sensors on the smartphones that run our CrowdPower client application. However, we cannot neglect the possibility of malicious or faulty data being sent either intentionally or carelessly. Thus, to reduce the unnecessary processing requirements of the MSaaS platform and ensure proper management of resources, it is essential for the data to be filtered and its quality estimated once received at the server. We propose the following approach to estimate the actual data quality.
We use an unsupervised learning technique integrated with user reputation to realize data quality. We ensure that we detect and remove data anomalies. We also provide a model simulation to evaluate our method and reveal its benefits. Based on a sensing campaign request from data consumers, the MSaaS server selects participants (data providers) to provide sensory data of an incident. The data received are expected to vary between participants and a single user if the data are provided more than once. Each campaign is for a duration of time, and for the sake of illustration, here, we consider that the data producers (participants with smartphones) send in data as numerical values multiple times for a given campaign duration.
We assume that a task such as monitoring temperature at an accident scene has K time slots for the duration T of the campaign. The selected participants within the area of interest (AoI) is denoted by N. In each time slot k, 1 ≤ k ≤ K, each participant i ∈ N provides sensing data d_(i,k) to CrowdPower. The Data Analysis component uses an unsupervised learning technique to estimate the data quality of the participants, which is a set Q_k = {q_(1,k),…,q_(n,k)} for the data received from participants in a slot k. To enhance the quality estimation, we also integrate participant’s reputation R_(i,k), for k slots. The reputation score is relative to the quality of the data sent by the user in previous time slots of the campaign duration.
In addition to quality evaluation and reputation analysis, we also assimilate the data based on user classification where participants are either malicious users N_k^M or trustworthy N_k^T. This is determined by checking if the distance of the sensor data from the consensus (determined by the centroid of the cluster) crosses a predefined threshold. Finally, based on these evaluations, we determine d_k, which is the estimated data for the time slot k. The pseudocode and evaluation of these models are provided in the Evaluation section of this paper.
3.7.1. Quality Estimation Model
This process is completed in the Data Analysis component in CrowdPower, which receives the sensory data from the selected participants, evaluates the data quality and reputations, then filters out the suspected malicious data providers. This would result in arriving at a better estimation of the actual sensory data. As a preprocessing step, if there are missing values in the time slots, then these values are filled as the average value of data received from a phone. For a time-slot , within a sensing campaign, the set of data received from the participants is . The quality of the data received is a set .
The set of sensory data
forms a cluster, and the distance between any two data points is represented as
. The MSaaS platform calculates the distance between the two data points to determine the similarity where the lesser the distance between two data items, the higher the similarity. While calculating the distance between the data values, the cluster centroid
is also determined by recalculating the centroid while iterating through the data. The deviation
shown in Equation (9) is the weighted square distance between
and the participant’s data. The higher quality data are closer to the centroid and therefore have less deviation. The centroid is the minimum of the sum of the weighted squared distance between
and the participant’s data as shown in Equation (10).
Now, let
be the sum of all the deviations, i.e.,
. The data quality is continuously updated as shown in Equation (11). The quality estimation
is a real number between 0 and 1, and the sum of all quality estimations is 1. The evaluation converges by comparing participants’ quality variation between two consecutive iterations.
The algorithm for quality estimation is provided in Algorithm 1. The input to the algorithm is the sensory data that are received by the Data Analysis component. The
is a small value used to differentiate two consecutive quality readings, where
is the previous reading. The first loop in the algorithm is for initializing the quality outcome to 1/n, where n is the number of participants. The iterative loop in Line 3 of the algorithm converges with quality values for the data in a time slot. The loop recalculates the centroid as the sum product of the squared distance and quality output to determine the minimum distance to the centroid. The sum of all deviations
is determined in Line 7. The new quality output is calculated in Line 9. The result is a set of quality values for the data submitted by the sensors on the participant’s devices.
| Algorithm 1: Quality Estimation |
| Input: Data set: , |
| Output: Quality of participant data:
|
| 1. for all |
| 2. |
| 3. for all && |
| 4. |
| 5. for all |
| 6. |
| 7. |
| 8. for all |
| 9. |
| 10. return |
3.7.2. Participant Reputation Estimation Model
After determining the data quality of a participant’s data, the participant’s reputation is estimated. Reputation is defined as the ‘trustworthiness’ of a user, and it is estimated using historical quality records. While a participant’s reputation progressively increases because of consistent behavior over time, it decreases if there are anomalies detected [
43]. Intuitively, the participant’s reputation should have a small increase after receiving a high-quality contribution and a larger decrease if the data quality was low. To determine a participant’s reputation after
time slots, we first determine
which is the relative quality index. We aggregate previous information to estimate the participant’s reputation by summing all the past quality records, where
is the aging weight where
. Therefore,
determines if a participant’s data quality in slot
is above average, i.e.,
or otherwise. The participant with lower quality data
should have a higher aging weight and have a larger reputation decrement, i.e., the participant’s reputation decrements relatively when data quality decreases, as shown in Equation (12). Similarly, when the average quality is above average
, the aging weight is
. When the number of participants increase, the rate at which the reputation is affected should also increase as the quality of peer-data must affect the reputation. Therefore, we adapt a generalized logistic regression function [
44], given in Equation (13), to calculate a participant’s reputation.
In Equation (13),
W and
X are the lower and upper asymptotes,
is the growth rate,
is the maximum growth rate, and
is the inflection point. After each time slot
, the participant’s reputation is updated. This approach of calculating the reputation is proportional to the degree of trustworthiness which is assimilated over time. The algorithm for calculating participant reputations is provided in Algorithm 2.
| Algorithm 2: Estimation of Participant Reputation |
| Input: Quality set:
|
| Output: Reputation of participants:
|
| 1: for all |
| 2: for all |
| 3: if |
| 4: |
| 5: else |
| 6: |
| 7: for all |
| 8: |
| 9: return |
3.7.3. Classification and Filtering of Outliers
As introduced earlier, we classify the data sent by participants as either malicious and faulty (
) or trustworthy (
). We use a distance-based outlier [
45] to verify participant intention. For all data
that are received from the participants, we define
as the distance threshold to determine the proximity of other data points. If most of the data items are far away from
, i.e., not in the
-neighborhood, then
is regarded as malicious.
is malicious if Equation (14) is less than
), which is the fraction threshold. The malicious data set is filtered out as an outlier.
4. Implementation of the MSaaS System
In this section, we discuss the implementation details of our work. First, we explain the mobile application using some of the user interface screens and then the administration Web portal. Screenshots from the applications are included to depict and explain the user experience.
4.1. The Client-Side Mobile Application
Here, we discuss the client-side experience using the CrowdPower mobile application interface and present their significance. In designing the user interface, we followed the usability heuristics by Nelson [
46] to ensure an application that scores high on usability. For instance, the screens are designed to be consistent with modern phone applications in terms of navigation, search, the usage of maps, the configuration of settings, etc. The registration and login screens followed by a screen displaying the two main options that the user chooses from are shown in
Figure 9. The Provide Data option allows producers to see assigned incidents and upload voluntary sensory data. The Request Data options allows consumers to request sensory data. To match user expectations, the screen is designed to be consistent with typical phone applications where there is a login screen, signup screen, etc. The application allows users to be part of communities and select services relevant to those communities.
Figure 10 provides the view of the screen where the user searches for a community and accesses sensory data provided as services within each community. Users can filter by partially entering the name of the desired community. The plus (+) icon changes to a tick icon to indicate the selected community. The search screen is basic, and it follows usability recommendations [
47]. For instance, the search box is at the top, and the result is updated automatically.
Figure 11 shows how the consumer creates an incident request and collects the data. The map selects the area of interest for data collection while creating incident requests. The gray knob at the edge of the red circular area is used to expand/contract the area of interest for data collection.
Figure 12 shows the producer’s view. The red pin indicates the general area for the data collection. The user swipes up to see the rest of the incident details. The producer can accept by pressing on the ‘tick’ icon. Pressing the cross icon rejects the incident. The user can perform a task by pressing the Perform button at the bottom of the screen. The producer can cancel the currently active incident request by pressing the ‘trash can’ icon.
The producer’s main view is shown in
Figure 13, where the screen shows a list of all the incident requests for which the user has been selected. The user can view the incident details and accept or reject the incident or simply ignore the same. The title in red indicates that this is an unopened pending incident. The ‘1’ in the black circle is the number of new pending incidents. The ‘Active’ tab shows a list of all the incident requests that the producer has accepted. In the Active tab, for the first incident, the sensory data are being uploaded to the server, and for the second incident, the user still has to collect the data. The ‘Finished’ tab shows all the incidents that the producer has completed, canceled, and/or rejected, and the screen shows all the different types of incidents.
The application provides an interface to change both the profile and application settings (
Figure 14). The user has granular control over which notifications to receive, which sensory data to be uploaded, and how often the location update is sent to the server.
Figure 15 shows the screen used by the data collector to create a voluntary request. This allows the user to provide data. The user can select multiple images and videos to upload. The user also has the option to provide optional sensory data. The red pin indicates the general area with which the data are associated. The pin is adjustable by the user. The ‘Request Sent’ status indicates that the system has created the voluntary request but has not been approved. The producer can cancel the voluntary request any time before or after it has been approved by the system.
4.2. The Web Server Application
This section explains some of the main application interfaces from the CrowdPower Web server application and discusses their significance. The server-side application provides an interface for the administrator to view the dashboard of various system functions, manage and set community parameters, manage and set service parameters, generate incident reports, and manage user profiles. The interface offers three separate portals for Admin, SuperAdmin, and User (consumer/producer). The Admin dashboard allows administrators of the platform to manage consumer profiles, approve/reject incident reports, and view the communities and services registered in the system. These admin accounts are managed through the SuperAdmin dashboard, which allows a super user to manage admin accounts and create new communities and services. The User dashboard, on the other hand, allows users of the CrowdPower platform to view generated incident reports that pertain to them.
Figure 16 shows the dashboard screens, which present useful statistics generated by the platform. Among them are the view of the number of active participants registered in the system and the percentage of those that joined within the last month. The frequency of sensing sessions on a daily, monthly, and yearly basis are also shown. Users can see a breakdown of incidents by geographical area and the incidents that occurred over the past week.
Figure 16 also includes a map of all the active incidents. As depicted in the diagram, the various incidents are represented by pins on the map. The bar chart depicts the incidents by frequency of occurrence. These statistics are useful for administrators to identify patterns and potentially develop solutions to reduce the number of incidents occurring in that particular geographical area.
Administrators of the CrowdPower platform view the registered communities in the system, as shown in
Figure 17a. On the SuperAdmin portal, the user clicks on any community cards, updates information about them, and can also enable/disable the communities. By clicking on the map section of the community cards, it automatically directs to the Google map application. Additionally, new communities can be created by picking from the pre-populated selection of sensors registered on the platform and the geographical area to which the community belongs, as shown in
Figure 17b. On the Admin Portal, statistical data about that particular community is available, as shown in
Figure 17c, such as a breakdown of incidents by service and the number of incidents that occurred in that community per month and in the past year.
As shown in
Figure 18a, CrowdPower Admins and SuperAdmins view the list of services that are registered in the system as well as their status. On the SuperAdmin portal, the user can update information about the service, such as the name of the service, the community it belongs to, the status, and the sensors to which they are associated, as shown in
Figure 18b. On the Admin portal, the user also sees the information about that particular service, such as the information collected and the communities in which the service belongs. Additionally, administrators see statistics of individual services.
On the Admin Portal, administrators of the system can view and manage incident reports generated from the Crowdsensing platform. As shown in
Figure 19, the user can view information related to the reports generated and can approve or reject a report. The option to generate a PDF version of the reports is also provided. The reports that consumers view are restricted to only those they generate.
Apart from those shown here, the Admin Portal administrators can also view information about system users, such as their contact information and account status. Additionally, they can update user profiles and enable/disable them when necessary. They also view individual consumer incidents, producer incidents, and voluntary publications. Lifetime stats related to the user profile, such as location coordinates, reported incidents, and clients that reported, can be viewed on the User Profiles Table. Finally, administrators accessing the SuperAdmin portal can manage admin profiles. They can view their personal information and account status, add new admin accounts, update their information, and enable/disable accounts if necessary.
5. Empirical Evaluation
We conducted several types of evaluations. For instance, we evaluated the functions of the CrowdPower mobile application by asking participants to carry out tasks corresponding to the functions of the applications. We designed the test to evaluate the functionalities of the application in regular settings (i.e., when all the correct input is provided), but also with erroneous settings (i.e., when the user provides incorrect input). The two participants who participated in the function test carried out all the system’s functions successfully.
In this section, we first discuss the impact of various parameters on site selection to determine the potential participants, evaluating the model presented in
Section 3.6. As mentioned earlier, this is a proactive phase to ensure that the right participants are selected from a given site for the requested sensing campaign. Next, we discuss the evaluation of the sensory data received at the CrowdPower server, which evaluates our model presented in
Section 3.7, which determines the quality of data received, the participant reputation, and the filtering of the outliers. While the first model considers the capability of the phones to select potential participants that would provide the required sensory data, the second model determines the quality of data after they are received, since we cannot neglect the possibility of malicious or faulty data being sent either intentionally or carelessly by the selected participants. Considering the increasing use of mobile phones, our double-edged approach greatly reduces the server’s data processing effort since a large amount of data would ideally be received for a sensing campaign.
5.1. Evaluation of the Participant Selection Model
To evaluate the performance of our participants selection model presented in
Section 3.6, we conducted extensive Matlab simulations, varying different parameters to study their impact on site quality score, site reliability score, site price, site probability of task satisfaction, and site final selection score. The detailed evaluation results can be found in [
16]. In this section, we provide a summary of some of the simulation results, namely, the impact of the event type, the percentage of malicious participants, and requested quality levels on the sites’ final selection scores.
Table 6 provides an overview of the simulation parameters used in the tests conducted. As shown in the table, the simulation considers realistic settings for crowdsensing, with an area size of 400 square meters, a total population varying from 100 to 200 individuals, with registered participants varying from 50 to 140 data collectors in the area of interest. Six types of events were considered in the simulation: (1) events related to traffic conditions are associated with GPS data; (2) traffic accident events require light, temperature, proximity, GPS, camera, and pulse data; (3) fire events require temperature, ambient temperature, camera, and pulse data; (4) storm events can be described by temperature, light, ambient temperature, relative humidity, camera, and pulse data; (5) a heart attack incident requires camera and pulse data; And (6) a volcanic eruption can be described by light, temperature, ambient temperature, proximity, relative humidity, GPS, and camera data. In this first test, the event type was varied from 1 to 6, while maintaining the other parameters (e.g., total population, participants, budget, required information quality level, country, and percentage of malicious participants) as constant. In the second test, the percentage of malicious participants was varied from 2 to 25% of the total number of participants. In the third test, the required information quality level was varied from 3 to 8.
In the simulation, we considered 21 countries and used the statistical industry data in [
16,
41] to simulate phone manufactures for the considered countries. We also gathered data pertaining to quality of the smartphone sensors. The data were gathered from the testing tools mentioned earlier (Dxomark, SensMark). The scores were normalized as a number out of 10.
Next, we ran various tests to check if our algorithm behaves as designed. We also wanted to evaluate the effect of several data variables on sites’ selection scores. The tests we ran concentrated on assessing the effect of the kind of event on the selection scores of locations. The kinds of events were simulated for the purpose of our test.
Figure 20 shows the results for the selection of locations with respect to several kinds of requested events. In this simulated situation, the AoI was split into sixteen locations. There are potentially two malicious locations that have negative scores. The 10th location (Site10) was chosen for several incidents including volcanic eruption and storm, whereas the 13th location (Site13) was chosen for a traffic incident. Evidently, the kind of incident bore an effect on the locations’ scores of selections.
We report interesting findings. For example, incidents related to traffic led to scores in the scope of 900, whereas events related to fire led to scores in the scope of 400. Furthermore, incidents related to storms led to scores in the range of 300 (the lowest) as it needed 6 sensors (some of which are specialized). As such, the results show that incidents needing specialized or a higher number of sensors lead to lower odds of being fulfilled. Furthermore, locations with more advanced smartphones have better opportunities of being chosen for incidents.
We ran other tests that concentrated on assessing the effect of participants’ malpractice on the scores of the locations’ selection. In these tests, we created various percentages of participants misusing the system.
Figure 21 depicts the selection of the choices regarding several rates of participants misusing the system in the area of interest (AoI). In this situation, AoI was split into four locations. The first location (Site 1) was chosen for the situations where one-tenth and one-fourth of the participants misused the system, while the third location (Site 3) was chosen for the situations with two and five percent of the participants misusing the system. As depicted in the figure, as the rate of misusing the system rose, more locations had participants misusing the system and were removed. For example, with two percent misusing the system, one out of four locations had misusing participants. Furthermore, with five percent, two out of four locations had participants misusing the system, whereas for ten percent and twenty five percent, three of four locations had users who misused the system. This shows that the level of misusing the system effects the chance of fulfilling the requests.
In the following tests, we concentrated on assessing the effect of the needed level of quality on the locations’ selection scores. As such, we created various levels of needed quality.
Figure 22 depicts the results for the location selection concerning the needed levels of quality. The AoI was split into nine locations. The sixth location (Site 6) was chosen when Levels 3 and 4 of quality were needed. On the other hand, the seventh location (Site 7) was chosen when Level 5 quality was needed. However, none of the locations were chosen when Level 8 quality was needed. This test shows that requesting higher quality results in a lower opportunity of finding a selection since the overall score of quality should be the same or more than the needed level of quality.
It is important to mention that the proposed selection approach revolves around the selection of the smallest and most reliable group of participants that can provide the best quality possible for the required sensory data. This helps ensure scalability and minimal latency resulting from the participants’ selection and data collection processes. To illustrate the performance and scalability of the algorithm in different scenarios, four incidents are depicted in
Figure 23.
Figure 23a pertains to a traffic condition monitoring scenario in Sweden. In this scenario, the configuration parameters were as follows: Country = Sweden; Event = Traffic condition monitoring (Event 1); Task time = 10 min; # of participants = 35 participants out of 60 users’ population. The area of interest was divided into 9 sites in that case, and Site 8 was selected for the task, with the lowest price score among the 9 sites (i.e., a score of 3.97), as well as 6 participants, and a site kappa score of 1.0267. The selected site in highlighted with a green square in
Figure 23a.
Figure 23b depicts a fire incident scenario in Germany. In this scenario, the area of interest was divided into 25 sites, 19 of which contained participants. The site selected in this scenario was Site 11 containing 2 participants (highlighted in green), which had an average sensor quality score of 7.76 (the highest sensor quality score out of all sites), a proximity of 0 from the event of interest (i.e., centered at the event of interest), and an average site’s residual battery level of 75%. The total site’s quality score obtained was 0.655238—representing the lowest value and thus the highest site quality levels.
Figure 23c illustrates a traffic accident scenario in India. The area in this scenario encompassed 19 sites with participants and 6 empty sites. Site 18 containing 2 participants was selected in that case, with a site quality score of 1.0568, a residual battery level of 47%, a proximity level of 22.36 m from the event of interest, and a sensor quality score of 4.749. In comparison to the first scenario occurring in Germany, in which the most popular phone brands are the Samsung Galaxy S7, Samsung Galaxy A5, iPhones 6, 6S, and 7—i.e., brands with high variety and high-quality sensors, the second scenario took place in India, with phones containing fewer sensors with lower sensor quality scores (e.g., Lyf Jio F90M, Samsung Galaxy J2, Xiaomi Redmi Note 4, Lyf LF-2403N, Samsung Galaxy J7 Prime). This resulted in 18 out of 19 sites being eliminated from the selection due to the inability to meet the minimum required information quality level—i.e., 4.5 in that case. The only site that was able to meet that requirement was Site 18, with a sensor quality score of 4.749, and thus it was selected despite its low residual battery level and poor overall quality score.
Figure 23d depicts a storm incident in Malaysia. In that scenario, Site 8 containing four participants was selected with a close proximity from the event of interest (10 m), a high residual battery level (of 73.5%), and a sensor quality score exceeding the required level (4.865). Due to the mixed nature of popular phones in Malaysia, 11 out of 18 sites were not selected due to lack of ability to meet information quality requirements.
5.2. Evaluation of the Models for Estimating Data Quality, Participant Reputation, and Filtering Outliers
As mentioned, since we cannot neglect the possibility of malicious or faulty data being sent either intentionally or carelessly by the selected participants, we must determine the quality of data received at the server. For the evaluation of our model presented in
Section 3.7, we simulate a crowdsensing scenario to measure the temperature in an AoI. We used Python libraries such as pandas and numpy, typically used for scientific computing, data analysis, and the seaborn library based on matplotlib for data visualization.
To analyze the quality of sensory data, we consider eight participants sending the temperature measured by their phone sensors to the CrowdPower platform in ten time slots ki. We used synthetic data to evaluate our model and analyze its validity. The data are randomly generated and are shown in
Table 7. The average expected sensory data to be received was assumed to be about 46°, but our data were adjusted so that the data of four random participants were randomly generated between 46° ± 15°. The empty cells indicate that the phones did not send in data, or the data did not reach the server in that time slot.
To preprocess the data sent by each participant, we normalized it by either forward filling or backward filling the data, considering the mean of the distribution in each time slot, and the result is shown in
Table 8. From a visible evaluation of the normalized data in the tables, we see that values of participants four and five are comparatively high, while the values of participants two and seven fluctuate widely. We aim to determine if our model described earlier would calculate the data quality as previously assumed, which would then contribute to calculating the reputation of participants and estimating any possible malicious intents. The Python code snippets, shown previously, describe how our model was implemented for calculating quality and determining the reputations, respectively (
Box 1 and
Box 2).
Box 1. Pseudocode for calculating data quality.
qik = pd.Series([1/n for j in data[‘Participant’]]) # Initiating the quality outcome to the average 1/n
# Convergence of the loop is when two consecutive quality estimation is below a threshold value
while sum(qikold - qik <= threshold) != n:
ck = data[i][np.argmin(((ck - data[i])**2)*qik)] # Recalculating the centroid
dik = ((ck - data[i]) ** 2) # Calculate weighted squared distance between ck and data
lamda = sum(dik) # Sum of total errors
qik = (1/((dik/lamda)+e))/sum((1/((dik/lamda)+e))) # Quality output
qikold = qik
output[i] = qik
Figure 24 depicts the average quality of the temperatures provided by the participants in the sensing campaign. It is evident that our quality measurements can capture the inconsistencies in the data as we predicted. From the graphs, it is clear that the data provided by participants 2, 4, 5, and 7 are definitely of lower quality.
Now, to determine the average reputation of the participants, the constants for the regression function in Equation (13) are, W = 0.5, X = 3, B = 0.5, C = 1, and f = 2, where W and X are the lower and upper asymptotes, B is the growth rate, C is the maximum growth rate, and f is the inflection point. The value of the parameters impacts the presentation of reputation values in
Figure 25; however, the results will still show the variations in participant reputation which depend on the quality of data sent by the participants. The Python code below (
Box 2) includes comments to describe how our model for Algorithm 2 was implemented.
Box 2. Pseudocode for calculating participant reputation.
# Initialize relative quality indices with quality
relqindex = output.copy()
for i in relqindex.columns:
k = relqindex.shape[1]
t = relqindex.columns.get_loc(i)
for j in range(0, relqindex.shape[0]):
if relqindex.loc[j, i] <= 1 / n: # Data quality is below average, Avg defined as 1/number of observations
relqindex.loc[j, i] = ((1 - relqindex.loc[j, i]) ** 2 * (k - t)) * (relqindex.loc[j, i] - (1 / n))
else:
relqindex.loc[j, i] = ((relqindex.loc[j, i]) ** 2 * (k - t)) * (relqindex.loc[j, i] - (1 / n))
relqindex = relqindex.sum(axis=1) # Summing up all the measurement for participants
rpi = 0.5 + 3 / (1 + np.exp(-0.5 * (relqindex - 1))) ** 1 / 2 # Applying logistic regression to arrive at reputations
Figure 25 depicts the reputation of participants, and we see the average reputation drops as the quality of submitted data reduces. Finally, for the classification and filtering of outliers that are potentially malicious participants, we define the fraction threshold u to be 0.5 and assign the distance threshold r to be twice the standard deviation of the distribution. For instance, if u = 0.5 and r = 8, then 0.5 × 8 = 4, i.e., the data are considered outliers if they do not have four other data points close to them.
Figure 26 shows the results of filtering out participants with possible malicious data, and again we see that the model can estimate, classify, and filter the outliers. If we compare the data in
Table 6, and the result of the algorithm to determine outliers shown in
Figure 26, we argue that the data submitted by participants four and five have essentially more possibility of being malicious than the data provided by participants two and seven. Nonetheless, all four participants are classified as outliers.
6. Conclusions
This paper presented CrowdPower, a novel and comprehensive software platform that leverages service computing, smartphone sensors, and mobile application for crowdsensing and reporting real-time incidents in smart cities. A comprehensive description of the end-to-end system with architecture and design highlighted important message sequences and web service interfaces. The implementation was described using the user interface on both the server and client sides. We described our models to benchmark sensor quality, select participants for sensing campaigns, measure the quality of data submitted by sensors, and determine the reputation of participants in sensing campaigns. An approach to filter outliers was also proposed. The empirical evaluations were presented to test the feasibility of our proposed models. The models with equations, algorithms, and Python code of the simulation are provided. The results verified that the model was ideal for determining data quality and measuring participant reputation and intent. The complete CrowdPower system was also successfully tested for functionality.
Currently, CrowdPower allows for data collection from Android-based devices. In the future, we are planning to extend the design to accommodate other operating systems such as iOS. The architecture of CrowdPower, designed based on a component-based pattern, allows for integrating devices belonging to other operating systems. Furthermore, the platform was tested on text and image-based data collected by producers. However, the current system does not support video-based data. In the future, we will investigate ways to assess video data quality. We will possibly integrate machine learning algorithms that can analyze video content. As future work, we also plan to assess security vulnerabilities of CrowdPower as producers share data using their personal mobile devices. Furthermore, we plan to conduct field testing of our solution in large-scale events (e.g., national sports events, adverse weather condition events, and road accidents) to assess the performance of our system in realistic settings.


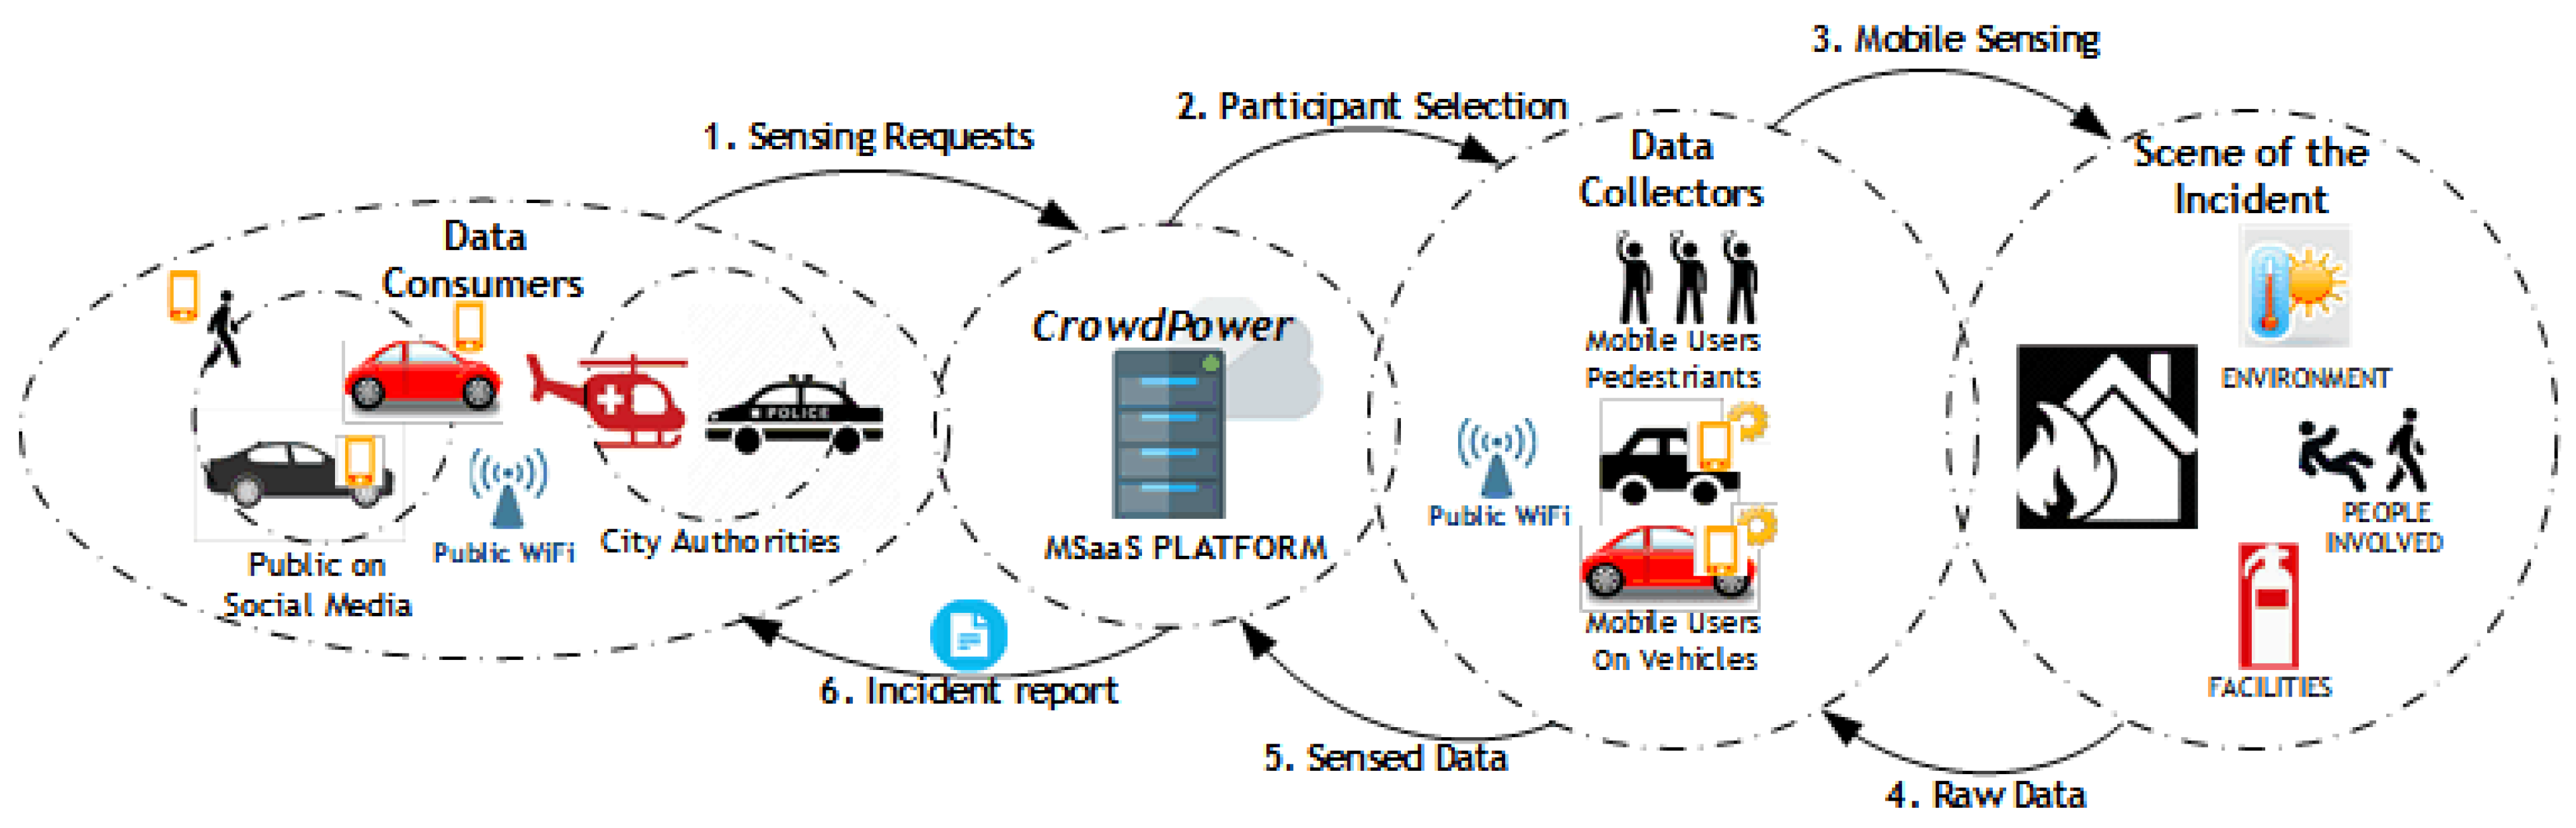


